DOLAP 2015 :: Dimitar Misev, Peter Baumann
Homogenizing Data and Metadata
Retrieval in Scientific Applications
DOLAP 2015, Melbourne, 2015-oct-23
Dimitar Misev, Peter Baumann
Jacobs University | rasdaman GmbH
DOLAP 2015 :: Dimitar Misev, Peter Baumann
Arrays in various domains
Geo
• Environmental sensor data, 1-D
• Satellite / seafloor maps, 2-D
• Geophysics (3-D x/y/z)
• Climate modelling (4-D, x/y/z/t)
Life science
• Gene expression simulation (3-D)
• Human brain imaging (3-D / 4-D)
Other
• Computational Fluid Dynamics (3-D)
• Astrophysics (4-D), Statistics (n-D)

DOLAP 2015 :: Dimitar Misev, Peter Baumann
Array DBMSs
first appearance in literature (not first implementation)
DOLAP 2015 :: Dimitar Misev, Peter Baumann
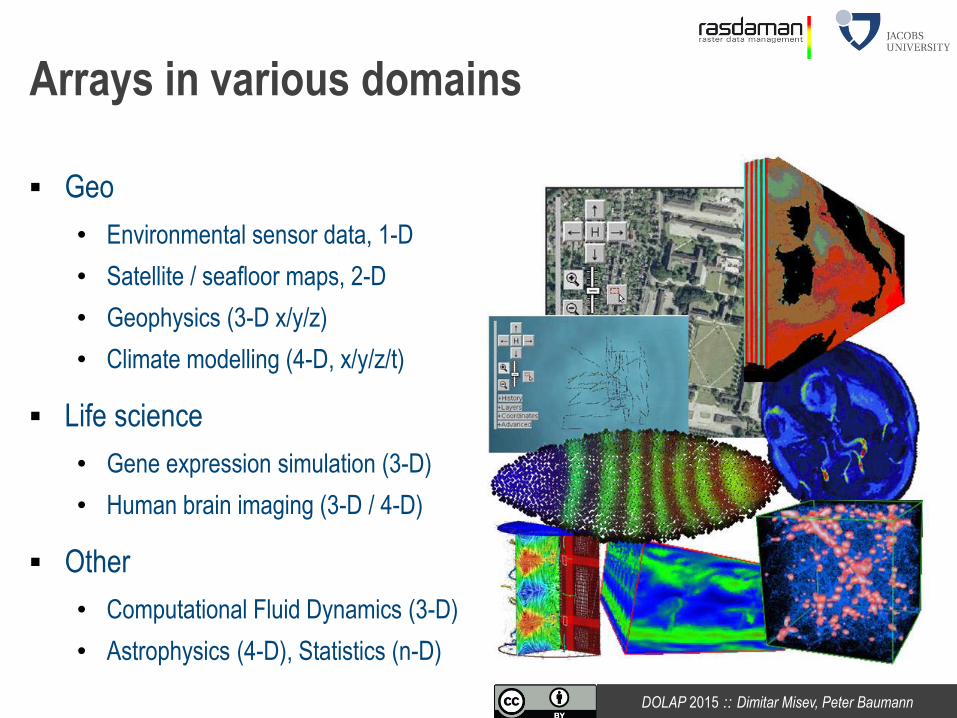
Motivation
Array databases dedicated to array data
Array data always comes with metadata • tabular, xml, json, ...
Result: non-standard, wildly varying data management solutions
Array SQL = ISO 9075 Part 15: SQL/MDA fills this gap • Integrate array analytics into ISO SQL

DOLAP 2015 :: Dimitar Misev, Peter Baumann
Data model
Array • An ordered collection of elements of the same type
at coordinates within the associated extent
Extent • An ordered list of axes; number of
axes = MD-dimension of the MD-array
Axis • ( name, lower limit, upper limit )
• integer coordinates
MD-extent
MD-axis
4
element at
coordinate
[3,2,0]
y
x
z
0 4

DOLAP 2015 :: Dimitar Misev, Peter Baumann
Data type definition
MDARRAY column type • ET MDARRAY MD-extent
Examples • TINYINT MDARRAY [ x(0:100), y(-100,0), z(1:3) ]
• INTEGER MDARRAY [ x(0:100), y(-100,*), z ]
DOLAP 2015 :: Dimitar Misev, Peter Baumann
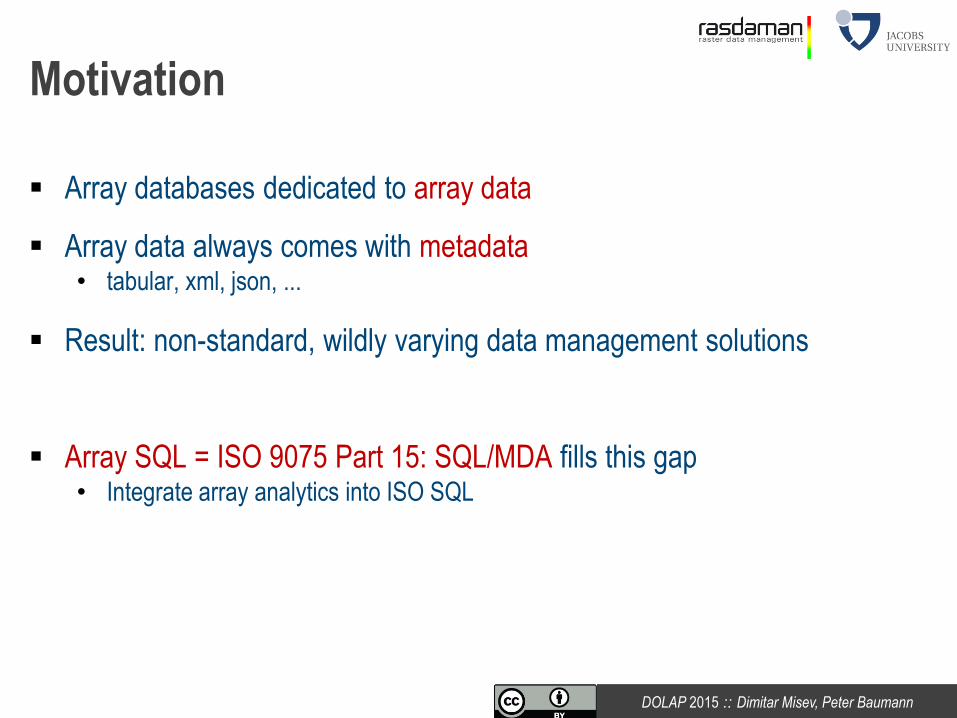
Array Probing
y
x
DIMENSION(a) = 2
CARD(a) = 30
EXTENT(a) = [x(0:4), y(0:5)]
LO(a, x) = LO(a, 1) = 0
HI(a, y) = HI(a, 2) = 5
AXIS_NAME(a, 1) = x
AXIS_INDEX(a, y) = 2
AXIS_NAMES(a) = [x, y]
(0,0)
a

DOLAP 2015 :: Dimitar Misev, Peter Baumann
Select part of an array
Examples: a) a[ x(6:8), y(3:7) ] = a[ 6:8, 3:7 ]
b) a[ y(5) ] = a[ *:*, 5 ]
c) a[ x(4:8), z(4:8) ] = a[ 4:8, *:*, 4:8 ]
d) a[ x(8), z(4), y(*:*) ] = a[ 8, *:*, 4 ]
Subsetting
a) b)
c) d)
DOLAP 2015 :: Dimitar Misev, Peter Baumann
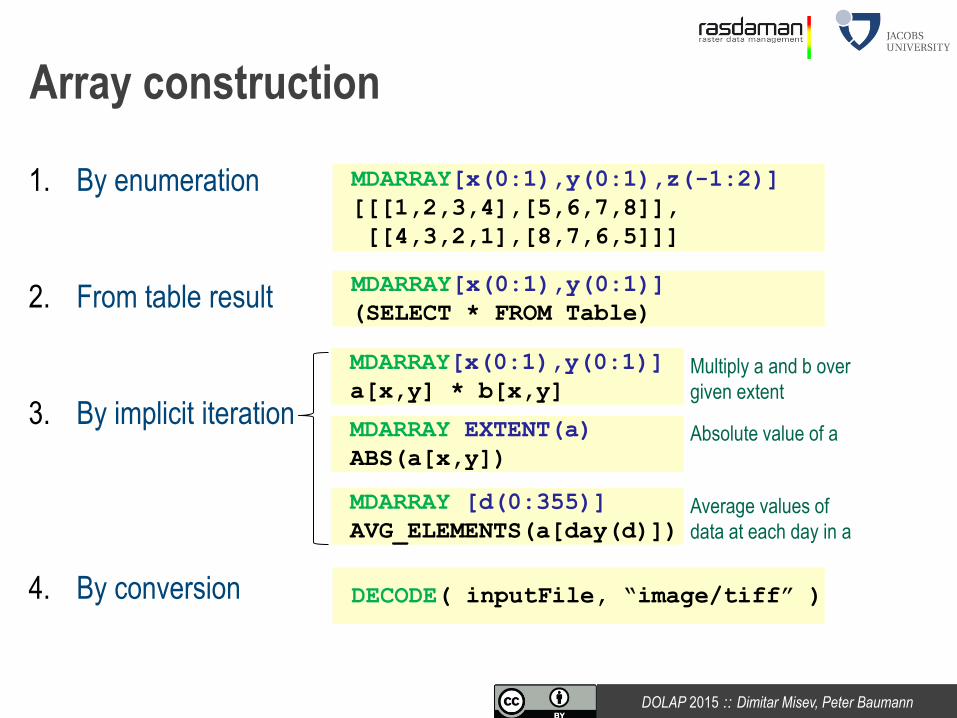
1. By enumeration
2. From table result
3. By implicit iteration
4. By conversion
Array construction
MDARRAY[x(0:1),y(0:1),z(-1:2)]
[[[1,2,3,4],[5,6,7,8]],
[[4,3,2,1],[8,7,6,5]]]
MDARRAY[x(0:1),y(0:1)]
(SELECT * FROM Table)
MDARRAY[x(0:1),y(0:1)]
a[x,y] * b[x,y]
DECODE( inputFile, “image/tiff” )
Multiply a and b over
given extent
MDARRAY EXTENT(a)
ABS(a[x,y]) Absolute value of a
MDARRAY [d(0:355)]
AVG_ELEMENTS(a[day(d)]) Average values of
data at each day in a

DOLAP 2015 :: Dimitar Misev, Peter Baumann
Array aggregation
MD-array → scalar summarization
General aggregation expression • “Find the minimum of the values in a”:
Aggregation operation: binary, commutative and associative function • +, *, min, max, and, or
Shorthand aggregation functions • sum, average, min/max, count elements that are true or not null,
check if all or some of the elements are true
AGGREGATE min
OVER [x(1:1000),y(0:1000)]
WHERE a[x,y] IS NOT NULL
USING a[x,y]

DOLAP 2015 :: Dimitar Misev, Peter Baumann
Derived Operators
Extending MD-extent • EXTEND(a, [ -5:10, -5:10 ])
Shifting coordinates • SHIFT(a, [10, 10])
Scaling • SCALE(a, [0:10,0:10]) →
Overlaying • COALESCE(a, b) COALESCE( , ) =

DOLAP 2015 :: Dimitar Misev, Peter Baumann
Derived Operators contd.
Induced operations • „For every cell type allowed in arrays,
all operations on that type shall be provided on arrays, too“
Essentially array constructor shorthands, e.g.
a + b, cos(a), a < 2, …
a + b = MDARRAY EXTENT(a)
VALUES a[x,y] + b[x,y]
cos(a) = MDARRAY EXTENT(a)
VALUES COS(a[x,y])
…

DOLAP 2015 :: Dimitar Misev, Peter Baumann
Normalized Difference Vegetation Index
SELECT ENCODE(
((scene.nir - scene.vis) /
(scene.nir + scene.vis) > 0.2) * 255
, "image/tiff")
FROM NIR
Ex: NDVI
[standards.rasdaman.com]

DOLAP 2015 :: Dimitar Misev, Peter Baumann
histogram of first band, in CSV, of Landsat scenes acquired in June 1990
SELECT ENCODE(
MDARRAY [h(0:255)]
VALUES count_cells( scene.band1 = h )
, "csv")
FROM LandsatScenes
WHERE acquired BETWEEN
“1990-06-01” AND
“1990-06-30”
Ex: Histogram
[rasdaman]

DOLAP 2015 :: Dimitar Misev, Peter Baumann
ASQLDB = rasdaman1 + HSQLDB2 https://github.com/misev/asqldb
Mediator optimization • push array processing to ADBMS
• minimize number of sub-queries
Query optimization example • ”high precipitation months in Germany”
1. http://rasdaman.org
2. http://hsqldb.org/
Implementation
SELECT t.month
FROM TRMM AS t, CountryBorders AS c
WHERE AVG(rainfall[x((c.minx - t.minx) * res :
(c.maxx - t.minx) * res),
y((c.miny - t.miny) * res :
(c.maxy - t.miny) * res)])
> $threshold AND c.country = ’Germany’

DOLAP 2015 :: Dimitar Misev, Peter Baumann
Preliminary evaluation in comparison to MonetDB-SciQL • Query 1: “how close simulated data are to the experimental data (a cost function)“
Implementation
SELECT ABS(SUM(POWER(z.v - AVG(z.v), 2)) / CARD(z.v) –
SUM(POWER(d.v - AVG(d.v), 2)) / (CARD(d.v) - 1))
FROM Dynamic AS d,Zygotic AS z

DOLAP 2015 :: Dimitar Misev, Peter Baumann
Preliminary evaluation in comparison to MonetDB-SciQL • Query 2: „NDVI change in successive years“
Implementation
SELECT AVG((a.nir - a.red) / (a.nir + a.red)) –
AVG((b.nir - b.red) / (b.nir + b.red))
FROM Landsat09, Landsat10

DOLAP 2015 :: Dimitar Misev, Peter Baumann
Conclusion
n-D Arrays major datatype in Big Data • Massive spatio-temporal sensor, image, simulation, statistics data
Currently databases bypassed, but can contribute substantially
ISO SQL/MDA: important step forward in this effort • Flexibility + scalability + information integration
Recommended