Brigham Young University Brigham Young University
BYU ScholarsArchive BYU ScholarsArchive
Theses and Dissertations
2012-07-12
Homogeneous Viologens for Use as Catalysts in Direct Homogeneous Viologens for Use as Catalysts in Direct
Carbohydrate Fuel Cells Carbohydrate Fuel Cells
Dane C. Hansen Brigham Young University - Provo
Follow this and additional works at: https://scholarsarchive.byu.edu/etd
Part of the Chemical Engineering Commons
BYU ScholarsArchive Citation BYU ScholarsArchive Citation Hansen, Dane C., "Homogeneous Viologens for Use as Catalysts in Direct Carbohydrate Fuel Cells" (2012). Theses and Dissertations. 3647. https://scholarsarchive.byu.edu/etd/3647
This Dissertation is brought to you for free and open access by BYU ScholarsArchive. It has been accepted for inclusion in Theses and Dissertations by an authorized administrator of BYU ScholarsArchive. For more information, please contact [email protected], [email protected].
Homogeneous Viologens for Use as Catalysts
in Direct Carbohydrate Fuel Cells
Dane Cameron Hansen
A dissertation submitted to the faculty of Brigham Young University
in partial fulfillment of the requirements for the degree of
Doctor of Philosophy
Dean R. Wheeler, Chair Gerald D. Watt William G. Pitt
W. Vincent Wilding Randy S. Lewis
Department of Chemical Engineering
Brigham Young University
August 2012
Copyright © 2012 Dane Cameron Hansen
All Rights Reserved
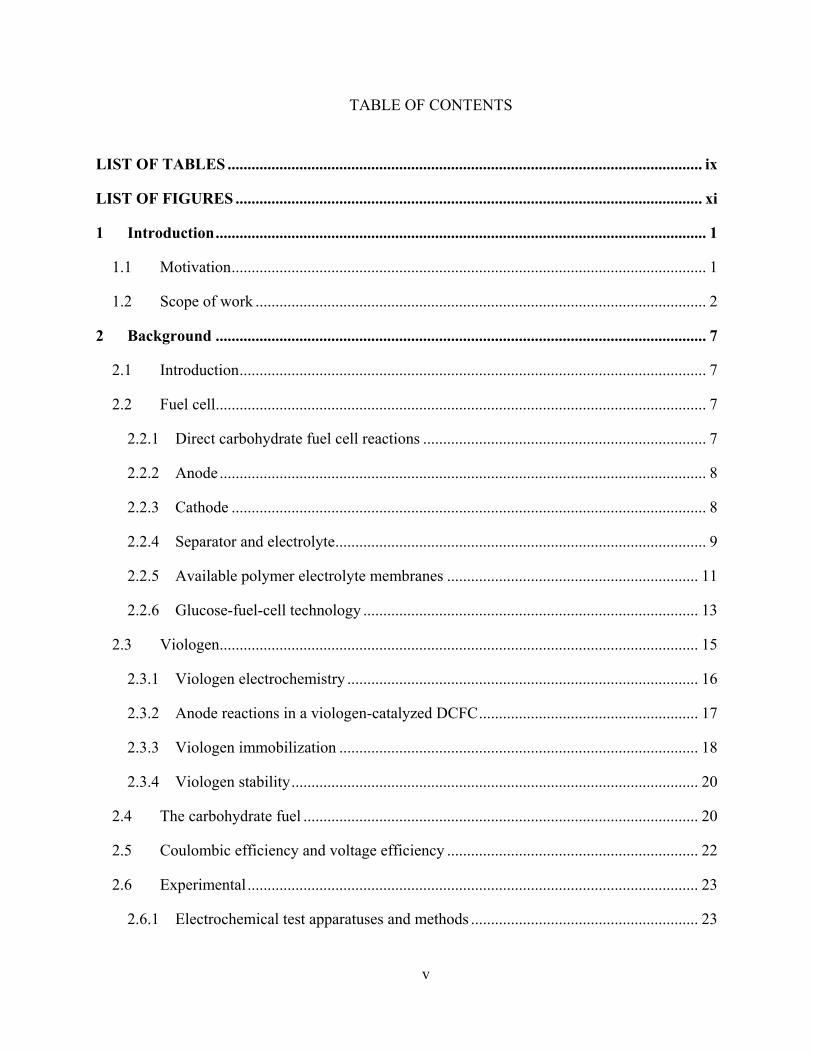
ABSTRACT
Homogeneous Viologens for Use as Catalysts in Direct Carbohydrate Fuel Cells
Dane Cameron Hansen
Department of Chemical Engineering, BYU Doctor of Philosophy
Deriving electrical energy from glucose and other carbohydrates under mild conditions is
an important research objective because these biomolecules are abundant, renewable, and can provide 12 to 24 electrons per molecule, yielding substantial electrical power. It was previously observed that disubstituted viologens, salts of N,N’-disubstituted 4,4’-bipyridine, are able to oxidize glucose under alkaline conditions. Building on that initial result, the objective of this work was to understand and quantify the effectiveness and utility of viologens as catalysts for use in direct carbohydrate fuel cells.
The extent that viologens oxidize carbohydrates, the conditions under which that oxidation occurs, and the mechanism for the oxidation were examined using oxygen-uptake and other methods. Viologens were found to catalytically oxidize carbohydrates extensively in alkaline solution. Viologens were also found to react with the enediol form of the carbohydrate, initiating carbohydrate oxidation with subsequent reduction of the viologen. If the viologen/carbohydrate ratio is low, electron transfer from the carbohydrate to the viologen becomes limiting and the carbohydrates undergoing oxidation rearrange into unreactive intermediates such as carboxylic acids and alcohols. At high catalyst ratios, excess viologen more rapidly oxidizes the carbohydrate and minimizes formation of unreactive intermediates. We also found that viologen polymers were more efficient than an equivalent concentration of monomers, suggesting that the higher localized concentration in polymeric viologen acts to efficiently oxidize carbohydrates and simulates high viologen/carbohydrate ratios.
Monoalkyl viologens, aminoviologens, indigo carmine, and methylene blue were investigated by the method of cyclic voltammetry to inform their use as catalysts in the oxidation of carbohydrates. Redox potentials, diffusion coefficients, and heterogeneous electron-transfer rate constants were determined. Stability in alkaline solution and aqueous solubility were also examined in a semi-quantitative fashion. A comparison between the catalysts was made and viologens were found to be superior based on the examined parameters.
The catalytic oxidation of carbohydrates by viologen was also examined using a fuel cell-like device. For the conditions in which a test cell was operated, oxidation efficiencies of up to 33% were observed, compared to previously reported values from about 2.5% to 80%. Anode polarization curves were obtained and used to determine the behavior of the viologen-controlled anode as a function of pH, viologen and carbohydrate concentration, and carbohydrate identity. pH was found to have a stronger effect on the performance at the anode for carbohydrates with a higher number of carbons than those with a lower number. Keywords: viologen, catalysis, carbohydrate oxidation, mechanism, fuel cell, voltammetry

ACKNOWLEDGMENTS
To my wife, the love of my life. To my children, my joy (most of the time). To my
parents; I’m grateful for your love and support all of these years.
Thank you Dr. Wheeler, for guiding me. Thank you Dr. Watt, for your generosity.
I’m grateful for the many friends I’ve made as a student. Life is much better when you
have friends; to teach and to learn from.
v
TABLE OF CONTENTS
LIST OF TABLES ....................................................................................................................... ix
LIST OF FIGURES ..................................................................................................................... xi
1 Introduction ........................................................................................................................... 1
Motivation ....................................................................................................................... 1 1.1
Scope of work ................................................................................................................. 2 1.2
2 Background ........................................................................................................................... 7
Introduction ..................................................................................................................... 7 2.1
Fuel cell ........................................................................................................................... 7 2.2
2.2.1 Direct carbohydrate fuel cell reactions ....................................................................... 7
2.2.2 Anode .......................................................................................................................... 8
2.2.3 Cathode ....................................................................................................................... 8
2.2.4 Separator and electrolyte ............................................................................................. 9
2.2.5 Available polymer electrolyte membranes ............................................................... 11
2.2.6 Glucose-fuel-cell technology .................................................................................... 13
Viologen ........................................................................................................................ 15 2.3
2.3.1 Viologen electrochemistry ........................................................................................ 16
2.3.2 Anode reactions in a viologen-catalyzed DCFC ....................................................... 17
2.3.3 Viologen immobilization .......................................................................................... 18
2.3.4 Viologen stability ...................................................................................................... 20
The carbohydrate fuel ................................................................................................... 20 2.4
Coulombic efficiency and voltage efficiency ............................................................... 22 2.5
Experimental ................................................................................................................. 23 2.6
2.6.1 Electrochemical test apparatuses and methods ......................................................... 23

vi
2.6.2 Working, reference, and counter electrodes.............................................................. 24
2.6.3 Advice for beginning experimentalists ..................................................................... 25
Summary ....................................................................................................................... 27 2.7
3 Initial investigation into the utility of viologens for use as catalysts in direct carbohydrate fuel cells ........................................................................................................ 29
Introduction ................................................................................................................... 29 3.1
Experimental ................................................................................................................. 31 3.2
3.2.1 Materials ................................................................................................................... 31
3.2.2 Synthesis of viologens .............................................................................................. 31
3.2.3 Methods ..................................................................................................................... 32
Results ........................................................................................................................... 34 3.3
3.3.1 Sealed-vial results ..................................................................................................... 34
3.3.2 Sealed-vial, viologen/carbohydrate ratio effect ........................................................ 37
3.3.3 pH dependence .......................................................................................................... 40
3.3.4 Pressure-cell results .................................................................................................. 41
3.3.5 Product identification from carbohydrate oxidation ................................................. 42
3.3.6 Viologen stability ...................................................................................................... 45
3.3.7 Electrochemical carbohydrate oxidation ................................................................... 46
Discussion ..................................................................................................................... 48 3.4
Conclusion .................................................................................................................... 52 3.5
4 Mechanistic insights for the viologen-catalyzed oxidation of carbohydrates ................ 53
Introduction ................................................................................................................... 53 4.1
Materials and methods .................................................................................................. 54 4.2
4.2.1 Methods ..................................................................................................................... 54
4.2.2 Materials ................................................................................................................... 54
Results ........................................................................................................................... 55 4.3
vii
4.3.1 Viologen polymers .................................................................................................... 55
4.3.2 Enhanced efficiency at high viologen/carbohydrate ratios ....................................... 59
4.3.3 Model compounds ..................................................................................................... 60
4.3.4 Anaerobic vs. aerobic reactions ................................................................................ 64
Discussion ..................................................................................................................... 66 4.4
4.4.1 Mechanistic considerations ....................................................................................... 67
Conclusions ................................................................................................................... 71 4.5
5 Cyclic voltammetry investigation of viologens, indigo carmine, and methylene blue for use as catalysts in direct carbohydrate fuel cells........................................................ 73
Introduction ................................................................................................................... 73 5.1
Experimental methods .................................................................................................. 75 5.2
5.2.1 Materials ................................................................................................................... 75
5.2.2 Synthesis of mono- and aminoviologens .................................................................. 76
5.2.3 Apparatuses and procedures ..................................................................................... 77
5.2.4 Test Solutions ............................................................................................................ 79
Results and discussion .................................................................................................. 82 5.3
5.3.1 Half-wave potentials ................................................................................................. 82
5.3.2 Diffusion coefficients ................................................................................................ 85
5.3.3 Heterogeneous electron-transfer rate constants ........................................................ 87
5.3.4 Examination of voltammograms ............................................................................... 90
5.3.5 Comparison of the catalysts ...................................................................................... 95
Conclusions ................................................................................................................. 102 5.4
6 Coulombic efficiency and anode overpotential for the oxidation of carbohydrates by methyl viologen ............................................................................................................ 105
Introduction ................................................................................................................. 105 6.1
Experimental ............................................................................................................... 108 6.2

viii
6.2.1 Materials ................................................................................................................. 108
6.2.2 Fuel cell ................................................................................................................... 108
6.2.3 Reference electrode ................................................................................................. 110
Results and discussion ................................................................................................ 111 6.3
6.3.1 Coulombic-efficiency control experiments ............................................................. 111
6.3.2 Coulombic efficiency .............................................................................................. 114
6.3.3 Closed-circuit current curves .................................................................................. 118
6.3.4 Cell polarization ...................................................................................................... 120
6.3.5 Anode polarization .................................................................................................. 122
6.3.6 Anode polarization: comparison between MV and monomethyl viologen ............ 128
Conclusion .................................................................................................................. 129 6.4
7 Summary and recommendations for future work ......................................................... 133
Summary ..................................................................................................................... 133 7.1
Future work ................................................................................................................. 135 7.2
Bibliography .............................................................................................................................. 139
Appendix A. Ion exchange device for removing inorganic salts from test solutions ......... 151

ix
LIST OF TABLES
Table 3.1 Coulombic efficiencies (%) for the oxidation of the named species by the
named viologen. .........................................................................................................35
Table 3.2 Effect of pH and viologen/carbohydrate ratio on the coulombic efficiency of viologen-catalyzed carbohydrate oxidation by O2. ....................................................39
Table 4.1 Coulombic efficiency (%) of carbohydrate oxidation conducted by polymeric viologens and MV. .....................................................................................................56
Table 5.1 Abbreviations for the viologens referred to in this report, their common name as used in the report, their level of substitution, and the anion or anions of the viologen. ...............................................................................................................80
Table 5.2 E1/2 values.. ...........................................................................................................83
Table 5.3 Diffusion coefficients (D) in ACN, DMSO, and H2O solvents. ...........................86
Table 5.4 Heterogeneous electron-transfer rate constants (ket) and ∆Ep values in ACN, DMSO, and H2O. .......................................................................................................89
Table 5.5 Redox potentials vs. SHE in hypothetical DCFCs at pH 12. ................................97
Table 6.1 Control-test conditions and results. ......................................................................112
Table 6.2 Coulombic-efficiency results. ...............................................................................115
xi
LIST OF FIGURES
Figure 2.1 The overall redox process occurring in an idealized alkaline direct
carbohydrate fuel cell. ................................................................................................9
Figure 2.2 Representative structures for molecules discussed here. .....................................15
Figure 3.1 Dihydroxy acetone (DHA) and enediol form. .....................................................36
Figure 3.2 The efficiency of glucose oxidation by O2 using MV as catalyst .......................38
Figure 3.3 Pressure decrease (O2-uptake) for the reaction of glucose with MV ..................41
Figure 3.4 13C-NMR spectra of the products of the oxidation of glucose and glyceraldehyde by viologen .......................................................................................43
Figure 3.5 Coulometric oxidation of reduced MV and MMV formed from viologen- catalyzed oxidation of DHA at pH 11........................................................................47
Figure 4.1 Viologen polymers. .............................................................................................56
Figure 4.2 Glyceraldehyde oxidation by oxygen catalyzed by polymer 1. ..........................57
Figure 4.3 Species distribution from the MV-catalyzed oxidation of 13C-labeled glucose determined by 13C NMR. ...........................................................................................60
Figure 4.4 The change of pressure for the EV-catalyzed oxidation of glycoaldehyde. ........62
Figure 4.5 MV-catalyzed, controlled potential oxidation of DHA, glyceraldehyde and glycoaldehyde. ...........................................................................................................65
Figure 4.6 Schematic of the proposed mechanism for the oxidation of glucose catalyzed by viologen.................................................................................................................69
Figure 5.1 Images of representative viologens discussed in this document. ........................80
Figure 5.2 Cyclic voltammograms of EV, MMV, MEV, MPV, and MBV in ACN. ...........91
Figure 5.3 Cyclic voltammograms of EV, MMV, MAV, and APV in DMSO. ...................92
Figure 5.4 Cyclic voltammograms of IC and MB in DMSO. ...............................................93
Figure 5.5 Cyclic voltammograms of MV, MB, and IC in H2O. ..........................................95
Figure 5.6 Pourbaix diagram for carbohydrate redox system, potentials given are vs. SHE. Included are the redox potentials of four of the catalysts examined in this chapter. .......................................................................................................................96

xii
Figure 6.1 Schematic detailing the construction of the preliminary fuel cell. ......................109
Figure 6.2 Representative structures for the carbohydrates, intermediates, and potential end products discussed in text....................................................................................111
Figure 6.3 Plot of the current generated at a closed circuit potential for the control experiments of MV only and fructose only in 1 M KOH and by the oxidation of fructose at different ratios of MV to fructose in the anolyte.. ....................................119
Figure 6.4 Pseudo-steady cell polarization curves for the MV-carbohydrate system under varying conditions. ...........................................................................................121
Figure 6.5 Pseudo-steady anodic polarization curves under varying conditions. .................123
Figure 6.6 The constituents of overpotential plotted together and separately. .....................124
Figure 6.7 Anode polarization curves for 46 mM MMV (with 0.75% MV) and 0.46 MV. .129

1
1 INTRODUCTION
Motivation 1.1
Concern over fossil fuel depletion, anthropogenic climate change, and complex
geopolitical energy distribution problems has led to the important objective of utilizing
biorenewable energy sources to supplement the use of fossil fuels. Carbohydrates are abundant,
high-energy biomolecules whose stored chemical energy is released through complex enzymatic
cycles to meet the energy requirements of diverse living organisms on earth [1]. The
convenience, availability, and high energy content of glucose, carbohydrates in general, and
certain related molecules suggest they can be used to directly produce electricity [2-5].
Although the possibility of directly producing electricity has been investigated for the last
half century [6], little progress using carbohydrates as a useful source for electrical power has
been made. Two major types of fuel cells are currently being evaluated for the production of
electricity from carbohydrates: biologically derived (enzymatic and microbial) and abiotic using
inorganic catalysts such as noble metals and activated carbon. Prior to this work, an avenue that
had received relatively little attention was the use of electro-active organic dye molecules as
catalysts.
The initial observation that methyl viologen is reduced by glucose under basic conditions
was reported by Yu and Wolin [7], who used the resulting reduced methyl viologen as a protein
reductant. Gerald Watt at BYU subsequently recognized that this reaction could potentially also
2
be used to produce useful electricity from carbohydrates [8]. Methyl viologen is a disubstituted
viologen, which is a salt of N,N’-disubstituted-4,4’-bipyridine. Disubstituted viologens have
been heavily studied for a number of applications [9], but never directly for use as a catalyst for
the oxidation of carbohydrates to produce electrical energy. Though some information
applicable to this use is available [9], other questions needed to be answered before viologen
could be used effectively as a catalyst for the oxidation of carbohydrates.
Scope of work 1.2
The primary goal of this work was to answer questions about the effectiveness and utility
of viologen as a catalyst for use in direct carbohydrate fuel cells (DCFCs). Chapter 2 provides
background information so that the answers to those questions may be appreciated. Included in
Chapter 2 are brief summaries of fuel cell basics, the basics of electrochemical experimental
techniques and test apparatuses, viologen and DCFCs in the literature, and a discussion of
carbohydrates as a fuel source.
With limited information on the oxidation of carbohydrates by viologen available in the
literature, and to gain some understanding of the reaction, a number of basic questions needed to
be answered. The work reported in Chapter 3, based on Refs. [8] and [10], was completed to
answer the following questions. Other than glucose, are other carbohydrates and chemical
species oxidized by viologen? Do other types of viologen, besides methyl viologen, also
catalytically oxidize glucose and other molecules? At what efficiency are the electrons available
in the oxidized species obtained? Which factors in the oxidation are most important in affecting
that efficiency? Is there a specific part of the carbohydrate molecule that is oxidized
preferentially by the viologen? What can be learned about the oxidation by examining the
3
products of the oxidation? What is the behavior of the oxidation as the oxidation proceeds in
time, and what can be learned from that behavior?
The research presented in Chapter 3 was carried out using a variety of tools, some
standard, and one created specifically to test the large number of variables required. Reduced
viologen is readily oxidized by oxygen and two methods made use of oxygen consumption to
answer the questions posed above. One method was useful for testing the large number of
variables and the other was useful for real time measurements. Products of the reaction were
identified using NMR and mass spectrometry.
From the data gathered for Chapter 3, a hypothesis on the mechanism by which the
viologen catalyzes the oxidation of carbohydrates was formulated. Briefly, the hypothesis was
that the viologen oxidizes the enediol form of the carbohydrate and that the
viologen/carbohydrate ratio affects the efficiency with which the carbohydrate is oxidized due to
the formation of inactive intermediates at relatively low ratios. It was also hypothesized that
viologen polymers would be more efficient than an equivalent concentration of monomers due to
higher localized concentration simulating high viologen/carbohydrate ratios. This work was
completed using the same suite of experiments used to get the data presented in Chapter 3. This
work is reported in Chapter 4 and is based on an article published in the journal Renewable
Energy in 2011 [10].
During the course of experimentation, it was found that a class of viologens,
monosubstituted viologens or salts of N-substitited-4,4’-bipyridine, also appeared to be
catalytically active in the oxidation of carbohydrates. Monosubstituted viologens have received
significantly less attention in the literature than disubstituted viologens such as methyl viologen.
Based on the monosubstituted-viologen results as reported in Chapter 3, experiments were

4
completed to answer the following research questions. What are the redox potentials of
representative monosubstituted viologens? Redox potential is an important factor in the
efficiency at which the energy contained in the fuel molecule is obtained. What is the effect of
substituent length on redox potential of the monosubstituted viologen? Substituent length has
important implications for the immobilization of viologen at an electrode, which is the focus of
current and future work by our group in the creation of a practical fuel cell. What are the
heterogeneous electron-transfer rate constants for representative monosubstituted viologens?
These rate constants affect the current produced by the cell and the ratio of viologen present in
the oxidized and reduced forms. This ratio has important implications for the mechanism by
which the carbohydrate is oxidized by the viologen, as discussed in Chapter 4 of this document.
These same questions were asked for two other potential organic catalysts, indigo carmine and
methylene blue, and a comparison between all the potential catalysts is made based on the
examined parameters. This work was completed using a standard electrochemical method
known as cyclic voltammetry. This work is reported in Chapter 5 and is based on a publication
under review for publication in the Journal of the Electrochemical Society (JES) [11].
After the publication by our group of Ref. [8], in 2009, another research group based at
the University of Hawaii, published a paper [12], also in 2009, and also reporting estimates of
the efficiency at which viologen catalyzes the oxidation of carbohydrates. There is a wide
variation between the efficiency values reported in the two groups’ publications. Accurate
efficiencies are important because the energy density, and thus utility, of the carbohydrate fuel
relies directly on the extent to which the fuel can be oxidized. A hypothesis was generated that
the variation was based, in part, on the different test conditions prevailing in the two
publications. The hypothesis was tested using a specially constructed fuel cell-like device

5
connected to a potentiostat. Additionally, to gain a better understanding of how a viologen-
controlled anode performs under various conditions, the same cell was used to determine what
effect pH, viologen and carbohydrate concentration, and carbohydrate identity have on the
performance at the viologen-controlled anode. This work is presented in Chapter 6 and is based
on a publication under review for publication in JES [13].
Summary, conclusions, and recommendations for future work are presented in Chapter 7.
7
2 BACKGROUND
Introduction 2.1
To understand the research presented in this dissertation it is helpful to have some
understanding of fuel cell basics, electrochemical experimental techniques, and test apparatuses.
Also included here are brief summaries of viologen and direct carbohydrate fuel cells (DCFCs)
in the literature, and a discussion of carbohydrates as a fuel.
Fuel cell 2.2
Fuel cells, like all electrochemical cells, are constructed [14] with an anode and a
cathode, spatially separated and in electrical contact with an electrolyte. In an operating fuel
cell, the fuel is electro-oxidized at the anode, which liberates electrons. The liberated electrons
then flow through an external circuit, where they are used to do useful work, and delivered to the
cathode. At the cathode, the electrons reduce the terminal electron acceptor, which is usually
oxygen. The driving force for the flow of electrons is the difference in the electrochemical
potential of the anode and cathode redox pairs.
2.2.1 Direct carbohydrate fuel cell reactions
A representation of the reactions occurring in a generic alkaline DCFC with glucose as
fuel is shown in Equations 2.1 through 2.3 [8].
8
Anode: C6H12O6 + 36 OH- = 6 CO32- + 24 H2O + 24 e- (2.1)
Cathode: 6 O2 + 12 H2O + 24 e- = 24 OH- (2.2)
Overall: C6H12O6 + 12 OH- + 6 O2 = 6 CO32- + 12 H2O (2.3)
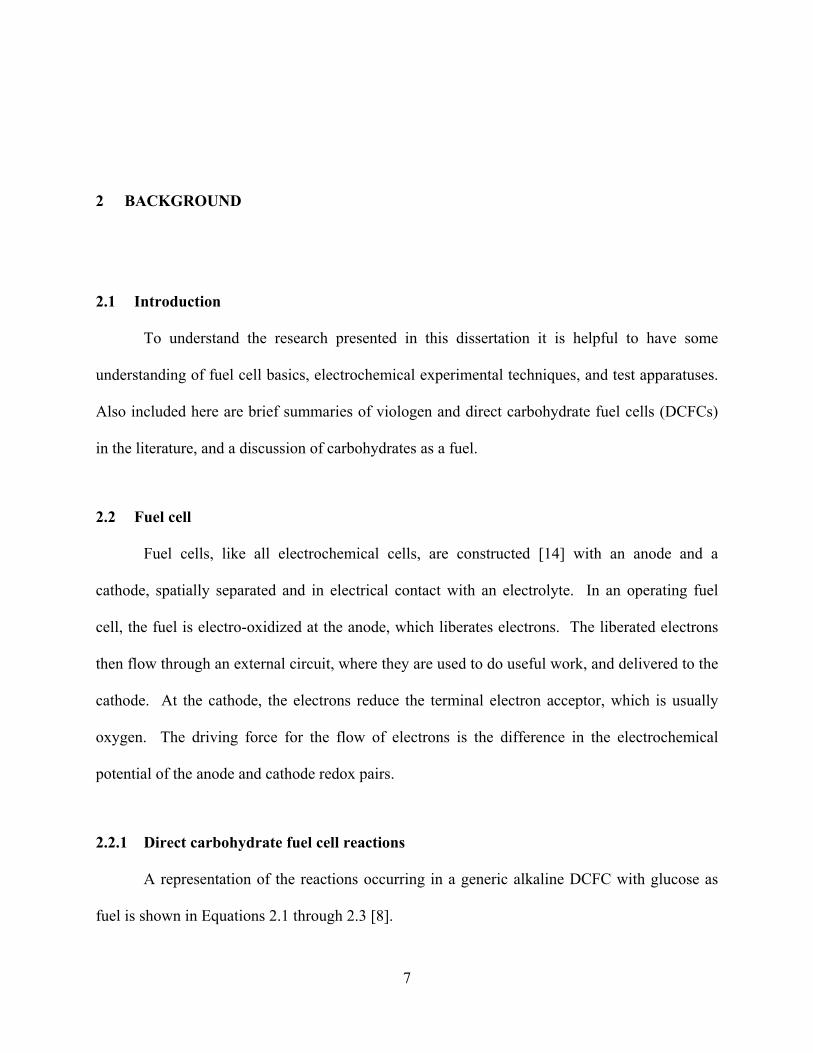
An idealized schematic of the overall redox process is shown in Figure 2.1. The anode reaction
is given by Equation 2.1, the reaction occurring at the cathode by Equation 2.2, and an overall
reaction by Equation 2.3. At the anode, glucose and OH- react to produce 24 e-. The electrons
travel from the anode through an external circuit and are delivered to the cathode where they are
used by oxygen and water to form OH-. The OH- then travels through the electrolyte to the anode
where it will be used in the oxidation of the carbohydrates. Equations 2.1 and 2.2 combine to
yield Equation 2.3, which is the overall equation representing the reaction in the alkaline DCFC
where glucose is oxidized to carbonate and water [6].
2.2.2 Anode
In an operating fuel cell, the anode is where the fuel is oxidized. In an alkaline DCFC, to
produce useful currents, a catalyst is required to increase the rate of the oxidation of the
carbohydrate fuel [6]. In alkaline conditions, precious and transition metals have been used as
catalysts but, to our knowledge, are only marginally effective. As presented here, viologens
appear to be more effective as catalysts.
2.2.3 Cathode
To increase the rate of reduction of oxygen at the cathode in basic conditions, a catalyst is
also required, which is commonly a non-precious metal. This is advantageous compared to the
reduction of oxygen in acidic conditions, under which other types of fuel cells operate, where
9
precious-metal catalysts are widely employed [15, 16]. Cathode material that functions in
alkaline condition, like Electric Fuel’s E-5 cobalt-based catalyzed-carbon cathode [17], is
commercially available. The E-5 cathode is the cathode material that was used to obtain the
results reported in Chapter 6.
Figure 2.1 The overall redox process occurring in an idealized alkaline direct carbohydrate fuel cell.
2.2.4 Separator and electrolyte
In an electrochemical cell the separator region blocks the free flow of electrons and
shuttles the current, in the form of ions, from one electrode to the other. In some cases the
separator is a porous film filled with electrolyte. In other cases a polymer electrolyte membrane
(PEM) serves as both separator and electrolyte [18] (the acronym PEM is also used as shorthand
for proton exchange membrane, and the terms are sometimes used interchangeably). An

10
electrolyte is a substance containing free ions, which allows the substance to be electrically
conductive.
PEMs additionally help reduce reactant crossover [19]. If the reactants cross over they
can possibly react on the improper electrode, causing a mixed potential. This mixed potential
reduces the useful potential produced by the cell and lowers fuel efficiency.
Even with a PEM, crossover can be a source of mixed potential, as with direct methanol
fuel cells (DMFCs) [20]. One major source of crossover in operating fuel cells, including cells
with a PEM as separator/electrolyte, is caused by a phenomenon known as electro-osmotic drag.
Electro-osmotic drag occurs when an ion, migrating in an electric field, effectively drags one or
more other molecules with it by diffusive interactions [21]. The molecules thus dragged may be
the fuel, as when methanol is dragged from the anode side to the cathode side of the membrane
by migrating protons. Under acidic conditions the cathodes of DMFCs rely on platinum, the
same catalyst at the anode, and when the methanol reaches the cathode it is oxidized, wasting
fuel and causing the mixed potential. Under alkaline conditions, the anions flow the opposite
direction than protons in acidic fuel cells, which is an advantage for alkaline fuel cell
environments because the electro-osmotic drag opposes crossover of liquid fuels.
Water may also be affected by electro-osmotic drag, as when it is dragged across the
PEM by protons in a hydrogen fuel cell [22] operating in acidic conditions. The PEM typically
used in low-temperature hydrogen fuel cells is Nafion. To be conductive, Nafion must be
solvated, typically by water for hydrogen fuel cell applications. Without humidification of the
hydrogen stream, the only source of water at the anode is by diffusion from the cathode side,
which is counteracted by the electro-osmotic drag. Water management is thus an important
consideration in some hydrogen-powered cells [23].

11
2.2.5 Available polymer electrolyte membranes
Polymer electrolyte membranes are semi-permeable membranes designed to have high
ionic conductivity while blocking the flow of gases like oxygen and hydrogen, and to serve as
the separator region. PEMs have been developed that can conduct cations or anions.
Nafion membranes have high chemical and electrochemical stability, are selective, have
relatively high cation conductivity [15, 24], and are the membranes of choice for low
temperature hydrogen and methanol fuel cells operating in acidic conditions [15, 18, 25]. Nafion
has a tetrafluoroethylene (Teflon) backbone, which is partly responsible for the high thermal,
mechanical, and chemical stability of the material [26]. Extending off this backbone are
perfluorovinyl ether groups which terminate with sulfonate groups. The cations are conducted
along the sulfonate groups. Nafion conductivity varies by membrane thickness and test
conditions, but is on the order of 0.1 to 0.2 S cm-1 [27], where S (siemens) is Ω-1.
Though Nafion is a cation conductor, it has been tested for use in alkaline fuel cells [28,
29], and recently the Nafion precursor polymer has been modified to conduct anions [30]. For
the alkaline DMFC in Ref. [29] Na+ was used to conduct the current. At the anode of the cell,
the methanol and OH- react to CO2 and water, liberating 6 e-. The Na+ ions and some of the
water travel through the membrane, where they combine with electrons and O2 to form NaOH at
the cathode. To maintain the sodium balance, the Na+ is recycled in some unstated fashion. In
Ref. [28], the Nafion was coated with anion exchange membrane material, and was used to
conduct protons for the hydrogen-powered cell. High pH was maintained at both the anode and
the cathode, with water being split into OH- and H+ at the anode, the H+ carrying the current
through the Nafion, and then combining with OH- at the cathode to create water. Such methods
may be attempted for use in a future viologen-catalyzed DCFC. However, this may lead to

12
problems because viologen molecules are cations with approximately 150 to 200 g mol-1 mass,
and if they are in solution, as they were for the experiments presented in this dissertation, they
can potentially enter and block the pores through which the cations conduct.
No anion exchange membranes (AEMs) have yet emerged that can match the desirable
properties of Nafion and the area is an area of active, and promising [31], study [32-34]. Current
limitations in the technology are related to the possibility of obtaining a membrane having: high
ionic conductivity, chemical stability in strong alkaline media, low permeability to fuel
crossover, low swelling, and good mechanical properties [33]. The development of suitable
AEMs is of great interest due to the following superior qualities gained operating under alkaline
conditions compared to acidic conditions: faster electrokinetics, lower fuel crossover, reduced
CO poisoning, and use of non-precious metal catalysts, such as silver, nickel, and perovskite [34,
35].
A wide variety of materials have been used to make AEMs [34], several examples being
polysiloxane [36], polysulphone [37], poly(arylene ether sulfone) [38], and poly(vinyl
alcohol)/poly-(acrylamide-co-diallyldimethylammonium chloride) [34]. Reported conductivities
range from 10-4 S cm-1 [36] up to 10-2 S cm-1 [33, 34, 38].
At the outset of this work, available commercial AEMs were typically based on cross-
linked polystyrene and were not very stable in alkaline or electrochemical environments and had
relatively low ionic conductivity [32]. AEMs were obtained by our group (Membranes
International, AMI-7001S), tested, and found to have poor stability under our operating
conditions. As mentioned above, efforts were not undertaken to use or modify Nafion for use in
the cell. Therefore, the tests reported in Chapter 6 that were done with a fuel cell-like device do
not make use of an ionomer membrane as separator/electrolyte.
13
2.2.6 Glucose-fuel-cell technology
There are many papers that describe glucose as a potential fuel for fuel cells, and the area
has been the subject of some lengthy reviews [6, 39, 40]. The earliest article was published in
1964 [41], with enzymes as catalysts. Other researchers have since created cells utilizing
bacteria and various metals as catalysts. Bacterial cells, as well as enzymatic cells, typically
operate in a phosphate buffer at physiological pH [42], while metal catalyzed cells have been
shown to operate in alkaline [43] and acidic conditions [44]. In acidic conditions, the reactions
are similar to those represented by Equations 2.1 through 2.3, the difference being that H+ is
liberated at the anode and combined with O2 at the cathode to make water [45]. Specific
examples reported below are representative of power densities and efficiencies achieved.
State-of-the-art bacterial cells [3] have achieved up to 100% coulombic efficiency
(coulombic efficiency is defined as the percentage of available electrons that are freed for useful
work). However, these cells rely on bacterial metabolism, which is thus far kinetically slow,
greatly limiting the current density produced by the cell. Of note, these cells generally require
viologen or another mediator to shuttle the electrons between the bacteria and the electrode [46,
47]. For their microbe-catalyzed cell, Chaudhuri and Lovely [3] report a maximum power
density of approximately 3.3 µW cm-2 at a current of 7.4 µA cm-2 and 0.445 V.
Bacteria-free enzymatic cells are generally based on glucose oxidase [41, 48, 49], an
enzyme that converts glucose to gluconic acid. This conversion only liberates two of the
available 24 electrons for useful work. Soukharev et al. [50] report that power densities of up to
0.35 mW cm-2 at 0.88 V cell voltage are achievable. It is claimed in the publication that the
power density reported in Ref. [50] is superior to that which is achieved with platinum as
catalyst. Kavanagh et al. [51] recently reported an enzyme-catalyzed cell having a maximum
14
power density of 52 μW cm−2 at 0. 21 V. Enzymes require complex immobilization schemes
[50, 51] to be used in cells.
Researchers have made use of both precious metals [43, 52] and transition metals [2, 53-
55] as catalysts in DCFCs. With platinum as catalyst, Bubis et al. [56] report a peak power
density of 0.36 mW cm-2 at a current density of 1.44 mA cm-2 with 0.22 M glucose in 0.35 M
KOH. A maximum power density of 0.22 mW cm-2 and an open circuit voltage of 0.65 V was
reported by Jin and Taniguchi [57] using 10 mM glucose in 0.3 M KOH in a glucose-air AFC
with a silver-modified gold film as anode. Metal-catalyst anodes suffer from poisoning by
intermediate oxidation products, the amelioration of which is an area of active research [58]. As
is evident from the examples cited above, metal-catalyzed DCFCs also suffer from slow electro-
oxidation kinetics at low temperature.
One of the main focuses of both the enzymatic and metal-catalyzed fuel cells appears to
be for use to power implanted medical devices [6]. For such devices, the end product of choice
is the two-electron oxidation of glucose to gluconic acid, which is a non-toxic metabolite [59].
As such, it is generally reported that the oxidation of glucose by metal catalysts leads to gluconic
acid as the end product [12, 60]. However, depending on the conditions [6, 61], it has been
reported that an estimated 20 electrons have been liberated from glucose using a platinized
platinum electrode. In contrast, coulombic efficiencies as low as 5% have been reported for
metal-catalyzed cells, even assuming a maximum two-electron oxidation of glucose [62].
Regardless of continuing interest in the technology, carbohydrates are not being
effectively used as an alternative fuel source. This is despite attempts to employ DCFCs using a
wide range of potential catalysts. Even with some promising results, efforts to use metals
(precious or otherwise), bacteria, and enzymes as catalysts have yet to result in the practical use
15
of carbohydrates as an energy source for fuel cells. If the potential of carbohydrates as an energy
source for portable devices [58, 62] and stationary power supplies is to be realized, higher power
densities, higher coulombic efficiencies, and more stable, lower maintenance catalysts are
required.
Viologen 2.3
Viologens can be categorized in two types: disubstituted and monosubstituted. The
disubstituted type are N,N’-disubstituted-4,4’-bipyridine salts [9], e.g. methyl viologen. The
monosubstituted type are N-substitited-4,4’-bipyridine salts, e.g. monomethyl viologen.
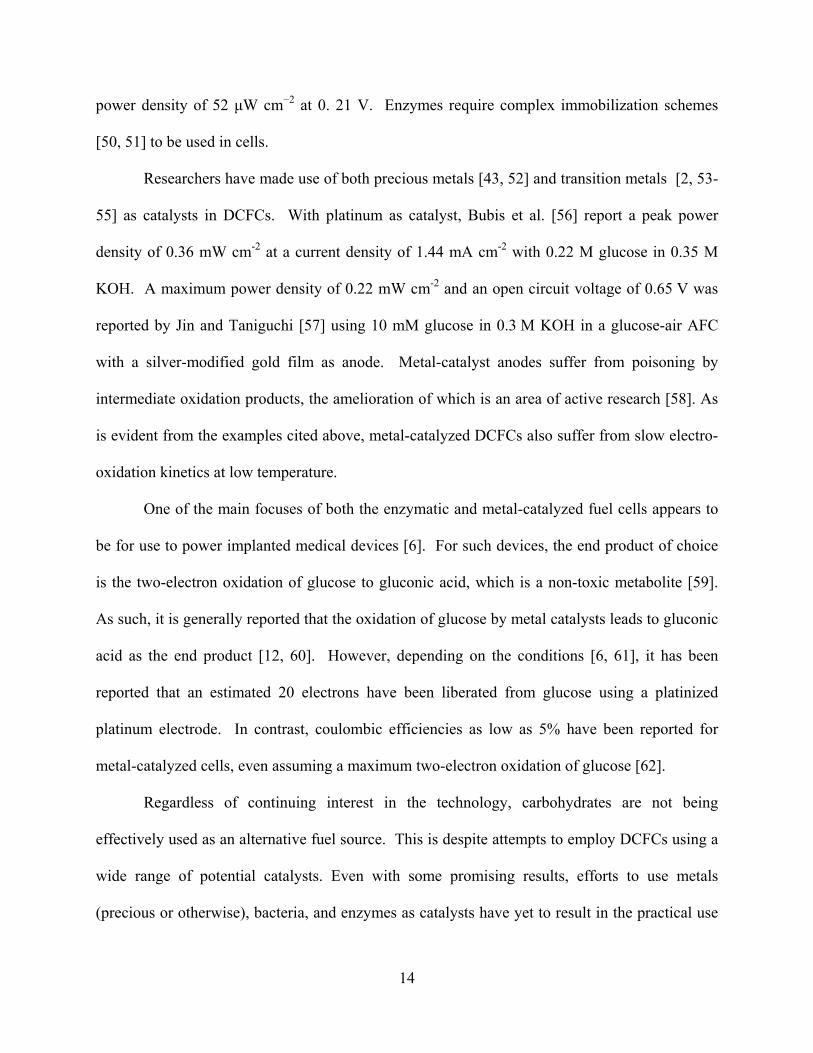
Structures of representative viologens studied here are seen in Figure 2.2.
Figure 2.2 Representative structures for molecules discussed here.
Viologens were discovered over 75 years ago [63] and named viologen for the intense
blue color of the cation radical. Endowed with many “very interesting” properties [9],
disubstituted viologens have been studied extensively [64-74]. A decade ago a book [9] was
written that discusses the many uses of disubstituted viologens and details other information;

16
including synthesis, spectroscopic and structural information, charge-transfer properties and
dimerization [66]. Methyl viologen is used as an herbicide and other types of disubstituted
viologen have been studied for use in electrochromic displays, photochemical hydrogen
production, and as an electron mediator [9]. Little information about monosubstituted viologens
was available in the literature before the beginning of this work, and a portion of the work
presented in this dissertation is on the study of homogeneous monosubstituted viologens.
2.3.1 Viologen electrochemistry
Disubstituted viologens are able to undergo two potentially reversible redox steps and
monosubstituted viologens are able to undergo one. Throughout this dissertation, MV is used as
the general term for methyl viologen and MV2+ and MV1+ are used to represent the electro-active
oxidized and reduced forms, respectively. The mechanism for the reduction of disubstituted
viologens is understood to follow two successive steps, as seen in Equations 2.4 and 2.5, with
methyl viologen being used for a generic disubstituted viologen. Monosubstituted viologens
only undergo one reversible reduction. With monomethyl viologen (MMV) as a generic
monosubstituted viologen, the reduction reaction is presented in Equation 2.6.
MV2+ + e- = MV1+ (2.4)
MV1+ + e- = MVo (2.5)
MMV1+ + e- = MMVo (2.6)
The open-circuit potential of a redox couple, denoted by ∆E, is given by Equation 2.7,
where the equilibrium potential is related to the Gibbs energy [14].
17
∆G = -n F ∆E (2.7)
where n is the number of electrons exchanged during an oxidation or reduction step and F is the
Faraday constant. In a viologen-catalyzed cell, the redox couple which generates useful energy is
the oxidation of MV1+ and the reduction of oxygen. Disubstituted viologens were considered
good candidates for such cells, because they form a stable, reversible radical at reasonably
negative redox potentials [9]. The redox potential of the organic catalyst is important because, as
is seem in Equation 2.7, the free energy of the electrons to do work depends on the difference in
potential between the anode redox couple, and the terminal electron acceptor at the cathode
(usually oxygen). Analysis is complicated by the fact that viologen does not have an ionizable
proton so its redox potential is hardly affected by pH, while the redox potential of oxygen is
affected by pH. Regardless of pH effects, the redox potential of the viologen is still more
negative, and therefore the ∆G between MV1+ and oxygen larger is than other redox dyes that
have also been tested as catalysts for DCFCs [12, 75].
2.3.2 Anode reactions in a viologen-catalyzed DCFC
In a viologen-catalyzed DCFC, the reactions occurring at the cathode, and the overall
reaction are the same as seen in a generic alkaline DCFC, represented by Equations 2.2 and 2.3,
respectively. The oxidation of the carbohydrate fuel at the anode is Equation 2.1 broken into two
parts, as given by Equations 2.8 and 2.9. The oxidation of MV1+ at the cathode is the rate-
limiting step.

18
C6H12O6 + 36 OH- + 24 MV2+ = 6 CO32- + 24 H2O + 24 MV1+ (2.8)
24 MV1+ = 24 MV2+ + 24 e- (2.9)
At the anode, glucose and OH- react to produce 24 e- (Eq. 2.8). This reaction is facilitated by
MV and causes the MV to be reduced. The MV is then oxidized by the anode current collector
(Eq. 2.9), which in turn is connected to the external circuit.
2.3.3 Viologen immobilization
The focus of this work has been on the characterization of homogenous viologens as
catalysts. Viologens are highly soluble in water and toxic, so for use in a practical fuel cell the
viologen will have to be immobilized. The methods for immobilizing viologen that have been
reported fall into one of two broad categories. Either the viologen monomers are attached to a
carbon or metal electrode, or the monomers are polymerized, as described in the following two
subsections. Whichever way the viologen is immobilized, the end goal of the DCFC project at
BYU is to create a catalytically-active anode that is durable, nontoxic, and operates at high
currents.
Viologen immobilization at electrode surface: There are a wide variety of electrode
surfaces onto which viologen has been immobilized. Immobilization can be as simple as
adsorbing the viologen onto a metal [76, 77] or onto Nafion [78-80]. In an effort to create
biosensors, several researchers have immobilized viologen on glassy carbon electrodes [81-84].
Viologens have also been incorporated into a zeolite-modified carbon-paste electrode [85, 86]
and also attached to polymeric microspheres [87] and titanium dioxide [88].
Immobilization can require the modification of the viologen with a functional group
before the viologen can be adequately attached to the surface [89, 90]. One common
19
derivatization technique is to attach a thiol group so the viologen will form a self-assembled
monolayer (SAM) on gold [91-97]. These viologen SAMs are known to be stable, electro-active
and to manifest well-behaved electrochemical responses [98].
Polyviologens: While some researchers have created stand-alone viologen polymers [99-
106], many of the polymerization techniques have been used to attach the viologen to an
electrode. Bauerle and Gaudl [107] write that electropolymerization (which occurs when the
monomer is electrochemically oxidized at a polymerization potential giving rise to free radicals
which are adsorbed onto the electrode surface and subsequently undergo reactions leading to a
polymer network [108]) “is frequently used to modify an electrode surface with an electrically
conducting film.” They and others [109, 110] have used the electropolymerization technique.
Two research groups [111, 112] have made polypyrrole films containing viologen. Other
researchers have made films of the polythiophene derivative with viologen pendant [113], of a
Langmuir-Blogett film [114] and with surface-grafted moieties [115, 116]. Researchers have
also made a membrane with viologen moiety as anion-exchange groups [117] and investigated
viologen for use in a solid polymer electrolyte [118].
Effect on Parameters of Immobilization Method: The method of viologen immobilization
affects the value of parameters such as electrode surface coverage, which in turn affect cell
performance. Though the specifics of a method do affect the parameters, in the literature
reviewed above there is no generalization that can be made about the broad immobilization
categories. Depending on the immobilization technique, surface coverage varies from 10-10 mol
cm-2 to 10-8 mol cm-2. The surface coverage does not seem to control the limiting current density
for the various methods, though, with currents densities ranging from nA cm-2 to mA cm-2. The
limiting current density produced by these immobilized viologen may be misleading, however,

20
as the conditions under which the immobilized viologens were tested are different than the
conditions under which they will be used in this work; none of these immobilized viologens were
tested for the purpose of oxidizing carbohydrates, nor were any of the viologens tested in
alkaline conditions. It is known that the redox potentials of the immobilized viologen depend on
the solvent, substituent radicals, anion, and temperature used in the immobilization [77].
Purpose of homogeneous viologen testing: Testing such a wide variety of immobilization
techniques is a non-trivial task. With even basic questions about the catalytic ability of viologen
unanswered it was thought prudent at the outset of this project to use readily available and
relatively easily testable homogeneous viologens to answer those questions. Clear answers could
be obtained about the suitability of the catalyst and the kinetics and mechanism of the catalysis
without having to contend with complications arising from the immobilization at the same time.
A parallel effort has been underway by other members of our research group for the last two
years to perform immobilization methods.
2.3.4 Viologen stability
It has been claimed [119] that the viologen cation radical has a lifetime of over one year
at room temperature, and that “life problems have not been encountered after well over 105 write-
erase cycles.” This suggests that viologen could be used for energy storage so the cell maintains
a charge even after the cell is turned off, and that the dication/cation transition is reversible.
The carbohydrate fuel 2.4
Glucose, in the form of cellulose, and in free and complexed carbohydrates, is the most
abundant biomolecule formed on earth [1]. With a mandate to increase biodiesel production in
Europe and the United States [120], an overproduction of glycerol has lowered its commodity

21
price and increased disposal costs for biodiesel manufacturers. Two potential carbohydrate fuels,
glyceraldehyde and dihydroxy acetone (DHA) can be made from glycerol under mild refining
conditions [121]. These two fuels may be used for electrical energy production at room
temperature and mildly alkaline (pH 12) conditions. These two fuels are sufficiently safe that the
FDA has approved them (at food grade purity) for human consumption.
As can be seen by the images of glucose and DHA in Figure 2.2, carbohydrates are
partially oxidized hydrocarbons. Therefore, the complete oxidation of carbohydrates releases
less energy than for the analogous hydrocarbon. Nevertheless, carbohydrates contain a
substantial amount of energy, which can be compared to the energy that is released upon the
oxidation of two other fuels that have been considered for other types of fuel cells, methanol and
ethanol. When glucose is oxidized all the way to CO2 and water, ∆G = -4420 Wh/kg glucose,
which is on the order of the ∆G for the oxidation of methanol and ethanol to CO2 and water,
at -5530 Wh/kg and -7450 Wh/kg, respectively.
Carbohydrates are inherently resistant to complete O2-oxidation and efficient and
inexpensive catalytic systems have not been developed to fully catalyze this reaction. The
difficulty in utilizing carbohydrates as a fuel is that, like methanol and ethanol (also considered
as fuels in fuel cells), they are complex molecules that require many elementary steps before they
can be oxidized to CO2 and water. This is part of the reason that the only type of fuel cell that
can oxidize carbohydrates completely is the microbial cell, which can make use of complex
metabolic networks.
22
Coulombic efficiency and voltage efficiency 2.5
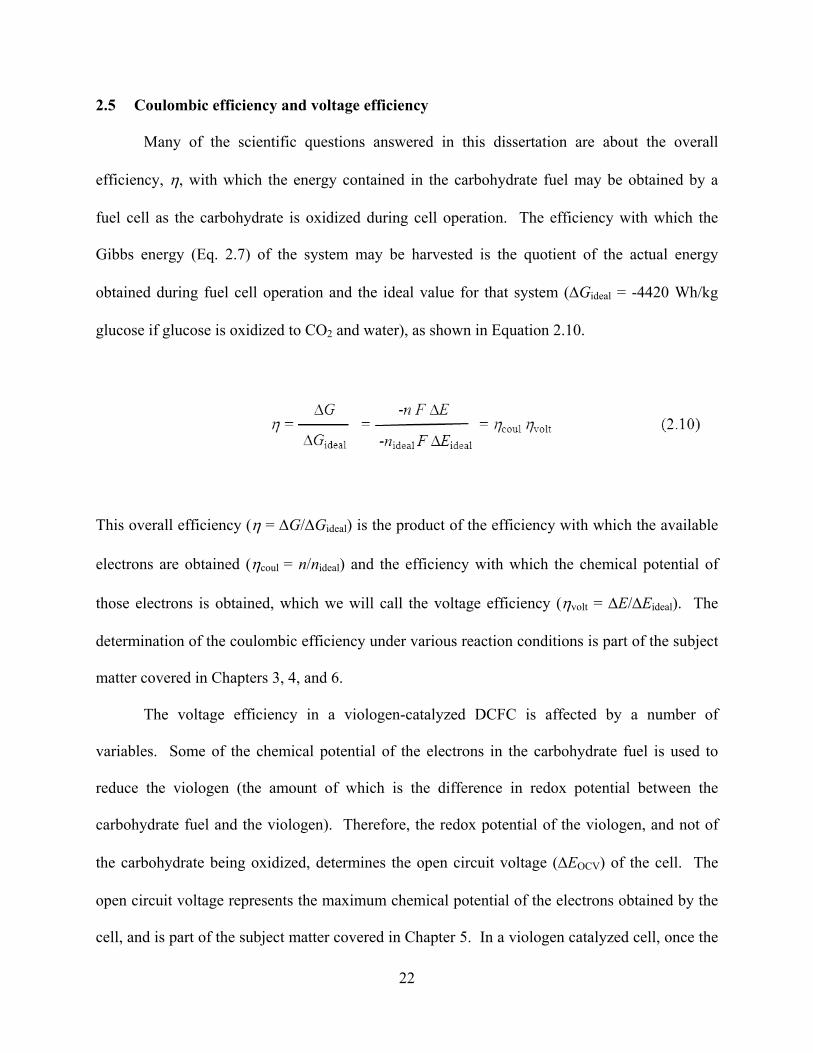
Many of the scientific questions answered in this dissertation are about the overall
efficiency, η, with which the energy contained in the carbohydrate fuel may be obtained by a
fuel cell as the carbohydrate is oxidized during cell operation. The efficiency with which the
Gibbs energy (Eq. 2.7) of the system may be harvested is the quotient of the actual energy
obtained during fuel cell operation and the ideal value for that system (∆Gideal = -4420 Wh/kg
glucose if glucose is oxidized to CO2 and water), as shown in Equation 2.10.
This overall efficiency (η = ∆G/∆Gideal) is the product of the efficiency with which the available
electrons are obtained (ηcoul = n/nideal) and the efficiency with which the chemical potential of
those electrons is obtained, which we will call the voltage efficiency (ηvolt = ∆E/∆Eideal). The
determination of the coulombic efficiency under various reaction conditions is part of the subject
matter covered in Chapters 3, 4, and 6.
The voltage efficiency in a viologen-catalyzed DCFC is affected by a number of
variables. Some of the chemical potential of the electrons in the carbohydrate fuel is used to
reduce the viologen (the amount of which is the difference in redox potential between the
carbohydrate fuel and the viologen). Therefore, the redox potential of the viologen, and not of
the carbohydrate being oxidized, determines the open circuit voltage (∆EOCV) of the cell. The
open circuit voltage represents the maximum chemical potential of the electrons obtained by the
cell, and is part of the subject matter covered in Chapter 5. In a viologen catalyzed cell, once the

23
viologen is reduced, the ∆E, and thus ηvolt, obtained by the cell during operation, depends in part
on the behavior of the viologen-controlled anode as current is drawn, which is part of the subject
matter covered in Chapter 6.
Experimental 2.6
This section is a summary of information that can be found in Refs. [122-124] and other
books on the fundamentals of electrochemistry.
2.6.1 Electrochemical test apparatuses and methods
Electrochemical test apparatuses include the two-electrode cell and the three-electrode
cell. The three-electrode cell is made up of a working electrode, a reference electrode, and a
counter electrode. In this case, the current flows between the working electrode and the counter
electrode, and the reference electrode is used to sense the electrolyte potential near the working
electrode. In the two electrode cell, the reference and counter electrodes are combined into one
electrode. In this case, the current is passed between the working electrode and the counter
electrode, and the potential at the working electrode is not sensed independent of the potential at
the counter electrode, as it is in the three-electrode cell.
Two- and three-electrode cells can be used for many different types of experiments,
including the potentiostatic, galvanostatic, and voltammetric experiments used to obtain data for
this dissertation. Those three types of experiments are typically done with an instrument called a
potentiostat, which uses an external power source to impose a particular current on the cell or a
potential on the working electrode. A potentiostatic experiment is undertaken when the potential
between the working electrode and the electrode acting as the reference electrode is held constant
and the resulting current is detected. Galvanostatic experiments are undertaken when a current is

24
imposed on the cell and the resulting potential between the working electrode and the electrode
acting as the reference is sensed. Both two- and three-electrode cells can be used
galvanostatically and potentiostatically. The results of potentiostatic two-electrode experiments
and galvanostatic three-electrode experiments are reported Chapter 6.
In voltammetric experiments neither the potential nor the current are static. The potential
is controlled in dynamic fashion, typically by a potentiostat. In cyclic voltammetry, as used to
obtain the results presented in Chapter 5, the potential is ramped or swept linearly in the form of
a triangle wave, repeated for multiple cycles. The resulting current profile is recorded. The
potentiostat controls the potential at the working electrode, and thereby the energy state of the
electrons in the electrode, relative to the reference electrode. This method is typically done in
the three-electrode setup, so that inefficiencies and reactions at the counter electrode do not
affect the electric potential conditions at the working electrode.
2.6.2 Working, reference, and counter electrodes
The working electrode is where the electrochemical reaction of interest takes place. The
working electrode can be the anode or the cathode. In some experiments, such as cyclic
voltammetry, the working electrode serves as both a cathode and an anode at different times
during the test as the potential of the working electrode is scanned back and forth from more
negative to more positive. The anode is where the oxidation takes place and the cathode is where
the reduction takes place, which means that electrons are flowing into the solution from the
electrode at the cathode and out of the solution into the electrode at the anode.
The electrochemical redox processes happening at the working electrode and the counter
electrode happen simultaneously, so if oxidation is happening at the working electrode, reduction
must be happening at the counter electrode and vice versa. In order that the current at the

25
working electrode is not impeded by the counter electrode being the source of the limiting
current, the counter electrode usually has high surface area. The potentiostat will impose
whatever potential is necessary, within the working limits of the instrument, to generate the
requested current. This means that the potential at the counter electrode is not controlled relative
to the reference electrode and can be a more negative or positive value than the working
electrode. The redox process happening at the counter electrode is usually not important, unless
the product of the reaction can interfere with the working-electrode reaction (such as the
oxidation of water, which produces oxygen, when the working-electrode reaction produces an
oxygen-sensitive reduced species).
Electrode potentials are always relative values and the reference electrode serves the
purpose of establishing the location of the potential of the working electrode relative to a well-
known, stable, and reproducible equilibrium electrode potential. The equilibrium potential of the
reference electrode depends on the environment of the reference electrode. For instance, in the
silver/silver chloride (AgCl) reference electrode the concentration of the Cl- anion, which is the
ion that participates in the AgCl redox reaction, affects the potential of the reference electrode.
The change in reference potential with the change in concentration is governed by the Nernst
equation [14], which relates the equilibrium potential to the concentrations of the reactants and
products. In the aqueous AgCl reference electrode, typically KCl is used as the source of Cl-
ions. Standard concentrations are also typically used. For instance, for the AgCl reference
electrode, saturated KCl, 3.5 M KCl, 3.0 M KCl, or 0.1 M KCl are typically used.
2.6.3 Advice for beginning experimentalists
New methods: When trying a new experimental method in which no one in the research
group has any practical experience, the following method may work to aid understanding. This

26
method is especially important when a new experimental setup for the experimental method must
be simultaneously constructed. First, find books that cover the fundamentals and the practical
aspects of the subject. The authors of journal articles typically assume the basics are already
known, so it is sometimes difficult to piece together from the article everything that is needed.
Next, study the books. After the books are read, go to the lab, construct the setup, and run
experiments using the method. When the experimental setup is being perfected and you are
getting experience with the practical aspects of the method, sometimes trial and error is the best
way forward. Additionally, when first using the new setup, if the option is available, gain
experience with the method and setup by repeating a simple experiment (for instance, testing
aqueous ferrocene solution in a cyclic voltammetry setup). In this case, repeating something
found in a journal article may be helpful. After you have obtained some experience with the
method, read the books again. You might not understand everything you read the first time
through the book, even though most, if not all, the pertinent information was contained in the
book. After gaining some experience with the method, you may find the books to much more
understandable. Additionally, although constructing a new experimental setup while
simultaneously learning a new method can be challenging, this will allow you to gain intimate
knowledge of the equipment so that it is not a “black box” to you. When problems arise, you
will be in a position to understand and fix what is wrong.
Cleanliness: In electrochemical experiments involving a working electrode, the condition
of the surface of the working electrode is important. Books, such as Ref. [122], usually have
information on proper cleaning techniques, but articles are also helpful in this regard because the
authors typically describe, at least briefly, the method they used to clean their apparatuses. The
methods I used to make sure my electrodes were clean are described in Chapter 5.

27
It is also important and to maintain a vigilant attitude during the course of
experimentation. For example, when I first did my cyclic voltammetry experiments, again, as
described in Chapter 5, I was very careful to exclude oxygen from my system because I knew
that reduced viologen is sensitive to oxygen. As time went by, I became less careful and did not
use the flow rate of nitrogen that was required to ensure all the oxygen was purged from my
system. I wasted a lot of time trying to figure out why my later experiments didn’t look like my
earlier experiments.
Summary 2.7
Carbohydrates are abundant, high-energy molecules that can potentially be used to power
fuel cells. Carbohydrate fuel cells are an area of active investigation. In principle, fuel-cell units
have a much higher energy density than batteries and also the ability to be rapidly “recharged”
by mechanical means. Due to the potential lack of precious-metal catalyst, the cells based on
this work may be cheap, or cheaper, to make than with previous technologies. The cells can
potentially be portable and simple with no need for high-pressure containers or pretreatment
equipment. Most of the cells being developed by other groups have only been shown to be
functional with glucose, whereas MV has been shown, as reported in Chapter 3, to be highly
versatile in regards to utilizable fuels. MV is reduced by all tested monosaccharides, and even
some non-carbohydrate fuels.

29
3 INITIAL INVESTIGATION INTO THE UTILITY OF VIOLOGENS FOR USE AS CATALYSTS IN DIRECT CARBOHYDRATE FUEL CELLS
Introduction 3.1
With limited information on the catalytic oxidation of carbohydrates by viologen
available in the literature, and to evaluate the utility of viologens for that purpose, the following
basic questions needed to be answered.
Other than glucose, are other carbohydrates and chemical species oxidized by
viologen? At the outset of this work, the mechanism by which the viologen oxidizes glucose
was unknown, and it was thought that observing which species are oxidized by viologen, and
which are not, would give us information on which functional group(s) are required for the
oxidation to take place. Additionally, glucose is not the only potential fuel that researchers have
investigated for fuel cell use. It is useful to know if viologens oxidize fuels such as methanol
and ethanol, as well as other carbohydrates.
Do other types of viologen, besides methyl viologen, also catalytically oxidize glucose
and other molecules? To create a practical fuel cell, it is likely that the viologen catalyst must
be immobilized on a surface so that it does not leave the cell with the fuel stream. It is useful to
know before any attempted immobilization how widespread the catalytic activity is among
viologens so that knowledge can be used in the immobilization efforts. Additionally, values
important to the catalysis, such as redox potentials, are known to vary from viologen to viologen
30
[9], depending on the substituents at the nitrogen, so it is again important to know how
widespread the catalytic activity is.
At what efficiency is the fuel oxidized? Accurate efficiencies are important because the
energy density, and thus utility, of the carbohydrate fuel relies directly on the extent to which the
fuel can be oxidized.
Which factors in the oxidation are most important in affecting that efficiency? Due
to the importance of efficiency in the utility of a carbohydrate fuel cell, it is useful to know
which factors affect that efficiency.
What can be learned about the oxidation by examining the products of the
oxidation? With the mechanism of the oxidation unknown, it was thought that the products of
the oxidation could provide answers about the mechanism. With these answers, a hypothesis for
the mechanism could be generated and then tested (Chapter 4).
Reduced methyl viologen, MV1+, is readily oxidized by O2, and two O2-uptake methods,
the so-called sealed-vial and pressure-cell methods, were used to evaluate catalytic oxidation of a
wide variety of species by the viologens, the extent of that oxidation, and what factors most
affect that oxidation. These same methods were also used to determine the activity of viologens
other than MV. Products of the reactions were determined using NMR and mass spectrometry
(MS).
The work presented in this chapter was undertaken in collaboration with Gerald Watt of
the Department of Chemistry and Biochemistry at BYU, and Joseph Nichols and Adam Read of
the Department of Chemical Engineering at BYU. The work has been published in two separate
journals [8, 125]. Ref. [8] was a study of the catalysis of carbohydrates by disubstituted
viologens from pH 9 to pH 12. In order to expand those initial studies we examined
31
carbohydrate oxidation in 1 M to 3 M KOH. These results established that dialkyl viologens are
initially catalytically active but are inherently unstable in strong base and undergo hydrolysis to
release one alkyl group, forming the analogous monoalkyl viologen in high yield. These
monoalkyl viologens were also tested and appear to be catalytically active towards carbohydrates
as well [125].
Experimental 3.2
3.2.1 Materials
The carbohydrates and other compounds listed in Table 3.1, the potassium and sodium
bicarbonate and phosphate buffer components, methyl, ethyl and benzyl viologens, 4,4’-
bipyridine, and methyl iodide were obtained from Sigma and used without purification.
Specifically labeled glucose 13C1 and 13C6 glucose (99-atom percent, Sigma, St. Louis, MO) and
labeled 13C glyceraldehyde (98-atom percent, Omicron Biochemicals, Inc. South Bend, IN) were
used to identify carbohydrate oxidation products. Milli Q water was used to make all solutions.
Saturated KOH solutions (~19.6 M), in which K2CO3 is not soluble, were used to prepare
carbonate-free 1.0-3.0 M KOH solutions for the monosubstituted viologen-catalyzed
carbohydrate oxidation reactions.
3.2.2 Synthesis of viologens
Monomethyl viologen (MMV) was synthesized as follows. First, 0.2 grams of 4,4’-
bipyridine was dissolved into 20 mL of acetone in a round bottom flask. Next, 0.25 mL of
iodomethane was added to the round bottom flask. The solution was then stirred continuously
under nitrogen for 8 hours at 60 oC. The precipitate was filtered on filter paper, and then washed

32
with acetone and dried. The MMV iodide salt precipitated as high purity product, though a small
amount of MV (at least 4% of the precipitate) was also formed. 1,1’-ethylene-2,2’-bipyridinium
dichloride and 1,2,3,6-tetramethyl-ethylene-2,2’-bipyridinium dichloride were synthesized as
reported [1].
3.2.3 Methods
Sealed-vial method: The purpose of this method is to relatively quickly screen the effect
of many reaction variables. This method involves placing a small amount of reactants in a
serum-capped pressure-tight 10 mL glass vial and, after the reaction, measuring oxygen uptake
to estimate the coulombic efficiency. With this method, 5-20 individual reactions were
conducted simultaneously by placing 1.0 mL of buffer, the desired amounts of viologen and
carbohydrate and a “flea stir bar” in a vial at 23 oC under 1.0 atm of air and immediately sealing
the vial with an aluminum capped septum. The vial was vented with a needle, resealed with
rubber cement, placed in a controlled temperature oven and rapidly stirred as the O2-consuming
reaction proceeded. When the reaction was completed, the vials were cooled to room
temperature, weighed, submerged in distilled water and the serum cap punctured with a 23 gauge
needle to fill with water the vacuum created from the O2-consumption. The vials were dried and
reweighed. The increase in mass (H2O, 0.9970 g/mL) gave the volume of O2 taken up by the
reaction.
Pressure cell: A variation of the sealed-vial experiments is the pressure-cell experiment,
in which the sealed vial is connected to a pressure transducer. These experiments produce
pressure vs. time plots, which show how the oxygen consumption reaction proceeds in time. The
pressure-cell experiments provide a check on the sealed-vial coulombic efficiencies because they
are set up and measured in a similar way. A Micro Lab pressure sensor (Bozeman, MT) was

33
connected to pressure-tight vessels of 2.0-10.0 mL nominal volume. 1.0-2.0 mL of buffer (0.20
to 0.50 M) was placed in the pressure cell under 1.0 atm of air and the desired viologen was
added to 0.50-30.0 mM. An aluminum capped rubber septum sealed the cell and a glass tight
syringe containing 10-100 uL of carbohydrate solution (0.10-0.50 M) was put through the
septum. When the cell and syringe assembly were equilibrated at 25-70 oC, the carbohydrate
was added. The pressure change was monitored as a function of time (0.50-12 hrs) and pressure-
time files were collected using a PC. From the change in pressure during the viologen-catalyzed
carbohydrate oxidation, the amount of O2 consumed by the reaction was determined. Pressure
changes for control reactions of buffer plus carbohydrate or buffer plus viologen were
determined and subtracted from the carbohydrate-viologen reactions. Generally, these
corrections for non-specific carbohydrate oxidation were less than 5% of the overall catalyzed
reaction.
Analytical investigation of products: The products of carbohydrate oxidation were
identified by 13C-NMR (Bruker Ultrashield 300 for the disubstituted viologen tests and Inova
300 for the monosubstituted viologen tests), using natural abundance glucose and specifically
labeled 13C1 and 13C6 glucose. Viologen species were identified by both NMR (Inova) and mass
spectrometry (MS, Agilent Technologies LC/MS TOF). H2O2 was measured using peroxide test
strips from EMD Chemicals Inc., Gibbstown NJ sensitive to 0.5 mg/L. The presence of reducing
carbohydrates was determined by Benedict’s solution with a sensitivity of 1.0 µmol under the
conditions of the experiment.
Microcoulometry: Microcoulometry was conducted anaerobically [126] in a coulometry
cell containing viologen and buffer that was set at -400 mV relative to the saturated calomel
electrode. As the viologen catalyst oxidizes the carbohydrate and forms reduced viologen, the

34
latter is oxidized at the silver electrode and the resulting oxidation current is integrated over time
to obtain the total coulombs transferred during carbohydrate oxidation. The cathode for this cell
is made of a coiled silver wire place in the test solution. The cathode reaction is the oxidation of
the silver to form AgCl.
Results 3.3
3.3.1 Sealed-vial results
The sealed-vial method was used to obtain coulombic efficiencies (where ηcoul = n/nideal,
as described in Chapter 2) for 28 potential fuels, as catalyzed by one or more of four
disubstituted viologens and one monosubstituted viologen (Table 3.1). A coulombic efficiency
of 100% (6 O2/glucose) corresponds to 24 electrons with subsequent formation of carbonate
(Equations 2.2, 2.3, 2.8, 2.9). The disubstituted viologen reactions were carried out at 50 oC at a
viologen/sugar ratio of 1.0 at pH 11.0 in 0.50 M sodium phosphate buffer. Monosubstituted
viologen reactions were carried out at a viologen/sugar ratio of 1.0 in 1 M KOH and 23 oC (the
elevated temperatures used for the disubstituted viologen tests were not necessary in 1 M KOH).
IPV is isopropyl viologen; I and II are, respectively, 1,1’-ethylene-2,2’-bipyridine dichloride and
1,2,3,6-tetramethyl-ethylene-2,2’-bipyridine dichloride. Reactions identical to those with MV
were conducted with ethyl viologen and nearly identical results were obtained (not shown). The
data reported in sealed-vial tests was taken from tests that were run until the intense blue/purple
of reduced viologen was no longer seen—5 or more hours—which suggests that the viologen
was in the same oxidation state as when the test started.

35
Table 3.1 Coulombic efficiencies (%) for the oxidation of the named species by the named viologen. No tests were done in table locations filled with ‘-.‘
Molecule (no. of C atoms) MV IPV I II MMV glucose (6) 20-40 48 14 48 35 fructose (6) 42 - - - - galactose (6) 35 - - - - ribose (5) 47 50 57 50 - xylose (5) 45 52 25 52 - erythrose (4) 48 - - - - glyceraldehyde (3) 40 32 40 42 35 dihydroxy acetone (DHA) (3) 35 - - - 41 monohydroxy acetone (MHA) (3) 35 - - - - acetone (3) 1 - - - - maltose (12) 19 21 9 20 - lactose (12) 22 19 6 20 - sucrose (12) 0 - - - - cellobiose (12) 25 20 - - - glucosamine (6) 43 - - - - glycerol (3) 2 - - - - formaldehyde (1) 1 - - - - formate (1) 0 - - - - gluconic acid (6) 2 - - - - methanol 1 1 - - - methyl-a-D-glucopyranoside (7) 0 - - - - sorbitol (6) 2 - - - - glyceric acid (3) 0 - - - - acetic acid (3) 0 - - - - methyl isobutyl ketone (5) 0 - - - - ethanol (2) 0 - - - - hydrazine 0 - - - - ethyl acetate (4) 0 - - - -
The results are seen in Table 3.1, which shows that all tested viologens appear to be able
to oxidize a variety of molecules. The species in Table 3.1 that react most readily with the
viologens all share a common characteristic; they are all carbohydrates (or carbohydrate
derivatives) with a free anomeric carbon. This important observation is expanded in Chapter 4,
where it is shown conclusively that the active intermediate is the enediol form of the oxidized

36
molecule. An enediol is a functional group made of two hydroxyl groups on neighboring
carbons connected with a double bond (Figure 3.1). Other functional groups, including simple
alcohols, polyols, carboxylic acids, ketones, and aldehydes were found to be inactive towards the
viologen, or to have very low activity.
Figure 3.1 Dihydroxy acetone (DHA) and enediol form.
Table 3.1 shows coulombic efficiencies that are significantly higher than the two-electron
oxidation of carbohydrates that would lead to the carboxylic acid form of the carbohydrate, as is
often reported for glucose fuel cells. However, the high reported coulombic efficiencies are
consistent with precedent (Chapter 2).
Four 12-carbon carbohydrates were tested, with results shown in Table 3.1. Three of the
carbohydrates, the disaccharides maltose, lactose, and cellobiose, have coulombic efficiencies
roughly half those of the 6-carbon monosaccharaides. This is due to the sugar units being linked
to each other in such a way that only one of the units is capable of forming the enediol. In
sucrose, also a disaccharide, the monomers are linked so that neither unit can form the enediol,
and therefore no oxidation is seen.
It is also evident from Table 3.1 that, under the same conditions, the tested
monosaccharaides capable of forming the enediol (the top eight entries in the table) are oxidized
to roughly the same extent, whether they have 3, 4, 5, or 6 carbons. This means that, under the
OH
OH
O
OH
OH
O-
37
conditions of the test, hexoses are seen giving up approximately 10 of their 24 available
electrons, while trioses are seen giving up only 5 of their 12 electrons.
Because we see that all carbohydrates with a free anomeric carbon are oxidized by the
viologen, Table 3.1 also suggests that a fuel stream containing a mixture of sugars may be used
by a fuel cell catalyzed by viologen. The main carbohydrate products of the hydrolysis of
lignocellulose are the sugars glucose, xylose, arabinose, and cellobiose [127], which are all
oxidized by the viologen. The hydrolysis process is under investigation for the production of
“cellulosic ethanol.” The hydrolysis mixture also contains byproducts such as furfural, acetic
acid, and formic acid, which inhibit the production of ethanol [128]. It is unknown at this time
whether these byproducts would interfere with the oxidation of the carbohydrates by the
viologen.
3.3.2 Sealed-vial, viologen/carbohydrate ratio effect
Figure 3.2 shows a series of reactions at 50 oC at pH 11.0 in 0.25 M sodium phosphate
buffer and one atmosphere of air as a function of MV/glucose ratio. The ratios shown were
achieved with two series run different ways. One series was done by holding the glucose
concentration in the vial constant while the concentration of viologen was varied, and the other
was done by holding the viologen concentration constant while the glucose concentration was
varied. For the former series, the glucose concentration was 0.010 M and the MV concentration
was varied to produce ratios ranging from 0.045 to 15.0. For the latter series, the MV
concentration was held constant at 0.025 M and the glucose concentration was varied to attain
the indicated ratios.
Figure 3.2 shows that the extent of glucose oxidation depends on the MV/glucose ratio
and is seen to be between 20-40% at ratios of 0.10 to 2.0. However, above this ratio, the

38
coulombic efficiency slowly increases until at 12, approximately 80% efficiency is reached. At a
ratio of 2.0 and approximately 35% efficiency, the MV catalyst cycles about 4 times but at a
ratio of 0.10, at 22% efficiency, the catalyst makes about 53 cycles. Under conditions of Figure
3.2, no H2O2 was observed and O2 was reduced to H2O. At each MV/glucose ratio examined,
the pH decreased less than 0.20, demonstrating that the reaction was not pH limited.
Figure 3.2 The efficiency of glucose oxidation by O2 using MV as catalyst. The results shown are based on single experiments.
The results in Figure 3.2 show some variation, as seen by the measurements near a 1:1
ratio, which was studied extensively. A number of factors may contribute to this
irreproducibility. The presence of metal ions functioning as catalysts can alter the extent of
reaction and precautions were taken to minimize this effect. Perhaps the more important
problem is that the stable free radical, MV1+, is first formed that initially reduces O2 → O2-→
H2O2 → H2O. The presence of free radicals and formation of reactive O2 species likely
contribute to uncontrollable reaction pathways that lead to irreproducibility. Glucose

39
inactivation by polymerization was previously reported in alkaline glucose fuel cells [62] that
could also influence reproducibility. This polymerization is discussed below, when the products
of the oxidation are examined. Additionally, though the sealed-vial method has the advantage of
high throughput, the way in which the coulombic efficiency was measured may not allow for the
most precise measurements.
Similar to the glucose oxidation shown in Figure 3.2, glyceraldehyde oxidation is also
dependent on the MV/glyceraldehyde ratio. At MV/glyceraldehyde ratios of 0.1 to 1.0 the
efficiency is initially constant at approximately 40% but as the ratio increases to 10,
approximately 80% oxidation of glyceraldehyde occurs. The reaction of glyceraldehyde is more
efficient at low MV/glyceraldehyde ratios and the efficiency increases slightly faster with
MV/glyceraldehyde ratio than that with glucose, indicating the greater reactivity of
glyceraldehyde.
Table 3.2 shows a similar type of data as is seen in Figure 3.2, but for MV and
monomethyl viologen (MMV) with sugars other than glucose. The reactions were conducted in
air at either pH 11 in 0.5 M phosphate buffer, or in 1.0 M KOH. The uncertainty was obtained
from 6-8 separate sets of measurements under the same conditions, with the spread in the data
being a simple expression of the total scatter seen in the data.
Table 3.2 Effect of pH and viologen/carbohydrate ratio on the coulombic efficiency
(% ± S.D.) of viologen-catalyzed carbohydrate oxidation by O2.
Efficiency (%) at indicted viologen/carb. ratio Viologen Carbohydrate pH 0.5 1 2 5 8
MV glyceraldehyde 11 33±3 40±3 43±2 68±5 81±4 MMV glyceraldehyde 11 28±3 35±3 40±5 60±4 72±4 MMV glyceraldehyde 14 33±3 39±4 44±2 58±3 78±3 MMV DHA 14 41±4 41±2 48±2 60±2 84±5
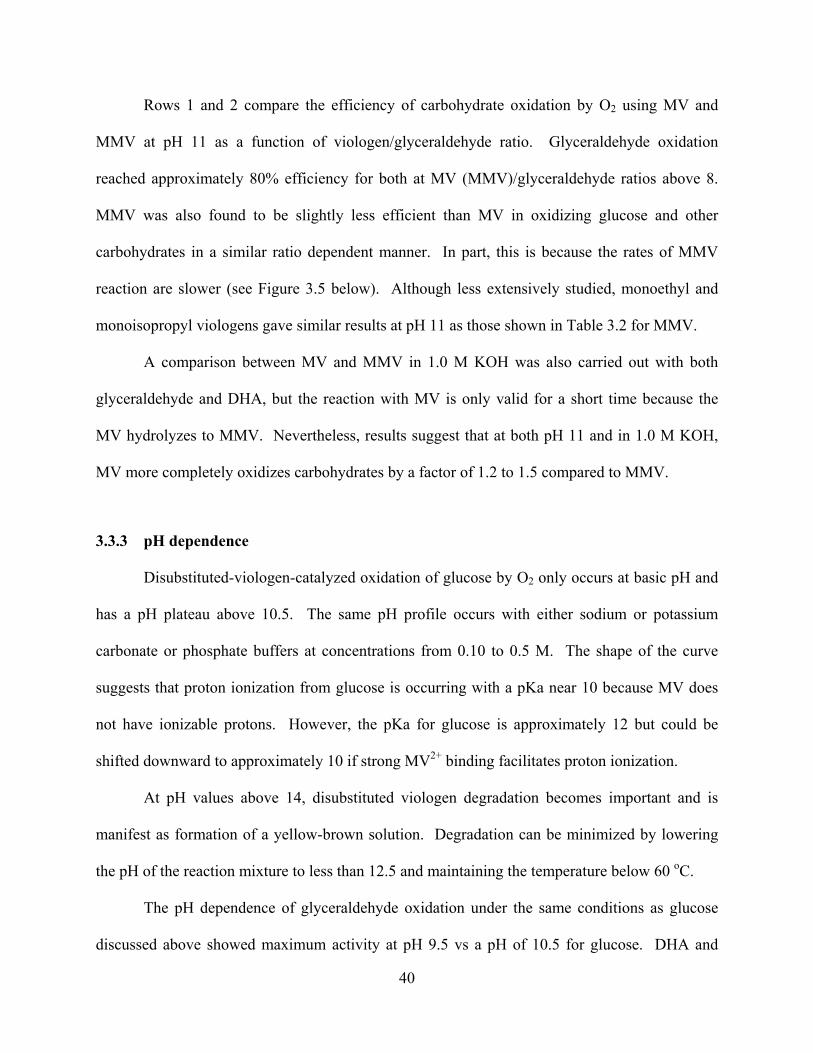
40
Rows 1 and 2 compare the efficiency of carbohydrate oxidation by O2 using MV and
MMV at pH 11 as a function of viologen/glyceraldehyde ratio. Glyceraldehyde oxidation
reached approximately 80% efficiency for both at MV (MMV)/glyceraldehyde ratios above 8.
MMV was also found to be slightly less efficient than MV in oxidizing glucose and other
carbohydrates in a similar ratio dependent manner. In part, this is because the rates of MMV
reaction are slower (see Figure 3.5 below). Although less extensively studied, monoethyl and
monoisopropyl viologens gave similar results at pH 11 as those shown in Table 3.2 for MMV.
A comparison between MV and MMV in 1.0 M KOH was also carried out with both
glyceraldehyde and DHA, but the reaction with MV is only valid for a short time because the
MV hydrolyzes to MMV. Nevertheless, results suggest that at both pH 11 and in 1.0 M KOH,
MV more completely oxidizes carbohydrates by a factor of 1.2 to 1.5 compared to MMV.
3.3.3 pH dependence
Disubstituted-viologen-catalyzed oxidation of glucose by O2 only occurs at basic pH and
has a pH plateau above 10.5. The same pH profile occurs with either sodium or potassium
carbonate or phosphate buffers at concentrations from 0.10 to 0.5 M. The shape of the curve
suggests that proton ionization from glucose is occurring with a pKa near 10 because MV does
not have ionizable protons. However, the pKa for glucose is approximately 12 but could be
shifted downward to approximately 10 if strong MV2+ binding facilitates proton ionization.
At pH values above 14, disubstituted viologen degradation becomes important and is
manifest as formation of a yellow-brown solution. Degradation can be minimized by lowering
the pH of the reaction mixture to less than 12.5 and maintaining the temperature below 60 oC.
The pH dependence of glyceraldehyde oxidation under the same conditions as glucose
discussed above showed maximum activity at pH 9.5 vs a pH of 10.5 for glucose. DHA and
41
monohydroxy acetone (MHA) were slightly more reactive than glyceraldehyde. Tetroses and
pentoses are intermediate in reactivity between glyceraldehyde and glucose.
3.3.4 Pressure-cell results
Glucose: Figure 3.3 shows the pressure decrease when 0.01 M glucose, 0.01 M MV with
0.025 M phosphate buffer at pH 11.0 react with air at 50 oC in the pressure cell. Under different
conditions, such as concentrations of glucose below 0.5 mM, the reaction was very slow, and at
temperatures less than 40 oC, no appreciable reaction occurred.
Figure 3.3 Pressure decrease (O2-uptake) for the reaction of glucose with MV at pH 11 and 50 oC, Figure 3.3 insert. Pressure decrease (O2-uptake) for the reaction of glyceraldehyde, MV at pH 11 and 23 oC.
42
The pressure change corresponds to 41.5% efficiency (10 electrons/glucose) of glucose
oxidation. Figure 3.3 shows two distinct regimes. An exponential pressure decrease (O2-uptake)
for approximately 500 min, after which a slow linear pressure decrease continues for a much
longer time. This two-regime behavior is also seen in the fuel cell results reported in Chapter 6,
where an initial high current is followed by a steady, much lower current when the cell is run at
closed-circuit potential.
Glyceraldehyde: A reaction conducted under identical condition to Figure 3.3 (see insert)
produced a pressure-time curve for the MV-catalyzed O2-oxidation of glyceraldehyde that was
complete in only approximately 30 minutes at 23 oC, in contrast to glucose which requires
approximately 6 hours at 50 oC. The pressure change corresponds to a 32.3% (3.9
electrons/glyceraldehyde) efficiency of glyceraldehyde oxidation. The near exponential pressure
decrease changes to a slow linear decrease at approximately 23 minutes.
3.3.5 Product identification from carbohydrate oxidation
Glucose: Figure 3.4a shows the natural abundance 13C NMR spectrum following glucose
oxidation at a 12:1 MV/glucose ratio at pH 11, giving approximately 80% (19 electrons/ glucose)
efficiency. The inset in Figure 3.4a is a carbon NMR of natural abundance glucose in water.
Significant amounts of carbonate (168 ppm) and formate (171 ppm) and lesser amounts of
gluconic acid (179 ppm) are seen, establishing that carbon-carbon bonds were broken and
extensive oxidation of glucose occurred. Unreacted glucose (resonances between 60-80 ppm) is
barely detectible. A control spectrum of glucose plus buffer (minus MV) in air under the same
conditions did not produce carbonate and only trace amounts of formate, establishing that MV is
required for glucose oxidation. MV2+ resonances occur at 48, 126, 146 and 149 ppm.

43
Figure 3.4 13C-NMR spectra of the products of the oxidation of glucose and glyceraldehyde by viologen.
Figure 3.4b shows a 13C natural abundance spectrum of a reaction conducted at a
MV/glucose ratio of 0.1 at pH 11 with an efficiency of 31% (7.4 electrons/glucose). This
reaction corresponds to the low ratio end of Figure 3.2. The 13C spectrum shows significant

44
amounts of formate, carbonate and gluconic acid (as well as glucose and non-glucose
resonances, 60 to 96 ppm), establishing that under these conditions MV catalytically cycles
numerous times and catalyzes significant carbon-carbon bond breaking.
Figure 3.4c shows the spectrum after 13C1-labeled glucose (92.3 and 96.4 ppm) was
reacted at a MV/glucose ratio of 1.0 in air at pH 11 giving 30% efficiency (7.2
electrons/glucose). 13C-labeled formate is formed early along with a much smaller resonance
likely due to 13C1 gluconic acid. When identical reactions were conducted with 13C6–labeled
glucose, weak resonances of 13C-labeled carbonate and stronger formate resonances were
observed but in lesser amounts than the corresponding 13C1-labeled reactions.
Control reactions corresponding to Figure 3.4a over 5.5 hours using 13C-labeled glucose
compounds minus MV showed only the presence of unreacted glucose and a very weak formate
resonance but no 13C-labeled carbonate. These labeling experiments and their controls establish
that viologen catalyzes the oxidation of glucose by O2 in air and that non-specific glucose
oxidation is minimal under the conditions of the tests. The results are consistent with oxidation
beginning at the more reactive C1 end of glucose and progressing to the C6 end but do not
exclude the possibility of simultaneous oxidation occurring at both ends.
The presence of what appears to be unreacted glucose in Figure 3.4a-c and only 35%
efficiency at low ratios raise an important question of why some glucose is oxidized to formate
and carbonate and yet some remains apparently unreactive. This lack of glucose reactivity is a
major factor causing low conversion efficiency at low MV/glucose ratios. If reactions producing
35% efficiency at MV/glucose ratios below 2.0 are allowed to react much longer, a greater O2-
uptake is observed, suggesting this unreacted glucose slowly undergoes reaction. This reactivity
corresponds to the slow linear O2-uptake evident in Figure 3.3 after 500 min.
45
Vials that had been reacted to completion were tested with Benedict’s solution and the
peaks that appear to be unreacted glucose were found to not be reducing sugars. Non-reducing
carbohydrates, such as sucrose, show peaks in the same 90 to 100 ppm range where the anomeric
C1 carbon of glucose is seen. Non-reducing sugars do not form the enediol, and so will not react
with viologen appreciably. It is possible that the peaks that are seen are some form of
carbohydrate polymer. Whatever compound is the source of the peaks, it is inactive, or has very
low activity, toward the viologen catalyst.
Glyceraldehyde: At a 1/1 MV/glyceraldehyde ratio and at approximately 40% efficiency,
Figure 3.4d shows the presence of 13C resonances from carbonate and formate, along with
smaller resonances due to glyceric acid. At pH 11, 13C resonances from unreacted
glyceraldehyde are not observed. From the intensities of formate and carbonate resonances in
spectrum Figure 3.4d and from the measurement of O2-uptake giving 40% efficiency, an
accounting of electrons was made consistent with the presence of some unreacted
glyceraldehyde. However, reaction with Benedict’s solution also showed the absence of
reducing carbohydrates. As the MV/glyceraldehyde ratio increases, the efficiency of
glyceraldehyde oxidation increases as does the amount of formate and carbonate. These results
are similar to those discussed above for glucose and indicate that unreactive glyceraldehyde is
present that causes the efficiency to be only 40% at a 1/1 MV/glyceraldehyde ratio but, as with
glucose, the efficiency can be increased to approximately 80% at higher MV/glyceraldehyde
ratios.
3.3.6 Viologen stability
The stability of MV and MMV was examined by MS and NMR at pH 12 and in 1.0 M
KOH by following the loss of the parent peaks and the appearance of MMV. MV is stable and

46
catalytically functional at pH 12 for at least 40 days, with no degradation seen in NMR. Within
20 minutes in 1 M KOH the dialkyl viologen MS peak begins to disappear and within 48 hours
the parent MS peak is no longer visible. Within this time frame monoalkyl peaks dominate all
the peaks, with the remainder of the area being made up of small unidentified peaks. In contrast
to MV, the independently synthesized MMV remained unchanged after 48 hours in even 1 M
KOH.
3.3.7 Electrochemical carbohydrate oxidation
For the O2-uptake measurements discussed above, the rates of MV or MMV reduction by
glyceraldehyde were more rapid than the mass transport of O2 from air to the solution to oxidize
the reduced viologen species even with vigorous stirring. As a consequence the reactions were
limited by O2 transport so the rate of carbohydrate oxidation by MV and MMV could not be
determined from the pressure-cell method. To efficiently utilize the energy of carbohydrates in a
fuel cell, it is important to understand the relative rates of carbohydrate oxidation by MMV and
MV and to separately study this carbohydrate oxidation process from the O2-utilization reaction.
Figure 3.5 compares the electrochemical oxidation of DHA mediated with MV and
MMV under the same conditions in the absence of O2. 20 µmol each of MMV and MV were
added in separate reactions to 2.0 mL of 0.50 M potassium phosphate buffer pH 11 containing 20
µmol of DHA. The viologens oxidized DHA and in turn were oxidized by the silver electrode.
From the brief steady-state rate at the peak current, the rate of glyceraldehyde oxidation
by MV was seen to be approximately 3.0 times faster with MV than with MMV. The integrated
area of both curves indicate that the extent of oxidation of DHA was typically 1.2 times greater
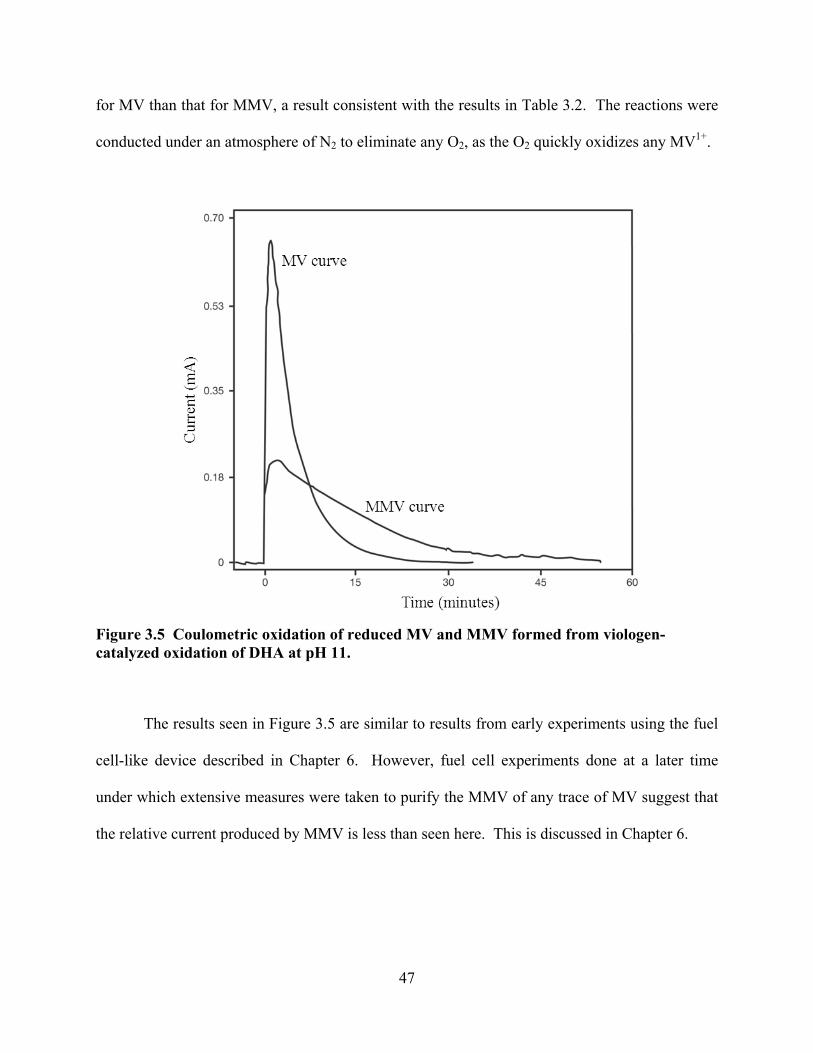
47
for MV than that for MMV, a result consistent with the results in Table 3.2. The reactions were
conducted under an atmosphere of N2 to eliminate any O2, as the O2 quickly oxidizes any MV1+.
Figure 3.5 Coulometric oxidation of reduced MV and MMV formed from viologen-catalyzed oxidation of DHA at pH 11.
The results seen in Figure 3.5 are similar to results from early experiments using the fuel
cell-like device described in Chapter 6. However, fuel cell experiments done at a later time
under which extensive measures were taken to purify the MMV of any trace of MV suggest that
the relative current produced by MMV is less than seen here. This is discussed in Chapter 6.
48
Discussion 3.4
Figures 3.2 and 3.3 establish that carbohydrate oxidation by air is catalyzed by the
presence of the redox active viologen catalysts shown in Table 3.1 and that the coulombic
efficiency of the reaction is highly dependent on the MV/sugar ratio. During this reaction, O2 is
consumed and carbohydrate is oxidized to formate and carbonate, establishing the significant
result that carbon-carbon bonds have been broken. Ultimately, at high MV/glucose ratios formate
and carbonate appear to dominate as major products.
The absence of H2O2 during the reaction establishes that H2O is the product of O2
reduction. Only minimal non-specific sugar oxidation occurs under these mildly basic
conditions of the MV tests, establishing that viologen is a requirement for sugar oxidation.
Careful preparation of solutions using acid washed glassware is essential to minimize metal ion
contamination, which accelerates non-specific glucose oxidation.
The reaction is highly pH dependent and only occurs at pH > 10.5 for glucose and other
hexoses but at lower pH values for the more reactive glyceraldehyde and DHA (pH > 9.5). The
pH reaction profile suggests that the carbohydrate undergoes proton ionization before reaction
with MV. Above pH 14, no additional reaction enhancement is observed and disubstituted
viologen degradation becomes significant. Running reactions with disubstitited viologen at pH
values at or below approximately 12 and temperatures below 60 oC minimize catalyst alteration.
Figure 3.2 shows that at MV/glucose ratios less than 2.0, MV turns over many times but
that the overall oxidation reaction of glucose by O2 is only approximately 35% complete. The
inefficiency is due to the presence of unreacted or inactive modified glucose. As the ratio
increases, the extent of glucose oxidation increases but the number of catalytic cycles of MV
decreases. The addition of more glucose to these low efficiency reactions results in oxidation of

49
the added glucose again to approximately 35%, demonstrating that the MV catalyst is still
functional but that part of the added glucose undergoes inactivation. At 10-12 MV per glucose
approximately 80% glucose oxidation occurs and under these conditions the MV only cycles
twice. The reactivity of glyceraldehyde and DHA parallels that of glucose but the reactions
occur more rapidly and at lower temperatures.
The results for glucose oxidation are not easily understood in terms of a simple catalytic
cycle. Our initial hypothesis was that the inefficiency is a thermodynamic consequence of
glucose being converted stepwise to more oxidized products with higher oxidation potentials that
are not as easily oxidized by MV as the parent glucose molecule. Higher concentrations of MV
would be required to shift the equilibrium in favor of MV reduction by these less reactive
glucose oxidation products. While such an explanation is reasonable, it does not account for all
of the observations and we sought additional explanations.
Figure 3.2 suggests that proton ionization from the sugar is required for reaction to occur.
If strong complex formation occurs between MV2+ and the glucose anion, or between MV2+ and
strongly anionic buffer components (HPO42-, PO4
3-, CO32-), then these electrostatic interactions
could effectively remove MV2+ from solution and additional MV2+ would be required to drive
the reaction toward completion. This explanation is consistent with the results in Figure 3.2 and
is also consistent with the observation that the addition of the soft I- ion to MV2+ causes
formation of an intensely yellow colored complex, suggesting complex formation [9].
Another explanation is that carbohydrate alteration is occurring by a reaction byproduct
generated during the reaction or by polymerization of carbohydrate, perhaps facilitated by the
presence of free radicals generated during reaction. Either type of inactivation must alter the
anomeric carbon of the carbohydrate, which is still visible in NMR spectra of reactions that have

50
gone to completion, because reaction with Benedict’s solution shows the absence of reducing
carbohydrate reactivity in the inactive product. In either case inactive carbohydrate is formed,
but how does increasing the MV/carbohydrate ratio prevent or overcome this inactivation and
increase the efficiency seen in Figures 3.2?
When the reaction is initiated, we propose that two reactions are possible: 1)
carbohydrate oxidation by MV, which can potentially completely oxidize carbohydrate to
formate and carbonate and 2) a MV- or hydroxide-promoted polymerization or inactivation
reaction that occurs simultaneously with carbohydrate oxidation [129]. As the MV/carbohydrate
ratio increases, the rate of carbohydrate oxidation appears to increase faster than inactivation.
Acceleration of carbohydrate oxidation decreases the extent of the inactivation reaction, until, at
high ratios, the carbohydrate oxidation approaches the prediction of Equation 2.3. This subject is
studied in more detail in Chapter 4.
Comparison of monoalkyl and dialkyl viologens: Monoalkyl and dialkyl viologens have
different advantages and disadvantages in their role as catalysts for the oxidation of
carbohydrates and in potential uses in carbohydrate fuel cells. These differences include the pH
regime in which each type is usable, differences in reaction rate, and coulombic efficiency.
Monoalkyl viologens are more stable in strong base. This behavior potentially makes
them more versatile for catalytic reactivity because they are able to catalyze carbohydrate
oxidation from approximately pH 11 to pH 14 and above. In contrast, dialkyl viologens slowly
hydrolyze to release alkyl groups in strong base and are only effective catalysts between pH 9
and 12.
Monoalkyl viologen appears to react with carbohydrates at approximately one-third the
rate for dialkyl viologen under identical conditions (Figure 3.5). The slower rate of catalysis by
51
monoalkyl viologens compared to their dialkyl analogues probably arises from two factors.
First, the monoalkyl viologens have only one quaternized positively charged center, whereas the
dialkyl viologens have two in their respective oxidized states. The two-fold greater positive
charge and the presence of two positive quaternized and reactive centers at each end of the
viologen structure likely facilitate interaction and subsequent oxidation of the negatively charged
endiol form of the carbohydrate by the dialkyl viologens. The second factor is that the dialkyl
viologens are stronger oxidants than the monoalkyl viologens, which implies a greater driving
force and an increased rate of oxidation by the dialkyl viologens compared to their monoalkyl
derivatives.
These differences in reactivity have consequences for the coulombic efficiency achieved
by either type of viologen catalyst. Due to slower reaction rates with monoalkyl viologen,
carbohydrate oxidation in a fuel cell could become less efficient, leading to unreactive
intermediates and a lower overall coulombic efficiency (Chapter 4). The oxidation of the
carbohydrate by dialkyl viologens is faster, so more of the carbohydrate follows the
formate/carbonate oxidation pathway and coulombic efficiencies are higher.
A disadvantage of using either the monoalkyl and dialkyl viologens as homogeneous
catalysts is that their catalytic efficiency varies with viologen/carbohydrate ratio [8, 10]. At low
ratios, both have higher coulombic efficiencies than are typically reported for metal-catalyzed
DCFCs (Table 3.2), but this efficiency at low ratios is relatively low compared the efficiency
seen at high ratios. The reason for this ratio-sensitive efficiency is elucidated in Chapter 4. To
provide high utilization of carbohydrate energy, operation of a fuel cell would require high ratios
of either monoalkyl or dialkyl viologens. Because monoalkyl viologens more slowly transfer

52
electrons from carbohydrates to the electrode, a higher ratio is required to compensate for this
slowness.
Conclusion 3.5
In summary, our results demonstrate that carbohydrates are readily oxidized by O2 in the
presence of various viologen catalysts at pH values of 9 to 14. The extent of carbohydrate
oxidation depends on the viologen/carbohydrate ratio with low ratios (less than 2.0) producing
oxidation efficiencies of 30-50% and higher ratios yielding efficiencies approaching 80%. A
wide variety of carbohydrates undergo this reaction as long as the anomeric carbon is free,
meaning that the enediol intermediate may be formed.
The results reported here are relevant to using various forms of viologens for fuel cell
applications. Monoalkyl viologens are functional as carbohydrate oxidation catalysts from
approximately pH 11 to over pH 14, whereas dialkyl viologens only function stably between pH
9-12. Within their stability ranges MMV and MV function for several hundred turn-over events
without undergoing any chemical modifications or loss in catalytic activity.
53
4 MECHANISTIC INSIGHTS FOR THE VIOLOGEN-CATALYZED OXIDATION OF CARBOHYDRATES
Introduction 4.1
The results reported in Chapter 3 indicate that the coulombic efficiency of viologen-
catalyzed carbohydrate oxidation increases at high catalyst ratios. Several possible reactivity
patterns were proposed to explain the low carbohydrate reactivity at low ratios. Prominent
among these was the possibility that the anomeric carbon of carbohydrates was altered by
reaction intermediates or that the carbohydrates had undergone polymerization forming
multimeric carbohydrates that were inactive. We have now examined a number of those initially
proposed explanations and report that the inefficiency noted earlier is due to the formation of
inactive intermediates, which prevent efficient oxidation of the parent carbohydrate.
The same methods described in Chapter 3 were employed to obtain the results presented
in this chapter, and the particular experiments described and the hypotheses tested here are in
part a product of the conclusions based on the data presented in Chapter 3. Though the subject
matter of this chapter and Chapter 3 is related, they are presented here as separate chapters
because they cover slightly different topics and were presented in separate publications.
As in Chapter 3, the sealed-vial and pressure-cell methods were used to estimate the
coulombic efficiencies with which test molecules were oxidized by test viologens. These
methods were used to examine hypotheses by testing model compounds and for testing the
effectiveness of viologens polymers in the oxidation of carbohydrates. Analysis of model-

54
compound and carbohydrate oxidation products was used to generate and confirm the
mechanism proposed for the oxidation. The microcoulometry experiments were used to obtain
rates of oxidation for different carbohydrates, and to compare anaerobic coulombic efficiencies
to the aerobic sealed-vial efficiencies.
The work presented in this chapter was undertaken in collaboration with Dr. Gerald Watt
of BYU and is based on a paper published in the journal Renewable Energy [10] in 2011. I
generated the idea of using model compounds to test the enediol hypothesis, participated in
testing those compounds, participated in analyzing the results, and, based on those results, helped
generate the proposed mechanism for the oxidation. I was not involved in making or testing the
viologen polymers as reported here. The data and conclusions based on the polymer data are
included for the sake of completion.
Materials and methods 4.2
4.2.1 Methods
Oxygen-uptake measurements were conducted using a Microlab Pressure Sensor
(Bozeman MT) or by the vial method as previously described in Chapter 3. Carbohydrate and
viologen species were identified by MS (Agilent LC/MSD TOF) and by 13C NMR (Inova 300).
Microcoulometry was conducted as described in Chapter 3.
4.2.2 Materials
13C labeled glucose, 99-atom % (Sigma-Aldrich, St. Louis, MO) and glyceraldehyde, 98-
atom % (Micron Biochemicals, Indianapolis, IN) were used to identify reaction products.
Formate (171 ppm), carbonate (168 ppm), carboxylic acids (~180 and ~20 ppm and 13C1 of

55
glucose 96 and 98 ppm for C1 carbon) were well-separated resonances used for identification as
reported in Chapter 3. Reactions were conducted in 0.50 M phosphate buffer at pH 11 as in
Chapter 3. Glycoaldehyde, acetoin, dihydroxy acetone (DHA), monohydroxy acetone (MHA),
glyceraldehyde, glucose and methyl (MV) and ethyl (EV) viologens were purchased from Sigma.
Polymer synthesis followed the procedures outlined in [9] and the text related to Table 4.1
outlines the polymers used.
Results 4.3
4.3.1 Viologen polymers
The results reported in Chapter 3 demonstrated that viologens can effectively catalyze the
oxidation of various carbohydrates and that the coulombic efficiency (where ηcoul = n/nideal, as
described in Chapter 2) increases with increasing viologen/carbohydrate ratio to an efficiency of
greater than 80%. 100% coulombic efficiency is defined as complete oxidation of a
carbohydrate to CO2 and H2O. We initially proposed that high catalyst ratios favored
carbohydrate oxidation by minimizing secondary reactions, which formed unreactive
intermediates such as carbohydrate polymers, alcohols, simple aldehydes and carboxylic acids.
By minimizing these secondary reactions, carbohydrate oxidation efficiency would be enhanced.
To test this hypothesis, we synthesized the three polymers listed in Table 4.1 (two of those
polymers were also tested after they were immobilized on graphite). The rationale was that
polymers would create a high, localized concentration of reactive viologen catalyst, which would
simulate the behavior at high ratios and enhance catalytic efficiency.

56
Table 4.1 Coulombic efficiency (%) of carbohydrate oxidation conducted by polymeric viologens and MV.
Carbohydrate Polymer 1 2 3 2-immob. 3-immob. MV monomer glyceraldehyde 56.5 65.3 50.8 50.3 49.7 42.4 glucose 46.0 45.5 44.0 44.9 34.0 DHA 59.2 50.2 58.8 47.1
Polymer 1 is in-chain polymerized trimethylene viologen; polymer 2 is benzyl viologen
appended to a polystyrene chain; polymer 3 is phenyl viologen appended to polystyrene chain,
and are seen in Figure 4.1. Polymers 2 and 3 were tested as free polymers (columns 3 and 4) and
were also tested after being immobilized on graphite (columns 5 and 6). Free polymer 3 had
limited solubility and immobilized polymers 2 and 3 were bound to insoluble substrates and
therefore all formed heterogeneous solutions.
Figure 4.1 Viologen polymers.
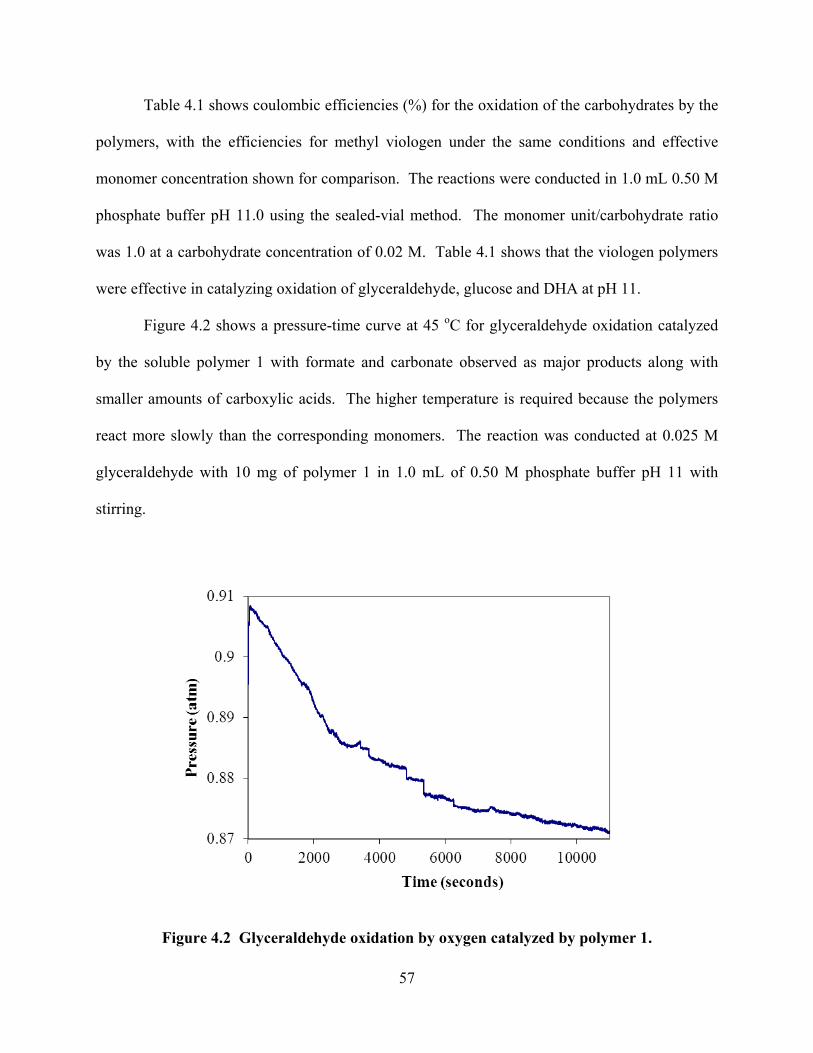
57
Table 4.1 shows coulombic efficiencies (%) for the oxidation of the carbohydrates by the
polymers, with the efficiencies for methyl viologen under the same conditions and effective
monomer concentration shown for comparison. The reactions were conducted in 1.0 mL 0.50 M
phosphate buffer pH 11.0 using the sealed-vial method. The monomer unit/carbohydrate ratio
was 1.0 at a carbohydrate concentration of 0.02 M. Table 4.1 shows that the viologen polymers
were effective in catalyzing oxidation of glyceraldehyde, glucose and DHA at pH 11.
Figure 4.2 shows a pressure-time curve at 45 oC for glyceraldehyde oxidation catalyzed
by the soluble polymer 1 with formate and carbonate observed as major products along with
smaller amounts of carboxylic acids. The higher temperature is required because the polymers
react more slowly than the corresponding monomers. The reaction was conducted at 0.025 M
glyceraldehyde with 10 mg of polymer 1 in 1.0 mL of 0.50 M phosphate buffer pH 11 with
stirring.
Figure 4.2 Glyceraldehyde oxidation by oxygen catalyzed by polymer 1.
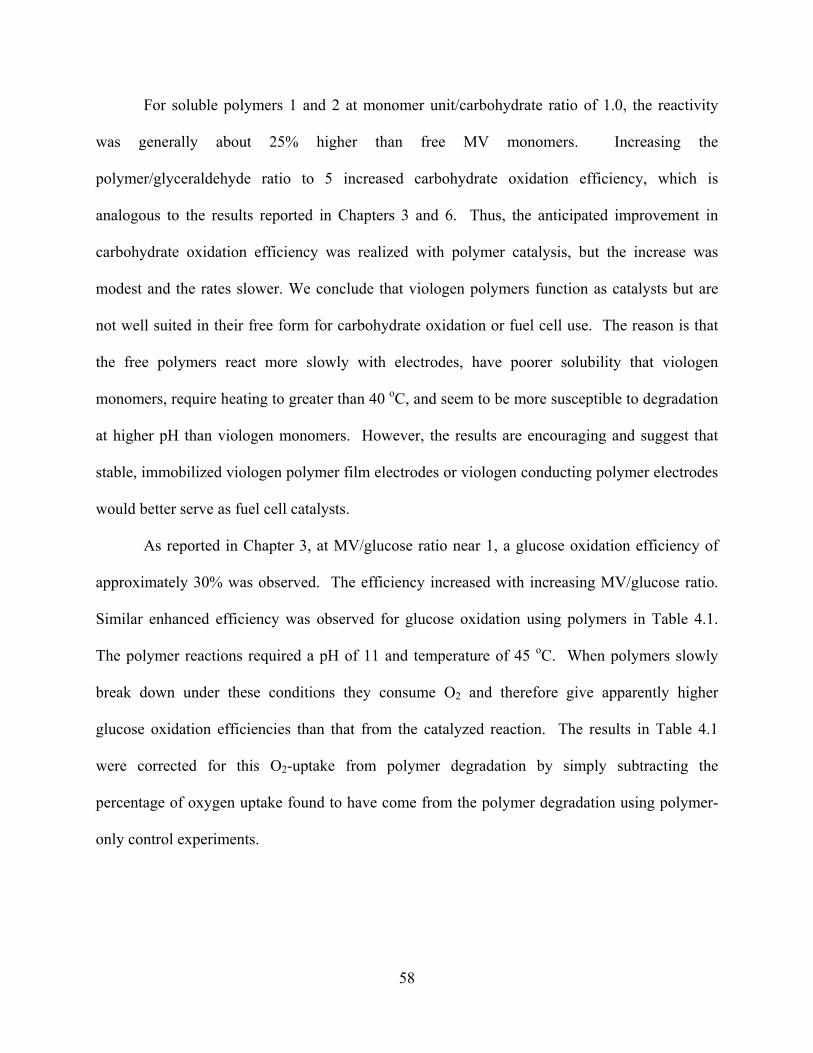
58
For soluble polymers 1 and 2 at monomer unit/carbohydrate ratio of 1.0, the reactivity
was generally about 25% higher than free MV monomers. Increasing the
polymer/glyceraldehyde ratio to 5 increased carbohydrate oxidation efficiency, which is
analogous to the results reported in Chapters 3 and 6. Thus, the anticipated improvement in
carbohydrate oxidation efficiency was realized with polymer catalysis, but the increase was
modest and the rates slower. We conclude that viologen polymers function as catalysts but are
not well suited in their free form for carbohydrate oxidation or fuel cell use. The reason is that
the free polymers react more slowly with electrodes, have poorer solubility that viologen
monomers, require heating to greater than 40 oC, and seem to be more susceptible to degradation
at higher pH than viologen monomers. However, the results are encouraging and suggest that
stable, immobilized viologen polymer film electrodes or viologen conducting polymer electrodes
would better serve as fuel cell catalysts.
As reported in Chapter 3, at MV/glucose ratio near 1, a glucose oxidation efficiency of
approximately 30% was observed. The efficiency increased with increasing MV/glucose ratio.
Similar enhanced efficiency was observed for glucose oxidation using polymers in Table 4.1.
The polymer reactions required a pH of 11 and temperature of 45 oC. When polymers slowly
break down under these conditions they consume O2 and therefore give apparently higher
glucose oxidation efficiencies than that from the catalyzed reaction. The results in Table 4.1
were corrected for this O2-uptake from polymer degradation by simply subtracting the
percentage of oxygen uptake found to have come from the polymer degradation using polymer-
only control experiments.

59
4.3.2 Enhanced efficiency at high viologen/carbohydrate ratios
To explain enhanced efficiency with increasing catalyst ratio, we initially proposed that
carbohydrates were inactivated by polymerization or by adduct formation at the anomeric
carbon. Conducting reactions at intermediate levels of oxidation at various MV/glucose ratios,
did not lead to the identification of dimers, trimers or higher multimers of glucose; nor did MS
show any adducts of glucose formed by alteration of the anomeric carbon. These results indicate
that polymerization and adduct formation are not major routes for glucose inactivation.
When examined by 13C NMR, formate and carbonate were dominant 13C-containing
species, but using 13C-enriched glucose at all carbon atoms, a number of smaller species were
observed. The spectra were complicated because several related species were present, but
carboxylic acid groups were easily identified (around 180 ppm). Instead of higher adducts or
multimers causing decreased glucose oxidation efficiency at low ratios, the formation of smaller
species (carboxylic acids), that are not reactive toward viologen-catalyzed oxidation cause the
low efficiency at low ratios. Simple aldehydes, carboxylic acids or α-hydroxy carboxylic acids
are not reactive under the same conditions as viologen-catalyzed carbohydrate oxidation.
The catalytic oxidation of glucose is slower than that of glyceraldehyde and other
carbohydrates, possibly due to ring opening, which allowed monitoring of product formation by
13C NMR during glucose oxidation at a 1:1 ratio. Figure 4.3 shows the product distribution of
formate, carbonate and carboxylic acids as a function of time. The reaction conditions were of
0.015 M 13C1-labeled glucose, 0.015 M MV in 1.0 mL of 0.50 M phosphate buffer pH 11.0.
Glucose decreases to near zero in approximately 3 hours but the other three products
continue to increase up to approximately 12 hours, after which they remain constant. This is
consistent with glucose being sequentially oxidized to shorter chain carbohydrates (pentose,

60
tetrose, etc.), which in turn undergo oxidation forming formate, carbonate and small amounts of
carboxylic acids until carbohydrate oxidation is complete. The trend for carboxylic acids is only
approximate because different carboxylic acids are formed at different times during the reaction
and mixtures are always present. At MV/glucose ratios greater than 1.0, formate and carbonate
increase and carboxylic acids decrease in concentration giving an overall increase in efficiency
of glucose oxidation as observed.
Figure 4.3 Species distribution from the MV-catalyzed oxidation of 13C-labeled glucose determined by 13C NMR. Each point is the average from two independent reactions. Line are a guide to the eye.
4.3.3 Model compounds
pH profiles for catalytic O2-oxidation of both glyceraldehyde (pK = 9.5) and glucose (pK
= 10.5) suggested that proton ionization preceded catalytic oxidation. Such ionization would
produce a negatively charged enediol from carbohydrates containing terminal aldehydes. We
hypothesized that the enediol is the reactive form of the carbohydrate that interacts with the

61
MV2+, which then initiates catalytic oxidation of the carbohydrate. To test this hypothesis, we
examined simpler molecules that only form a single enediol instead of the more complex
carbohydrates of glyceraldehyde and glucose.
Glycoaldehyde reactivity: Glycoaldehyde (CH2OH-CHO) is the simplest structure that
can form an enediol. Complete oxidation of glycoaldehyde by oxygen is given by Equation 4.1,
which shows that two O2 are required to form carbon dioxide with transfer of 8 electrons to O2.
Equation 4.2 shows that two formic acids form by partial oxidation with transfer to O2 of only 4
electrons. At pH 11, where the reactions were conducted, carbon dioxide forms carbonate and
formic acid forms formate but this does not affect the electron count.
C2H4O2 + 2 O2 = 2 CO2 + 2 H2O, 8 e- (4.1)
C2H4O2 + O2 = 2 HCO2H, 4 e- (4.2)
Based on the oxygen uptake seen in Figure 4.4, is was estimated that the oxidation of
glycoaldehyde at room temperature using EV (same result with MV) as catalyst at a 1:1 ratio
only goes to approximately 50-60% completion. The reaction consisted of adding 0.025 M
glycoaldehyde to 0.025 M EV in 1.0 mL of 0.50 M phosphate buffer pH 11.0. The change in
pressure corresponds to a 55% (4.4 electrons) efficiency of glycoaldehyde oxidation. Formate
was the dominant 13C-containing product. The slowness of the reaction is due to transport of O2
into the aqueous solution because the reaction between glycoaldehyde and MV is nearly
instantaneous. The reaction products were formate and only small amounts of carbonate.
When the reaction was carried out at a 15:1 catalyst ratio, there was no enhancement in
the extent of reaction, contrary to previous results for glyceraldehyde and glucose. This result
62
indicates that the catalytic efficiency for glycoaldehyde was at a maximum at a 1:1 ratio, forming
formate as product. A control reaction in the absence of MV or EV gave less than 5% oxidation
under identical conditions. These results demonstrate that EV or MV dramatically increases the
rate of glycoaldehyde oxidation to form formate.
Figure 4.4 The change of pressure for the EV-catalyzed oxidation of glycoaldehyde.
An approximately 50-60% utilization of O2 by glycoaldehyde corresponds to the transfer
of 4.0-4.8 electrons to O2 with formation of formate and smaller amounts of carbonate as shown
in Equation 4.2. In the absence of additional constituents on glycoaldehyde, the reaction
terminates with formation of formate and is independent of MV/glycoaldehyde ratio. Glycol,
acetal, acetate or α-hydroxy acetate did not undergo MV-catalyzed oxidation under the same
conditions, demonstrating that a carbonyl group and an adjacent hydroxy group are required for
MV-catalyzed oxidation.

63
3-hydroxy-2-butanone (acetoin): Acetoin is similar to glycoaldehyde but has two methyl
groups flanking the glycoaldehyde structure but should still form a simple enediol like
glycoaldehyde. At room temperature, acetoin undergoes MV-catalyzed oxidation by O2 about 10
times slower than glycoaldehyde, so the reaction was conducted at 45 oC to accelerate the rate.
Equation 4.3 represents complete oxidation of acetoin to CO2 and Equation 4.4 represents partial
oxidation.
C4H8O2 + 5 O2 = 4 CO2 + 4 H2O, 20 e- (4.3)
C4H8O2 + 2 O2 = CH3COOH +CO2 + HCOOH, 8 e- (4.4)
Complete oxidation of acetoin requires 5 O2 and liberates a total of 20 electrons.
However, when catalyzed by MV only 40% oxidation of the acetoin is achieved, which is like
glycoaldehyde but unlike glyceraldehyde and glucose. The major oxidation products were
formate and acetate and small amounts of carbonate. From the products formed and the O2-
uptake, we conclude that Equation 4.4 represents the MV-catalyzed O2-oxidation of acetoin.
However, this reaction appears to be more complex because at its conclusion, the solution is a
light red brown color, whereas the reaction with glycoaldehyde and other carbohydrates is
colorless to pale yellow. The color intensifies with increasing ratio, suggesting possible
modification of the catalyst during reaction. However, this effect must be minimal because the
MV catalyst responds to subsequent additions of acetoin and NMR and MS do not show
modified MV.
DHA and MHA: DHA and MHA are related to glyceraldehyde, except DHA has two
hydroxy groups flanking a ketone group and MHA has one. DHA and MHA gave efficiencies

64
approximately 50% and 40% at a 1:1 ratio, respectively. The reactivity of DHA is greater than
glyceraldehyde which is greater than MHA, but all gave similar 13C product distributions,
consisting mainly of formate and carbonate with small amounts of α-hydroxy acetate. The
efficiency of DHA and MHA oxidation increases as a function of increasing MV ratio, indicating
high oxidation efficiency also can be achieved at high MV/DHA, MHA ratios. In this respect,
they differ from glycoaldehyde and acetoin, whose oxidation efficiencies are unresponsive to the
catalyst ratio. The additional hydroxy group(s) on DHA and MHA changes their reactivity and
allows them to undergo more extensive oxidation.
From O2-uptake, the product distribution, and an examination of Equation 4.5-4.7, we
conclude that Equations 4.6 most closely represents the major reaction (66.6% predicted
efficiency vs. approximately 50% observed) with smaller contributions from Equation 4.7.
Equation 4.5 gives the expected result for complete oxidation of glyceraldehyde or DHA by O2
for 100% efficiency. Equations 4.6 and 4.7 describe partial oxidation reactions and show the
corresponding number of electrons transferred to O2.
C3H6O3 + 3O2 = 3CO2 + 3H2O, 12e (4.5)
C3H6O3 + 2O2 = CO2 + 2HCOOH + H2O, 8e (4.6)
C3H6O3 + 3/2O2 = CO2 + C2H3O2 + H2O, 6e (4.7)
4.3.4 Anaerobic vs. aerobic reactions
Results reported in Chapter 3, and those reported here, measured O2-uptake during
viologen-catalyzed carbohydrate oxidation by atmospheric O2. To rule out nonspecific O2-
oxidation of possible O2-sensitive oxidized carbohydrate intermediates, reactions were conducted
anaerobically using controlled potential coulometry to oxidize reduced viologen at electrodes

65
instead of by O2. This reactivity would parallel the conditions occurring in a fuel cell because
the anodic compartment where carbohydrates are oxidized is anaerobic. This coulometry
experiment is more fully explained in Chapter 3.
Figure 4.5 shows the results for electrochemical oxidation of DHA, glyceraldehyde and
glycoaldehyde. The coulometric cell contained 2.0 mL of 0.50 M phosphate buffer pH 11.0 with
1.0 mM MV and was set at a controlled potential of -400 mV vs. the SCE until the current
stabilized near 0.0 mA. DHA (1.00 mmol), glyceraldehyde (0.85 mmol) and glycoaldehyde
(1.00 mmol) were then added separately and the current-time curves for each were integrated to
determine the charge transferred to the electrode during carbohydrate oxidation.
Figure 4.5 MV-catalyzed, controlled potential oxidation of DHA, glyceraldehyde and glycoaldehyde.
66
The overall shapes of the curves represent the reactivities of these three carbohydrates
toward the MV catalyst. The initial steepness of the curves is the rate of carbohydrate oxidation
by viologen. However, the peak current represents the brief pseudo-steady-state rate for
carbohydrate reduction of viologen balanced by the rate of electrode oxidation of reduced
viologen. The peak currents in Figure 4.5 give the relative carbohydrate oxidation rates as: DHA
(2.7), glycoaldehyde (1.7) and glyceraldehyde (1.0). The areas under the curves give the total
coulombs for each reaction from which the number of electrons removed from each carbohydrate
was calculated. DHA is oxidized by 6.0 (5.6), glycoaldehyde by 3.7 (4.0) and glyceraldehyde by
3.9 (4.8) electrons, where the value in parenthesis is the extent of oxidation in air at the 1/1 ratio
used. Thus, the anaerobic electrochemical oxidation is comparable with O2-oxidation for all
carbohydrates but is smallest for glyceraldehyde, suggesting that in the presence of air some non-
catalyzed oxidation of glyceraldehyde or its oxidation products is occurring. This is not a
problem during fuel cell operation because the anodic compartment of the fuel cell is anaerobic.
These results validate results of the more convenient O2-uptake experiments that measure the
reaction characteristics of viologen-catalyzed carbohydrate oxidations.
Discussion 4.4
Using 13C labeled glyceraldehyde and glucose demonstrated the presence of smaller
oxidation products formed from carbohydrates during MV-catalyzed oxidation that were
previously unobserved because of their low natural abundant 13C concentrations. 13C NMR and
MS analysis have combined to show that oligomerization and modification of carbohydrates at
their anomeric carbon are not the cause of inefficient carbohydrate oxidation catalyzed by methyl
viologen as suggested in Chapter 3. Instead, formation of oxidized intermediates that are either
kinetically or thermodynamically unable to undergo MV-catalyzed oxidation cause low
67
efficiencies. Thus, a strategy to prevent formation of these unreactive intermediates would
increase carbohydrate oxidation efficiency and drive the reaction to form carbonate and formate.
Results reported in Chapter 3 showed that the oxidation efficiency could be increased by
increasing the catalyst/carbohydrate ratio to greater than 10. It is not desirable to have such a
high ratio of catalyst present and alternate means for bypassing unreactive intermediates were
sought. The approach reported here of using viologen polymers to effectively increase the
localized concentration of reactive viologen units and thereby decrease formation of unreactive,
oxidized carbohydrate intermediates is clearly a productive route by showing polymers enhanced
oxidation efficiency by approximately 25%. Viologen films on metallic electrodes or viologen-
conducting polymeric electrodes offer greater promise than polymeric suspensions or soluble
polymer catalysts. This is because inherent problems of polymer diffusion to and from
electrodes and polymer-electrode contact of homogeneous polymeric catalysts all pose difficult
and limiting problems.
4.4.1 Mechanistic considerations
The results reported here allow us to suggest a series of mechanistic steps outlining how
MV and other viologens facilitate carbohydrate oxidation. First we note that simple aldehydes,
carboxylic acids, alcohols or α-hydroxy carboxylic acids do not undergo MV-catalyzed O2-
oxidation at appreciable rates under conditions where carbohydrates readily react. Carbohydrates
with constituents on the anomeric carbon (hemiacetals) are also unreactive, supporting the view
that oxidation begins at the carbohydrate anomeric carbon. The slower reactivity of the hexose
and pentose forms could be because these two species exist mainly as cyclic structures, which
must revert to their linear forms before reaction can occur. Tetroses and trioses do not form the
ring structure and so react directly and more rapidly as the linear form.

68
pH values of 10 or greater are required before carbohydrates undergo oxidation,
suggesting that carbohydrates must undergo proton ionization before MV-catalyzed oxidation.
Such ionization would occur at the anomeric carbon, forming an enediol between carbons 1 and
2.
The following mechanism is diagrammed is Figure 4.6. We propose that MV2+ reacts at
the enediol and initiates oxidation sufficient to convert carbon 1 to formate or carbonate with
formation of a pentose from a hexose. The pentose, in enediol form, undergoes another
oxidation step similar to that of the hexose and forms formate or carbonate and a tetrose. This
step-wise process continues until the triose finally undergoes oxidation to form glycoaldehyde.
This stepwise process can also be halted at any step due to the formation of a carboxylate, as
described below and illustrated in Figure 4.6 by the formation of a carboxylate group at the
pentose stage. Oxidation cannot continue to form another hydroxy aldehyde and the reaction
sequence changes. Glycoaldehyde forms an enediol, which provide a reaction site for oxidation
by MV, but formation of another hydroxy aldehyde by oxidation cannot occur and the MV-
catalyzed oxidation of glycoaldehyde terminates with formation of formaldehyde (Equation 4.2).
For glyceraldehyde, DHA and MHA, the presence of additional hydroxy groups allows
the reaction to proceed to glycoaldehyde, which is oxidized to formate. The oxidation of the
pentose and tetrose intermediates would also culminate in glycoaldehyde with oxidation to
formate. For this idealized reaction scheme, formate is always produced as an end product of
viologen-catalyzed carbohydrate oxidation via glycoaldehyde.
Under actual reaction conditions alternate pathways to the proposed stepwise mechanism
could be taken, which would change carbohydrate oxidation behavior. Using glucose as an
example, if oxidation of the anomeric carbon were incomplete and formed gluconic acid, the

69
reaction would stop. However, if oxidation released formate or carbonate and formed a pentose,
the pentose could continue to undergo reaction resulting in a tetrose and this reactivity could
continue down the carbohydrate chain without interruption. However, formation of unreactive
intermediates at any point breaks the reaction sequence and terminates carbohydrate oxidation.
Figure 4.6 Schematic of the proposed mechanism for the oxidation of glucose catalyzed by viologen.

70
At a given MV/carbohydrate ratio, the variability in oxidation efficiency can be
attributable to uncontrolled alternate reaction pathways forming unreactive intermediates. This
view explains previous results for glucose and other carbohydrates that show that increasing the
viologen/carbohydrate ratio increases carbohydrate oxidation efficiency. It is also consistent
with previous results showing that 13C6 labeled glucose forms 13C labeled formate and some
carbonate. Oxidation at C6 of glucose only occurs as a last step in the sequence outlined above
and requires that glucose be completely oxidized to 13C formate and lesser amounts of carbonate.
The above interpretation suggests that if MV2+ is always present in excess in order to
accept electrons, the reaction can proceed smoothly from hexose to pentose through to glycolate
and then formate. If MV is limiting, reactive intermediates cannot transfer electrons rapidly
enough to MV and will decay or rearrange to unreactive intermediates, which terminates the
reaction sequence. Thus, efficient O2-reoxidation of reduced MV during MV-catalyzed
carbohydrate oxidation by air or fuel cell electrodes, during fuel cell operation, is required to
maintain an excess of oxidized MV and prevent formation of inactive intermediates, which lower
carbohydrate oxidation efficiency.
The use of polymeric viologens to mimic high, localized concentrations of viologen
monomers is a viable approach to creating viologen catalysts for enhanced carbohydrate
oxidation efficiency at lower catalyst/carbohydrate ratios. The enhanced efficiency of polymers
is explained by formation of high, localized concentrations of viologen species that rapidly
oxidize carbohydrates before unreactive intermediates can form. The use of polymeric catalysts
should improve fuel cell function but must be in a form other than free-polymers suspension to
minimize diffusion problems and ineffective polymer-electrode contact. Viologen polymers

71
bonded directly to metallic or carbon electrodes should be most effective for future fuel cell
designs.
Conclusions 4.5
Viologen-catalyzed oxidation of carbohydrates occurs by a step-wise, single-carbon
oxidation mechanism beginning at the anomeric carbon and continuing down the carbohydrate
chain to glycoaldehyde. Glycoaldehyde is oxidized exclusively to formate terminating
carbohydrate oxidation. High carbohydrate oxidation efficiency requires excess catalyst to avoid
formation of unreactive carboxylic acid intermediates. Polymeric viologens or polymeric films
can be used to increase carbohydrate oxidation efficiency.
73
5 CYCLIC VOLTAMMETRY INVESTIGATION OF VIOLOGENS, INDIGO CARMINE, AND METHYLENE BLUE FOR USE AS CATALYSTS IN DIRECT CARBOHYDRATE FUEL CELLS
Introduction 5.1
As seen in Chapters 2 and 3, viologens can be categorized in two types: disubstituted and
monosubstituted. Disubstituted viologens have been extensively studied [64-74], while
monosubstituted viologens have received relatively little attention. As reported in Chapter 3,
monosubstituted viologens are more stable in strong base, and they appeared to have a more
favorable redox potential compared to their analogous disubstituted viologens. Based on the
results presented in Chapter 3 that show that monosubstituted viologens appear to have similar
catalytic activity towards carbohydrates as disubstituted viologens, and based on the superior
qualities of monosubstituted viologens mentioned above, we were led to investigate the
monosubstituted viologens for a better understanding of their suitability for fuel cell use. In
addition, researchers have looked at two redox dyes, indigo carmine (IC) and methylene blue
(MB), for use in DCFCs [12, 75]. These two dyes were also examined with cyclic voltammetry
and a comparison between all the investigated catalysts is made.
This investigation mainly focused on an electrochemical comparison, through cyclic
voltammetry (CV), of the monosubstituted viologens, their analogous disubstituted viologens,
and IC and MB. Cyclic voltammetry was chosen primarily for two reasons. One is that the
method is commonly used to determine half-wave redox potentials (E1/2) [9], which means we
can compare our results to those in the literature. The other reason is that CV can be used to

74
quantify electrochemical processes that are limited by finite rates of electron transfer [123],
given by the heterogeneous electron-transfer rate constant (ket).
In a DCFC catalyzed by viologen or another redox dye, the redox value of the catalyst
species plays an important role in the voltage efficiency (ηvolt = ∆E/∆Eideal, as discussed in
Chapter 2). Some of the chemical potential of the electrons in the carbohydrate fuel is used to
reduce the catalyst species (the amount of which is the difference in redox potential between the
carbohydrate fuel and the catalyst species). Therefore, the redox potential of the catalyst, and not
of the carbohydrate being oxidized, determines the open circuit voltage (∆EOCV) of the cell. The
open circuit voltage represents the maximum chemical potential of the electrons obtained by the
cell. In a viologen catalyzed cell, once the viologen is reduced, the ∆E, and thus ηvolt, obtained
by the cell during operation, depends in part on the behavior of the viologen-controlled anode as
current is drawn, which is part of the subject matter covered in Chapter 6.
It is likely that, to make a practical DCFC, the water-soluble catalysts investigated here
must be immobilized on a surface. Our ongoing immobilization efforts involve attaching the
viologen to a carbon substrate by alkyl chains. To inform such immobilization efforts, a series of
four monoalkyl viologens was investigated, as were two aminoalkyl viologens. For the
monoalkyl viologens, we assessed the variation in the redox potential as the length of the alkyl
chain changed. The aminoalkyl viologens were investigated because they can potentially be
immobilized at a surface via their amino end.
The mechanism for the reduction of disubstituted viologens is understood to follow two
successive steps, as seen in Equations 5.1 and 5.2, with ethyl viologen (EV) being used for a
generic disubstituted viologen.

75
EV2+ + e- = EV1+ (5.1)
EV1+ + e- = EVo (5.2)
The initial one-electron reduction (Eq. 5.1) represents the reversible reduction of the EV2+
dication to the EV1+ radical cation (for EV this redox step is identified as EV-1 in this paper). A
one-electron reduction of the EV1+ radical cation (Eq. 5.2) results in the formation of the EVo
neutral species (identified as EV-2). Relative to EV-1, the EV-2 step always occurs at a more
negative redox potential.
Monosubstituted viologens only undergo one reversible reduction. With monoethyl
viologen (MEV) as a generic monosubstituted viologen, the reduction reaction is presented in
Equation 5.3. It is apparent that the cation/neutral redox step for the disubstituted viologens (Eq.
5.2) is analogous to the one reversible redox step seen for monosubstituted viologens, which is
also a redox step between cation and neutral forms.
MEV1+ + e- = MEVo (5.3)
Experimental methods 5.2
5.2.1 Materials
Methyl viologen, ethyl viologen, KOH, KCl, tetrabutylammonium hexafluorophosphate
(TBAPF6), tetrabutylammonium chloride (TBACl), 4,4’-bipyridine, methyl iodide, and
bromopropylamine + HBr were obtained from Sigma and used without purification. Indigo
carmine and methylene blue were the certified biological stains as supplied by Fisher Scientific.
The monosubstituted viologens and aminoviologens tested were synthesized in house as

76
described in the section below. Acetonitrile (ACN) and dimethyl sulfoxide (DMSO) were
obtained from Sigma and used without purification. All aqueous solutions were made with 18.2
MΩ Milli-Q water.
5.2.2 Synthesis of mono- and aminoviologens
The monoalkyl viologens were synthesized as described in Chapter 3. After the
monoalkyl viologen was cleaned, a small amount of the remaining substance, approximately
0.75%, was dialkyl viologen. The dialkyl viologen does not appear to affect the cyclic
voltammetry results seen for the monoalkyl viologen. No dialkyl peaks are seen, and in any
case, the dialkyl and monoalkyl peaks do not overlap.
N-methyl-N’-(3-aminopropyl)-4,4’-bipyridinium (methylaminopropyl viologen, MAV)
was prepared in two steps, in a modification of the method of Katz [130]. First, 1-methyl-4-(4’-
pyridyl)-pyridinium iodide (monomethyl viologen, MMV) was obtained by reaction of 1.92 g
(12 mmol) of 4,4’-bipyridine with 1.76 mL (28 mmol) of methyl iodide in acetone. The 4,4’-
bipyridine was first dissolved in acetone in a turtle-neck flask. Then, methyl iodide was added
dropwise while the solution was stirred. The reaction mixture was stirred for 8 hours under
nitrogen at 60 oC. The light-orange precipitate was filtered and washed with acetone twice to
remove unreacted 4,4’-bipyridine. The product was 3.35 g (40%) of MMV with a melting point
above 300 oC. In the second step, 3.35 g (11 mmol) of MMV and 4.26 g (19 mmol) of
bromopropylamine + HBr were placed in 25 mL of dry methanol and the mixture was stirred at
60 oC for 48 hours [130]. The precipitate was filtered and washed with pure ethanol and yielded
1 g (12%) of product. We did not carry out the recrystallization step of the product from water,
and this may have caused the much lower yield compared with the 70% yield reported by Katz
et.al. The final product was pure MAV.

77
N-(3-aminopropyl)-4,4’-bipyridinium (aminopropylviologen, APV) was obtained by
reacting 0.219 g (1 mmol) of bromopropylamine + HBr with 0.468 g (3 mmol) of 4,4’-bipyridine
in dry acetonitrile at 75 oC for two days with stirring. The white product species precipitated
from the solution mixture. The mixture was filtered and washed with dry acetonitrile to remove
any unreacted 4,4’-bipyridine. The product was 0.293 g with essentially 100% yield. The
monosubstituted viologen produced by this process was nearly pure APV, with no detectable
trace of the disubstituted viologen. The purity of the synthesized viologens was verified using
NMR spectroscopy.
5.2.3 Apparatuses and procedures
Overview of cyclic voltammetry: Cyclic voltammetry (CV) is an electrochemical analysis
technique. CV can be used to estimate redox potential(s), to estimate heterogeneous electron-
transfer rate constants, and to estimate diffusion coefficients of the test species. CV is done with
the three-electrode setup, as described in Chapter 2. The test species may be in solution or
attached to the working electrode.
The chemical potential of the electrons in the working electrode is controlled by the
potentiostat relative to the reference electrode. This potential is scanned in time in the form of a
triangle wave, back and forth from more negative to more positive values. The more negative
the relative potential, the higher the relative energy state of the electrons in the working
electrode, and vice versa. Electrons are more likely to be found at lower energy states, so when
the chemical potential of the electrons is higher in the working electrode than it would be in the
test species, the electrons will reduce the test species, causing current to flow. This current is
detected by the potentiostat. The values at which the electrons flow from the working electrode
78
into the test species and from the test species to the working electrode are used to determine the
redox potential(s) of the species.
Cyclic voltammetry parameters: The cyclic voltammetry measurements were performed
with a Gamry PC4/750 Potentiostat, and the software used in the analysis of the CV data was the
Gamry Echem Analyst version 1.10. The instrument has a precision range of the range of ±5
mV. The data presented here were recorded at scan rates of 0.05, 0.08, 0.2, and 0.4 V s-1.
The platinum working electrode (1.6 mm diameter) used in the CV tests was cleaned by
rinsing it with 2 N nitric acid, followed by multiple rinses with Milli-Q water, between runs to
remove any contamination. For the CV tests in ACN or DMSO, the electrode was dried and then
rinsed twice with ACN. After rinsing, the electrode was dried and polished on qualitative-grade
filter paper [131]. The counter electrode was high-surface-area platinum gauze.
The AgCl reference electrode used in the CV tests was made by anodizing a silver wire in
1 M KCl at 2 V for 10 minutes [122]. The reference electrode solutions used were 3 M KCl for
aqueous tests, 0.1 M TBACl in ACN for the ACN tests, and 0.1 M TBACl in DMSO for the
DMSO tests. All reference electrode solutions were saturated with AgCl. The solution in the
reference-electrode compartment was changed daily and the reference electrode wire was
refreshed (anodized) regularly to ensure stability.
For our tests, 10 mL of test solution was placed in a 30 mL glass jar. The lid to the jar
had fitted holes for insertion of the electrodes and for the nitrogen to be bubbled through the
solution, or for a nitrogen blanket to be maintained. The test solution was further isolated from
atmospheric oxygen by placing the jar in a resealable plastic bag. Through the small holes
intrinsic to the setup, the nitrogen was able to escape, but the positive pressure in both the jar and
the bag kept the oxygen concentration to a minimum. The test solutions were purged of oxygen
79
by bubbling solvent-saturated nitrogen into the cell for 30 minutes, and a solvent-saturated
nitrogen blanket was maintained over the test solution during tests. The flow rate of nitrogen
was adjusted until no change was seen in the resulting voltammograms with increasing nitrogen
flow rate. Reduced viologens are extremely sensitive to the presence of oxygen and a fairly
vigorous flow of nitrogen was require for our setup to ensure no oxygen was present and correct
results were obtained.
5.2.4 Test Solutions
The electrolytes used in the aqueous test solutions (whether of viologen, IC, or MB)
depended on the species being tested and are detailed individually below, though the electrolyte
anion was always 0.1 M Cl-. All cyclic voltammetry tests done in ACN and DMSO were run
with 0.1 M TBAPF6 as the electrolyte. ACN and DMSO were used as solvents in addition to
water, in part, because they are electrochemically stable at the potentials used in the tests and
because one or both solvate all the test species.
Viologen solutions: To assist the reader and reduce confusion, Table 5.1 contains a list of
abbreviations that are used for the tested viologen species. Table 5.1 also provides their level of
substitution (mono- or di-), and the anion or anions of the respective viologens. Corresponding
representative structures can be found in Figure 5.1.
Water is the solvent of choice for the intended fuel cell application of viologens, but the
redox potentials of the monoalkyl viologens were found to be near the redox potential of water at
pH 7. The reduction of water at the working electrode that occurred during testing at pH 7
caused interference with the CVs. The reduction potential of water is pH dependent, so to obtain
clearer cyclic voltammograms the monoalkyl viologens were run in 1 M KOH with 0.1 M KCl,
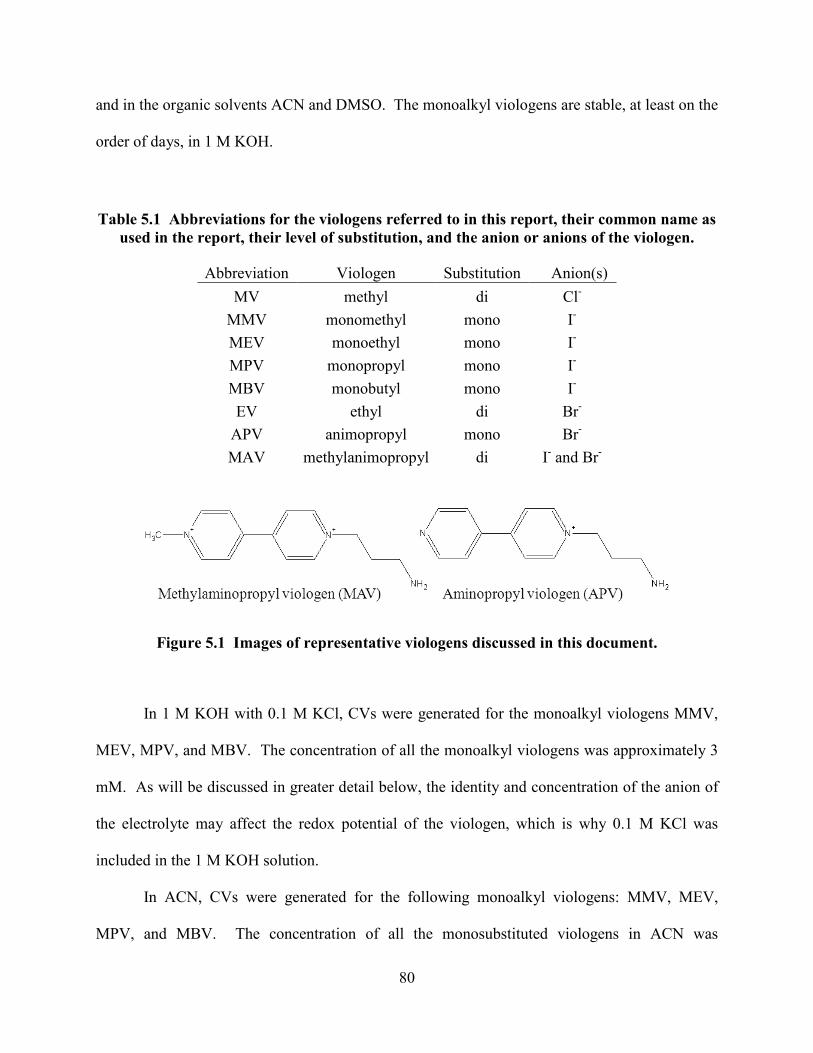
80
and in the organic solvents ACN and DMSO. The monoalkyl viologens are stable, at least on the
order of days, in 1 M KOH.
Table 5.1 Abbreviations for the viologens referred to in this report, their common name as used in the report, their level of substitution, and the anion or anions of the viologen.
Abbreviation Viologen Substitution Anion(s) MV methyl di Cl-
MMV monomethyl mono I- MEV monoethyl mono I- MPV monopropyl mono I- MBV monobutyl mono I- EV ethyl di Br-
APV animopropyl mono Br- MAV methylanimopropyl di I- and Br-
Figure 5.1 Images of representative viologens discussed in this document.
In 1 M KOH with 0.1 M KCl, CVs were generated for the monoalkyl viologens MMV,
MEV, MPV, and MBV. The concentration of all the monoalkyl viologens was approximately 3
mM. As will be discussed in greater detail below, the identity and concentration of the anion of
the electrolyte may affect the redox potential of the viologen, which is why 0.1 M KCl was
included in the 1 M KOH solution.
In ACN, CVs were generated for the following monoalkyl viologens: MMV, MEV,
MPV, and MBV. The concentration of all the monosubstituted viologens in ACN was

81
approximately 1 mM. In DMSO, CVs were generated for the following viologens: MMV, APV,
and MAV. The concentration of all viologens in DMSO was approximately 1 mM. DMSO was
used for the aminoviologens because the aminoviologens were found to not be soluble to the
desired 1 mM in ACN.
To compare the mono- and aminoviologens with well-characterized dialkyl viologens,
CVs of EV were run in ACN, DMSO, and aqueous 0.1 M KCl. CVs of MV were also run in
aqueous 0.1 M KCl to help validate our experimental setup. The concentration of the two dialkyl
viologens was approximately 1 mM in all solvents.
IC and MB solutions: CVs were generated for IC and MB in aqueous solution and in
DMSO. Values for the redox potentials, heterogeneous electron-transfer rate constants, and the
diffusion coefficients for IC and MB in water were found in the literature, and aqueous test
solutions for these compounds were run to further validate our experimental setup. IC and MB
were also run in DMSO so that they may be more accurately compared to the monosubstituted
viologens (for which accurate values could not be obtained in aqueous solution).
The concentration of IC was approximately 2 mM in DMSO and approximately 0.3 mM
in aqueous solution. The aqueous IC tests were done in 0.1 M TBACl because IC was not
adequately soluble in 0.1 M KCl (the presence KCl was found to reduce the solubility of IC in
water and at 0.1 M KCl, IC would not dissolve to the desired concentration). DMSO was used
for IC and MB because IC was found to be insoluble in ACN. MB was approximately 1 mM in
DMSO and 0.5 mM in aqueous solution. The aqueous MB tests were in 0.1 M KCl.
To compare the mono- and aminoviologens with well-characterized dialkyl viologens,
CVs of EV were run in ACN, DMSO, and aqueous 0.1 M KCl. CVs of MV were also run in
82
aqueous 0.1 M KCl to help validate our experimental setup. The concentration of the two dialkyl
viologens was approximately 1 mM in all solvents.
CVs were generated for indigo carmine (IC) and methylene blue (MB) in aqueous
solution and in DMSO. IC was approximately 2 mM in DMSO and approximately 0.3 mM in
aqueous solution. The aqueous IC tests were done in 0.1 M TBACl because IC was not
adequately soluble in 0.1 M KCl. DMSO was used for IC and MB because IC is not soluble in
ACN. MB was approximately 1 mM in DMSO and 0.5 mM in aqueous solution. The aqueous
MB tests were in 0.1 M KCl.
Results and discussion 5.3
Voltammograms were used to obtain half-wave potentials (E1/2), diffusion coefficients
(D) and heterogeneous electron-transfer rate constants (ket) [122, 123, 131].
5.3.1 Half-wave potentials
Table 5.2 shows the E1/2 values of all the tested species, with literature values reported
where available. The E1/2 values were calculated as E1/2 = (Epc – Epa)/2, where Epc is the potential
at the cathodic peak and Epa is the potential at the anodic peak. The potentials for ACN come
from Figure 5.2, for DMSO from Figures 5.3 and 5.4, and for aqueous solution in part from
Figure 5.5. The standard deviation for the values seen in Table 5.2 was on the order of 1 to 2
mV, which is within the precision of the analysis software (±5 mV).
The data missing from Table 5.2, and in subsequent tables, is due to the test species not
being run in a particular solvent, or values not being found in the literature. Reasons for not
running a test species in a particular solvent include lack of solubility, as discussed above, or
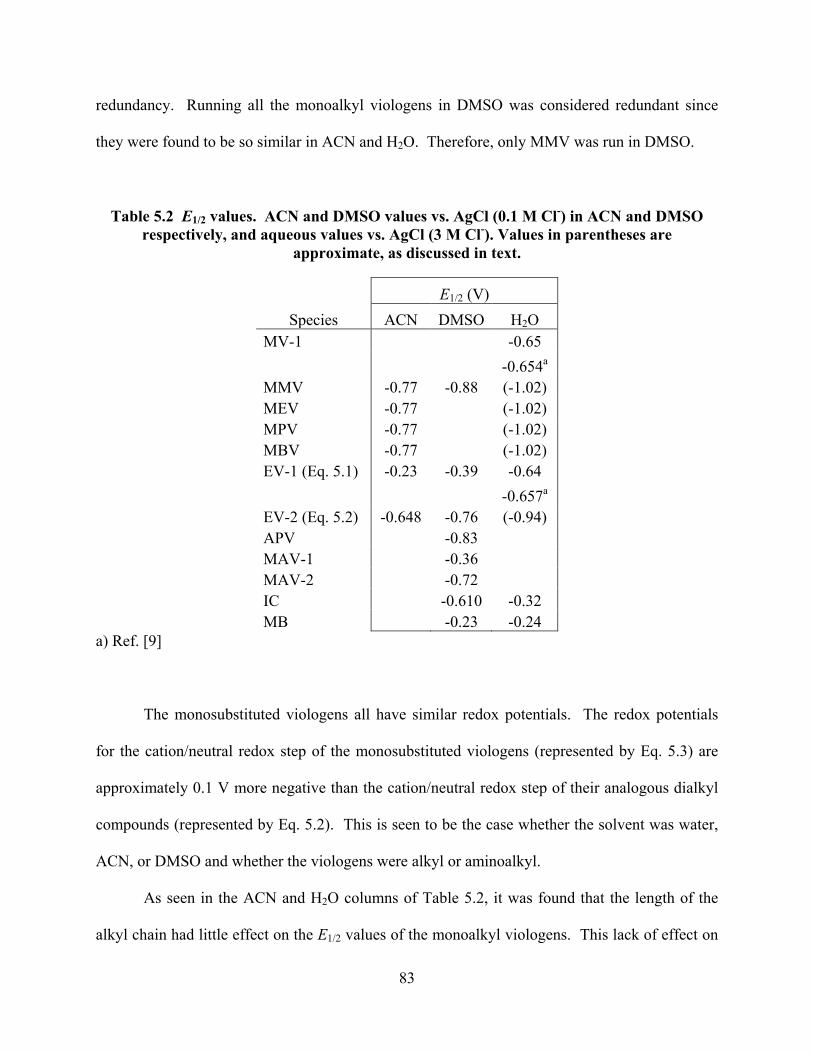
83
redundancy. Running all the monoalkyl viologens in DMSO was considered redundant since
they were found to be so similar in ACN and H2O. Therefore, only MMV was run in DMSO.
Table 5.2 E1/2 values. ACN and DMSO values vs. AgCl (0.1 M Cl-) in ACN and DMSO respectively, and aqueous values vs. AgCl (3 M Cl-). Values in parentheses are
approximate, as discussed in text.
E1/2 (V) Species ACN DMSO H2O
MV-1 -0.65 -0.654a MMV -0.77 -0.88 (-1.02) MEV -0.77 (-1.02) MPV -0.77 (-1.02) MBV -0.77 (-1.02) EV-1 (Eq. 5.1) -0.23 -0.39 -0.64 -0.657a EV-2 (Eq. 5.2) -0.648 -0.76 (-0.94) APV -0.83 MAV-1 -0.36 MAV-2 -0.72 IC -0.610 -0.32 MB -0.23 -0.24
a) Ref. [9]
The monosubstituted viologens all have similar redox potentials. The redox potentials
for the cation/neutral redox step of the monosubstituted viologens (represented by Eq. 5.3) are
approximately 0.1 V more negative than the cation/neutral redox step of their analogous dialkyl
compounds (represented by Eq. 5.2). This is seen to be the case whether the solvent was water,
ACN, or DMSO and whether the viologens were alkyl or aminoalkyl.
As seen in the ACN and H2O columns of Table 5.2, it was found that the length of the
alkyl chain had little effect on the E1/2 values of the monoalkyl viologens. This lack of effect on

84
the E1/2 value indicates that if viologen were to be immobilized on a graphite surface by an alkyl
chain, so that it is functionally similar to a mono- or dialkyl viologen, we could expect the redox
potential of the immobilized viologen to be similar to that of the homogeneous viologen.
The dialkyl viologen EV was run in 0.1 M KCl, rather than 1 M KOH as were the
monoalkyl viologens. EV was run in 0.1 M KCl because dialkyl viologens begin to hydrolyze at
the quaternary nitrogens as soon as they dissolve in 1 M KOH [9]. The cation/neutral species
redox step (Eq. 5.2, reported as EV-2 in Table 5.2) of EV occurs at a potential where less
interference is seen from the reduction of water at the working electrode compared to the
interference seen with the monosubstituted viologens (Eq. 5.3). Therefore, the EV-2 peaks can
be seen, and E1/2 value estimated, without the need of putting the dialkyl viologen in 1 M KOH.
The concentration of the electrolyte and the identity of the electrolyte anion are known to affect
the redox potential of the viologens [9], which is why all the aqueous viologen solutions were at
0.1 M Cl-, regardless of pH. However, the redox potentials of viologens are independent of pH
[9]. So though the dialkyl and monoalkyl viologens were run at different pHs, the estimated E1/2
values for both EV-2 and the monoalkyl viologens seen in Table 5.2 are thought to be accurate
for all pH conditions and are therefore comparable.
Performing the aqueous monoalkyl viologen tests in 1 M KOH led to clearer peaks on the
CVs, but water was still reduced at our platinum working electrode at around the same potential
as the viologens, so we were unable to obtain precise redox data. We also cannot say with
certainty whether or not the reduction of the monoalkyl viologens is reversible in aqueous
solution from the voltammograms alone, though oxidation peaks are seen on the
voltammograms, so it can be stated that the reduction is at least quasi-reversible. Due to the

85
interference from the reduction of water at the platinum working electrode the E1/2 values for the
monosubstituted viologens in aqueous solution in Table 5.2 are approximate.
In aqueous solution both IC and MB are seen to have potentials that are over 300 mV
more positive than the dication/cation E1/2 values (Eq. 5.1) of the dialkyl viologens, and nearly
700 mV more positive than the E1/2 values of the monosubstituted viologens. These more-
positive redox potentials will negatively influence the amount of power produced by a DCFC
catalyzed by either IC or MB.
5.3.2 Diffusion coefficients
All the catalysts examined here are soluble in water. In a DCFC where the catalyst is
homogeneous, the diffusion coefficient (D) can potentially be useful. Values for D can be found
with cyclic voltammetry by using the Randles-Sevcik equation [9, 131, 132]:
ip = 0.4463nR(anF/RT)1/2AD1/2cν1/2 (5.4)
Where ip is the peak current, n is the number of electrons exchanged during an oxidation or
reduction step, R is the ideal gas constant, a is the charge-transfer coefficient (a = 0.5 in this
case), F is the Faraday constant, T is the absolute temperature, A is the surface area of the
working electrode, D is the diffusion coefficient, c is the bulk concentration of the diffusing
species, and ν is the scan rate.
Other than the diffusion coefficient, all the other variables from Equation 5.4 are known.
To limit the probability that any particular scan rate may give an erroneous value for D, a plot of
the peak current (ip) vs. the square root of the scan rate (ν1/2) can be made. This plot gives a

86
straight line that passes through the origin. The slope of this line is proportional to D1/2. Table
5.3 contains values of D generated this way, with values available in the literature for some of
the species tested here included for comparison. The D values, as expected, are larger in the low
viscosity solvents ACN and H2O, and smaller in the higher viscosity DMSO.
Table 5.3 Diffusion coefficients (D) in ACN, DMSO, and H2O solvents.
106 D/cm2s-1 Species ACN DMSO H2O
MV 8.4 12.2a,b 2.5a,b 8.6a
MMV 11.2 2.96 MEV 12.0 MPV 14.6 MBV 18.5 EV 7.13 1.2
APV 0.81 MAV 0.80
IC 0.99 9.4 8.6c
MB 1.9 13.0c a) Ref. [9]. b) anion is ClO4
-. c) Ref. [133].
In water, our preferred solvent for the DCFC, all the compounds tested appear to have
similar diffusion coefficients, though MB has a D that is at about 50% larger than the other tested
species. Due to the reduction of water at the working electrode, it was not possible to determine
D for the monoalkyl viologens. However, as would be expected based on size and charge
effects, in ACN and DMSO the Ds for the monoalkyl viologens were similar to, but a little larger
than, those of the dialkyl viologens. It is thought that this trend continues in water.

87
The aminoviologens have the smallest observed D values. APV is MPV with an amine
group attached to the terminal carbon, and it is thought that the amine group is the cause of the
decrease in D, and other observed differences between the MPV and APV. If, in a homogeneous
cell, D is an important consideration, then the aminoviologens are not a good choice as catalyst.
However, it is unlikely that viologens of any sort will be used homogeneously in a commercial
DCFC.
Due to the unusual shape of the CVs of MB in aqueous 0.1 M KCl, we were not able to
calculate a D value for MB in H2O. The value listed for MB in Table 5.3 is that from Ref. [133],
and was determined with spectroelectrochemical techniques, rather than with cyclic
voltammetry. Below, D is used in the calculation of ket. The D used to calculate ket for MB in
H2O is the value from Ref. [133], while the other values used in the ket calculation for MB came
from our CVs.
5.3.3 Heterogeneous electron-transfer rate constants
Information obtained from the CVs can also be used to determine the heterogeneous
electron-transfer rate constant (ket). These ket values are important in determining the usefulness
of the test species as catalysts in a fuel cell. The higher the value of ket, the quicker the turnover
of electrons and the more efficiently the cell will produce electricity and oxidize the
carbohydrate fuel (the mechanism by which this occurs is discussed in Chapter 4). The ket values
can be determined by applying the electrochemical absolute rate equation proposed by Nicholson
[134] and represented by the following equations:

88
Ψ = γα ket / (π a DO)1/ 2 (5.5)
γ = (DO/DR)1/2 (5.6)
a = n F ν / R T (5.7)
where Ψ is a kinetic parameter from the Nicholson paper, ket is the heterogeneous electron-
transfer rate constant, DO and DR are the diffusion constants of the oxidized and the reduced
species respectively, and the other variables and constants are as described after Equation 5.4 or
how they are commonly understood.
The values of Ψ can be obtained from a table in the Nicholson paper [134] and are related
to ∆Ep from the cyclic voltammograms. The ∆Ep value is the difference in potential between the
anodic and cathodic peaks on the CV. A smaller ∆Ep (minimum 61 mV in the Nicholson paper)
leads to a higher Ψ, and therefore a larger value for ket.
The values for ket determined from Equation 5.5, and the ∆Ep values taken from the CVs,
are seen in Table 5.4. The ket values were determined assuming that D for the oxidized and
reduced forms of all test species were approximately equal, so that γ is equal to 1. The ket values
presented are the average of those calculated in the scan-rate range from 0.05 to 0.4 V s-1 [131].
Values available in the literature for some of the test species are included for comparison.
The value of ket is directly related to the value of Ψ and the highest Ψ value from the
Nicholson paper is about 20-fold greater than the values obtained for the di- and monosubstituted
viologens tested here, meaning that the ket values obtained for the tested viologens are not
relatively fast. Along with seeking a more favorable redox potential, it would be useful to
determine which viologens and other potential catalysts have the highest ket values and what
factors affect the ket of all the catalysts, so that the ket values could be improved.
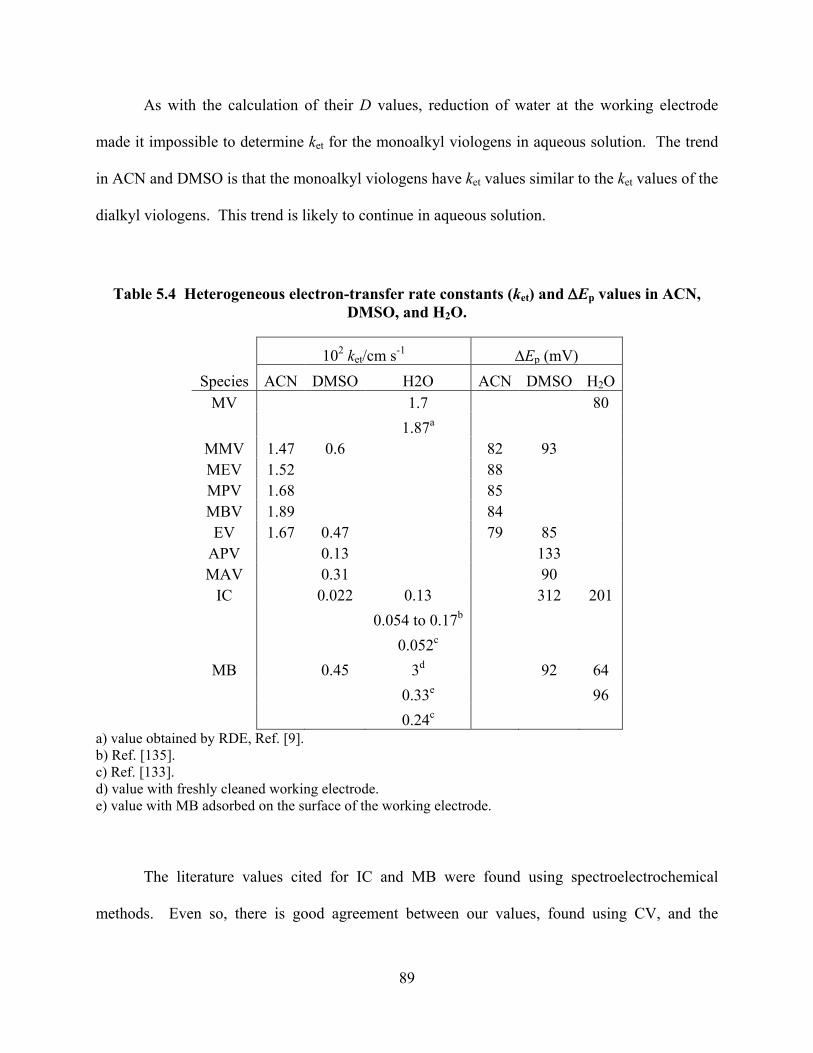
89
As with the calculation of their D values, reduction of water at the working electrode
made it impossible to determine ket for the monoalkyl viologens in aqueous solution. The trend
in ACN and DMSO is that the monoalkyl viologens have ket values similar to the ket values of the
dialkyl viologens. This trend is likely to continue in aqueous solution.
Table 5.4 Heterogeneous electron-transfer rate constants (ket) and ∆Ep values in ACN, DMSO, and H2O.
102 ket/cm s-1 ∆Ep (mV) Species ACN DMSO H2O ACN DMSO H2O
MV 1.7 80 1.87a
MMV 1.47 0.6 82 93 MEV 1.52 88 MPV 1.68 85 MBV 1.89 84 EV 1.67 0.47 79 85
APV 0.13 133 MAV 0.31 90
IC 0.022 0.13 312 201 0.054 to 0.17b 0.052c
MB 0.45 3d 92 64 0.33e 96 0.24c
a) value obtained by RDE, Ref. [9]. b) Ref. [135]. c) Ref. [133]. d) value with freshly cleaned working electrode. e) value with MB adsorbed on the surface of the working electrode.
The literature values cited for IC and MB were found using spectroelectrochemical
methods. Even so, there is good agreement between our values, found using CV, and the

90
literature values. The range in literature values for the second entry under IC, is due to a range
of electrode potentials being used to determine the ket values. As mentioned above, the literature
D value for MB was used to calculate the first two values listed for ket for MB in Table 5.4. The
two CV values given for MB were due to the difference in the ∆Ep values obtained at a freshly
cleaned working electrode vs. an electrode that had MB adsorbed on it. Further comparisons
between the ket values found in Table 5.4 can be found below in the “Comparison of the
catalysts” subsection below.
The disubstituted viologen MV was used to compare the E1/2, D, and ket values generated
in this work with the values available in the literature, so as to help validate our experimental
setup. As can be seen from the values for MV in Tables 5.2, 5.3, and 5.4, similar values were
found using our experimental setup as previous workers have found.
5.3.4 Examination of voltammograms
The concentration in solution of the test species that are shown in the voltammograms
varied from approximately 0.3 mM to 2 mM. To correct for this difference in concentration in
the plots of the CVs, the values used to plot the CVs were normalized to 1 mM. This
normalization was done by dividing the plotted current (µA) values of the CVs by a unitless
millimolarity value. For instance, if the solution was 2 mM, then the µA values were divided by
2. If the solution was 0.3 mM, then the µA values were divided by 0.3. This way, all CV curves
are plotted as though they were run at precisely 1 mM.
Figure 5.2 shows cyclic voltammograms of EV, MMV, MEV, MPV, and MBV in ACN
with 0.1 M TBAPF6. Two oxidation and reduction waves are clearly seen for EV (a
disubstituted viologen) and one oxidation and reduction wave is seen for each of the
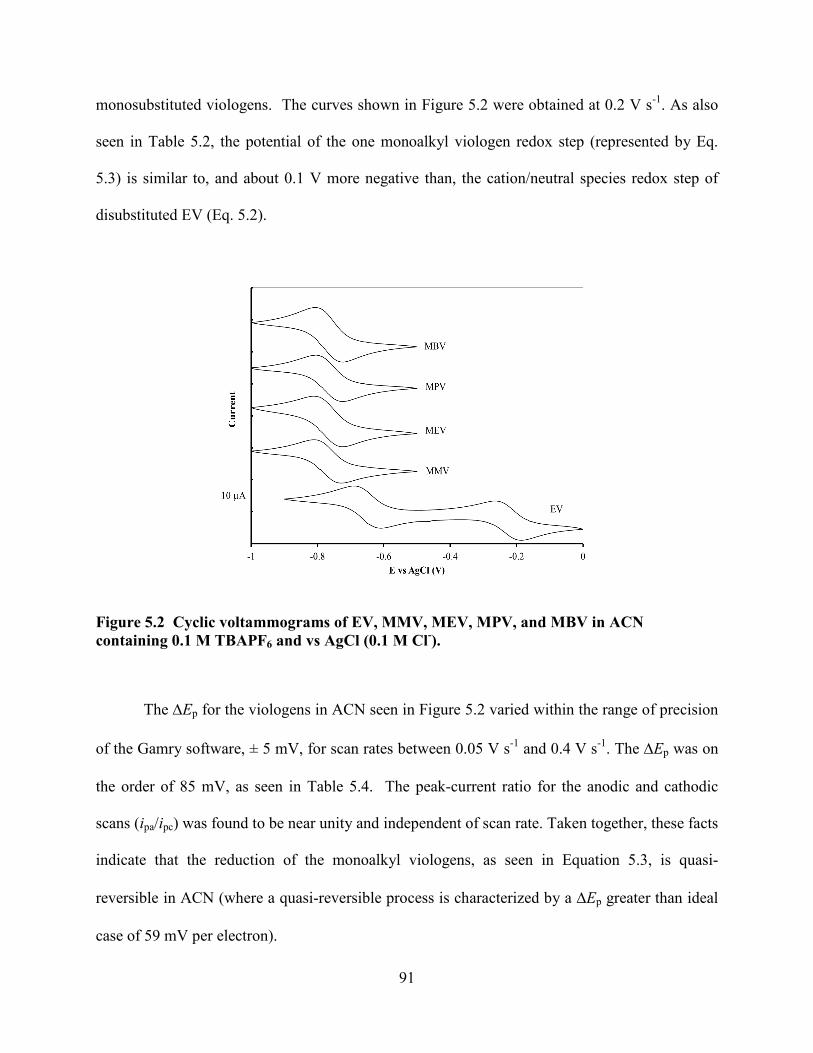
91
monosubstituted viologens. The curves shown in Figure 5.2 were obtained at 0.2 V s-1. As also
seen in Table 5.2, the potential of the one monoalkyl viologen redox step (represented by Eq.
5.3) is similar to, and about 0.1 V more negative than, the cation/neutral species redox step of
disubstituted EV (Eq. 5.2).
Figure 5.2 Cyclic voltammograms of EV, MMV, MEV, MPV, and MBV in ACN containing 0.1 M TBAPF6 and vs AgCl (0.1 M Cl-).
The ∆Ep for the viologens in ACN seen in Figure 5.2 varied within the range of precision
of the Gamry software, ± 5 mV, for scan rates between 0.05 V s-1 and 0.4 V s-1. The ∆Ep was on
the order of 85 mV, as seen in Table 5.4. The peak-current ratio for the anodic and cathodic
scans (ipa/ipc) was found to be near unity and independent of scan rate. Taken together, these facts
indicate that the reduction of the monoalkyl viologens, as seen in Equation 5.3, is quasi-
reversible in ACN (where a quasi-reversible process is characterized by a ∆Ep greater than ideal
case of 59 mV per electron).

92
Figure 5.3 shows cyclic voltammograms of the EV, MMV, MAV and APV in DMSO
with 0.1 M TBAPF6, and were also obtained at 0.2 V s-1. The behavior of the aminoviologens
was different than that of the simpler alkyl viologens. The CV of APV, which is MPV with an
amine group attached to the terminal carbon of the alkyl chain, is the most notably different.
Whereas MMV has a clean scan with sharp peaks, APV has a small bump half way up the
reduction peak and relatively flatter and smaller peaks. Additionally, APV has a ∆Ep of 133 mV
in DMSO, whereas MMV, a monoalkyl viologen, has a ∆Ep of 93 mV in DMSO (see Table 5.4
for the ∆Ep values). This difference can be attributed to the amine group. In a commercial fuel
cell, APV or MAV may be attached to the electrode surface at the amine group, so the influence
of the amine group on ∆Ep may no longer appear once the viologens are immobilized.
Figure 5.3 Cyclic voltammograms of EV, MMV, MAV, and APV in DMSO containing 0.1 M TBAPF6 and vs AgCl (0.1 M Cl-).

93
Figure 5.4 shows the voltammograms of IC and MB in DMSO. A plot separate from the
aminoviologen DMSO plot was used for IC and MB, because despite the fact that the
concentration of IC in DMSO was 2 mM, as opposed to 1 mM for the viologens, the IC peaks
were too small to discern details if put on the same scale as the aminoviologens.
Figure 5.4 Cyclic voltammograms of IC and MB in DMSO containing 0.1 M TBAPF6 and vs. AgCl (0.1 M Cl-).
As can be seen in from the ket and ∆Ep values for IC in Table 5.4, IC has slow
heterogeneous electron-transfer kinetics. While all other tested catalysts showed no change in
the form of the CV curve with change in scan rate, two CVs of IC in DMSO are shown because
there is a change in the shape of the curve. At 50 mV s-1 the curve looks similar to a standard
one-electron curve with fast kinetics, though the oxidation peak is less sharp and more flat, with
some of the oxidation taking place at more positive potentials from the Epa peak than with
94
kinetically faster species. At 200 mV s-1, the Epa peak value has clearly shifted from what is
expected with faster kinetics. This peak-shifting phenomenon is also seen with IC in aqueous
solution (Figure 5.5). If the shifted peak is used to generate ∆Ep values, then ket values can be
calculated which match the literature values, as seen in the Table 5.4. Whether or not the shift in
peak value is due simply to slow kinetics or to some chemical complexation, the result is an
electron-transfer rate constant that is more than an order of magnitude smaller than that of the
viologens and MB.
In contrast to IC is the MB curve on Figure 5.4. Both the oxidation and reductions peaks
of MB in DMSO are strong and sharp and no change in ∆Ep is seen as the scan rate increases.
The ∆Ep of MB is similar to that of the viologens tested in DMSO.
Figure 5.5 shows voltammograms of MV, IC, and MB in aqueous solution. The CVs
shown were recorded at 200 mV s-1. As in Figure 5.4, the oxidation peak of IC is shown to be
shifted considerably from where it would be under a faster kinetic regime. The more-positive
oxidation peak on the MB curve is the adsorption of MB onto the working electrode. If multiple
cycles are run during a scan, then this more-positive oxidation peak decreases in size until it is no
longer visible. Initial scans after the working electrode is cleaned, show a much smaller ∆Ep
than after MB has absorbed onto the surface. This difference in ∆Ep, and the resulting change in
the calculated ket, can be seen in Table 5.4. The curve of MV is included to show that even the
dication/cation redox step of a dialkyl viologen is significantly more negative than those of IC
and MB.

95
Figure 5.5 Cyclic voltammograms of MV, MB, and IC in H2O containing 0.1 M NaCl, in the case of MB and MV, or 0.1 M TBACl, in the case of IC. CVs vs AgCl (3 M Cl-).
5.3.5 Comparison of the catalysts
Five parameters for judging the fitness of these catalysts are examined in this work.
These include three parameters from cyclic voltammetry: E1/2, ket, and D. In addition, we
examined stability in alkaline solution and solubility in a semi-quantitative fashion. If the
catalyst is immobilized on a surface, as in our intended application, both D and solubility may
become less important.
E1/2: To better understand the operating conditions of a potential fuel cell, it is helpful to
construct and examine a Pourbaix diagram for the system, as shown in Figure 5.6. The diagram
shows results for a generic carbohydrate fuel (thermodynamic results do not differ appreciably
from one fuel species to the next). The potential difference between the reduced catalyst at the
anode and the O2 at the cathode is the open-circuit voltage (∆EOCV) for the cell, and represents

96
the electric potential available to the cell. Similarly, the difference in potential between the fuel
and the catalyst is the driving force for the oxidation of the fuel by the catalyst.
The values for MV and MMV seen in Figure 5.6 were taken from this work, while the
values for MB, IC, and formate were taken from the literature [136, 137]. Under alkaline
conditions, the reduction of MB and IC involves 2 electrons for every proton, so the slope of
those lines is half that of the O2 line. The carbohydrate fuel line was calculated using the ∆G of
combustion for glucose and using the equation ∆G = -n F ∆E [14]. Under alkaline conditions,
where the carbohydrate reaction produces bicarbonate and carbonate rather than CO2, the slope
of the fuel curve reflects the reaction of 1.5 protons for every electron.
Figure 5.6 Pourbaix diagram for carbohydrate redox system, potentials given are vs. SHE. Included are the redox potentials of four of the catalysts examined in this chapter.
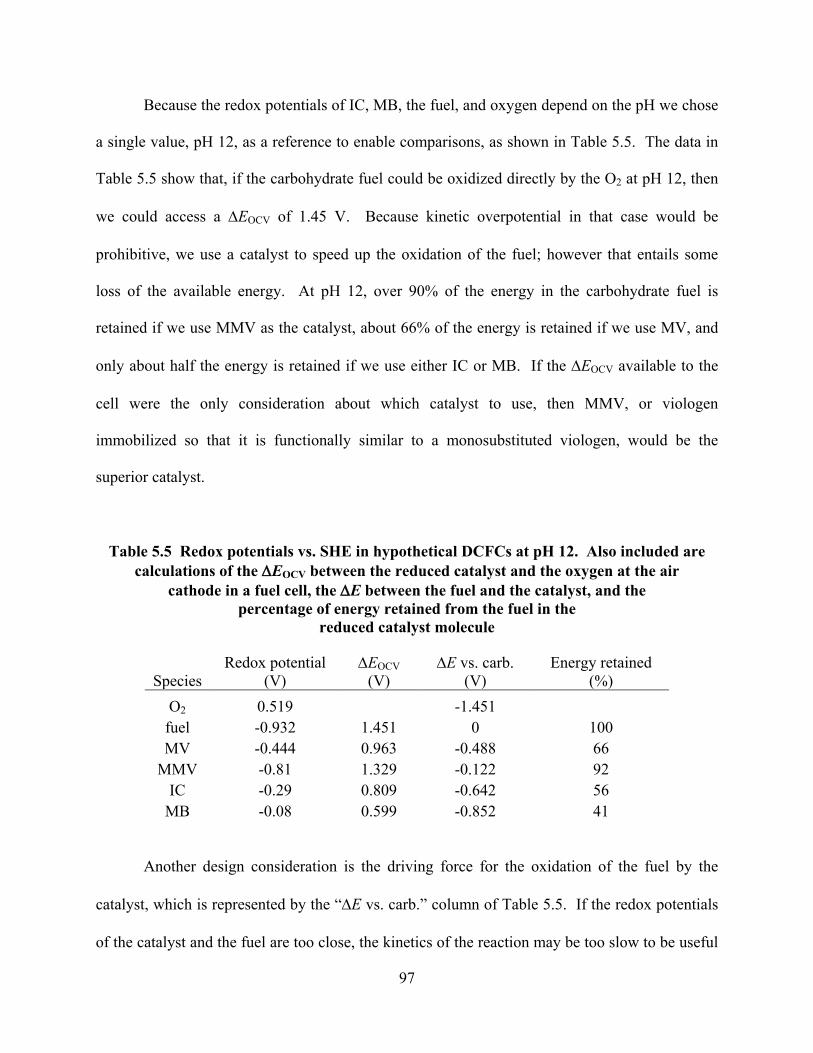
97
Because the redox potentials of IC, MB, the fuel, and oxygen depend on the pH we chose
a single value, pH 12, as a reference to enable comparisons, as shown in Table 5.5. The data in
Table 5.5 show that, if the carbohydrate fuel could be oxidized directly by the O2 at pH 12, then
we could access a ∆EOCV of 1.45 V. Because kinetic overpotential in that case would be
prohibitive, we use a catalyst to speed up the oxidation of the fuel; however that entails some
loss of the available energy. At pH 12, over 90% of the energy in the carbohydrate fuel is
retained if we use MMV as the catalyst, about 66% of the energy is retained if we use MV, and
only about half the energy is retained if we use either IC or MB. If the ∆EOCV available to the
cell were the only consideration about which catalyst to use, then MMV, or viologen
immobilized so that it is functionally similar to a monosubstituted viologen, would be the
superior catalyst.
Table 5.5 Redox potentials vs. SHE in hypothetical DCFCs at pH 12. Also included are calculations of the ∆EOCV between the reduced catalyst and the oxygen at the air
cathode in a fuel cell, the ∆E between the fuel and the catalyst, and the percentage of energy retained from the fuel in the
reduced catalyst molecule
Species Redox potential
(V) ∆EOCV
(V) ∆E vs. carb.
(V) Energy retained
(%) O2 0.519
-1.451
fuel -0.932 1.451 0 100 MV -0.444 0.963 -0.488 66
MMV -0.81 1.329 -0.122 92 IC -0.29 0.809 -0.642 56
MB -0.08 0.599 -0.852 41
Another design consideration is the driving force for the oxidation of the fuel by the
catalyst, which is represented by the “∆E vs. carb.” column of Table 5.5. If the redox potentials
of the catalyst and the fuel are too close, the kinetics of the reaction may be too slow to be useful

98
in a fuel cell. From the tests reported in this paper we were unable to determine what effect the
∆E has on the rate of reaction, but a forthcoming paper by our group will examine homogeneous
rate constants (not included in this dissertation).
Figure 5.6 illustrates a balance that must be struck in any potential DCFC. For the
viologens, an alkaline pH is required so that there is a ∆E to drive the oxidation of the fuel by the
catalyst. However, as the pH increases, less energy is retained by the viologen from the
oxidation of the fuel and therefore less is available to power an external circuit.
Factors affecting the redox potentials of viologens: From Table 5.2 we can see that
changing the length of the alkyl chain has little effect on the E1/2 of viologens. There are other
factors, however, that are known [9] to have a substantial effect on the E1/2 values, and these
factors can potentially be used to optimize the redox potentials of viologens for use in a DCFC.
These factors include the anion of the supporting electrolyte, the concentration of supporting
electrolyte, and the substituents at the nitrogens of the viologens.
Due to interest in its use in electrochromic displays, heptyl viologen (HV), is the viologen
with which the electrolyte concentration and anion effects have been the most heavily studied.
As seen in Ref. [9], on a gold working electrode the E1/2 value for the HV dication/cation redox
step, HV-1, is -0.698 V vs. SCE when the anion of the electrolyte is bromide (0.3 M) and -0.848
V vs. SCE when the anion is formate (0.4 M), a difference of 150 mV. The major source of
anions in a working viologen DCFC will necessarily be hydroxide ions, which have been shown
to have little effect [9] on the viologen redox potentials. It is possible, however, that an
additional species of anion can be added to the reaction solution if necessary to optimize the
redox potential in the operating cell.

99
The effect of anion concentration on the E1/2 values of HV has also been studied [9]. It is
shown that, as electrolyte concentration increases, the value of E1/2 for HV-1 becomes more
positive and the value of HV-2 becomes more negative. For a concentration range covering four
orders of magnitude, the E1/2 values for HV-1 and HV-2 both change by over 100 mV. As with
the anion type, it is likely that in an optimized DCFC the anion concentration will be dictated
more by the need to tune the hydroxide concentration to produce the best current, than to affect
the E1/2.
The substituents on symmetrical viologens are also known to affect the E1/2 values.
Again from Ref. [9], reported values of the dication/cation redox step vary from -0.710 vs. SCE
for n-hexyl viologen with bromide anion, to -0.315 vs. SCE for CH(CN)Ph viologen with
unknown anion, a difference of nearly 400 mV. Given the large difference in redox potential
based on the identity of the substituent attached to the quaternary nitrogens, it is likely that the
E1/2 values of immobilized viologens can be optimized by changing the substituents.
ket: The amount of power produced by a cell depends on the current the cell can produce.
The current produced by the cell depends, in part, on the kinetics at the anode, which are
described by the heterogeneous electron-transfer rate constant, ket.
The ket values we are interested in are seen in Table 5.4. The DMSO column in Table 5.4
gives a complete set of information which allows us to compare representatives of all the types
of catalysts tested. In DMSO, the species with the highest ket is MMV, followed closely by EV
and MB. Lower still are the aminoviologens, and the species with by far the lowest ket, more
than an order of magnitude lower than the ket for MMV, is IC. Looking at the ACN column
shows us that viologens, whether they be di- or monosubstituted have roughly similar ket values.

100
The H2O column shows us a pattern similar to that in the DMSO column. IC has a ket
that is more than an order or magnitude smaller than that of MV. Also of interest in the H2O
column is the ket values for MB. The top value listed for MB is that seen when a pristine
working electrode is initially used in the aqueous MB solution. In the initial CV of MB in H2O,
the ∆Ep is, at 64 mV, near the value of an ideal reversible redox reaction, indicating fast
heterogeneous electron-transfer kinetics. After adsorption of MB at the surface the ∆Ep value
increases significantly, as is seen in the second value listed for MB in H2O. It is unknown if this
same fouling effect would take place at a current collector of a DCFC. If no such fouling of the
surface takes place, then the greater ket of MB would recommend it for use in a DCFC.
However, as seen in the E1/2 section just above, MB retains the least amount of energy, only half
of what the monosubstituted viologens retain, during oxidation of the carbohydrate fuel. The
viologens, in general, have the next highest ket values, and no fouling is observed at the working
electrode.
D: It is likely that, in any commercial DCFC, the catalysts will necessarily need to be
immobilized in the cell. However, if the catalyst is not immobilized on the surface, then the
diffusion coefficient is potentially important. As can be seen in Table 5.3, there is not a great
deal of difference in the diffusion coefficients of any of the catalysts tested. For these reasons
there is little to differentiate the catalysts on the basis of diffusion.
Stability at high pH: In order to semi-quantitatively assess stability, solutions of 1 mM
concentration of MV, IC, and MB were all made in pH 12 aqueous KOH. The solutions were
allowed to sit at room temperature and were examined over time visually, by CV, and by NMR.
Visually, the MV solution showed no change in color over the course of a week, while
the MB solution took on a purple hue and the IC solution changed from indigo to light yellow

101
within 60 hours. After 60 hours the solutions underwent CV testing, and the peaks produced by
the MV and MB solutions showed little or no degradation. IC showed no peaks within the scan
range when tested after 60 hours and appears to have become electrochemically inert. The
solutions were also examined with H1 NMR at 60 hours and after 40 days. MV and MB showed
trace amounts of degradation products after 40 days. The NMR of IC was highly altered from
the control after 60 hours. Compared to IC, MV and MB appear to be far more stable in alkaline
solution.
Solubility: In a cell where the catalyst is immobilized, the solubility may be less
important. However, the solubility of the homogeneous species can still inform us how the
immobilized species will interact with the solvent. Immobilization will probably take place by
tethering the catalyst to the surface with an alkyl chain. If solubility is high, then the
immobilized catalyst will prefer in interact with the solvent, and the fuel in the solvent, rather
than with the electrode surface.
We are unaware of previous solubility data for MV and MMV, so tests where done where
the viologens were slowly added in known quantities to water until the viologens no longer
dissolved. The final volume of the solutions was then assessed and molar solubility estimated.
MV was soluble to approximately 3.3 M and MMV was soluble to approximately 3.1 M at 25
oC. IC is soluble to 10 g/L in water at 25 oC (approximately 20 mM) and MB is soluble to 40
g/L in water at 25 oC (approximately 120 mM) [138]. The viologens are more than an order of
magnitude more soluble than IC or MB and are therefore more likely to interact with the fuel in
the solvent when immobilized.
Comparison summary: The relative merits of the each of the types of catalysts were
investigated above. Due to the superior energy retention produced by monosubstituted
102
viologens, we judge them to be the most viable candidate for a future DCFC. The ket values for
monosubstituted viologens were also some of the highest tested, and these compounds have
relatively good stability in alkaline solution. Disubstituted viologens are a good second choice,
since they have been shown to be stable at pH 12 for up to 40 days and have high ket values, but
they have lower energy retention when compared to the monosubstituted viologens. Methylene
blue potentially has the largest ket value, and is stable at pH 12, but MB retains less than half of
the energy of the fuel molecule when it oxidizes the fuel. From the parameters examined here,
indigo carmine is the least desirable catalyst due to its low energy retention, low ket, low stability
in alkaline solution, and low solubility in solution.
Immobilization of the viologens: Our group is investigating methods for the
immobilization of viologen on carbon surfaces. Carbon is being considered because it is likely
to be the substrate of choice in a functioning DCFC due to its relative low cost and high surface
area. The two aminoviologens examined in this text, MAV and APV, are candidates for
immobilization, being immobilized at the amino end. When immobilized, MAV will function
like a dialkyl viologen and APV will function like a monoalkyl viologen. Other immobilization
schemes are also being considered. The motivation for the immobilization of viologen on the
electrode surface is that viologens are toxic, costly, and soluble in water. Considerations may be
different for an MB or IC catalyzed cell, since both of those dyes are cheaper and less toxic than
viologen, though it is still hard to envision an economical cell with homogeneous catalyst.
Conclusions 5.4
Monosubstituted viologens were investigated electrochemically because they have been
found, like their disubstituted viologen analogs, to catalytically oxidize carbohydrates and
carbohydrate-like molecules, and they are more stable than their disubstituted viologen analogs

103
under the high pH conditions where that catalysis occurs. The potential of the single reversible
redox step of the monosubstituted viologens has been found to be similar to, but somewhat more
negative than, the potential of the cation/neutral redox step of their analogous disubstituted
viologens. This trend in redox potential is seen between EV and MEV in water and ACN
solvents and is seen between MAV and APV in DMSO solvent, so it appears to be consistent
between both species and solvent. Additionally, the larger potential difference between a
reduced monosubstituted viologen and oxygen than between a reduced disubstituted viologen
and oxygen, for a given pH, means higher harvestable energy per electron.
Tests on the series of monoalkyl viologens in ACN and water show that the length of the
alkyl chain has little apparent effect on the redox potential and ket value of the viologens. This
lack of effect has implications in the immobilization of the viologen, meaning that the length of
the chain is unlikely to affect the redox potential of the immobilized viologen.
A higher ket value means faster electron turnover, a higher concentration of viologen in
the oxidized state, and increased cell current. It would be useful to investigate if other viologens
have higher ket values, and what factors affect the ket value of viologens.
Methylene blue and indigo carmine were also analyzed and found to be deficient
compared to viologens due to relatively low energy retention for carbohydrate oxidation and low
solubility levels. IC also has low ket values and low stability in aqueous solution.

105
6 COULOMBIC EFFICIENCY AND ANODE OVERPOTENTIAL FOR THE OXIDATION OF CARBOHYDRATES BY METHYL VIOLOGEN
Introduction 6.1
When oxidized to CO2 and H2O, glucose has a ΔG = -4420 Wh/kg, which can be
compared to the complete oxidation of two other fuels proposed for other types of fuel cells,
methanol (-5530 Wh/kg) and ethanol (-7450 Wh/kg). As described in Chapter 2, the percentage
of the energy of a fuel that is obtained by a fuel cell is the product of the coulombic efficiency
(ηcoul = n/nideal) and the efficiency with which the chemical potential of the electrons in the fuel is
utilized (voltage efficiency, ηvolt = ∆E/∆Eideal). A custom-made fuel cell-like device was used to
obtain both coulombic efficiency and voltage efficiency data for a homogeneous-viologen-
catalyzed DCFC.
Coulombic efficiency: From Equation 2.3 we see that if glucose is oxidized all the way to
carbonate, 24 electrons are liberated. If the liberation of all 24 electrons is taken to be a
coulombic efficiency of 100% (which is the definition used throughout this dissertation), then the
coulombic efficiencies reported in the literature for MV-catalyzed oxidation of carbohydrates
range from between 2.5% [12] up to 80% (Chapter 3). This is a wide variation. Accurate and
controllable coulombic efficiencies are important because the energy density, and thus utility, of
the carbohydrate fuel relies directly on the extent to which the fuel can be oxidized by the
viologen catalyst.
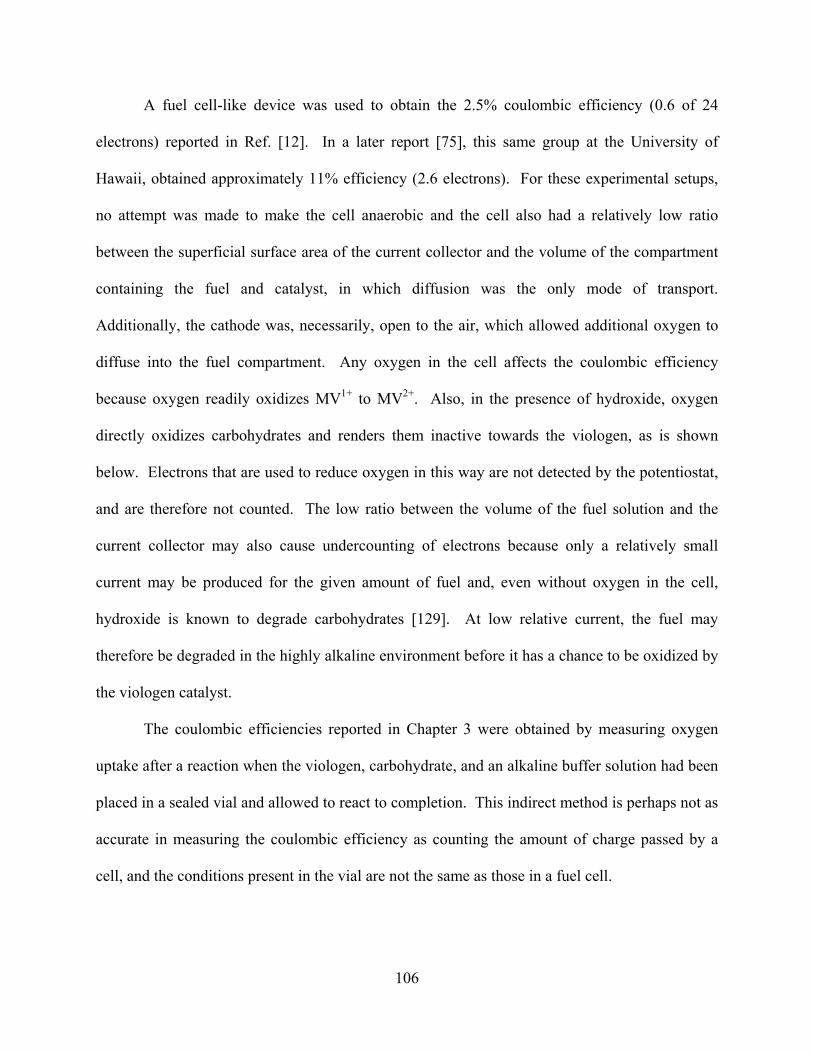
106
A fuel cell-like device was used to obtain the 2.5% coulombic efficiency (0.6 of 24
electrons) reported in Ref. [12]. In a later report [75], this same group at the University of
Hawaii, obtained approximately 11% efficiency (2.6 electrons). For these experimental setups,
no attempt was made to make the cell anaerobic and the cell also had a relatively low ratio
between the superficial surface area of the current collector and the volume of the compartment
containing the fuel and catalyst, in which diffusion was the only mode of transport.
Additionally, the cathode was, necessarily, open to the air, which allowed additional oxygen to
diffuse into the fuel compartment. Any oxygen in the cell affects the coulombic efficiency
because oxygen readily oxidizes MV1+ to MV2+. Also, in the presence of hydroxide, oxygen
directly oxidizes carbohydrates and renders them inactive towards the viologen, as is shown
below. Electrons that are used to reduce oxygen in this way are not detected by the potentiostat,
and are therefore not counted. The low ratio between the volume of the fuel solution and the
current collector may also cause undercounting of electrons because only a relatively small
current may be produced for the given amount of fuel and, even without oxygen in the cell,
hydroxide is known to degrade carbohydrates [129]. At low relative current, the fuel may
therefore be degraded in the highly alkaline environment before it has a chance to be oxidized by
the viologen catalyst.
The coulombic efficiencies reported in Chapter 3 were obtained by measuring oxygen
uptake after a reaction when the viologen, carbohydrate, and an alkaline buffer solution had been
placed in a sealed vial and allowed to react to completion. This indirect method is perhaps not as
accurate in measuring the coulombic efficiency as counting the amount of charge passed by a
cell, and the conditions present in the vial are not the same as those in a fuel cell.

107
Other methods for oxidizing carbohydrates have produced different apparent coulombic
efficiencies: precious-metal catalyzed cells produce only about 2 of the available 24 electrons
[139], microbial cells are kinetically slow, but can liberate all the available electrons [140], and
cells that use enzymes as catalysts can usually only liberate 2 electrons [39].
Voltage efficiency: In a viologen-catalyzed DCFC, some of the chemical potential of the
electrons in the carbohydrate fuel is used to reduce the viologen (the amount of which is one of
the subjects covered in Chapter 5). Once the viologen is reduced, the difference in potential
energy between the anode (MV1+) and the cathode (oxygen) of a functioning cell, ∆E, depends,
in part, on the behavior of the viologen-controlled anode as current is drawn. The voltage
efficiency (%) of a cell is the quotient of the ∆E during operation and the ∆E at zero current
(open circuit). This can also be expressed in terms of overpotential. Overpotential is the
difference between the potential of an electrode at equilibrium and when current is flowing. The
overpotential represents the energy lost to force the electrode reaction to proceed at the desired
current density.
Though some cell-polarization curves (that is, the behavior of ∆E as a function of
current) have been reported in the literature [12, 75], the geometry of the cells used previously
did not allow for the use of a reference electrode. Without the use of a reference electrode it is
not possible to separate out the overpotential at the anode from that of the cathode, and thereby
isolate the current-vs.-potential performance at each electrode. In other words, to understand the
main sources of inefficiency in an electrochemical cell, it is important to separate the
overpotential of the anode from that at the cathode using a reference electrode.

108
Experimental 6.2
6.2.1 Materials
Methyl viologen, KOH, fructose, glucose, dihydroxy acetone (DHA), and glyceraldehyde
were obtained from Sigma and used without purification. The KCl was obtained from
Mallinckrodt Chemicals. The chemicals were used with no purification. The water used for the
solutions was 18.2 MΩ.
6.2.2 Fuel cell
A fuel cell-like device was used to collect coulombic-efficiency and anodic-polarization
data to compare the viologen-carbohydrate reaction under various conditions. The fuel cell was
a modified direct methanol fuel cell that is commercially available (fuelcellstore.com, SKU
1071041). The current collector was nickel foam (Marketech International, USA) and the
cathode material was the E-4 air cathode (electric-fuel.com). A Teflon-coated stir bar was used
to stir the homogeneous test solution of aqueous MV, carbohydrate, and KOH. The fuel-
containing compartment at the anode was closed to mass flow. The cathode was open to the air.
The tests were conducted at room temperature; 23 oC. The current was collected using a Gamry
PC4/750 Potentiostat. To ensure repeatability, the air cathode material was soaked in 6 M KOH
for at least 24 hours before being used in the cell. The air cathode was then rinsed in 18.2 MΩ
water and patted dry before the cell was assembled.
To ameliorate concerns about the presence of oxygen in the cell, steps were taken to
reduce the oxygen to the minimum amount possible. It was, however, not possible to make the
anode compartment entirely anaerobic, due to the cathode being open to the air and the lack of
using an oxygen-impermeable membrane that is stable at high pH. Some candidates for anion-

109
exchange membranes were obtained, but were found to have short useful lives under the
conditions of our tests. Therefore, no ionomer membrane was used. The fuel cell (Figure 6.1)
was assembled in a way that allowed a resealable plastic bag to be held between the bottom
stainless steel plate and the bottom piece of acrylic. A fitted hole in the bag allows oxygen to
reach the air cathode. The rest of the bag surrounded the anode compartment of the cell, which
is otherwise open to the air to allow the easy insertion of a reference electrode, and was used to
maintain a low oxygen environment around the fuel and viologen test solution. In this way,
quasi-anaerobic conditions were maintained in the test solution.
Figure 6.1 Schematic detailing the construction of the preliminary fuel cell.
The KOH solution used in the cell was purged with nitrogen for 10 minutes before being
added to the anode compartment. Simultaneously, nitrogen was blown into the closed bag to
create a low oxygen environment. For runs with higher carbohydrate concentrations (0.25 M to
0.5 M), solid carbohydrate was added to the deoxygenated KOH solution and allowed to dissolve

110
before the solution was added to the cell. For lower concentration runs, the carbohydrate was
added to the cell as a 3.2 M solution after the KOH solution was added to the cell. After the
anode compartment in the cell was filled with the deoxygenated KOH solution, and with the
carbohydrate present, the viologen was added to the cell with a glass syringe as a saturated
solution (approximately 3.2 M).
To address concern over a low current being generated for the volume of fuel solution, a
relatively large current collector (9 cm2 for 7.4 mL of test solution) was used and a stir bar was
utilized to provide convection. Additionally, the coulombic-efficiency tests were run at a closed
circuit potential. The closed circuit potential allowed for a fast discharge of the cell, which
minimizes possible side reactions.
6.2.3 Reference electrode
A silver chloride (AgCl) reference electrode was used for the anode-overpotential tests.
The wire for the reference electrode was made by anodizing a silver wire in 1 M KCl at 2 V for
10 minutes [122]. A two millimeter diameter plastic tube with fritted-glass junction
(Microelectrodes, Inc. MI-402) was used for the housing. The reference electrode solution used
was 3 M KCl saturated with AgCl (Microelectrodes, Inc.). The solution in the reference-
electrode compartment was changed daily to ensure stability. No ohmic correction was made for
the results presented, but any correction was expected to be small due to the high hydroxide
concentration in the cell.
111
Results and discussion 6.3
Figure 6.2 shows representative structures for the carbohydrates, intermediates, and
possible end products referred to below. Fructose, gluconic acid, DHA, and the intermediate
enediol form of DHA are shown.
Figure 6.2 Representative structures for the carbohydrates, intermediates, and potential end products discussed in text.
6.3.1 Coulombic-efficiency control experiments
Control experiments were run (all in 1 and/or 3 M KOH) of MV only, fructose only, MV
with gluconic acid, and DHA incubated in aerobic 1 M KOH for 12 hours. Carbohydrates are
spontaneously oxidized in high pH solution [4], so a control of fructose in alkaline solution was
run to separate out the catalytic ability of the viologen from the spontaneous oxidation. Because
MV is auto-reduced in alkaline solution [9], a control with only MV in alkaline solution was run
to separate out any charge passed due to auto-reduced MV. It has been suggested [12] that the
two-electron oxidation product of glucose and fructose, gluconic acid, is the end product of the
viologen catalysis, so a control of gluconic acid with MV was run. To test if dissolved oxygen

112
can directly oxidize carbohydrates in alkaline solution and make the carbohydrate inactive to
viologen, a control was run in which DHA was incubated in aerobic 1 M KOH. The results and
conditions of all control experiments are seen in Table 6.1.
Table 6.1 Control-test conditions and results.
In a 24-hour fructose control test, only approximately 0.7 e- per fructose had passed. The
purpose of this control test was to determine if oxidation of fructose at the nickel current
collector contributed significantly to the amount of charge passed by the cell. The maximum
current produced was approximately 60 µA cm-2, relatively a very low amount. Therefore,
corrections were not made to take into account for oxidation of carbohydrates at the current
collector. A plot of the fructose control can be seen in Figure 6.3 (seen below). Curves for both
the fructose control and the MV control are seen at the bottom of the plot and nearly overlap.
For the fructose control test, the current was still approximately 55 µA cm-2 when the test
was stopped. Therefore, the coulombic efficiency reported in Table 6.1 for fructose does not
reflect the actual coulombic efficiency that may be obtained if the cell would have been fully
discharged. This is in contrast to the coulombic efficiencies reported in Table 6.2, where the
tests were run until the current had fallen to between a 100th and a 1000th of the peak current,
indicating that the fuel had been utilized to its practical limit. The addition of a small amount of
Control-test species MV Fructose Gluconic acid
and MV Incubated DHA
and MV Species conc (mM) 46 44 2000 and 28 115 and 9.2 KOH conc. (M) 1 1 3 <1 e- passed per oxidized species 1 0.7 0.2 0 Coulombic efficiency - 2.9% 0.09% 0

113
carbohydrate yielded an increase in current, indicating that the current produced by the cell was
not limited by hydroxide concentration or catalyst degradation.
Viologens hydrolyze at the quaternary amine in high pH solution [9], which causes
reduction of other, intact, viologen in the solution. In previous preliminary fuel cell experiments
[12, 75] in which high pH solutions were used, no effort was made to account for this auto-
reduction. In a 15 hour test, at the end of which the current had dropped to approximately 10%
of its peak value, it was seen that, in 1 M KOH, nearly one e- per viologen passed. Similar
results are seen if 3 M KOH is used. The information on how many electrons are passed per
viologen is important for interpreting experiments in which a high viologen-to-carbohydrate ratio
is used to push the oxidation of the carbohydrate to its fullest extent. Both the MV and the
fructose controls can be seen as producing a very low current relative to the MV-and-fructose
tests.
Due to its stability, it was though that gluconic acid cannot act as a fuel in a viologen-
catalyzed fuel cell, and a control with MV and gluconic acid was run to confirm this. The
gluconic acid and MV control was run to show that gluconic acid does not react with, or reacts at
a very low rate with, MV, nor is the gluconic acid spontaneously oxidized in 3 M KOH. This
non-reactivity of gluconic acid indicates that any coulombic efficiency above approximately 8%
(for 2 out of the 24 available electrons in fructose that are obtained by oxidation to the carboxylic
acid form) must be due to a reaction pathway that is alternative to this proposed two-electron
pathway. It is seen that, despite having gluconic acid at a 2 M concentration, very little charge
passed. The amount of charge that passed can mostly be accounted for by the viologen in the
cell, strongly indicating that gluconic acid is an end product.
114
For the carbohydrate-incubation test, DHA was added to 1 M KOH and the solution was
stirred in air for 12 hours. At the beginning of the incubation period, the solution quickly
became the yellow color associated with the formation of the carbohydrate enediol [75]. At the
end of the incubation period, the solution was nearly colorless; indicating that the enediol form
was no longer present. After the 12 hours, the solution was tested for pH using pH paper, which
indicated that the pH had dropped below pH 14, but was above pH 13. The solution was then
added to the anode compartment and a closed circuit potential imposed. Within a minute, 20 µL
of 3.2 M MV was added to the anode compartment. The solution remained almost colorless, as
opposed to the intense purple of the reduced viologen normally observed at that concentration,
and a very low, approximately 20 µA cm-2, current was observed. The cell was given 10 minutes
in which time there was no change. After the 10 minutes, 50 µL of fresh 3.2 M DHA was added
and the current increased, within seconds, to approximately 16.7 mA cm-2. This result strongly
indicates that, in addition to rapidly oxidizing the MV1+ to MV2+, oxygen in the cell also causes
the carbohydrate to become inactive to the viologen.
6.3.2 Coulombic efficiency
The coulombic efficiency and some of the variables controlling that efficiency are
important to the discussion of the use of carbohydrates as a fuel source in DCFCs; the practical
energy density of the fuel depends on that coulombic efficiency.
Our quasi-anaerobic and stirred-anode tests run at closed circuit potential give us a better
understanding of the upper limit on the coulombic efficiencies that are possible for
carbohydrates. The closed circuit has little direct effect on the oxidation of the carbohydrate (see
the fructose control) but it does affect the turnover of MV1+ to MV2+. As is reported in Chapter

115
4, if the viologen/carbohydrate ratio is low, electron transfer from the carbohydrate to MV2+
becomes limiting and the carbohydrate undergoing oxidation rearranges into unreactive
intermediates. At high ratios, and when the concentration of MV2+ is effectively increased from
rapid turnover, the viologen more efficiently oxidizes the carbohydrate and minimizes formation
of unreactive intermediates. For these reason the cell was run at a closed circuit potential.
Table 6.2 shows the coulombic efficiencies achieved with fructose and glucose under
various reaction conditions, as well as literature values that are available. Also included in Table
6.2 are the ratio of viologen to carbohydrate, and whether the cell was under aerobic or quasi-
anaerobic conditions. Table 6.2 confirms a trend seen in the sealed-vial experiments of Chapter
3, that higher MV concentration pushes oxidation of the carbohydrate further. Additionally, the
sealed-vial reactions indicated that far more than two electrons per carbohydrate were liberated
by the viologen. The fuel cell experiments indicate the same, but by precisely counting the
amount of charge passed, rather than through estimation from the consumption of oxygen.
Table 6.2 Coulombic-efficiency results. Cases 7 and 8 are literature values. Parenthetical values come from the total number of electrons per carbohydrate passed; non-
parenthetical values are corrected values that take into account electrons that may have come from auto-reduced viologen. The blank spot in
case 8 is from the value not being explicit in the literature
a) Ref. [12]. b) Ref. [75].
Case 1 2 3 4 5 6 7a 8b
Carbohydrate glucose fructose fructose fructose fructose fructose glucose glucoseMV:carbohydrate 1:1 1:50 1:1 2:1 5:1 1:1 3:200
Quasi-anaerobic yes yes yes yes yes no no noe- per oxidized carb. 4.5 (6.0) 4.1 5.2 (6.3) 6.0 (8.2) 7.7 (13.2) 2.5 (3.6) 0.6 2.6
Lower-bound efficiency 19% 17% 22% 25% 32% 10% 3% 11%

116
Case 1 in Table 6.2 shows that for glucose, approximately 19% of the available electrons
are harvested by the viologen at a 1/1 MV to glucose ratio. The range seen in the ‘e- per
oxidized carb.’ row is due to the auto-reduction of viologen. If all the charge which passed came
strictly from the glucose, then 6 electrons per glucose are seen passing, which is the number seen
in parentheses. As discussed above, though, some of the charge may have come from the auto-
reduction of viologen. If 1 e- per viologen was passed, then only 4.5 e- per glucose is seen
passing, which is the number seen out of the parentheses. This 4.5 e- per glucose number was
used to generate the 19% coulombic-efficiency number, which is considered the lower bound for
the efficiency at the given conditions. The number which takes into account possible electrons
from the viologen is the number which is used to calculate the coulombic efficiency for all the
different tests shown. Due to the unavoidable presence of oxygen in a cell with an air cathode, it
is thought that the actual coulombic efficiency for the catalytic oxidation of glucose by viologen
is certainly higher than the 19%, which should be viewed as a lower level estimate of the
possible extent of reaction.
Cases 2 through 5 on Table 6.2 are results for MV and fructose at different concentration
ratios. As per the theory expressed in Ref. [10], as the ratio of viologen to carbohydrate
increases, which means the concentration of MV2+ increases, more of the carbohydrate is
oxidized, even accounting for the auto-reduction of viologens. At a ratio of 1:50 approximately
17% of the electrons are seen passing, indicating that even at this relatively low concentrations of
viologen in quasi-anaerobic conditions, more electrons are passed than the two that would be if
the carbohydrate was oxidized only to the carboxylic acid form. At a ratio of 5:1, approximately
13.2 electrons per carbohydrate molecule are observed passing. After accounting for the large
number of electrons that potentially come from such a high concentration of viologen, 7.7 of the

117
available 24 electrons in a fructose molecule must necessarily have come from the fructose. That
7.7 number is considered a lower bound as well, because some of the fructose must have been
oxidized directly by the trace oxygen in the cell, as well as some of the MV1+ may have been
oxidized by the same trace oxygen.
A comparison of the results from the glucose case, which was performed at a 1:1 ratio,
with the fructose case at the same ratio is instructive. Higher currents are achieved with fructose
as the fuel, because it more readily forms the enediol intermediate than glucose [75]. For the 1:1
ratio, the coulombic efficiencies for glucose and fructose are within a fraction of an electron per
carbohydrate of each other. This indicates that though the current produced by glucose is less
than that produced by fructose, the rate of formation of unreactive intermediates appears to be
slower for glucose as well.
Case 6 of Table 6.2 has the results of fructose and MV at a 1:1 ratio in a cell that no
precautions were taken to make the cell anaerobic. Nitrogen was not bubbled through the KOH
solution before testing, and the anode compartment was not isolated in a nitrogen filled bag. It
can be seen that the coulombic efficiency is less than half that seen in a 1:1 cell that is quasi-
anaerobic.
Cases 7 and 8 of Table 6.2 contain the data of the Hawaii group. Case 7 contains earlier
results, and case 8 shows more recent results. Though Ref. [75] is not clear on the precise
concentrations used to achieve the given results, it states that when the cell was completely
discharged, around 2.6 electrons per carbohydrate molecule were passed. It is notable how
similar their results are with our aerobic results seen in case 6, despite the difference in our cell
geometries.
118
6.3.3 Closed-circuit current curves
It is informative to not only look at the coulombic efficiency, but also at the current-vs.-
time plots used to estimate that efficiency. The shape of the curves can inform us on what
currents we can obtain as the amount of charge passed by the cell increases, though in a fuel cell
with steady-state operation (flowing fuel) the current would be a weighted average of what is
seen.
Figure 6.3 shows two representative curves at different MV/fructose ratios. At relatively
low ratios (1:50), there are two distinct regimes to the catalysis. The first regime produces a
much higher current than the second. The high-ratio test (5:1) shows only one regime, the shape
of which is different than either the low-ratio test or the two control tests which are also shown
on Figure 6.3. Both tests were conducted in quasi-anaerobic 1 M KOH. The low-ratio test was
4.6 mM MV and 220 mM fructose. The high-ratio test was 115 mM MV and 22 mM fructose.
The difference in the concentrations explains the difference in the current produced by the cells.
Once the KOH solution and carbohydrate were added to the cell, the cell was set at a closed
circuit potential and recording for the test began. Within a minute, the MV in the oxidized state,
MV2+, was added to the cell, and the curves shown are the result. This slight delay explains why
the current starts near zero and then increases to its maximum; the oxidation of the carbohydrate
by MV2+ happens at a finite rate. This rate, and others, is the focus of an upcoming publication
by our group. If the cell is allowed time to equilibrate with respect to viologen oxidation state,
then the high current is produced once the test begins, but the overall shape of the resulting
curves are similar to those shown.

119
Figure 6.3 Plot of the current generated at a closed circuit potential for the control experiments of MV only and fructose only in 1 M KOH and by the oxidation of fructose at different ratios of MV to fructose in the anolyte. Cumulative electrons passed per fructose molecule for the test runs are indicated with arrows. Lines are a guide to the eye.
The number of electrons per fructose molecule passed during the initial, high-current
regime of the low-ratio test correspond closely to the two electrons that are expected to come
from the enediol form of the carbohydrate. This indicates that these two electrons are readily
accessible to the viologen. The second, lower-current regime appears after the first two electrons
have been passed, and continues at a nearly steady state for a much longer period than the initial
regime. In the test that is shown, the cell was allowed to run for another 10 hours, for a total of
14 hours in the low-current regime, during which two more electrons passed. To pass that total
of four electrons per fructose, each viologen must have been reduced and then oxidized
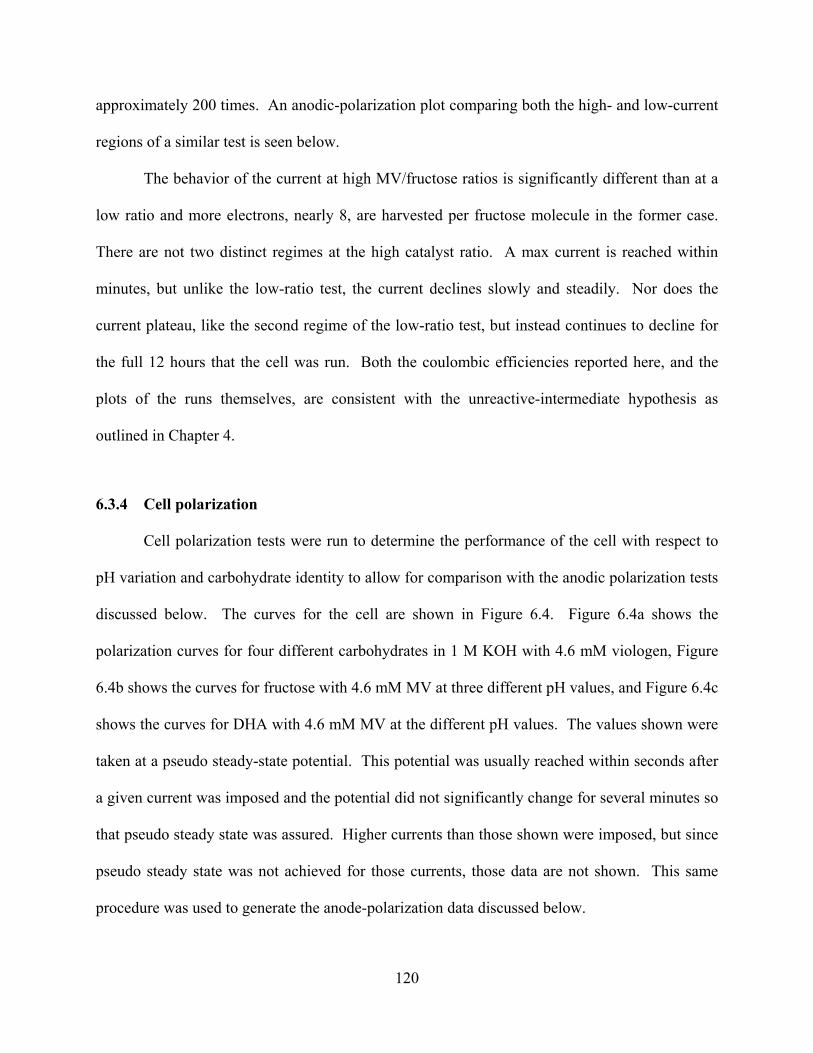
120
approximately 200 times. An anodic-polarization plot comparing both the high- and low-current
regions of a similar test is seen below.
The behavior of the current at high MV/fructose ratios is significantly different than at a
low ratio and more electrons, nearly 8, are harvested per fructose molecule in the former case.
There are not two distinct regimes at the high catalyst ratio. A max current is reached within
minutes, but unlike the low-ratio test, the current declines slowly and steadily. Nor does the
current plateau, like the second regime of the low-ratio test, but instead continues to decline for
the full 12 hours that the cell was run. Both the coulombic efficiencies reported here, and the
plots of the runs themselves, are consistent with the unreactive-intermediate hypothesis as
outlined in Chapter 4.
6.3.4 Cell polarization
Cell polarization tests were run to determine the performance of the cell with respect to
pH variation and carbohydrate identity to allow for comparison with the anodic polarization tests
discussed below. The curves for the cell are shown in Figure 6.4. Figure 6.4a shows the
polarization curves for four different carbohydrates in 1 M KOH with 4.6 mM viologen, Figure
6.4b shows the curves for fructose with 4.6 mM MV at three different pH values, and Figure 6.4c
shows the curves for DHA with 4.6 mM MV at the different pH values. The values shown were
taken at a pseudo steady-state potential. This potential was usually reached within seconds after
a given current was imposed and the potential did not significantly change for several minutes so
that pseudo steady state was assured. Higher currents than those shown were imposed, but since
pseudo steady state was not achieved for those currents, those data are not shown. This same
procedure was used to generate the anode-polarization data discussed below.
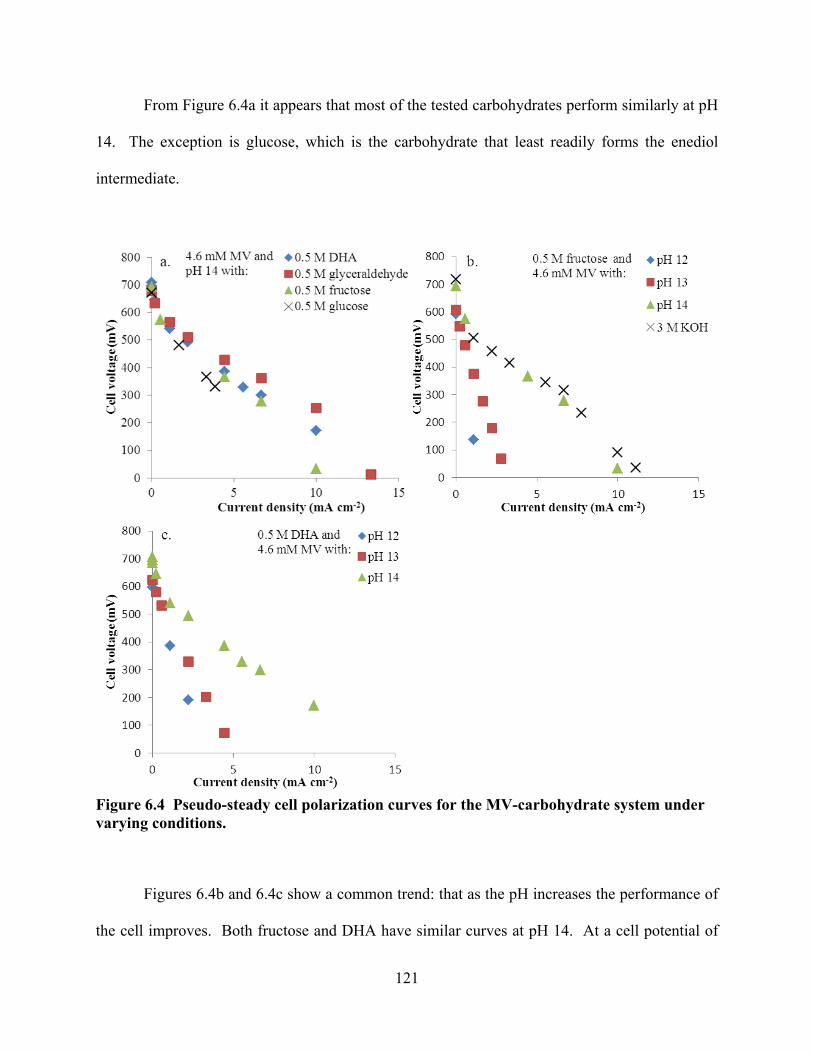
121
From Figure 6.4a it appears that most of the tested carbohydrates perform similarly at pH
14. The exception is glucose, which is the carbohydrate that least readily forms the enediol
intermediate.
Figure 6.4 Pseudo-steady cell polarization curves for the MV-carbohydrate system under varying conditions.
Figures 6.4b and 6.4c show a common trend: that as the pH increases the performance of
the cell improves. Both fructose and DHA have similar curves at pH 14. At a cell potential of
122
about 400 mV, both produce a current of 4.4 mA cm-2 for our cell. Fructose and DHA behave
differently at lower pH, though. At a current density of 1.1 mA, cell potential for fructose is
about 140 mV, while the cell potential is 390 mV at the same current for DHA. That difference
is telling, because the cathode is functioning the same at pH 12, so the difference must be due to
the behavior at the anode.
6.3.5 Anode polarization
Anode polarization plots (Figure 6.5) were obtained, with the use of a reference
electrode, to separately identify the overpotential of the anode with respect to pH, carbohydrate
and MV concentration, and carbohydrate identity. Unless otherwise noted, the data in Figure 6.5
were generated at the beginning of the oxidation of the carbohydrate (before 2 e- per
carbohydrate have passed), which means the performance shown corresponds to the high-current
regime as seen in the 1:50 ratio curve in Figure 6.3. Once all the reactants had been added to the
oxygen free cell, the cell was given 10 minutes to reach equilibrium with respect to viologen
oxidation state, at which time current is passed and galvanostatic data collected.
The anode polarization curves share features common to electrode polarization curves of
other fuel cell systems. At zero current, the equilibrium potential is seen. While current is
flowing there is a deviation from the potential at equilibrium. This deviation is called
overpotential. The constituents of the overpotential can be grouped into three categories; kinetic,
Ohmic, and concentration. The three constituents of overpotential are additive and Figure 6.6a is
a plot showing the combined shape of the potential as the current increases. For comparison,
also included in Figure 6.6a is the plot of the experimental DHA points from Figure 6.5a. The
“Combined overpotential” curve in Figure 6.6a is shown for purposes of illustration and is not
meant to show a rigorous fit of the data from Figure 6.5a.

123
Figure 6.5 Pseudo-steady anodic polarization curves under varying conditions. For Figure 6.5e, high- and low-current regimes are as seen in Figure 6.3.

124
Figure 6.6 The constituents of overpotential plotted together and separately. The curves in Figure 6.6b are examples of typical overpotential curves.
Figure 6.6b illustrates the constituents of the overpotential as separate curves [14]. The
kinetic overpotential depends logarithmically on the current density and the Ohmic overpotential
depends linearly on the current density. The concentration overpotential is negligible at low
currents, but becomes dominant as the concentration of charge carriers becomes depleted at the
electrode surface. The concentration overpotential goes to infinite magnitude at the limiting
current, which is the current at which reactants go to zero at the electrode interface due to mass
transport limitations.
Figure 6.5a shows curves for the anode at 0.5 M carbohydrate for four different
carbohydrates with 4.6 mM MV in 1 M KOH. These carbohydrates were chosen because they
are either some of the most abundant on earth (glucose and fructose) or are readily derived from
glycerol (DHA and glyceraldehyde) [141], which is a byproduct of biodiesel production, and are
therefore the most promising fuel sources of a future commercial fuel cell. Figure 6.5a tells a
similar story to Figure 6.4a. At a constant pH, if the carbohydrate produced a superior current

125
for a given potential on the cell polarization curve, then the current vs. potential was also
superior on the anodic polarization curve. These findings are in agreement with those in the
literature [75], in which the carbohydrates that most easily form the enediol intermediate produce
the highest current.
Figures 6.5b-d show the effect of variation of the different participants in the catalytic
reaction: the concentration of the catalyst, the carbohydrate, and hydroxide. All concentrations
were varied over at least an order of magnitude, with the MV and hydroxide being varied over
three orders.
Figure 6.5b shows curves for 0.5 M fructose with MV concentration variation in 1 M
KOH. The MV concentrations were chosen to approximate the wide range of concentrations
previously used by our group and the Hawaii group. (A similar rationale was used in selecting
fructose concentrations for the tests shown in Figure 6.5d). Figure 6.5b shows that, when
carbohydrate and hydroxide concentration are held constant, the current can be vastly increased
by increases in the catalyst concentration. This is good news, because methyl viologen is soluble
to approximately 3.2 M, which is nearly two orders of magnitude above the 46 mM that was the
maximum used in these tests. Additionally, observed increases in the current indicate that under
the given conditions the cell is not limited by the concentration of the enediol forms of the
carbohydrate but rather the concentration of the viologen.
Figure 6.5c shows curves for 0.5 M fructose with 4.6 mM viologen with pH variation.
The higher pH values were chosen because cathodic polarization is affected by pH, as is evident
in a comparison of Figures 6.4c and 6.5f. The lower pH values were chosen because both
viologen and the carbohydrate fuels are unstable, to varying degrees, at the higher pH values, so
it is of value to know the performance of the anode at lower pH values. Figure 6.4b, and the

126
polarization curves in Ref. [4], show that as hydroxide concentration increases, so does the
current produced by the cell for a given potential.
Perhaps counterintuitively, if we just look at the overpotential at the anode, as seen in
Figure 6.5c, when fructose and MV concentrations are held constant and hydroxide
concentration increases from 1 M OH- to 3 M OH-, the anode performs more poorly. This is
consistent with unpublished data from our lab that show that greater ionic strength of the solution
leads to a lower current at constant potential. (The unpublished data were tests of different
strength phosphate buffers at the same pH). Thus, the increase in the current seen in the cell
polarization curves (Figure 6.4b) is due to the improved performance of the cathode in 3 M OH-.
This suggests that an optimum pH can be reached, in which the positive and negative effects of
increasing hydroxide concentration are balanced.
Figure 6.5d shows curves for fructose concentration variation with 4.6 mM MV in 1 M
KOH. It shows that as MV and hydroxide concentrations are held constant, that increasing the
carbohydrate concentration increases the limiting current at the anode, and hence delays mass-
transport limitations, while having little effect on the overpotential at the anode below that
region. The limiting current was difficult to exactly measure with this apparatus because under
those conditions the cell frequently did not exhibit quasi-steady behavior. Nevertheless we can
conclude from Figures 6.5b and 6.5d that limiting current depends on both MV and carbohydrate
concentrations, with MV concentration dependence being the stronger effect. This suggests that
boundary layers formed next to the current collector in which both MV and carbohydrate
diffusive transport are important.
Figure 6.5e shows curves for 0.25 M fructose taken at the high- and low-current regimes
(as seen in Figure 6.3), with 4.6 mM MV in 1 M KOH. Curves were obtained at the low- and

127
high-current regimes to determine what effect the change in kinetic regime has on the potential at
the anode as a function of current. In the low-current regime the mass-transport control is
reached at approximately 4 mA cm-2, vs. after 7 mA cm-2 for the high current regime, but the
overpotential at the anode for both curves is similar until that point. This is similar to what is
seen Figure 6.5d, where the limiting current depends on the concentration of the carbohydrate.
The kinetic overpotential doesn’t seem to be strongly affected by concentration or by the regime
of the oxidation, whereas the limiting current is affected by these variables.
Figure 6.5f shows curves for 0.5 M DHA with 4.6 mM MV with pH variation and can be
compared to Figure 6.5c. Variation in pH was also done with DHA fuel to establish the effect
that carbohydrate identity has on the performance at the anode as pH changes. Figure 6.5c
shows that for fructose the potential at the anode in severely compromised at lower pH values,
whereas in Figure 6.5f there is relatively little sensitivity in the behavior at the anode for the
different pH values. Again, we see a pH dependence on the mass-transport-controlling regime at
high currents, particularly for pH less than 13. This result is especially important because DHA,
and glyceraldehyde, can easily be made by mildly oxidizing glycerol [141]. In biodiesel
production, the glycerol emerges from the process at pH 13. After the glycerol is oxidized to
DHA and glyceraldehyde under mild conditions, the carbohydrates can potentially be used
directly by a viologen-catalyzed cell to produce electricity.
Some comparative and summary statements can be made from Figures 6.4 and 6.5.
Figures 6.4b and 6.4c show relatively poor performance for the entire cell at pH 12 and 13.
Figure 6.5f shows the anode polarization curves for the cell polarization curves seen in Figure
6.4c. As can be seen, for the anode, there is relatively little change in overpotential between the
pH values, so the most significant portion of the overpotential is at the cathode. The cathode
128
performs very poorly at pH 12 and 13, and limits the current produced by the cell at a given
potential.
Taken together, Figures 6.4a, 6.5b, and 6.5f indicate strongly that one of the main
limiting factors in the production of electrons from the cell is the formation of the enediol
intermediate. DHA, a ketose incapable of forming an enediol-inhibiting ring structure, forms the
enediol readily whether the cell is in pH 12, 13, or 14. Fructose, also a ketose, forms the enediol
more readily than glucose, an aldose, and thus higher current density is generated. Glucose
readily forms a stable six-membered ring, and is known to be one of the most stable
carbohydrates.
Figures 6.5b, 6.5d, and 6.5f taken together indicate that one of the major limitations in
current production from the cell is the concentration of the catalyst. When the equilibrium
concentration of the enediol intermediate is quickly reached regardless of pH, as in 6.5f, the
current does not increase as rapidly with an increase in pH. Relatively large increases in current,
however, are achieved when the concentration of catalyst is increased on the same order of
magnitude.
6.3.6 Anode polarization: comparison between MV and monomethyl viologen
In order to compare the catalytic ability of MMV to MV, anode polarization curves were
taken (Figure 6.7). After the cleaning procedure described below, it was found, through
quantitative NMR analysis, that approximately 0.75% of the resulting powder was MV, with the
rest being the MMV. The curves show tests with 0.46 mM MV and 46 mM MMV in 3 M KOH
with 0.5 M fructose. The 46 mM MMV, which is approximately 0.75% MV, yields an MV
concentration of approximately 0.35 mM. The similarity between the curves may indicate that
MMV has a lower catalytic ability than is indicated by the results reported in Chapter 3.

129
Figure 6.7 Anode polarization curves for 46 mM MMV (with 0.75% MV) and 0.46 MV.
The monomethyl viologen (MMV) used for this test was prepared as described in
Chapter 3. When the MMV is prepared, some MV is also made and must be separated to obtain
higher purity MMV. The following steps were taken to clean the MMV of MV: 1) dry pyridine
added to the MMV/MV mixture, 2) liquid removed to a separate container, 3) one part acetone
and three to four parts hexanes added to the one part pyridine, 4) solution placed in freezer for 3
hours, 5) precipitate filtered. The pyridine dissolves MMV, but relatively little MV, and the
dissolved MMV precipitates out in the freezer. Therefore, the precipitate from step 5 is higher
purity MMV.
Conclusion 6.4
Coulombic efficiencies for the catalytic oxidation of carbohydrates by viologen were
presented. Under the various conditions tested, coulombic efficiencies between 17% and 33%
were observed, and are compared with values found in the literature ranging from 2.5% to 80%.
130
Fuel cell results confirm a similar trend seen with the sealed-vial experiments in Chapter 3,
where the higher the concentration of the viologen, the higher the coulombic efficiency that was
achieved. This higher coulombic efficiency is partly due to minimizing the formation of
unreactive intermediates.
The tests reported here were conducted at room temperature, 23 oC in this case. The
previous 80% coulombic efficiency data were obtained from tests at lower pH levels than used
here, typically pH 11, and at elevated temperatures, typically between 40 oC and 50 oC. Both
variables may have affected the coulombic efficiency achieved.
The reported coulombic efficiencies show what is possible given ideal conditions at room
temperature. In 1 M KOH a large fraction, up to 33%, of the electrons are made available by the
viologen. However, closed-circuit-potential tests at both low and high MV/fructose ratio show a
decrease in the current as the catalysis proceeds. At the low catalyst ratio, the first two electrons
are harvested relatively quickly, after which the current produced by the cell decreases
dramatically. At a high ratio, there is no sudden decrease in current, but rather a slow decline.
Either way, a tradeoff needs to be made between the number of electrons harvested and the size
of the fuel cell.
A reference electrode was used to separate the overpotential at the anode from that at the
cathode for a viologen DCFC. The more easily the carbohydrate formed the enediol
intermediate, the lower the overpotential at the anode, for a given current. Higher concentrations
of viologen lead to dramatically improved performance at the anode. The hydroxide
concentration had multiple effects, which also depended on the identity of the carbohydrate
tested. Fructose performed poorly at the lower pH values tested, and as the hydroxide
concentration increased from 1 M to 3 M, the performance at the anode decreased, which is

131
likely due to ionic-strength effects. The hydroxide concentration had a relatively small effect on
the anode of the cell with DHA as the fuel. This is likely due to the fact that DHA more readily
forms the enediol intermediate. It was also found that, especially at the lower pH values tested,
there was significant overpotential in the cell due to the cathode.

133
7 SUMMARY AND RECOMMENDATIONS FOR FUTURE WORK
Summary 7.1
The primary goal of this work was to answer questions about the effectiveness and utility
of viologen as a catalyst for use in direct carbohydrate fuel cells (DCFCs). This work has
answered questions starting from the most basic (are viologens catalytically active in the
oxidation of carbohydrates?) to the determination of heterogeneous kinetic values and the
generation of a proposed mechanism by which that catalysis proceeds.
Chapter 3 established that all tested viologens are indeed catalytically active towards
carbohydrates. By examining which molecules were active towards the viologen and what the
products of the reactions were, we obtained evidence that was used to generate a hypothesis for
the mechanism, as discussed in Chapter 4. Chapter 3 also established that high coulombic
efficiencies, perhaps up to 80%, are achievable under the proper conditions.
Chapter 4 provides information on the mechanism by which viologen catalyzes the
oxidation of carbohydrates. It was confirmed that viologens react with the enediol form of the
carbohydrate, and that viologens oxidize all tested molecules that are capable of forming the
enediol, not just carbohydrates. That fact, together with NMR evidence that shows formate and
carbonate as major products provides evidence that the carbohydrates are oxidized in a stepwise
fashion, with another enediol intermediate forming after the previous carbon-carbon bond is
broken.

134
Chapter 5 established that, of the organic dyes that have been suggested as catalysts for
DCFCs, viologens perform the best, based on the parameters examined in that chapter.
Compared to the other dyes, viologens have superior or equivalent redox potentials,
heterogeneous electron-transfer rates, and stability. It was also found that substituent length does
not significantly affect redox potential, so procedures to immobilize viologen by an alkyl chain
need not take into account the redox potential when chain length is determined, and other
parameters can be used.
Chapter 6 showed that a large number of the electrons contained in the tested
carbohydrates are also liberated by the viologens catalyst under fuel cell conditions. Knowledge
of coulombic efficiencies is very important because it provides information about the usable
energy density of the fuel. The behavior of a viologen-controlled anode under various conditions
was elucidated, showing the important result that for the carbohydrates DHA and glyceraldehyde
the performance at the anode is hardly affected by the pH, down to at least pH 12. This means
that dialkyl viologens are potentially good catalysts for those fuels because the dialkyl viologens
are stable on the order of months at pH 12. Also, current densities that are superior to the other
techniques for obtaining electricity from carbohydrate were demonstrated, with a current density
of 30 mA cm-2 achieved before the transport limit at the anode was reached for certain
conditions. Current densities given for other cells, as described in Chapter 2, are typically on the
order of 1 mA cm-2 or less, sometimes far less.
Figure 6.5b shows that the anode of a viologen-catalyzed cell can produce a current
density of at least 30 mA cm-2 before the limiting current is reached. If a cathode can be
obtained that performs well at pH 14, the pH of the tests in Figure 6.5b, then it is conceivable
that a ∆E of 0.5 V for the cell could be maintained at a current density of 30 mA cm-2, producing
135
a power output of 15 mW cm-2. At this level of power output, a cell around 0.7 m2 in superficial
electrode area could power a 100 W light bulb.
Future work 7.2
Now that we have a good idea about the capabilities and limitations of homogeneous
viologens, it is appropriate to begin synthesis and testing of immobilized viologens.
Therefore, the main future work in this BYU project is to immobilize viologen and test it
for catalytic activity. Chapter 2 lists a large number of immobilization techniques. These
techniques should be examined closely and evaluated for suitability. Criteria could include
whether or not the immobilized viologen has been tested for stability in alkaline conditions,
surface coverage, known electroactivity, and redox potential. Once the immobilized viologen
has been made, the redox potential and electroactivity should be tested using CV.
The ability of the immobilized viologen to catalytically oxidize carbohydrates should
then be tested. The catalytic ability should first be tested using a rotating disk electrode, where
the carbohydrate in solution will be oxidized at the viologen-coated electrode, generating a
current. Once catalytic ability has been established, testing can move to a fuel cell setting.
The best prospects for the fuel for a commercial viologen-catalyzed DCFC are the three-
carbon carbohydrates glyceraldehyde and DHA. These potential fuel sources work with the
catalyst at relatively low pH values (pH 12 and below), meaning that the catalyst will be stable
for a longer period of time compared to the higher pH values used for larger carbohydrates.
Challenges at the low pH values include the performance of the cathode, which does not perform
well at pH values where the dialkyl viologens are more stable.
A project related to the fuel cell would be to quantify the effect that ionic strength has on
the current produced by the cell, and determine the source of that effect. As seen in the Chapter
136
6, as the concentration of the hydroxide increases from 1 M to 3 M, the current produced by the
cell improves, but this improvement is only at the cathode. The anode actually performs more
poorly as the hydroxide concentration increases from 1 M to 3 M. Little quantitative information
on the ionic strength effect was obtained and that information would be useful.
Spectrophotometry-based experiments are already underway by our group to obtain
kinetic data for the homogeneous reaction between viologen and carbohydrates. The participants
of the reaction; the carbohydrate, the hydroxide, and the viologen have been shown to be first
order. The carbohydrate actually participates in the enediol form, and the carbohydrates that
form the enediol more easily, like DHA, have much higher rate constants and lower activation
energies, than carbohydrates that do not form the enediol as easily, like glucose.
Because the actual catalytic activity of the monoalkyl viologens is unknown, due to
variable contamination form dialkyl viologen (discussed in the methods section of Chapter 3),
more work needs to be done to separate the monoalkyl catalytic activity from that of the dialkyl
viologen. The monoalkyl viologens are of interest because they are more stable at higher pH
values, so determining their precise level of catalytic ability of also of interest. Due to the
difficulty in obtaining pure monosubstituted viologen, perhaps a good way to separate out the
catalytic activity of the monosubstituted viologen is to immobilize functionally monosubstituted
viologen on an electrode surface and test the surface for catalytic activity. This task is already
underway by our group.
Determination of the products of the oxidation could provide additional insight into the
course of the reaction at different catalyst ratios. This detection can be undertaken using a gas
chromatograph-mass spectrometry (GC-MS) instrument. Challenges include the presence of
high concentrations of salts (K+ + OH-) required for the reaction to take place, which negatively

137
affect the instrument. This issue can be overcome with the use of a simple device, the ion
exchange device (IED). The IED, described more fully in Appendix A, makes use of Nafion,
allowing the K+ ion in the reaction solution to diffuse into an HCl solution while H+ ions diffuse
into the test solution and combine with the OH- there, making water. In this way, the pH of the
solution can be neutralized while greatly reducing the presence of salt in the test solution. The
solution can then be diluted with methanol, a solvent that is better suited for use in a GC-MS,
and then run through the instrument.
The enediol form of the carbohydrate is produced as the carbohydrate is incubated in
alkaline solution. Having a higher enediol concentration when the carbohydrate meets the
viologen would cause a larger current than with fresh carbohydrate. It would be interesting to
study the effect of incubation time on the current. Also, it would be interesting to determine the
effect incubation on coulombic efficiency.
As can be seen in Equation 2.8, the oxidation of carbohydrates in alkaline conditions
leads to the productions of carbonate and the consumption of OH-. Carbonates potentially have
low solubility, and the formation of a precipitate within the cell could affect the long-term
performance of the cell. The main cation in the fuel solution is the counter ion to the hydroxide.
Thus, care should be taken in the selection of this counter ion. Approximately 8 moles of
potassium carbonate dissolve into 1 L of water, meaning that if potassium is used as the counter
ion it is unlikely that a potassium precipitate would form in the cell.
The high consumption of the OH- could also be a problem for a practical cell if carbonate
is the product. However, upon mild heating, carbonate dissociates into OH- and CO2. The CO2
would simply bubble off and the OH- could then be recycled. If a commercial cell were attached

138
to a biodiesel refinery (discussed in section 2.4) then the waste heat from the facility may be used
for to heat the used-fuel stream and liberate the OH-.
The performance at the viologen-catalyzed anode was the focus of Chapter 6.
Commercially available cathode material was used to gather that data. As discussed in Chapter
6, the cathode material performed relatively poorly at the lower pH values tested (i.e. pH 12 and
13). The viologen catalyst, however, is most stable at those lower pH values. The cathode
material that was used is typically used for zinc-air batteries that operate at high pH. If the
cathode catalyst material was altered so that the catalyst particles have a higher surface area,
such as by increasing the surface-area-to-volume ratio by reducing the size of the particle, then
the material may have improved performance at the lower pH values.
139
BIBLIOGRAPHY
[1] H.S. Stoker, General, Organic, and Biological Chemistry 3rd ed., Houghton Miflin, Boston, New York, 2004.
[2] J. McGinley, F.N. McHale, P. Hughes, C.N. Reid, A.P. McHale, Biotechnology Letters, 26 (2004) 1771-1776.
[3] S.K. Chaudhuri, D.R. Lovely, Nature Biotechnol., 21 (2003) 1229–1232.
[4] S.B. Aoun, G.S. Bang, T. Koga, Y. Nonaka, T. Sotomura, I. Taniguchi, Electrochem. Comm., 5 (2003) 317-320.
[5] H.-F. Cui, J.-S. Ye, X. Liu, W.-D. Zhang, F.-S. Sheu, Nanotechnology, 17 (2006) 2334-2339.
[6] S. Kerzenmacher, J. Ducree, R. Zengerle, F.v. Stetten, Journal of Power Sources, 182 (2008) 1-17.
[7] L. Yu, M.J. Wolin, J. Bacteriol, 98 (1969) 51-55.
[8] D.R. Wheeler, J. Nichols, D. Hansen, M. Andrus, S. Choi, G.D. Watt, Journal of the Electrochemical Society, 156 (2009) B1201-B1207. Reproduced by permission of ECS - The Electrochemical Society.
[9] P.M.S. Monk, The Viologens Physicochemical Properties, Synthesis and Applications of the Salts of 4,4' Bipyridine, John Wiley & Sons, Chichester, 1998.
[10] G.D. Watt, D. Hansen, D. Dodson, M. Andrus, D. Wheeler, Renewable Energy, 36 (2011) 1523-1528.

140
[11] D. Hansen, Y. Pan, J. Stockton, W. Pitt, D. Wheeler, Journal of the Electrochemical Society, (2012) Accepted for publication. Reproduced by permission of ECS - The Electrochemical Society.
[12] D. Scott, B.Y. Liaw, Energy & Environmental Science, 2 (2009) 965-969.
[13] D. Hansen, G. Watt, D. Wheeler, Journal of the Electrochemical Society, (2012) Sumbitted. Reproduced by permission of ECS - The Electrochemical Society.
[14] J. Newman, K.E. Thomas-Alyea, Electrochemical Systems Third Edition, John Wiley & Sons, Inc, Hoboken, NJ, 2004.
[15] J. Larminie, A. Dicks, Fuel Cell Systems Explained, John Wiley & Sons, Ltd, Chichester, 2000.
[16] S.C. Thomas, X. Ren, S. Gottesfeld, P. Zelenay, Electrochimica Acta, 47 (2002) 3741-3748.
[17] E. Fuel, in, 2009.
[18] R. O'Hayre, S.-W. Cha, W. Colella, F.B. Prinz, Fuel Cell Fundamentals, John Wiley & Sons, Inc., Hoboken, New Jersey, 2006.
[19] J. Liu, H. Wang, S. Cheng, K.-Y. Chan, Journal of Membrane Science, 246 (2005) 95-101.
[20] S.H. Seo, C.S. Lee, Applied Energy, 87 (2010) 2597-2604.
[21] B.S. Pivovar, Polymer, 47 (2006) 4194-4202.
[22] P. Berg, K. Promislow, J.S. Pierre, J. Stumper, B. Wetton, Journal of the Electrochemical Society, 151 (2004) A341-A353.
[23] Z. Qi, A. Kaufman, Journal of Power Sources, 109 (2002) 38-46.
[24] O. Savadogo, Journal of New Materials for Electrochemical Systems, 1 (1998) 047-066.
[25] X. Li, Principles of Fuel Cells, Taylor & Francis Group, LLC, New York, 2006.
141
[26] K.A. Mauritz, R.B. Moore, Chemical Reviews, 104 (2004) 4535-4585.
[27] S. Slade, S.A. Campbell, T.R. Ralph, F.C. Walsh, Journal of the Electrochemical Society, 149 (2002) A1556-A1564.
[28] M. Unlu, J. Zhou, P.A. Kohl, Angewandte Chemie Int. Ed., 49 (2010) 1299-1301.
[29] E.H. Yu, K. Scott, R.W. Reeve, Journal of Applied Electrochemistry, 36 (2006) 25-32.
[30] H.L.S. Salerno, F.L. Beyer, Y.A. Elabd, Polymer Physics, 50 (2012) 552-562.
[31] H. Zarrin, J. Wu, M. Fowler, Z. Chen, Journal of Membrane Science, 394-395 (2012) 193-201.
[32] M.R. Hibbs, M.A. Hickner, T.M. Alam, S.K. McIntyre, C.H. Fujimoto, C.J. Cornelius, Chemistry of Materials, 20 (2008) 2566-2573.
[33] M. Faraj, E. Elia, M. Boccia, A. Filpi, A. Pucci, F. Ciardelli, Polymer Chemsitry, 49 (2011) 3437-3447.
[34] J. Qiao, J. Fu, L. Liu, Y. Liu, J. Sheng, International Journal of Hydrogen Energy, 37 (2012) 4580-4589.
[35] J. Zhao, M. Unlu, I. Anestis-Richard, P.A. Kohl, Journal of Membrane Science, 350 (2010) 286-292.
[36] J.-J. Kang, W.-Y. Li, Y. Lin, X.-P. Li, X.-R. Xiao, S.-B. Fang, Polymers for Advanced Technologies, 15 (2004) 61-64.
[37] S. Lu, J. Pan, A. Huang, L. Zhuang, J. Lu, PNAS, 105 (2008) 20611-20614.
[38] J. Wang, J. Wang, S. Li, S. Zhang, Journal of Membrane Science, 368 (2011) 246-253.
[39] F. Davis, S.P.J. Higson, Biosensors and Bioelectronics, 22 (2007) 1224-1235.

142
[40] R.A. Bullen, T.C. Arnot, J.B. Lakeman, F.C. Walsh, Biosensors and Bioelectronics, 21 (2006) 2015-2045.
[41] A.T. Yahiro, S.M. Lee, D.O. Kimble, Biochimica et Biophysica Acta, 88 (1964) 375-383.
[42] A. Heller, Physical Chemistry Chemical Physics, 6 (2004) 209-215.
[43] L. Mor, E. Bubis, K. Hemmes, P. Schechner, IEEE, (2004) 278-281.
[44] R. Larsson, B. Folkesson, P.M. Spaziante, W. Veerasai, R.H.B. Exe, Renewable Energy, 31 (2006) 549-552.
[45] S. Kerzenmacher, J. Ducree, R. Zengerle, F.v. Stetten, Journal of Power Sources, 182 (2008) 66-75.
[46] D.H. Park, S.K. Kim, I.H. Shin, Y.J. Jeong, Biotechnology Letters, 22 (2000) 1301.
[47] D.H. Park, J.G. Zeikus, Appl Microbiol Biotechnol, 59 (2002) 58-61.
[48] A. Pizzariello, M. Stred'ansky, S. Miertus, Bioelectrochemistry, 56 (2002) 99-105.
[49] E. Katz, O. Lioubashevski, I. Willner, J. Am. Chem. Soc., 127 (2005) 3979-3988.
[50] V. Soukharev, N. Mano, A. Heller, Journal of the American Chemical Society, 126 (2004) 8368-8369.
[51] P. Kavanagh, S. Boland, P. Jenkins, D. Leech, Fuel Cells, 9 (2009) 79-84.
[52] P. Beltrame, M. Comotti, C.D. Pina, M. Rossi, Applied Catalysis A: General, 297 (2006) 1.
[53] P. Schechner, E. Kroll, E. Bubis, S. Chervinsky, E. Zussman, Journal of The Electrochemical Society, 154 (2007) B942-B948.
[54] C. Jin, I. Taniguchi, Materials Letters, 61 (2007) 2365-2367.

143
[55] C. Zhao, C. Shao, M. Li, K. Jiao, Talanta, 71 (2007) 1769-1773.
[56] E. Bubis, L. Mor, N. Sabag, Z. Rubin, U. Vaysban, K. Hemmes, P. Schechmer, in: Proceedings of FUEL CELL 2006, Fourth International Conference on Fuel Cell Science, Engineering and Technology, ASME, Irvine, California, 2006, pp. 1007-1014.
[57] C.K. Jin, T.V. Dang, Y. Ikee, T. Yamada, S. Sano, M. Shiro, Y. Nagao, ChemInform, 38 (2007) no-no.
[58] D. Basu, S. Basu, International Journal of Hydrogen Energy, 37 (2012) 4678-4684.
[59] M.R. Stetten, D.W. Stetten, Journal of Biological Chemistry, 187 (1950) 241-252.
[60] A. Kloke, B. Biller, U. Kraling, S. Kerzenmacher, R. Zengerle, F.v. Stetten, Fuel Cells, 11 (2011) 316-326.
[61] H. Lerner, J. Giner, J.S. Soeldner, C.K. Colton, Journal of the Electrochemical Society, 126 (1979) 237-242.
[62] P. Schechner, E. Bubis, L. Mor, in: Proceedings of FUEL CELL 2005, Third International Conference on Fuel Cell Science, Engineering, and Technology, AMSE, Ypsilanti, MI, United States, 2005, pp. 661-665.
[63] L. Michaelis, Chem. Rev., 16 (1935) 243-290.
[64] C.L. Bird, A.T. Kuhn, Chemical Society Reviews, 10 (1981) 49 - 82.
[65] E. Pia, R. Toba, M. Chas, C. Peinador, J.M. Quintela, Tetrahedron Letters, 47 (2006) 1953-1956.
[66] C. Lee, Y.W. Sung, J.W. Park, Journal of Electroanalytical Chemistry, 431 (1997) 133-139.
[67] Y.N. Forostyan, A.P. Oleinik, V.M. Artemova, Soviet Electrochemistry, 7 (1971) 691-692.
[68] O. Poizat, C. Sourisseau, J. Corset, Journal of Molecular Structure, 143 (1986) 203-206.
144
[69] K.P. Butin, A.A. Moiseeva, S.P. Gromov, A.I. Vedernikov, A.A. Botsmanova, E.N. Ushakov, M.V. Alfimov, Journal of Electroanalytical Chemistry, 547 (2003) 93-102.
[70] G. Tayhas, R. Palmore, H. Bertschy, S.H. Bergens, G.M. Whitesides, Journal of Electroanalytical Chemistry, 443 (1998) 155-161.
[71] L. Pospisil, J. Kuta, J. Volke, Electroanalytical Chemistry and Interfacial Electrochemistry, 58 (1975) 217-227.
[72] P.M.S. Monk, N.M. Hodgkinson, Electrochimica Acta, 43 (1998) 245-255.
[73] A. Nakahara, J.H. Wang, J. Phys. Chem., 67 (1963) 496-498.
[74] J.A. Farrington, A. Ledwith, M.F. Stam, Journal of the Chemical Society D: Chemical Communications, (1969) 259-260.
[75] D.M. Scott, T.H. Tsang, L. Chetty, S. Aloi, B.Y. Liaw, Journal of Power Sources, 196 (2011) 10556-10562.
[76] K. Arihara, F. Kitamura, Journal of Electroanalytical Chemistry, 550-551 (2003) 149-159.
[77] A. Fernandez, M. Innocenti, R. Guidelli, Journal of Electroanalytical Chemistry, 532 (2002) 237-246.
[78] B. Barroso-Fernandez, M.T. Lee-Alvarez, C.J. Selisker, W.R. Heineman, Analytica Chimica Acta, 370 (1998) 221-230.
[79] J. Litong, J. Ping, Y. Jiannong, F. Yuzhi, Talanta, 39 (1992) 145-147.
[80] M.E. Ghica, C.M.A. Brett, Analytica Chimica Acta, 532 (2005) 145-151.
[81] D. Quan, D.G. Min, G.S. Cha, H. Nam, Bioelectrochemistry, 69 (2006) 267-275.
[82] R. Maalouf, H. Chebib, Y. Saikali, O. Vittori, M. Sigaud, N. Jaffrezic-Renault, Biosensors and Bioelectronics, 22 (2007) 2682-2688.

145
[83] T. Komura, K. Kijima, T. Yamaguchi, K. Takahashi, Journal of Electroanalytical Chemistry, 486 (2000) 166-174.
[84] T. Ohsaka, H. Yamamoto, M. Kaneko, A. Yamada, M. Nakamura, S. Nakamura, N. Oyama, Bull. Chem Soc. Jpn., 57 (1984) 1844-1849.
[85] A. Walcarius, L. Lamberts, E.G. Derouane, Electrochimica Acta, 38 (1993) 2257-2266.
[86] L.L. A. Walcarius, E. G. Derouane, Electrochimica Acta, 38 (1993) 2267-2276.
[87] J.-H. Ryu, J.-H. Lee, S.-J. Han, K.-D. Suh, Colloids and Surfaces A: Physicochemical and Engineering Aspects, 315 (2008) 31-37.
[88] N. Vlachopoulos, J. Nissfolk, M. Möller, A. Briançon, D. Corr, C. Grave, N. Leyland, R. Mesmer, F. Pichot, M. Ryan, G. Boschloo, A. Hagfeldt, Electrochimica Acta, 53 (2008) 4065-4071.
[89] Z. Sharrett, S. Gamsey, P. Levine, D. Cunningham-Bryant, B. Vilozny, A. Schiller, R.A. Wessling, B. Singaram, Tetrahedron Letters, 49 (2008) 300-304.
[90] T. Yamaguchi, K. Takahashi, T. Komura, Electrochimica Acta, 46 (2001) 2527-2535.
[91] A.K.M. Kafi, D.-Y. Lee, S.-H. Park, Y.-S. Kwon, Microchemical Journal, 85 (2007) 308-313.
[92] J. Li, G. Cheng, S. Dong, Electroanalysis, 9 (1997) 834-837.
[93] J. Li, J. Yan, Q. Deng, G. Cheng, S. Dong, Electrochimica Acta, 42 (1997) 961-967.
[94] N.-S. Lee, H.-K. Shin, D.-J. Qian, Y.-S. Kwon, Thin Solid Films, 515 (2007) 5163-5166.
[95] J.-Y. Ock, H.-K. Shin, Y.-S. Kwon, J. Miyake, Colloids and Surfaces A: Physicochemical and Engineering Aspects, 257-258 (2005) 351-355.
[96] T. Sagara, H. Tsuruta, N. Nakashima, Journal of Electroanalytical Chemistry, 500 (2001) 255-263.

146
[97] S. Dong, J. Li, Bioelectrochemistry and Bioenergetics, 42 (1997) 7-13.
[98] H.C.D. Long, D.A. Buttry, Lanmuir, 8 (1992) 2491-2496.
[99] A. Factor, G.E. Heinsohn, Journal of Polymer Science. Part B, Polymer Letters, 9 (1971) 289.
[100] L. Futian, Y. Xianda, F. Liangbo, L. Shuben, European Polymer Journal, 31 (1995) 819-824.
[101] H. Sato, T. Tamamura, Journal of Applied Polymer Science, 24 (1979) 2075-2085.
[102] M.S. Simon, P.T. Moore, Journal of Polymer Science: Polymer Chemistry Edition, 13 (1975) 1-16.
[103] K. Ageishi, T. Endo, M. Okawara, Macromolecules, 16 (1983) 884-887.
[104] X. Liu, K.G. Neoh, E.T. Kang, Marcomolecules, 36 (2003) 8361-8367.
[105] M. Okawara, Journal of Polymer Science: Polymer Chemistry Edition, 17 (1979) 927-930.
[106] T. Ohsaka, M. Nakanishi, O. Hatozaki, N. Oyama, Electrochimica Acta, 35 (1989) 63-64.
[107] P. Bauerle, K.U. Gaudl, Synthetic Metals, 43 (1991) 3037-3042.
[108] M. Pravda, in, 2000.
[109] D.R. Rosseinsky, P.M.S. Monk, R.A. Hann, Electrochimica Acta, 35 (1990) 1113-1123.
[110] C.-Y. Hsu, C.-H. Liao, K.-C. Ho, Solar Energy Materials and Solar Cells, 92 (2008) 194-202.
[111] L. Coche, A. Deronzier, J.-C. Moutet, Journal of Electroanalytical Chemistry, 198 (1986) 187-193.

147
[112] T. Komura, T. Yamaguchi, K. Furuta, K. Sirono, Journal of Electroanalytical Chemistry, 534 (2002) 123-130.
[113] H.C. Ko, S.-a. Park, W.-k. Paik, H. Lee, Synthetic Metals, 132 (2002) 15-20.
[114] D.-J. Qian, C. Nakamura, J. Miyake, Thin Solid Films, 374 (2000) 125-133.
[115] Z. Shi, K.G. Neoh, E.T. Kang, Biomaterials, 26 (2005) 501-508.
[116] J. Zhang, T. Abe, M. Kaneko, Journal of Electroanalytical Chemistry, 438 (1997) 133-138.
[117] T. Sata, Journal of Membrane Science, 118 (1996) 121-126.
[118] Y. Ikeda, M. Ikeda, F. Ito, Solid State Ionics, 169 (2004) 35-40.
[119] C.J. Schoot, J.J. Ponjee, H.T.v. Dam, R.A.v. Doorn, P.T. Bolwijn, Appl. Phys. Lett. , 23 (1973) 64-65.
[120] J.C. Thompson, B.B. He, Applied Engineering in Agriculture, 22 (2006) 261-265.
[121] Y. Zheng, X. Chen, Y. Shen, Chemical Reviews, 108 (2008) 5253-5277.
[122] P.M.S. Monk, Fundamentals of Electroanalytical Chemistry, John Wiley & Sons Ltd., Chichester, 2001.
[123] D.T. Sawyer, A. Sobkowiak, J. Julian L. Roberts, Electrochemistry for Chemists, John Wiley & Sons, New York, 1995.
[124] V.S. Bagotsky, Fundamentals of Electrochemistry John Wiley & Sons, Inc. , Hoboken, New Jersey, 2006.
[125] A. Read, D. Hansen, S. Aloi, W.G. Pitt, D.R. Wheeler, G.D. Watt, Renewable Energy, 46 (2012) 218-223.
[126] G.D. Watt, Analytical Biochemistry, 99 (1979) 399-400.

148
[127] Y. Miao, J.Y. Chen, X. Jiang, Z. Huang, Applied Biochemistry and Biotechnology, 167 (2012) 358-366.
[128] W. Zhang, G. Wei, Energy Sources, Part A: Recovery, Utilization, and Environmental Effects, 34 (2012) 1178-1186.
[129] B.Y. Yang, R. Montgomery, Carbohydrate Research, 280 (1996) 27-45.
[130] E. Katz, A.L.d. Lacey, J.L.G. Fierro, J.M. Palacios, V.M. Fernandez, Journal of Electroanalytical Chemistry, 358 (1993) 247-259.
[131] N.G. Tsierkezos, Journal of Solution Chemistry, 36 (2007) 1301-1310.
[132] J.E.B. Randles, Transactions of the Faraday Society, 44 (1948) 327-338.
[133] T. Yinxuan, Y. Hangsheng, S. Baoen, Dianhuaxue (Electrochemistry), 3 (1997) 334-337.
[134] R.S. Nicholson, Analytical Chemistry, 37 (1965) 1351-1355.
[135] S. Bao-En, W. Gui-Liang, T. Yin-Xuan, Wuli Huaxue Xuebao (Acta Physico-Chimica Sinica), 8 (1992) 476-480.
[136] W.M. Clark, Oxidation-Reduction Potential of Organic Systems, The Williams & Wilkins Company, Baltimore, 1960.
[137] T. Reda, C.M. Plugge, N.J. Abram, J. Hirst, PNAS, 105 (2008) 10654-10658.
[138] S. Budavari, M.J. O'Neal, A. Smith, P.E. Heckelman, The Merck Index: An Encyclopedia of Chemicals, Drugs, and Biologicals Eleventh Edition, Eleventh ed., Merck & Co., Inc., Rahway, New Jersey, 1989.
[139] N. Fujiwara, S.-i. Yamazaki, Z. Siroma, T. Ioroi, H. Senoh, K. Yasuda, Electrochemisty Communications, 11 (2009) 390-392.
[140] H.P. Bennetto, G.M. Delaney, J.R. Mason, S.D. Roller, J.L. Stirling, Biotechnology Letters, 7 (1985) 699-704.

149
[141] M.A. Dasari, P.-P. Kiatsimkul, W.R. Sutterlin, G.J. Suppes, Applied Catalysis A: General, 281 (2005) 225-231.
151
APPENDIX A. ION EXCHANGE DEVICE FOR REMOVING INORGANIC SALTS FROM TEST SOLUTIONS
This appendix describes a method that can be used to remove some inorganic salts from
alkaline solutions so that the solutions can be tested in a gas chromatography-mass spectrometry
(GC-MS) instrument, or other mass spectrometry instruments.
GC-MS can be used to identify the presence of organic compounds. The GC-MS
instruments work by evaporating the compounds of interest, and can therefore be sensitive to the
presence of compounds that are difficult to volatize, such as inorganic salts. Additionally, the
presence of salts in the solution can cause an effect called “ion suppression,” where the peaks of
some of the species are suppressed by the salt.
The viologen-catalyzed oxidation of carbohydrate requires the presence of hydroxide
(OH-) ions, which are typically supplied to the solution in the form of potassium hydroxide
(KOH). Some of the salts formed by the K+, such as KOH, or KCl if the reaction is quenched
with HCl, can clog the instrument tips when the solvent that is carrying them is evaporated.
The following simple device, the ion-exchange device (IED), can be used to significantly
reduce the presence of K+ in the solution while simultaneously quenching the reaction, which is
also useful if it is desired for the reaction to be followed by time series.
Figure A.1 shows a piece of Teflon, or other acid-resistant material, machined to make a
well. In the well, place HCl (typically 1 to 3 M). On top of the well, place a piece of Nafion (for
a description of Nafion, see Chapter 2). On top of the Nafion, place the reaction solution you
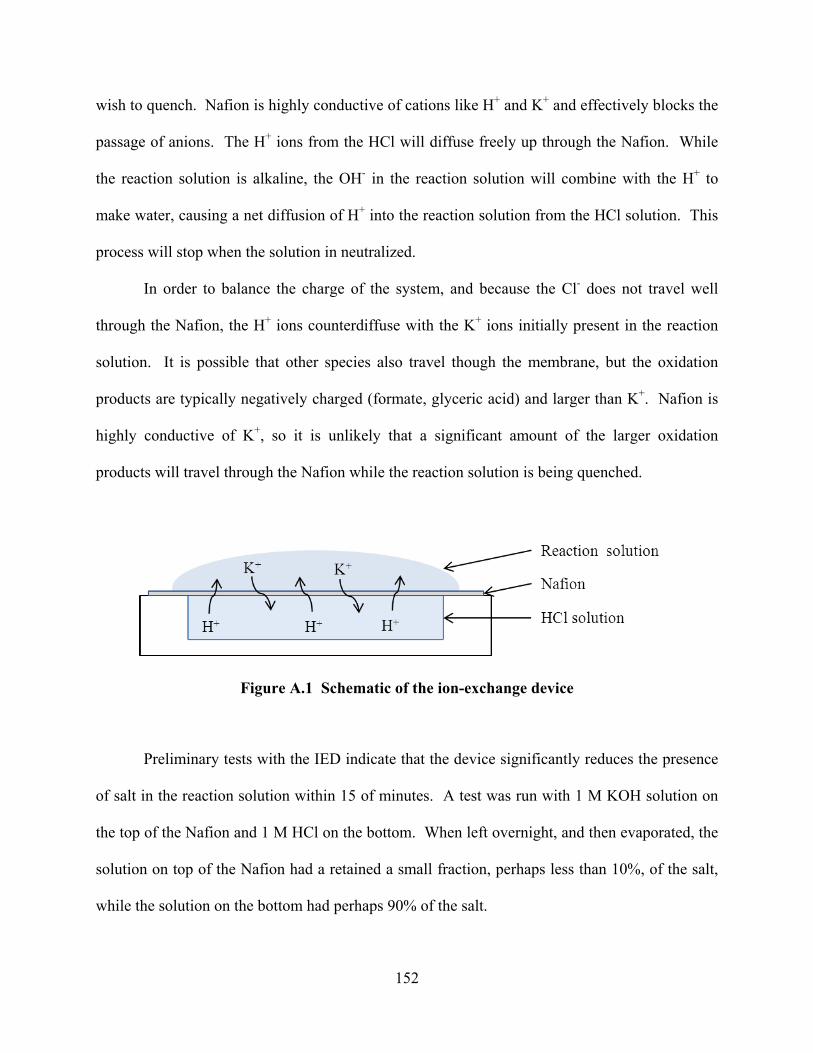
152
wish to quench. Nafion is highly conductive of cations like H+ and K+ and effectively blocks the
passage of anions. The H+ ions from the HCl will diffuse freely up through the Nafion. While
the reaction solution is alkaline, the OH- in the reaction solution will combine with the H+ to
make water, causing a net diffusion of H+ into the reaction solution from the HCl solution. This
process will stop when the solution in neutralized.
In order to balance the charge of the system, and because the Cl- does not travel well
through the Nafion, the H+ ions counterdiffuse with the K+ ions initially present in the reaction
solution. It is possible that other species also travel though the membrane, but the oxidation
products are typically negatively charged (formate, glyceric acid) and larger than K+. Nafion is
highly conductive of K+, so it is unlikely that a significant amount of the larger oxidation
products will travel through the Nafion while the reaction solution is being quenched.
Figure A.1 Schematic of the ion-exchange device
Preliminary tests with the IED indicate that the device significantly reduces the presence
of salt in the reaction solution within 15 of minutes. A test was run with 1 M KOH solution on
the top of the Nafion and 1 M HCl on the bottom. When left overnight, and then evaporated, the
solution on top of the Nafion had a retained a small fraction, perhaps less than 10%, of the salt,
while the solution on the bottom had perhaps 90% of the salt.
Recommended