Home Appliance Industry of PakistanInternship Report
Standard Chartered Bank Pakistan Ltd.Origination & Client Coverage
Whole Sale Banking
Presented by:
Ahmad Shahzad Saeed
Presented to:
Asad Altaf (Director OCC)
Table of ContentsExecutive Summary.....................................................................................................................................2
Home Appliance Industry of Pakistan..........................................................................................................3
Gray Market:...............................................................................................................................................3
Segment Selection Criterion:.......................................................................................................................4
Over View of Home Appliance industry in pakistan.....................................................................................4
Important factors....................................................................................................................................5
Home Appliance Industry............................................................................................................................5
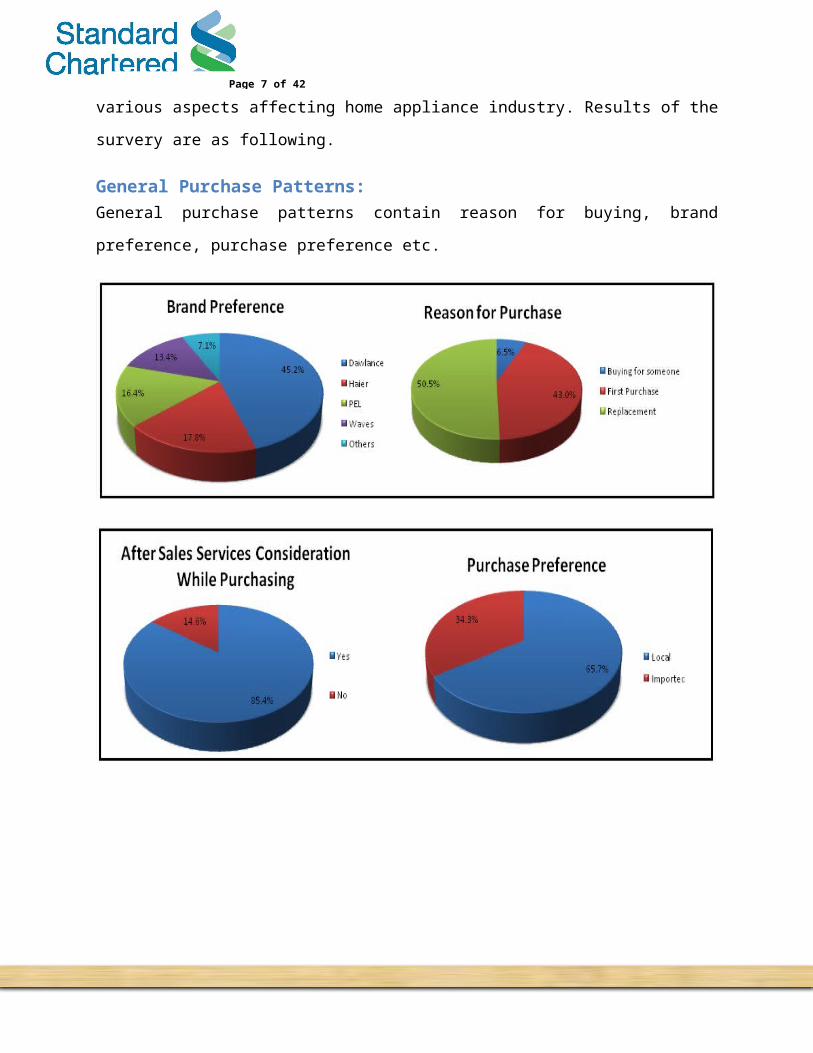
General Purchase Patterns:.....................................................................................................................5
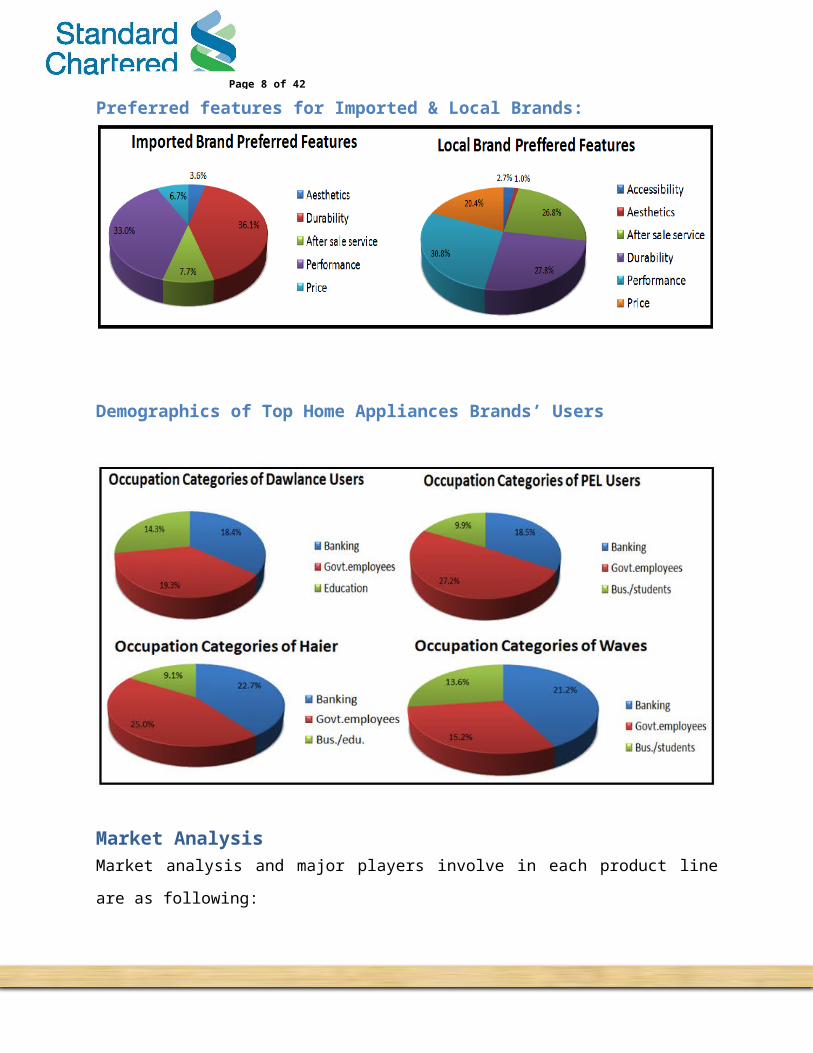
Preferred features for Imported & Local Brands:....................................................................................6
Demographics of Top Home Appliances Brands’ Users...........................................................................7
Market Analysis...........................................................................................................................................7
Air conditioner.........................................................................................................................................7
Historical Performance:.......................................................................................................................7
Company Wise Analysis.......................................................................................................................9
Haier:...................................................................................................................................................9
ORIENT:.............................................................................................................................................11
PEL:....................................................................................................................................................13
Dawlance:..........................................................................................................................................15
Refrigerator...........................................................................................................................................17
Historical Performance:.....................................................................................................................18
Dawlance (Refrigerators & Deep Freezers):.......................................................................................19
Haier:.................................................................................................................................................21
Orient:...............................................................................................................................................22
Waves:...............................................................................................................................................24
PEL:....................................................................................................................................................25
Pre Budget Situation..................................................................................................................................28
Impact of Budget on Home Appliance Industry.....................................................................................28

Executive Summary
Over all Home appliance industry is fragmented and is equally divided between local
manufacturers and importers. Market in Pakistan is such that big multinational players tend to
just penetrate with local joint ventures or opening up its marketing and sales division as in case
of Mitsubishi, Samsung with Orient and LG with PEL, and Haier as a subsidiary of global Haier.
Reasons behind such strategy are
i. Already presence of local established players like PEL, Dawlance and Waves.
ii. Not so lucrative market due to easily available smuggled goods.
iii. Pie is too small to jump in for MNCs.
More over home appliance industry faced a recession in late 2008 and 2009, but 2010 data shows
that it had started recovering, but that time allowed new players like Haier establish well in the
market on the account of lack in performance by local players like Dawlance and PEL. The
recovery would have been much better if country was not to face floods of 2010. Sales were
impacted but as we know rehabilitation and recovery of affected areas is under process which
indicates that home appliances are going to be part of these recovery processes, so future of the
industry is going to be further brighter.
Page 1 of 31
Page 2 of 31
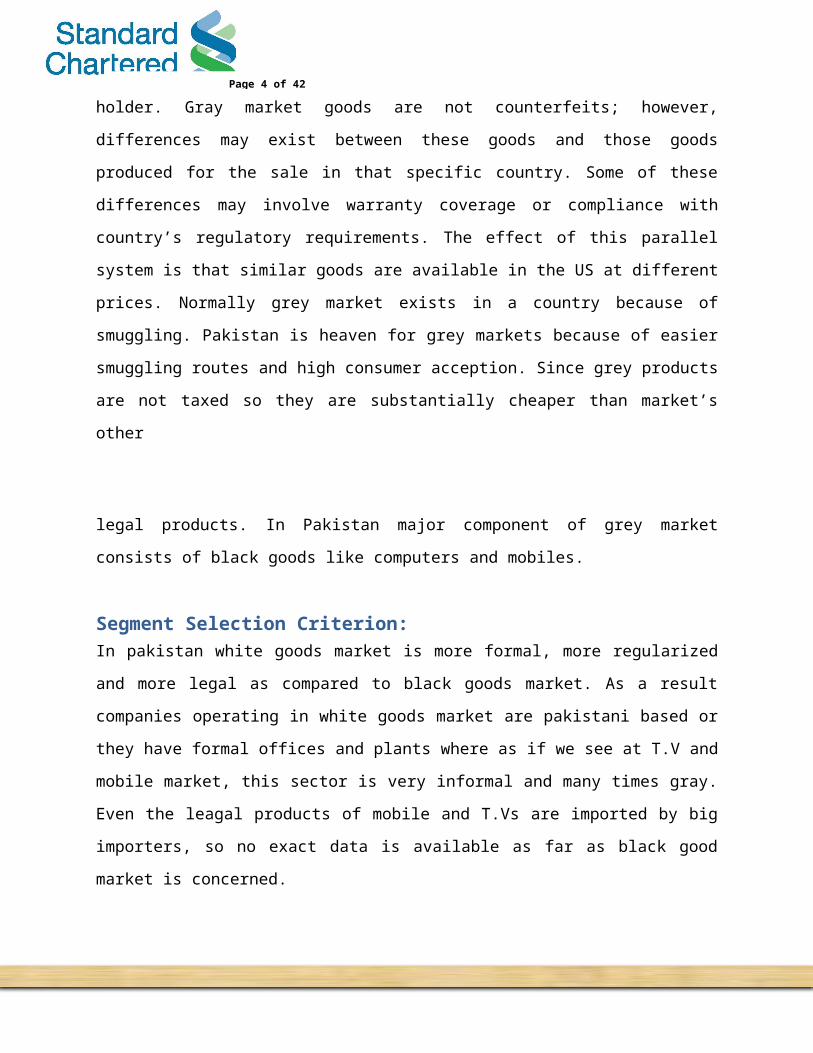
Home Appliance Industry of PakistanHome Appliance and Electronic goods are the main and integral components of daily life. A user
very frequently uses the Home Appliances and Electronic goods. Home Appliances and
Electronics goods form an industry, which needs to be faced with favorable policies by the state.
Home appliances are generally divided into two segments, White Goods and Black Goods, white
goods contain heavy consumer durables such as Air Conditioners, Refrigerators, Deep Freezers
and Microwaves where as Black goods contain relatively light electronic consumer durables such
as TVs, radios, digital media players, and computers.
Gray Market:Gray market goods are defined as items manufactured abroad and imported into the country
without the consent of the trademark holder. Gray market goods are not counterfeits; however,
differences may exist between these goods and those goods produced for the sale in that specific
country. Some of these differences may involve warranty coverage or compliance with country’s
regulatory requirements. The effect of this parallel system is that similar goods are available in
the US at different prices. Normally grey market exists in a country because of smuggling.
Pakistan is heaven for grey markets because of easier smuggling routes and high consumer
acception. Since grey products are not taxed so they are substantially cheaper than market’s other

Page 3 of 31
legal products. In Pakistan major component of grey market consists of black goods like
computers and mobiles.
Segment Selection Criterion:In pakistan white goods market is more formal, more regularized and more legal as compared to
black goods market. As a result companies operating in white goods market are pakistani based
or they have formal offices and plants where as if we see at T.V and mobile market, this sector is
very informal and many times gray. Even the leagal products of mobile and T.Vs are imported
by big importers, so no exact data is available as far as black good market is concerned.
In my report I will focus on white goods market since its more formal and reguralized and
second reason is because our existing and possible clients are from this segment.
Over View of Home Appliance industry in pakistanAccording to the report by Daily Times (www.dailytimes.com.pk), the business environment is
highly favorable for investment in home appliance industry of Pakistan. Therefore home
appliance industry is getting attention of foreign investors as well. China‟s home appliance giant
Haier has established the industrial zone in Punjab, Pakistan which is its second overseas
manufacturing base after United States. This is joint venture in home appliance industry between
Government of China and the private sector of Pakistan. It is very large and growing business
sector in Pakistan. In Pakistani home appliance market, there are two types of companies
involved in appliance business those are local and imported manufacturers and marketers. They
are engaged in both aspects of marketing that is business-to-business marketing (B2B) and
business-to-consumer (B2C) marketing. In business-to-business, the manufacturers sell their
products to retailers those are known as dealers. Dealers are responsible for retail selling to the
end users. A few of the companies also have their own retail outlets also. Since last few years the
manufacturers are facing a competitive and challenging situation in business-to-business
relationships due to following reasons.
Page 4 of 31
Important factors There are three factors to take into account for home appliance industry in Pakistan. Firstly, the
challenging situation has been created by dealers whose profits have been reduced due to certain
policies adopted by manufacturers in the last few years. So they are looking forward to new
manufacturers entering in the industry. More profits and better services are also being included
in their demands. Secondly, the new entrants in the manufacturing industry including
manufacturers and importers, either they are local or foreign investors have challenged the
domination of existing manufacturers and importers. Thirdly, due to the expansion in market size
horizontally and vertically, competitive situation has been increased among manufacturers within
the industry. Fluctuating customer requirements and competitive forces are putting more pressure
on marketers. They are demanding superior marketing strategy and tactical execution (Anni, I.
2002). According to Peter Cheverton, the relationships between B2B suppliers and customers
have become a vital source of competitive advantage. Many companies are moving from
traditional marketing towards relational-oriented marketing (Cheverton, P. 2004). Suppliers have
acknowledged that improved customer- supplier relationships increase key accounts customer
retention and loyalty more successfully (Abratt, R. & Kelly, P.M. 2002).
Home Appliance IndustryHome appliance industry of pakistan include names like WAVES, PEL, Dawlance, Haier, Orient
etc. A survey has been conducted on various aspects affecting home appliance industry. Results
of the survery are as following.
General Purchase Patterns:General purchase patterns contain reason for buying, brand preference, purchase preference etc.
Page 5 of 31
Preferred features for Imported & Local Brands:
Page 6 of 31
Demographics of Top Home Appliances Brands’ Users
Market AnalysisMarket analysis and major players involve in each product line are as following:
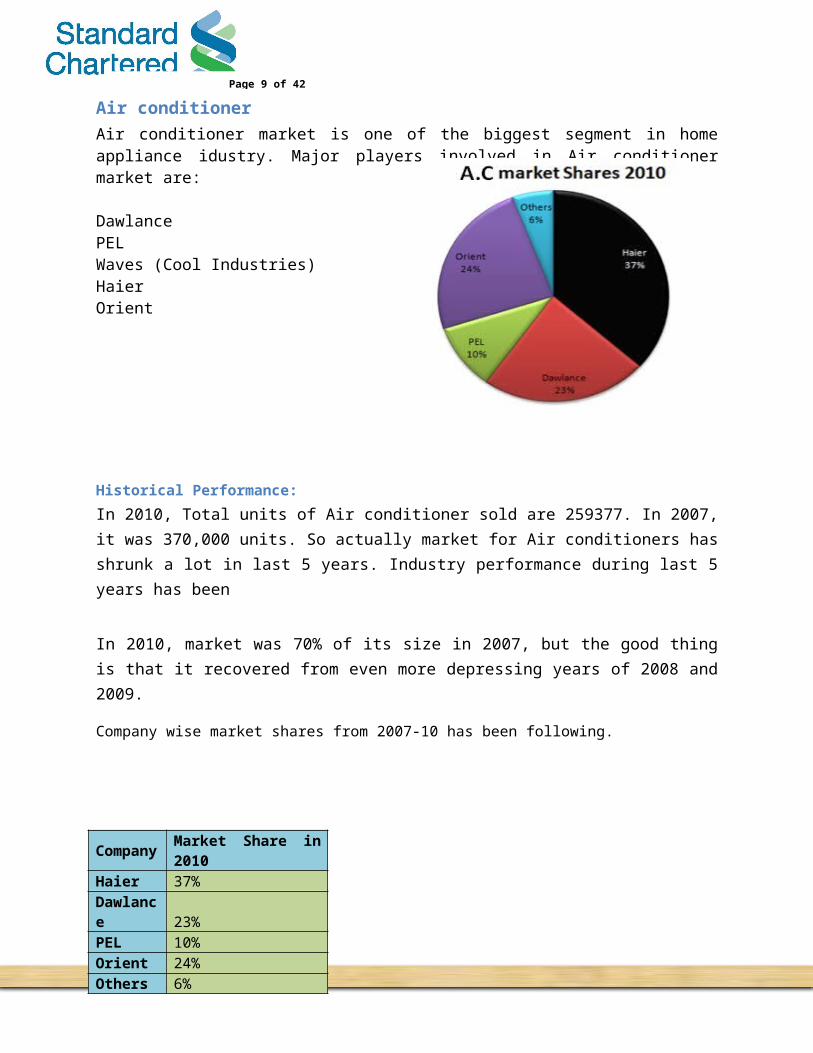
Air conditionerAir conditioner market is one of the biggest segment in home appliance idustry. Major players involved in Air conditioner market are:
DawlancePELWaves (Cool Industries)HaierOrient
Company Market Share in 2010Haier 37%Dawlance 23%PEL 10%Orient 24%Others 6%
Page 7 of 31
Historical Performance:In 2010, Total units of Air conditioner sold are 259377. In 2007, it was 370,000 units. So actually market for Air conditioners has shrunk a lot in last 5 years. Industry performance during last 5 years has been
2007 2008 2009 20100%
20%
40%
60%
80%
100%
120%
100%
57% 59%70%
Industry Size
Industry Size
In 2010, market was 70% of its size in 2007, but the good thing is that it recovered from even more depressing years of 2008 and 2009.
Company wise market shares from 2007-10 has been following.
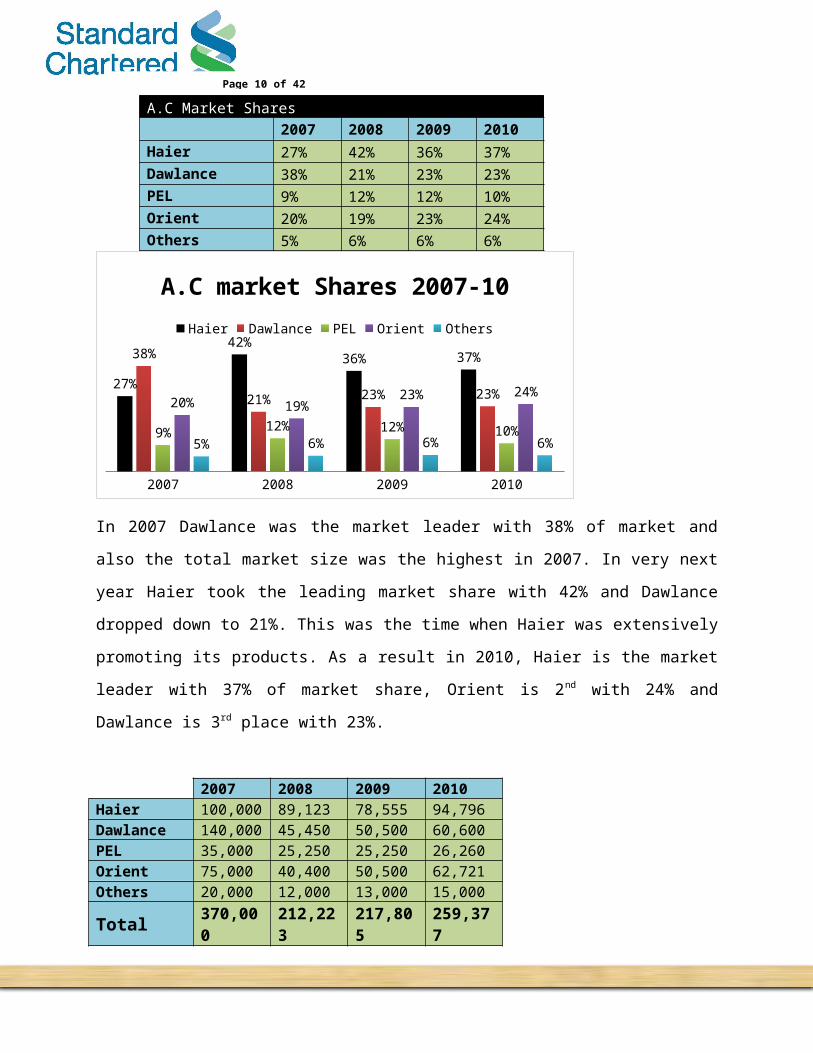
A.C Market Shares2007 2008 2009 2010
Haier 27% 42% 36% 37%Dawlance 38% 21% 23% 23%PEL 9% 12% 12% 10%Orient 20% 19% 23% 24%Others 5% 6% 6% 6%
Page 8 of 31
2007 2008 2009 2010
27%
42%36% 37%38%
21% 23% 23%
9% 12% 12% 10%
20% 19%23% 24%
5% 6% 6% 6%
A.C market Shares 2007-10Haier Dawlance PEL Orient Others
In 2007 Dawlance was the market leader with 38% of market and also the total market size was
the highest in 2007. In very next year Haier took the leading market share with 42% and
Dawlance dropped down to 21%. This was the time when Haier was extensively promoting its
products. As a result in 2010, Haier is the market leader with 37% of market share, Orient is 2 nd
with 24% and Dawlance is 3rd place with 23%.
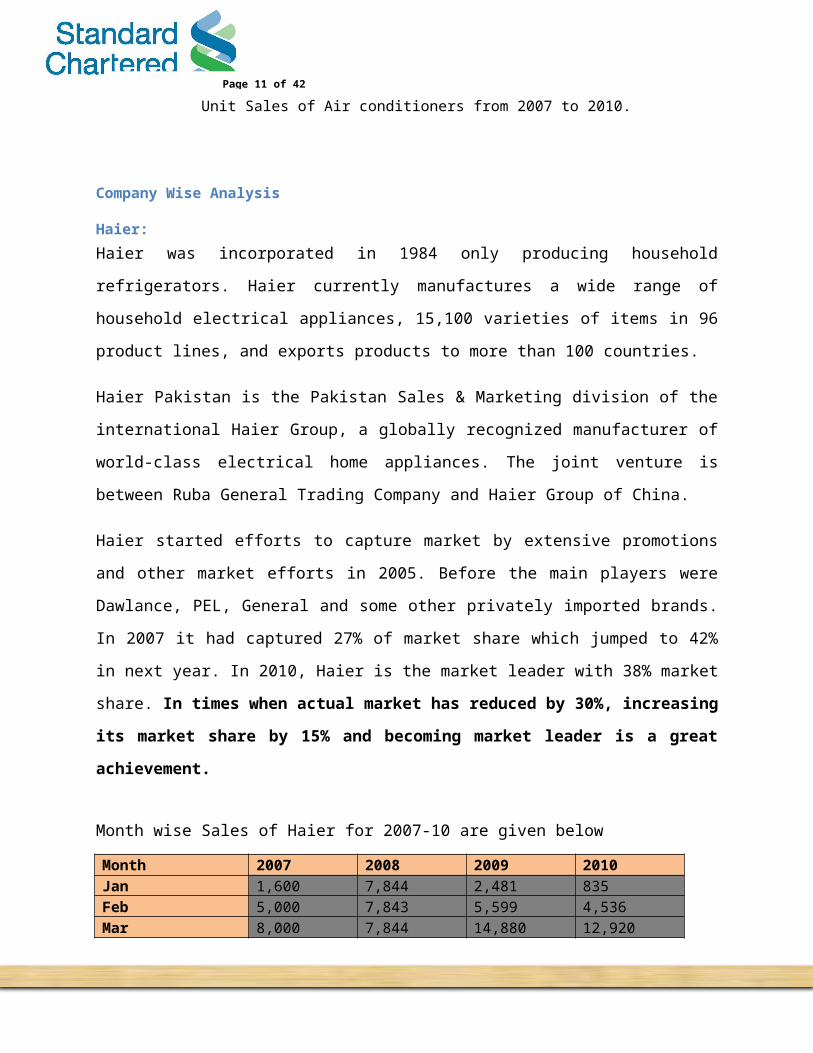
Unit Sales of Air conditioners from 2007 to 2010.
Company Wise Analysis
Haier:Haier was incorporated in 1984 only producing household refrigerators. Haier currently
manufactures a wide range of household electrical appliances, 15,100 varieties of items in 96
product lines, and exports products to more than 100 countries.
2007 2008 2009 2010Haier 100,000 89,123 78,555 94,796Dawlance 140,000 45,450 50,500 60,600PEL 35,000 25,250 25,250 26,260Orient 75,000 40,400 50,500 62,721Others 20,000 12,000 13,000 15,000Total 370,000 212,223 217,805 259,377
Page 9 of 31
Haier Pakistan is the Pakistan Sales & Marketing division of the international Haier Group, a
globally recognized manufacturer of world-class electrical home appliances. The joint venture is
between Ruba General Trading Company and Haier Group of China.
Haier started efforts to capture market by extensive promotions and other market efforts in 2005.
Before the main players were Dawlance, PEL, General and some other privately imported
brands. In 2007 it had captured 27% of market share which jumped to 42% in next year. In 2010,
Haier is the market leader with 38% market share. In times when actual market has reduced
by 30%, increasing its market share by 15% and becoming market leader is a great
achievement.
Month wise Sales of Haier for 2007-10 are given below
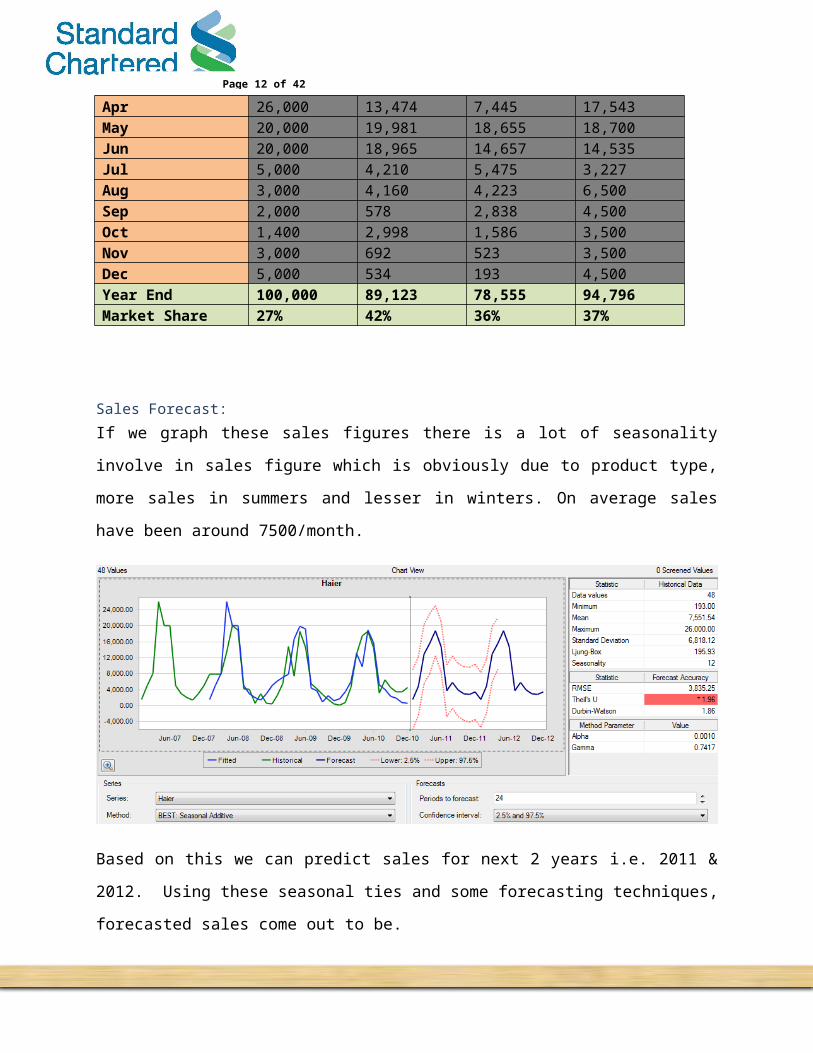
Month 2007 2008 2009 2010Jan 1,600 7,844 2,481 835Feb 5,000 7,843 5,599 4,536Mar 8,000 7,844 14,880 12,920Apr 26,000 13,474 7,445 17,543May 20,000 19,981 18,655 18,700Jun 20,000 18,965 14,657 14,535Jul 5,000 4,210 5,475 3,227Aug 3,000 4,160 4,223 6,500Sep 2,000 578 2,838 4,500Oct 1,400 2,998 1,586 3,500Nov 3,000 692 523 3,500Dec 5,000 534 193 4,500Year End 100,000 89,123 78,555 94,796Market Share 27% 42% 36% 37%
Sales Forecast:If we graph these sales figures there is a lot of seasonality involve in sales figure which is
obviously due to product type, more sales in summers and lesser in winters. On average sales
have been around 7500/month.
Page 10 of 31
Based on this we can predict sales for next 2 years i.e. 2011 & 2012. Using these seasonal ties
and some forecasting techniques, forecasted sales come out to be.
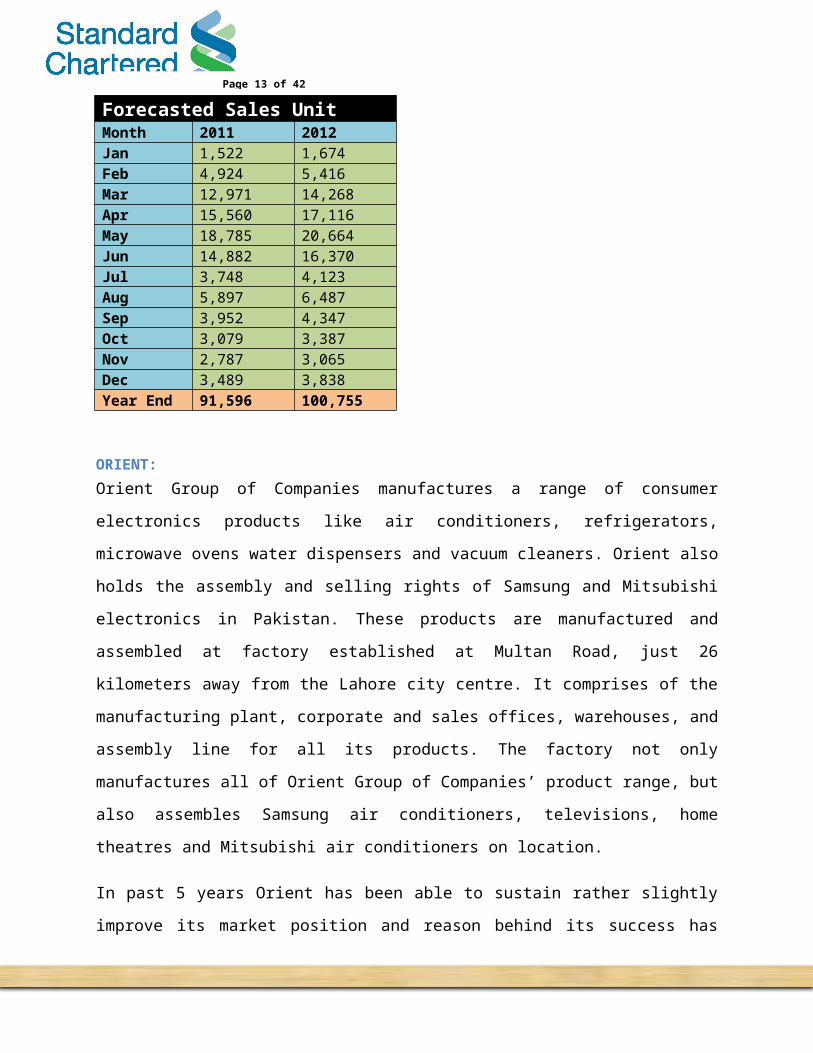
Forecasted Sales UnitMonth 2011 2012Jan 1,522 1,674Feb 4,924 5,416Mar 12,971 14,268Apr 15,560 17,116May 18,785 20,664Jun 14,882 16,370Jul 3,748 4,123Aug 5,897 6,487Sep 3,952 4,347Oct 3,079 3,387Nov 2,787 3,065Dec 3,489 3,838Year End 91,596 100,755
ORIENT:Orient Group of Companies manufactures a range of consumer electronics products like air
conditioners, refrigerators, microwave ovens water dispensers and vacuum cleaners. Orient also
holds the assembly and selling rights of Samsung and Mitsubishi electronics in Pakistan. These
products are manufactured and assembled at factory established at Multan Road, just 26
kilometers away from the Lahore city centre. It comprises of the manufacturing plant, corporate
Page 11 of 31
and sales offices, warehouses, and assembly line for all its products. The factory not only
manufactures all of Orient Group of Companies’ product range, but also assembles Samsung air
conditioners, televisions, home theatres and Mitsubishi air conditioners on location.
In past 5 years Orient has been able to sustain rather slightly improve its market position and
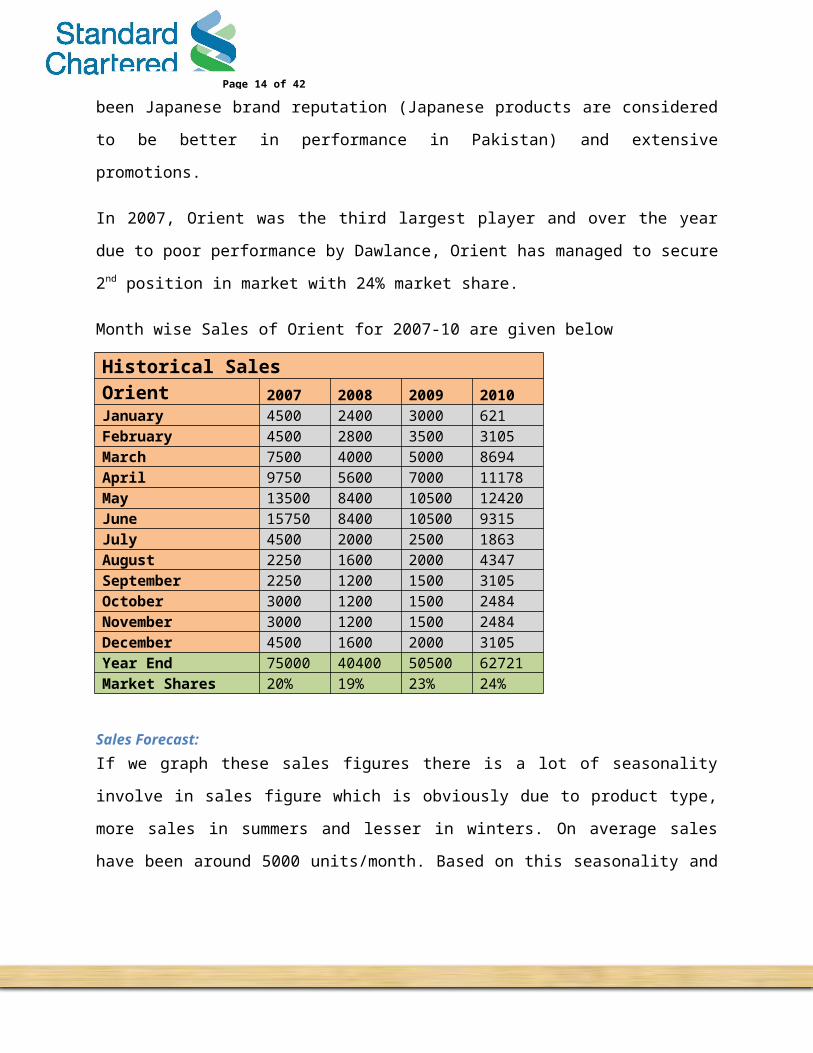
reason behind its success has been Japanese brand reputation (Japanese products are considered
to be better in performance in Pakistan) and extensive promotions.
In 2007, Orient was the third largest player and over the year due to poor performance by
Dawlance, Orient has managed to secure 2nd position in market with 24% market share.
Month wise Sales of Orient for 2007-10 are given below
Historical SalesOrient 2007 2008 2009 2010January 4500 2400 3000 621February 4500 2800 3500 3105March 7500 4000 5000 8694April 9750 5600 7000 11178May 13500 8400 10500 12420June 15750 8400 10500 9315July 4500 2000 2500 1863August 2250 1600 2000 4347September 2250 1200 1500 3105October 3000 1200 1500 2484November 3000 1200 1500 2484December 4500 1600 2000 3105Year End 75000 40400 50500 62721Market Shares 20% 19% 23% 24%
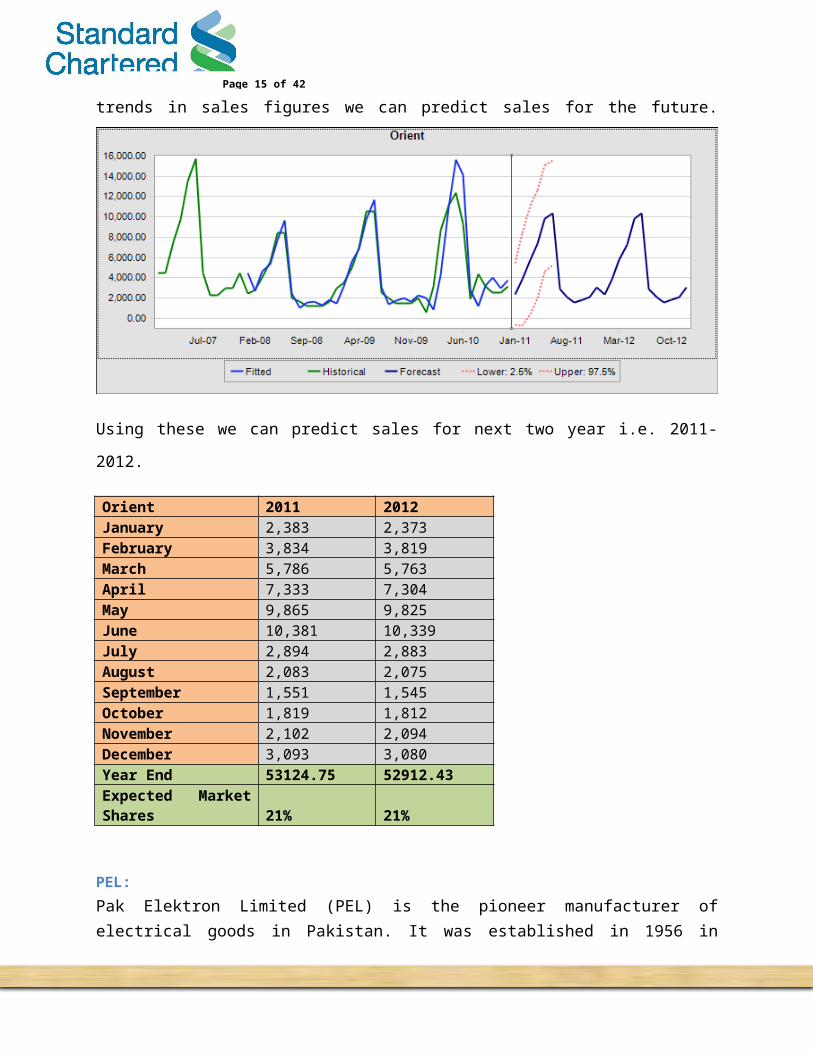
Sales Forecast:If we graph these sales figures there is a lot of seasonality involve in sales figure which is
obviously due to product type, more sales in summers and lesser in winters. On average sales
have been around 5000 units/month. Based on this seasonality and trends in sales figures we can
Page 12 of 31
predict sales for the future.
Using these we can predict sales for next two year i.e. 2011-2012.
Orient 2011 2012January 2,383 2,373February 3,834 3,819March 5,786 5,763April 7,333 7,304May 9,865 9,825June 10,381 10,339July 2,894 2,883August 2,083 2,075September 1,551 1,545October 1,819 1,812November 2,102 2,094December 3,093 3,080Year End 53124.75 52912.43Expected Market Shares 21% 21%
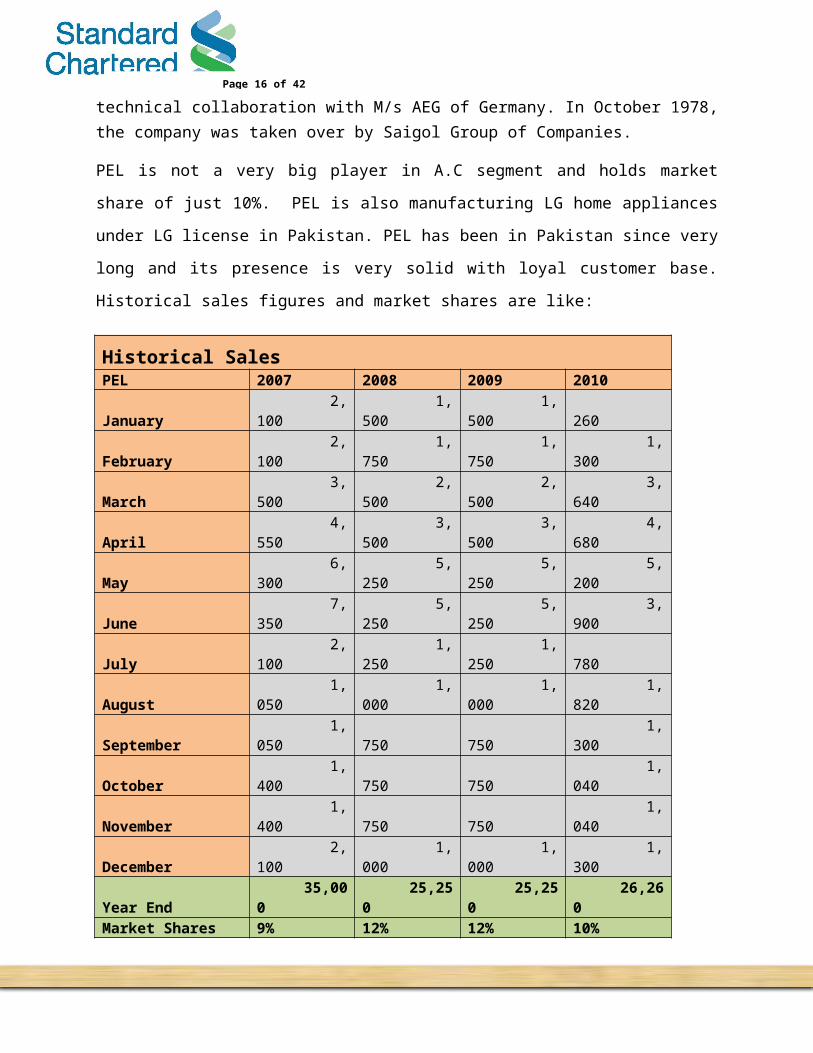
PEL: Pak Elektron Limited (PEL) is the pioneer manufacturer of electrical goods in Pakistan. It was established in 1956 in technical collaboration with M/s AEG of Germany. In October 1978, the company was taken over by Saigol Group of Companies.
PEL is not a very big player in A.C segment and holds market share of just 10%. PEL is also
manufacturing LG home appliances under LG license in Pakistan. PEL has been in Pakistan
Page 13 of 31
since very long and its presence is very solid with loyal customer base. Historical sales figures
and market shares are like:
Historical SalesPEL 2007 2008 2009 2010January 2,100 1,500 1,500 260 February 2,100 1,750 1,750 1,300 March 3,500 2,500 2,500 3,640 April 4,550 3,500 3,500 4,680 May 6,300 5,250 5,250 5,200 June 7,350 5,250 5,250 3,900 July 2,100 1,250 1,250 780 August 1,050 1,000 1,000 1,820 September 1,050 750 750 1,300 October 1,400 750 750 1,040 November 1,400 750 750 1,040 December 2,100 1,000 1,000 1,300 Year End 35,000 25,250 25,250 26,260 Market Shares 9% 12% 12% 10%
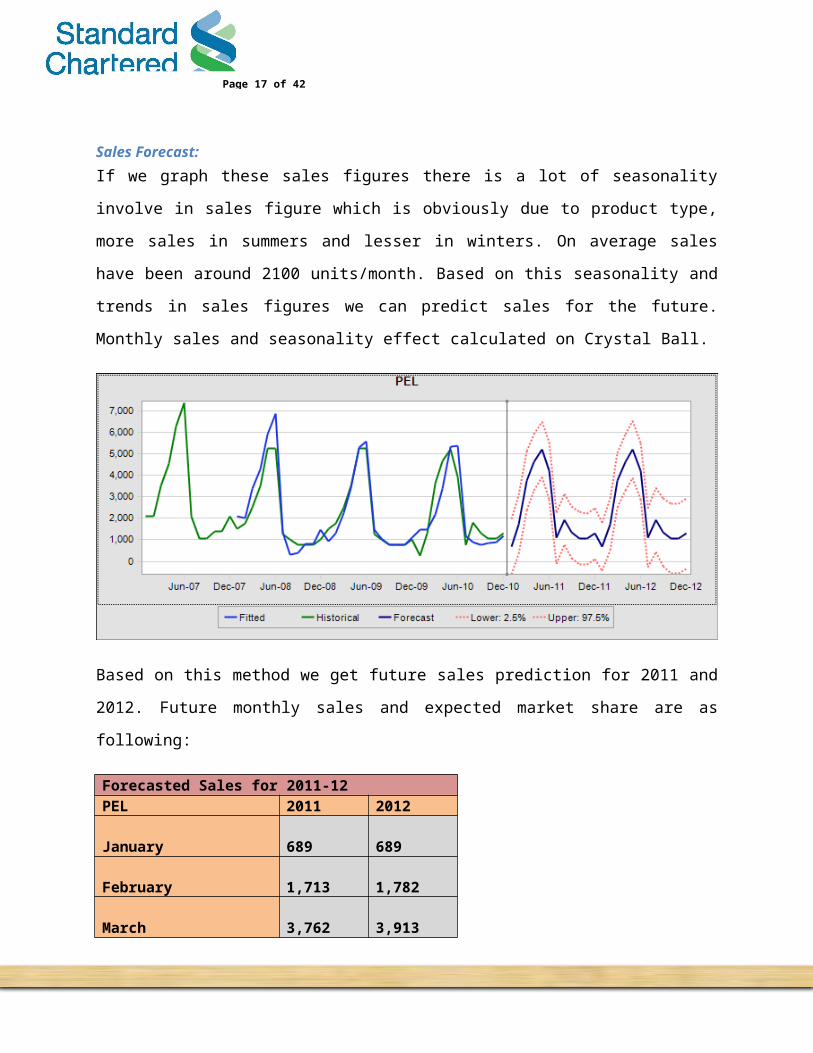
Sales Forecast:If we graph these sales figures there is a lot of seasonality involve in sales figure which is
obviously due to product type, more sales in summers and lesser in winters. On average sales
have been around 2100 units/month. Based on this seasonality and trends in sales figures we can
predict sales for the future. Monthly sales and seasonality effect calculated on Crystal Ball.
Page 14 of 31
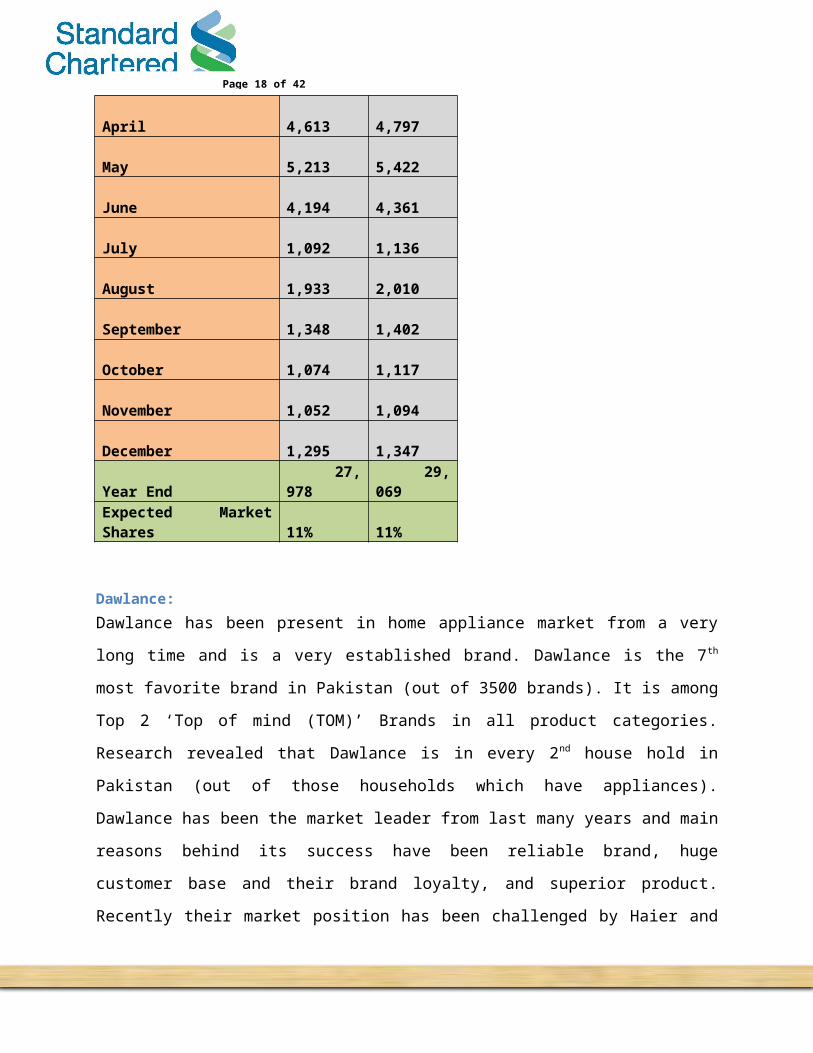
Based on this method we get future sales prediction for 2011 and 2012. Future monthly sales and
expected market share are as following:
Forecasted Sales for 2011-12PEL 2011 2012January 689 689 February 1,713 1,782 March 3,762 3,913 April 4,613 4,797 May 5,213 5,422 June 4,194 4,361 July 1,092 1,136 August 1,933 2,010 September 1,348 1,402 October 1,074 1,117 November 1,052 1,094 December 1,295 1,347 Year End 27,978 29,069 Expected Market Shares 11% 11%
Dawlance:Dawlance has been present in home appliance market from a very long time and is a very
established brand. Dawlance is the 7th most favorite brand in Pakistan (out of 3500 brands). It is
among Top 2 ‘Top of mind (TOM)’ Brands in all product categories. Research revealed that
Dawlance is in every 2nd house hold in Pakistan (out of those households which have appliances).
Dawlance has been the market leader from last many years and main reasons behind its success
have been reliable brand, huge customer base and their brand loyalty, and superior product.
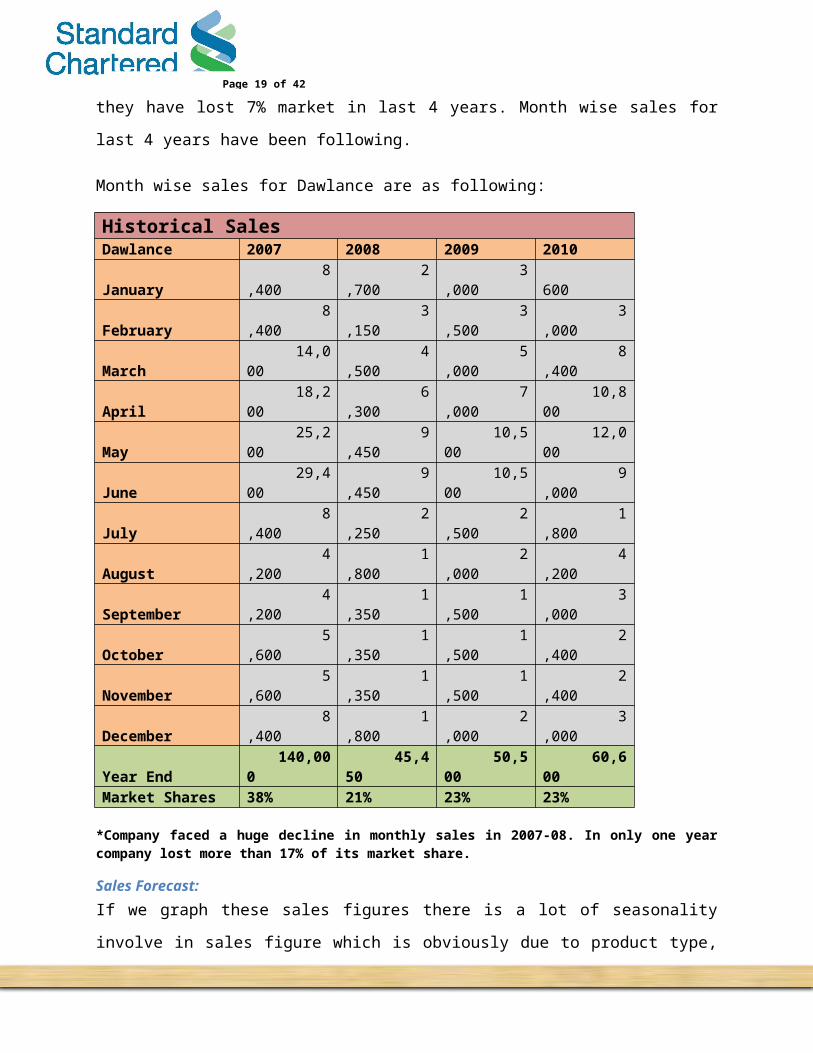
Recently their market position has been challenged by Haier and they have lost 7% market in last
4 years. Month wise sales for last 4 years have been following.
Month wise sales for Dawlance are as following:
Historical SalesDawlance 2007 2008 2009 2010January 8,400 2,700 3,000 600 February 8,400 3,150 3,500 3,000 March 14,000 4,500 5,000 8,400 April 18,200 6,300 7,000 10,800 May 25,200 9,450 10,500 12,000 June 29,400 9,450 10,500 9,000
Page 15 of 31
July 8,400 2,250 2,500 1,800 August 4,200 1,800 2,000 4,200 September 4,200 1,350 1,500 3,000 October 5,600 1,350 1,500 2,400 November 5,600 1,350 1,500 2,400 December 8,400 1,800 2,000 3,000 Year End 140,000 45,450 50,500 60,600 Market Shares 38% 21% 23% 23%
*Company faced a huge decline in monthly sales in 2007-08. In only one year company lost more than 17% of its market share.
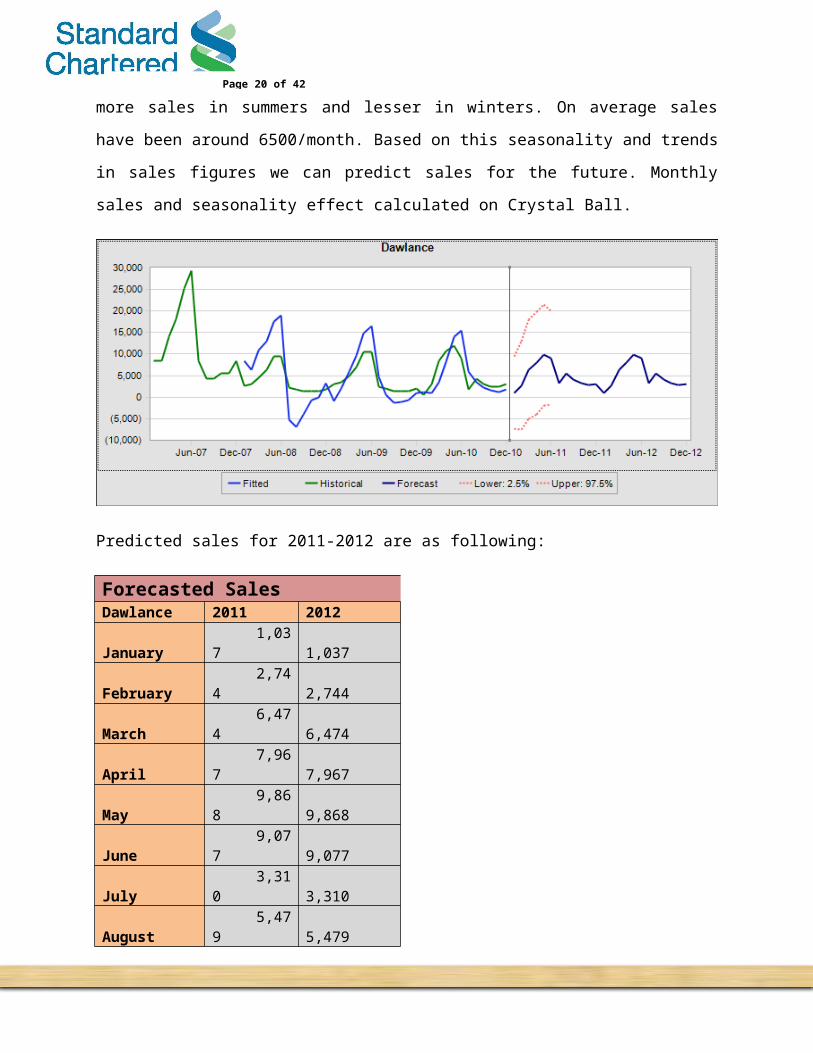
Sales Forecast:If we graph these sales figures there is a lot of seasonality involve in sales figure which is
obviously due to product type, more sales in summers and lesser in winters. On average sales
have been around 6500/month. Based on this seasonality and trends in sales figures we can
predict sales for the future. Monthly sales and seasonality effect calculated on Crystal Ball.
Predicted sales for 2011-2012 are as following:
Forecasted SalesDawlance 2011 2012January 1,037 1,037 February 2,744 2,744 March 6,474 6,474 April 7,967 7,967 May 9,868 9,868 June 9,077 9,077
Page 16 of 31
July 3,310 3,310 August 5,479 5,479 September 4,049 4,049 October 3,210 3,210 November 2,807 2,807 December 2,999 2,999 Year End 59,021 59,021Market Shares 24% 23%
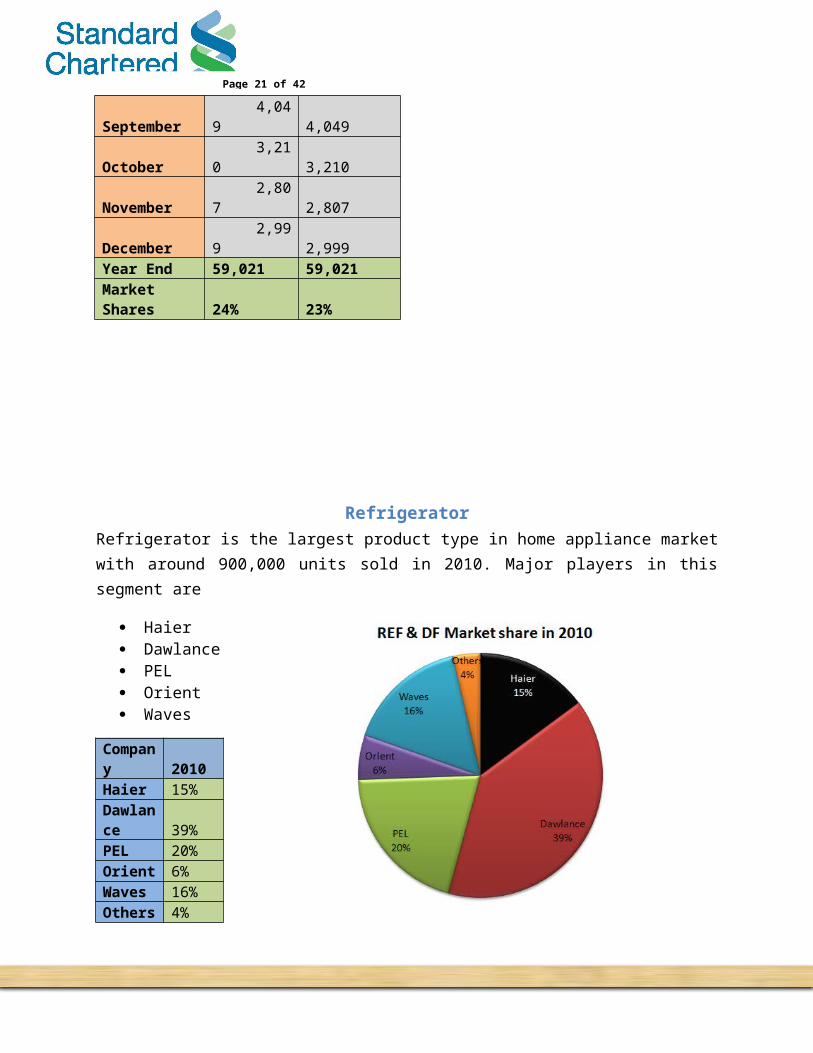
RefrigeratorRefrigerator is the largest product type in home appliance market with around 900,000 units sold in 2010. Major players in this segment are
Haier Dawlance PEL Orient Waves
Company 2010Haier 15%Dawlance 39%PEL 20%Orient 6%Waves 16%Others 4%
At the present Dawlance is the market leader with 41% market share with PEL (21%) at 2nd and
Waves (17%) in 3rd place.
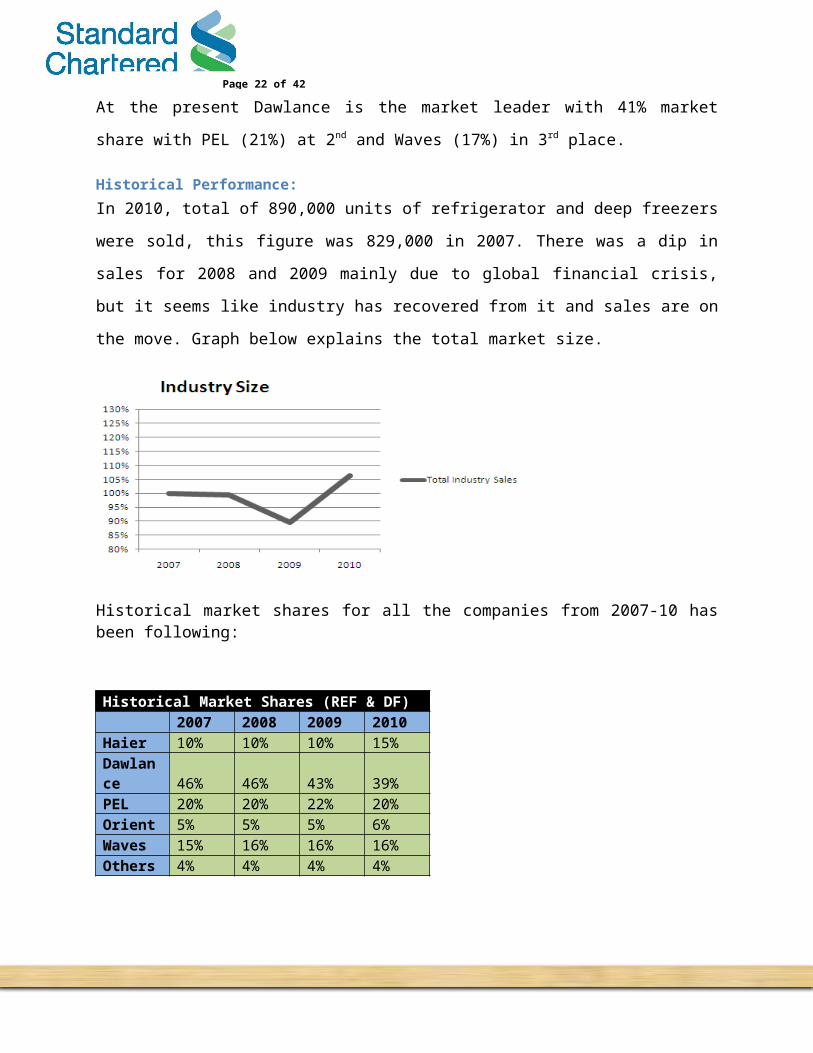
Historical Performance:In 2010, total of 890,000 units of refrigerator and deep freezers were sold, this figure was
829,000 in 2007. There was a dip in sales for 2008 and 2009 mainly due to global financial
Page 17 of 31
crisis, but it seems like industry has recovered from it and sales are on the move. Graph below
explains the total market size.
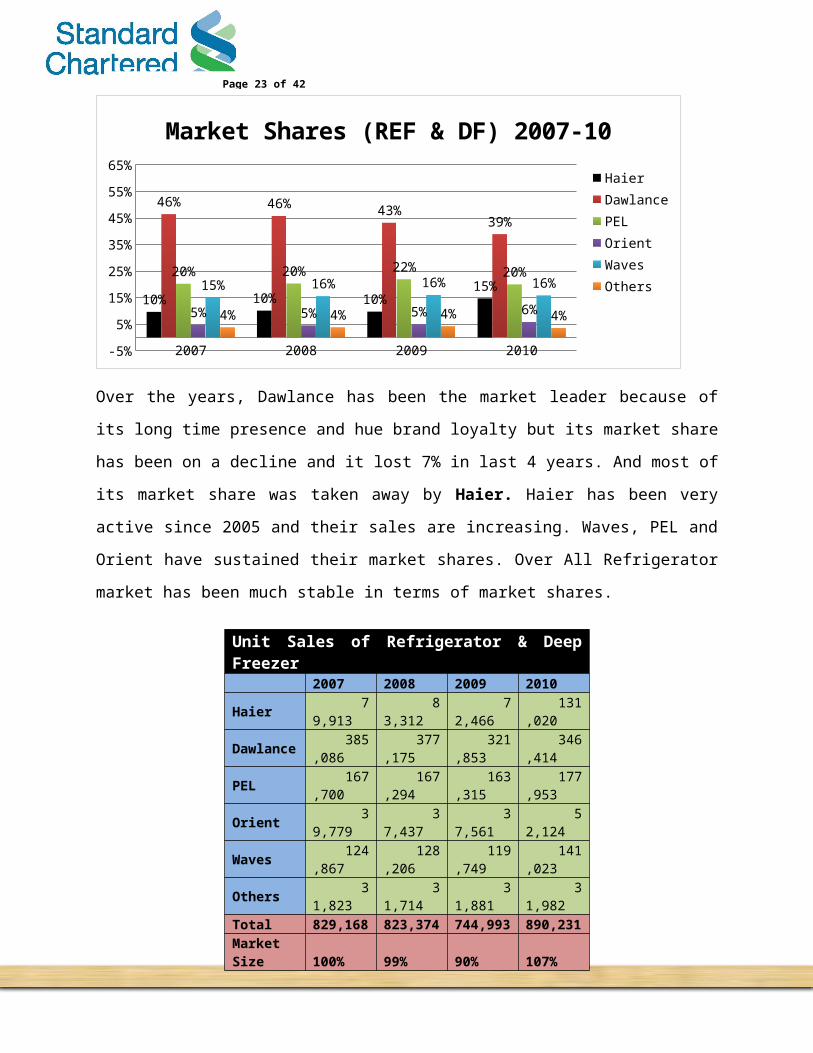
Historical market shares for all the companies from 2007-10 has been following:
Historical Market Shares (REF & DF) 2007 2008 2009 2010Haier 10% 10% 10% 15%Dawlance 46% 46% 43% 39%PEL 20% 20% 22% 20%Orient 5% 5% 5% 6%Waves 15% 16% 16% 16%Others 4% 4% 4% 4%
2007 2008 2009 2010-5%
5%
15%
25%
35%
45%
55%
65%
10% 10% 10%15%
46% 46% 43%39%
20% 20% 22% 20%
5% 5% 5% 6%
15% 16% 16% 16%
4% 4% 4% 4%
Market Shares (REF & DF) 2007-10
HaierDawlancePELOrientWavesOthers
Page 18 of 31
Over the years, Dawlance has been the market leader because of its long time presence and hue
brand loyalty but its market share has been on a decline and it lost 7% in last 4 years. And most
of its market share was taken away by Haier. Haier has been very active since 2005 and their
sales are increasing. Waves, PEL and Orient have sustained their market shares. Over All
Refrigerator market has been much stable in terms of market shares.
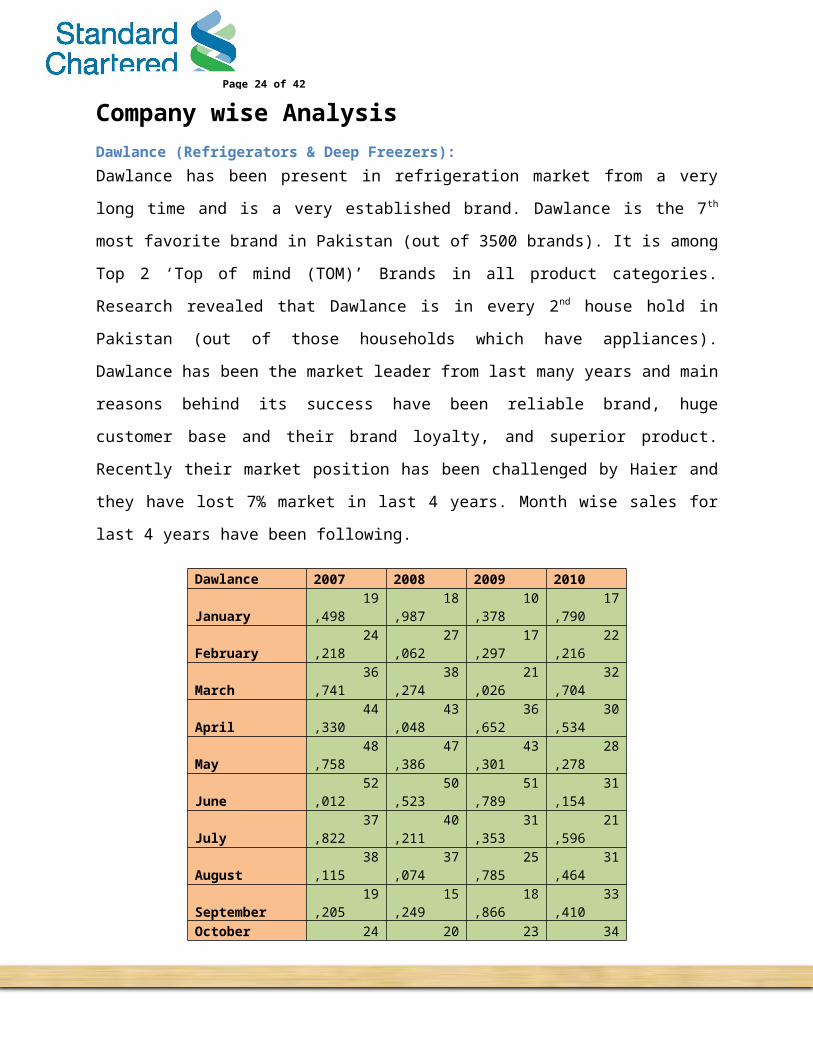
Company wise AnalysisDawlance (Refrigerators & Deep Freezers):Dawlance has been present in refrigeration market from a very long time and is a very
established brand. Dawlance is the 7th most favorite brand in Pakistan (out of 3500 brands). It is
among Top 2 ‘Top of mind (TOM)’ Brands in all product categories. Research revealed that
Dawlance is in every 2nd house hold in Pakistan (out of those households which have appliances).
Dawlance has been the market leader from last many years and main reasons behind its success
have been reliable brand, huge customer base and their brand loyalty, and superior product.
Recently their market position has been challenged by Haier and they have lost 7% market in last
4 years. Month wise sales for last 4 years have been following.
Dawlance 2007 2008 2009 2010January 19,498 18,987 10,378 17,790 February 24,218 27,062 17,297 22,216 March 36,741 38,274 21,026 32,704 April 44,330 43,048 36,652 30,534 May 48,758 47,386 43,301 28,278 June 52,012 50,523 51,789 31,154 July 37,822 40,211 31,353 21,596
Unit Sales of Refrigerator & Deep Freezer 2007 2008 2009 2010Haier 79,913 83,312 72,466 131,020 Dawlance 385,086 377,175 321,853 346,414 PEL 167,700 167,294 163,315 177,953 Orient 39,779 37,437 37,561 52,124 Waves 124,867 128,206 119,749 141,023 Others 31,823 31,714 31,881 31,982 Total 829,168 823,374 744,993 890,231Market Size 100% 99% 90% 107%
Page 19 of 31
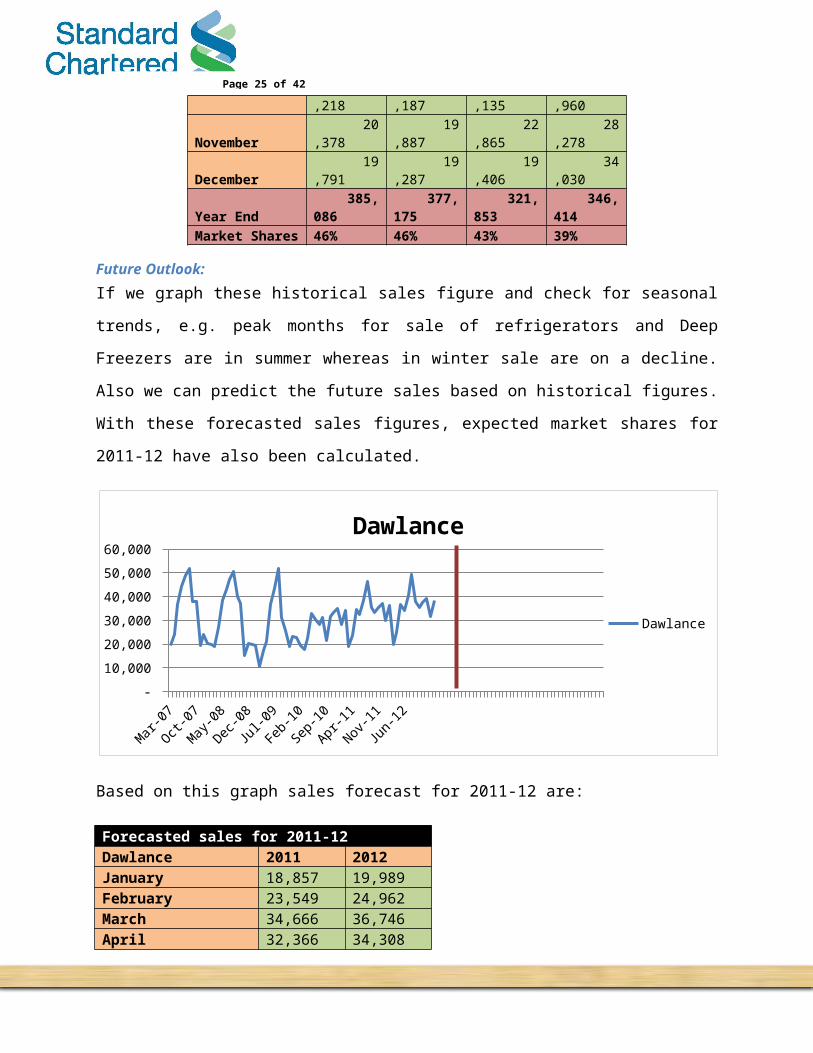
August 38,115 37,074 25,785 31,464 September 19,205 15,249 18,866 33,410 October 24,218 20,187 23,135 34,960 November 20,378 19,887 22,865 28,278 December 19,791 19,287 19,406 34,030 Year End 385,086 377,175 321,853 346,414 Market Shares 46% 46% 43% 39%
Future Outlook:If we graph these historical sales figure and check for seasonal trends, e.g. peak months for sale
of refrigerators and Deep Freezers are in summer whereas in winter sale are on a decline. Also
we can predict the future sales based on historical figures. With these forecasted sales figures,
expected market shares for 2011-12 have also been calculated.
Mar-07
Jun-07
Sep-07
Dec-07
Mar-08
Jun-08
Sep-08
Dec-08
Mar-09
Jun-09
Sep-09
Dec-09
Mar-10
Jun-10
Sep-10
Dec-10
Mar-11
Jun-11
Sep-11
Dec-11
Mar-12
Jun-12
Sep-12
Dec-12
-
10,000
20,000
30,000
40,000
50,000
60,000
Dawlance
Dawlance
Based on this graph sales forecast for 2011-12 are:
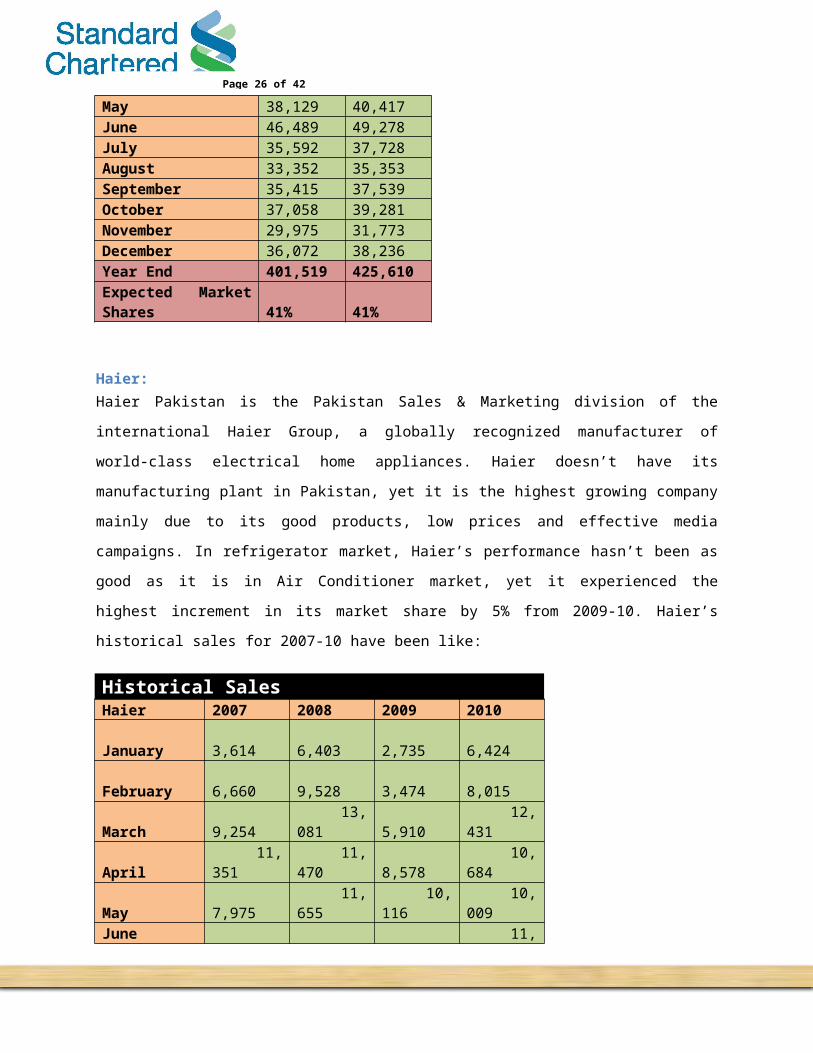
Forecasted sales for 2011-12Dawlance 2011 2012January 18,857 19,989February 23,549 24,962March 34,666 36,746April 32,366 34,308May 38,129 40,417June 46,489 49,278July 35,592 37,728August 33,352 35,353September 35,415 37,539October 37,058 39,281
Page 20 of 31
November 29,975 31,773December 36,072 38,236Year End 401,519 425,610Expected Market Shares 41% 41%
Haier:Haier Pakistan is the Pakistan Sales & Marketing division of the international Haier Group, a globally
recognized manufacturer of world-class electrical home appliances. Haier doesn’t have its
manufacturing plant in Pakistan, yet it is the highest growing company mainly due to its good products,
low prices and effective media campaigns. In refrigerator market, Haier’s performance hasn’t been as
good as it is in Air Conditioner market, yet it experienced the highest increment in its market share by
5% from 2009-10. Haier’s historical sales for 2007-10 have been like:
Historical SalesHaier 2007 2008 2009 2010January 3,614 6,403 2,735 6,424 February 6,660 9,528 3,474 8,015 March 9,254 13,081 5,910 12,431 April 11,351 11,470 8,578 10,684 May 7,975 11,655 10,116 10,009 June 4,403 8,083 5,210 11,607 July 6,923 8,164 6,484 7,236 August 5,784 3,387 7,060 12,889 September 6,149 2,414 5,641 13,104 October 6,475 4,213 6,941 13,846 November 4,683 2,538 5,071 11,047 December 6,642 2,376 5,246 13,728 Year End 79,913 83,312 72,466 131,020 Market Shares 10% 10% 10% 15%
Future Outlook:If we graph these historical sales we find less seasonality mainly because it is a new company in
the market and sales figures are not stable, also the economic conditions in 2009 and 2010 hurt
new companies a lot. On the basis of these historical sales future sales forecasting has been
done. Historical and future sales outlook has been shown in graph.
Page 21 of 31
Mar-07
Jul-07
Nov-07
Mar-08
Jul-08
Nov-08
Mar-09
Jul-09
Nov-09
Mar-10
Jul-10
Nov-10
Mar-11
Jul-11
Nov-11
Mar-12
Jul-12
Nov-12
- 2,000 4,000 6,000 8,000
10,000 12,000 14,000 16,000 18,000
Haier
Haier
Based on these projection future sales figures for 2011-12 and expected market share would be:
Forecasted sales for 2011-12Haier 2011 2012January 6,809 7,218 February 8,496 9,006 March 13,177 13,967 April 11,325 12,005 May 10,610 11,246 June 12,303 13,042 July 7,670 8,130 August 13,662 14,482 September 13,890 14,724 October 14,677 15,557 November 11,710 12,412 December 14,552 15,425 Year End 138,881 147,214 Expected Market Shares 14% 14%
Orient:Orient Group of Companies manufactures a range of consumer electronics products like air
conditioners, refrigerators, microwave ovens water dispensers and vacuum cleaners. Orient also
holds the assembly and selling rights of Samsung and Mitsubishi electronics in Pakistan.
Orient is a very small player in Refrigerator market and holds 6% market share in 2010. Over the
years it has improved very little with 1% increase in market share in last 4 years despite its
individual sales figures improved by 30% since 2006.
Page 22 of 31
Historical sales for Orient have been like:
Orient Historical Sales 2006-10Orient 2007 2008 2009 2010January 1,989 1,853 1,236 2,633 February 2,387 2,595 1,853 3,159 March 3,580 3,707 2,224 4,739 April 4,773 4,448 4,448 4,739 May 5,171 4,819 5,189 4,212 June 5,569 5,189 6,301 4,739 July 3,978 4,077 3,707 3,159 August 3,978 3,707 2,965 4,739 September 1,989 1,483 2,224 5,265 October 2,387 1,853 2,595 5,265 November 1,989 1,853 2,595 4,212 December 1,989 1,853 2,224 5,265 Year End 39,779 37,437 37,561 52,124 Market Shares 5% 5% 5% 6%
Future Outlook:If we graph these historical sales we find less seasonality mainly because it is a new company in
the market and sales figures are not stable, also the economic conditions in 2009 and 2010 hurt
new companies a lot. On the basis of these historical sales future sales forecasting has been
done. Historical and future sales outlook has been shown in graph.
Mar-07
Jul-07
Nov-07
Mar-08
Jul-08
Nov-08
Mar-09
Jul-09
Nov-09
Mar-10
Jul-10
Nov-10
Mar-11
Jul-11
Nov-11
Mar-12
Jul-12
Nov-12
- 1,000 2,000 3,000 4,000 5,000 6,000 7,000
Orient
Orient
Based on these projections, future sales figures are:
Forecasted Sales for 2011-12Orient 2011 2012January 2,790 2,958
Page 23 of 31
February 3,349 3,549 March 5,023 5,324 April 5,023 5,324 May 4,465 4,733 June 5,023 5,324 July 3,349 3,549 August 5,023 5,324 September 5,581 5,916 October 5,581 5,916 November 4,465 4,733 December 5,581 5,916 Year End 55,251 58,566 Market Shares 6% 6%
Waves:Waves (Cool Industries Pvt. Ltd) was established in 1973 and grew to a leading Home Appliances
manufacturing Company in Pakistan, in a very short span of time. Waves is mainly in Refrigerator and
Deep Freezer industry and it has the biggest customer base in the form of corporate clients like PEPSI,
Nestle, K&N Foods, Shezan, NURPUR, Dawn Foods and HICO etc. it is the biggest player in Deep Freezer
segment with more than 60% market share. Over all in Refrigerator and Deep Freezer market, it is the
3rd biggest player with 16% market share. Historical sales for Waves and its market share have been like:
Historical sales Ref & DF for 2007-10Waves 2007 2008 2009 2010
January 6,890 7,050 5,314 7,778
February 10,079 10,942 8,857 11,265 March 13,825 14,770 11,208 15,518 April 11,104 11,292 10,817 10,688 May 13,646 13,908 13,779 12,030 June 13,601 13,844 15,033 12,068 July 11,193 12,026 10,754 9,885 August 11,840 12,090 10,111 12,758
September 6,243 5,774 6,568 10,725
October 10,079 9,730 10,080 14,175
November 8,830 9,060 9,500 12,030
December 7,537 7,720 7,728 12,105
Year End 124,867 128,206 119,749 141,023
Page 24 of 31
Market Shares 15% 16% 16% 16%
Future Outlook:If we graph these historical sales we find less seasonality mainly because it is a new company in
the market and sales figures are not stable, also the economic conditions in 2009 and 2010 hurt
new companies a lot. On the basis of these historical sales future sales forecasting has been
done. Historical and future sales outlook has been shown in graph.
Mar-07
Jun-07
Sep-07
Dec-07
Mar-08
Jun-08
Sep-08
Dec-08
Mar-09
Jun-09
Sep-09
Dec-09
Mar-10
Jun-10
Sep-10
Dec-10
Mar-11
Jun-11
Sep-11
Dec-11
Mar-12
Jun-12
Sep-12
Dec-12
-
4,000
8,000
12,000
16,000
20,000
Waves
Waves
Forecasted Sales for 2011-12Waves 2011 2012January 8,244 8,739 February 11,941 12,657 March 16,449 17,435 April 11,329 12,008 May 12,752 13,517 June 12,792 13,559 July 10,478 11,107 August 13,523 14,334 September 11,369 12,051 October 15,026 15,927 November 12,752 13,517 December 12,831 13,601 Year End 149,484 158,453 Expected Market Shares 15% 15%
Page 25 of 31
PEL:Pak Elektron Limited (PEL) is the pioneer manufacturer of electrical goods in Pakistan. It was established in 1956 in technical collaboration with M/s AEG of Germany. In October 1978, the company was taken over by Saigol Group of Companies.
PEL is currently the 2nd largest player in Refrigerator and Deep Freezer market with 20% market
share. PEL is also manufacturing LG home appliances under LG license in Pakistan. PEL has
been in Pakistan since very long and its presence is very solid with loyal customer base. Its
market share has been the same over the year at 20%. Historical sales figures and market shares
are like:
Historical Market Shares 2007-10PEL 2007 2008 2009 2010
January 8,385 8,282 4,851 8,988
February 10,062 11,595 8,085 10,785 March 15,093 16,564 9,702 16,178 April 20,124 19,876 19,404 16,178 May 21,801 21,533 22,637 14,380 June 23,478 23,189 27,488 16,178 July 16,770 18,220 16,170 10,785 August 16,770 16,564 12,936 16,178
September 8,385 6,625 9,702 17,975
October 10,062 8,282 11,367 17,975
November 8,367 8,282 11,319 14,380
December 8,426 8,282 9,702 17,975
Year End 167,723 167,294 163,363 177,953 Market Shares 20% 20% 22% 20%
Future Outlook:If we graph these historical sales we find less seasonality mainly because it is a new company in
the market and sales figures are not stable, also the economic conditions in 2009 and 2010 hurt
new companies a lot. On the basis of these historical sales future sales forecasting has been
done. Historical and future sales outlook has been shown in graph.
Page 26 of 31
Mar-07
Jun-07
Sep-07
Dec-07
Mar-08
Jun-08
Sep-08
Dec-08
Mar-09
Jun-09
Sep-09
Dec-09
Mar-10
Jun-10
Sep-10
Dec-10
Mar-11
Jun-11
Sep-11
Dec-11
Mar-12
Jun-12
Sep-12
Dec-12
-
5,000
10,000
15,000
20,000
25,000
30,000
PEL
PEL
Based on these projections, expected sales figures and market shares would be:
Forecasted market Share 2011-12PEL 2011 2012January 9,527 10,098February 11,432 12,118March 17,231 18,124April 16,987 18,219May 15,243 16,157June 17,148 18,379July 11,432 12,118August 17,325 18,154September 19,152 20,213October 19,087 20,074November 15,243 16,157December 19,026 20,197Year End 188,833 200,009Expected Market Shares 19% 19%
Page 27 of 31
Pre Budget SituationBefore the announcement of budget, home appliance industry was on the recovery path from its 2008 &
2009 recession, floods in 2010 and energy crisis. Hence the recovery was a little slow, also imposed FED
on home appliances in budget 2010-11 worsened the situation. All this resulted in abnormal increase in
prices of appliances with increase of 5000 to 7000 a unit.
Impact of Budget on Home Appliance IndustryHome appliance industry is subjected to various duties and taxes which directly have impact on it cost of
manufacturing and selling. Before 2011-12 budget home appliance industry was entitled to 17% GST, 1%
FED. Also there are some import duties and special duties on certain types of raw materials. In Federal
Budget 2011-12, Government of Pakistan has relieved home appliance industry through various changes
in taxes and duties. Changes have been following:
1. Sales Tax has been reduced from 17% to 16%.
2. FED (Federal Excise Duty) of 1% has been taken back.
3. Tariff rationalization on bars, rods and profiles of refined copper and copper alloy.
The above mentioned changes have reduced the costs for home appliance industry. These changes will be
transferred to end consumer by lowering of selling price, which would in return increase the sales units.
Dawlance reduces prices:
After the budget announcement, Dawlance was the 1st company to respond by lowering the prices of its
brand by stating that they are transferring the relief to its customers. This is what a news paper had to say
on this.
“Dawlance, the no. 1 home appliances brand of Pakistan has decided to offer reduced post-budget prices
with immediate effect.
As per the budget 2011-12, the government has provided some relief in terms of sales tax and excise tax
on home appliances. The relief will lead to reduced prices of home appliances which are applicable from
July 1st 2011 onwards. Yet again proving their reliability, the largest home appliances manufacturer has
extended this reduction in taxes through their extensive dealer network to their consumers with immediate
effect.”
Recommended