1393
1460
1400
5%
4%
500180
1450/928
356836
641
8897
1Month 3 Month 1Year
Absolute 8.5 43.7 16.4
Rel.to Nifty 5.4 18.6 7.6
3QFY17 2QFY17 1QFY17
Promoters 26.1 26.4 26.3
Public 73.9 73.6 73.7
Others 0.0 0.0 0.0
Total 100.0 100.0 100.0
2
Mkt Capital (Rs Cr)
Av. Volume (,000)
Nifty
Overall deposits registered a healthy growth of 21% YoY mainly due to
demonetization drive. However this strong growth was despite of FCNR
redemption of nearly Rs 20000 Cr (US $3 Bn). CASA deposit grew by 37%
YoY backed by 38% and 37% growth in both SA and CA respectively. CASA
ratio spiked to 45% against 40% a quarter back. However we expect the
most of the CASA deposits to outflow from the bank after the increase in
withdrawal limit by RBI and hence expect the CASA at 42% level to sustain.
Advances growth in this quarter moderated to 13% YoY mainly due to
repayment in overseas loan linked to FCNR Deposits. The domestic loan
portfolio of bank grew by 17.5% YoY while it saw contraction of 41% YoY in
overseas loan. Now the domestic loan book constitutes 96% of the
advances. Healthy retail loan growth continued in personal loan, credit card,
home and LAS which YoY grew by 32%, 20%, 25% and 36% respectively.
On the vehicle segment auto, commercial vehicle and two-wheeler grew by
16% each YoY. On sequential basis some of the loan product got impacted
due to demonetization. Business banking book contracted by 3% QoQ
largely due to huge repayment in demonetization period.
Please refer to the Disclaimers at the end of this Report
DEEPAK KUMAR
HOLD
HDFC BANK 28-Feb-17
CMP Recently RBI’s decision on withdrawal of FPI exposure limit on HDFCBANK
has led significant rally in the stock; however heavy buying by FPI, forced
RBI to restore the cap as exposure crossed the prescribed limit of 74%.
Following this Sebi and RBI are looking at tightening trigger points for
foreign portfolio investment limit breach for entire banking sector. However
we see this as a one-off event. The fundamentals of HDFCBANK remains
intact and has performed significantly better than its peers in the industry.
HDFCBANK reported a stable performance. PAT grew by 15% YoY backed
by similar growth in its operating profit. Operating profit growth was
supported by stringent control over cost to income ratio and healthy NII
growth. C/I ratio was flat YoY to 42%.Total operating expenses grew by 15%
YoY. Other income grew by 9% YoY. Provisions for loans grew by 9.5% YoY
and it declined by 4.4% QoQ. Net Interest Margin declined by 20 bps YoY to
4.1%. NII grew by 18% YoY, mainly due to moderation in advances growth
reflecting the impact of repayment of loans linked to FCNR deposits. Total
net advances grew by 13% YoY. Deposit of the bank grew by healthy rate of
21% despite of redemption of FCNR Deposits. CASA ratio spiked to 45%
mainly due demonetization event. Sequentially assets quality was stable
with GNPA at 1.05% against 1.02%. NNPA was at 0.32% against 0.30% a
quarter back.
52wk Range H/L
BSE Code
NSE SymbolHDFCBANK
Target Price
Previous Target Price
Upside
Change from Previous
HO
HHHDDDFFFCC BBAANNKK
Result Update
500180
icic
oo
as
p
HDHDHDFCBANKHDHDHDFCBANK rere
byby similar growow
st
o o
coco
ew
im
BSE CoCodededede
1393
146060
14140000
5%5%
4%
CMP Recently RBI’s
hahas ledled si ificsignific
RBIRBRBRBI toto restorerestore
FoFoFollowingFoFoFollowing thisthis
foreignforeign portfolioportfolio
wewe see this as
ininintact and has p
Target Price
PrPrevevious Target Price
UpUpside
Change from Previous
Result Update
Market Data
500180
14145050/9/92828
3568683636
646411
MkMkt t CaCapital (R(Rs CrCr))
AvAv. VoVolulume (,000)
NiNiftft
bybybyby similar growgrow
supported by st
growth C/I ratio growth. C/I ratio
YoY.YoY. OtherOther incoinco
andand itit declineddeclined
4.1%. NII grewgr
fl ti th im
5252wkwk R Ranangege H H/L/L
NSNSE SymbolHDFCBABANKNK
Stock Performance
1Monthnth 3 Month 1Year
Absolute 8.5 43.7 16.4
Rel.to Nifty 5.4 18.6 7.6
net advances gr
212121% despite of
inlymamamainly dudue dede
wiwiwithwiwith GNPAGNPA atat
ququarararter back.ququarararter back.
88889797NiNiftfty reflecting the im
t ad
Stock Performance
Share Holding Pattern-%
Overall deposits
demonetization
redemption of ne
1616% each YoY.
dudududue to dedemone
largely due to h
PrPromoters 26.1 26.4 26.3.3
PuPublblicic 73.9 73.6 7373.7.7
OtOthehersrs 0.0 0.0 0.00
ToTotal 100.0 100.0 100.0.00
repayment in ov
portfolioportfolio ofof bankbank
ovoverseasovoverseas loanloan
advancesadvances. HealHeal
home and LAS
On the vehicle
1616% each YoY.
3QFY17 2QFY17 1QFY17
PrPromoters 26.1 26.4 26.3.3
Advances grow
repaymentrepayment inin ov
Share Holding Pattern-%
Company Vs NIFTY
owth in this quarter moderated to 13% YoY mainly due toAdvances grow
Domestic Advances growth was backed by Retail Growth.
Narnolia Securities Ltd
ts registered a healthy growth of 21% YoY mainly due toOverall deposits
CASA Deposits Spiked
decision on withdrawal of FPI exposure limit on HDFCBANKRecently RBI’s
Recent Development and Result Update.
80
90
100
110
120
130
140
150 HDFCBANK NIFTY
Quarterly Performance
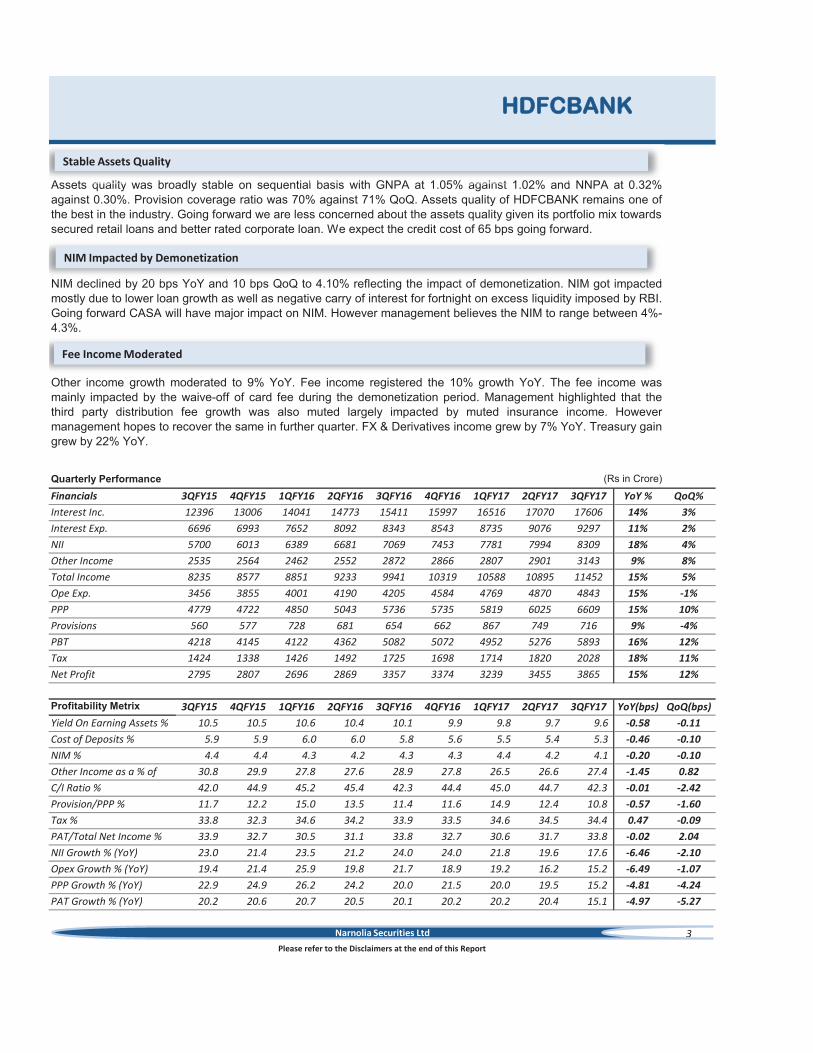
Financials 3QFY15 4QFY15 1QFY16 2QFY16 3QFY16 4QFY16 1QFY17 2QFY17 3QFY17 YoY % QoQ%
Interest Inc. 12396 13006 14041 14773 15411 15997 16516 17070 17606 14% 3%
Interest Exp. 6696 6993 7652 8092 8343 8543 8735 9076 9297 11% 2%
NII 5700 6013 6389 6681 7069 7453 7781 7994 8309 18% 4%
Other Income 2535 2564 2462 2552 2872 2866 2807 2901 3143 9% 8%
Total Income 8235 8577 8851 9233 9941 10319 10588 10895 11452 15% 5%
Ope Exp. 3456 3855 4001 4190 4205 4584 4769 4870 4843 15% -1%
PPP 4779 4722 4850 5043 5736 5735 5819 6025 6609 15% 10%
Provisions 560 577 728 681 654 662 867 749 716 9% -4%
PBT 4218 4145 4122 4362 5082 5072 4952 5276 5893 16% 12%
Tax 1424 1338 1426 1492 1725 1698 1714 1820 2028 18% 11%
Net Profit 2795 2807 2696 2869 3357 3374 3239 3455 3865 15% 12%
Profitability Metrix 3QFY15 4QFY15 1QFY16 2QFY16 3QFY16 4QFY16 1QFY17 2QFY17 3QFY17 YoY(bps) QoQ(bps)
Yield On Earning Assets % 10.5 10.5 10.6 10.4 10.1 9.9 9.8 9.7 9.6 -0.58 -0.11
Cost of Deposits % 5.9 5.9 6.0 6.0 5.8 5.6 5.5 5.4 5.3 -0.46 -0.10
NIM % 4.4 4.4 4.3 4.2 4.3 4.3 4.4 4.2 4.1 -0.20 -0.10
Other Income as a % of
Total Net Income
30.8 29.9 27.8 27.6 28.9 27.8 26.5 26.6 27.4 -1.45 0.82
C/I Ratio % 42.0 44.9 45.2 45.4 42.3 44.4 45.0 44.7 42.3 -0.01 -2.42
Provision/PPP % 11.7 12.2 15.0 13.5 11.4 11.6 14.9 12.4 10.8 -0.57 -1.60
Tax % 33.8 32.3 34.6 34.2 33.9 33.5 34.6 34.5 34.4 0.47 -0.09
PAT/Total Net Income % 33.9 32.7 30.5 31.1 33.8 32.7 30.6 31.7 33.8 -0.02 2.04
NII Growth % (YoY) 23.0 21.4 23.5 21.2 24.0 24.0 21.8 19.6 17.6 -6.46 -2.10
Opex Growth % (YoY) 19.4 21.4 25.9 19.8 21.7 18.9 19.2 16.2 15.2 -6.49 -1.07
PPP Growth % (YoY) 22.9 24.9 26.2 24.2 20.0 21.5 20.0 19.5 15.2 -4.81 -4.24
PAT Growth % (YoY) 20.2 20.6 20.7 20.5 20.1 20.2 20.2 20.4 15.1 -4.97 -5.27
3
Please refer to the Disclaimers at the end of this Report
HDFCBANK
(Rs in Crore)
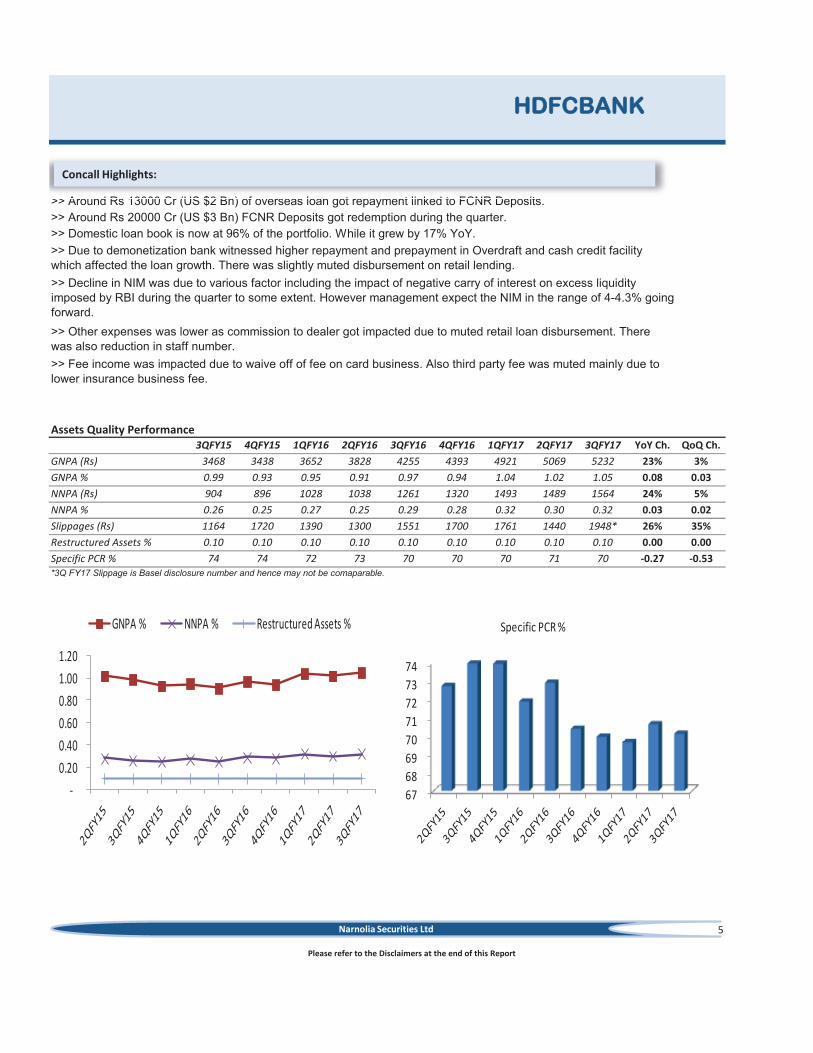
Assets quality was broadly stable on sequential basis with GNPA at 1.05% against 1.02% and NNPA at 0.32%
against 0.30%. Provision coverage ratio was 70% against 71% QoQ. Assets quality of HDFCBANK remains one of
the best in the industry. Going forward we are less concerned about the assets quality given its portfolio mix towards
secured retail loans and better rated corporate loan. We expect the credit cost of 65 bps going forward.
NIM declined by 20 bps YoY and 10 bps QoQ to 4.10% reflecting the impact of demonetization. NIM got impacted
mostly due to lower loan growth as well as negative carry of interest for fortnight on excess liquidity imposed by RBI.
Going forward CASA will have major impact on NIM. However management believes the NIM to range between 4%-
4.3%.
Other income growth moderated to 9% YoY. Fee income registered the 10% growth YoY. The fee income was
mainly impacted by the waive-off of card fee during the demonetization period. Management highlighted that the
third party distribution fee growth was also muted largely impacted by muted insurance income. However
management hopes to recover the same in further quarter. FX & Derivatives income grew by 7% YoY. Treasury gain
grew by 22% YoY.
NIM declined by 20 bps YoY and 10 bps QoQ to 4.10% reflecting the impact of demonetization NIM got impacted
NIM Impacted by Demonetization
Assets quality was broadly stable on sequential basis with GNPA at 1.05% against 1.02% and NNPA at 0.32%
Stable Assets Quality
Narnolia Securities Ltd
Fee Income Moderated

3QFY15 4QFY15 1QFY16 2QFY16 3QFY16 4QFY16 1QFY17 2QFY17 3QFY17 YoY% QoQ%
Fees & Commissions 1807 1835 1713 1869 2005 2172 1978 2104 2207 10% 5%
FX & Derivatives 253 329 348 320 277 283 315 295 297 7% 1%
Profit / (loss) on Invest. 266 196 126 162 328 116 277 284 399 22% 41%
Miscellaneous Income
Including Recoveries
210 204 275 201 262 295 237 219 240 -8% 10%
Total Other Income 2535 2564 2462 2552 2872 2866 2807 2901 3143 9% 8%
4
HDFCBANK
Other income Break Up (Rs in Crore)
We continue to like HDFC Bank given its strong fundamentals, steady loan growth, adequate capital, best in assets quality,
strong branch network and intensive digitalization initiatives. While 3Q FY17 saw some uneven activities, we expect the
operations of banking to come to its normal situation. Despite intense competition, we expect margins of HDFCBANK to sustain
in the range of 4%-4.3% backed by normal CASA level of 40% and healthy growth in retail assets. Earning momentum will be
maintained with core revenue of 19% plus growth going forward backed by healthy domestic loan growth with higher yield
products. We expect RoE of 19% going forward. Recent rally in the stock has led to achieve our previous target price of Rs
1400. However despite this rally we don’t think to exit the stock at current levels given its strong fundamentals and recommend
must have in the portfolio. Also HDFCBANK has performed much better than its peers in the industry. We maintain HOLD in
this stock with the target price of Rs 1460.
Please refer to the Disclaimers at the end of this Report
We continue to like HDFC Bank given its strong fundamentals steady loan growth adequate capital, best in as
Outlook & Valuation:
Narnolia Securities Ltd
-
2.0
4.0
6.0
8.0
10.0
12.0
Yield On Earning Assets % Cost of Deposits % NIM %
39.0
40.0
41.0
42.0
43.0
44.0
45.0
46.0
47.0
-
5.0
10.0
15.0
20.0
25.0
30.0
PAT Growth % (YoY) NII Growth % (YoY)
C/I Ratio %
24.0
25.0
26.0
27.0
28.0
29.0
30.0
31.0
Other Income/Total Net Income %
-
0.10
0.20
0.30
0.40
0.50
0.60
Fee Income/ Advances %
>> Around Rs 13000 Cr (US $2 Bn) of overseas loan got repayment linked to FCNR Deposits.
>> Around Rs 20000 Cr (US $3 Bn) FCNR Deposits got redemption during the quarter.
>> Domestic loan book is now at 96% of the portfolio. While it grew by 17% YoY.
3QFY15 4QFY15 1QFY16 2QFY16 3QFY16 4QFY16 1QFY17 2QFY17 3QFY17 YoY Ch. QoQ Ch.
GNPA (Rs) 3468 3438 3652 3828 4255 4393 4921 5069 5232 23% 3%
GNPA % 0.99 0.93 0.95 0.91 0.97 0.94 1.04 1.02 1.05 0.08 0.03
NNPA (Rs) 904 896 1028 1038 1261 1320 1493 1489 1564 24% 5%
NNPA % 0.26 0.25 0.27 0.25 0.29 0.28 0.32 0.30 0.32 0.03 0.02
Slippages (Rs) 1164 1720 1390 1300 1551 1700 1761 1440 1948* 26% 35%
Restructured Assets % 0.10 0.10 0.10 0.10 0.10 0.10 0.10 0.10 0.10 0.00 0.00
Specific PCR % 74 74 72 73 70 70 70 71 70 -0.27 -0.53
5
Please refer to the Disclaimers at the end of this Report
HDFCBANK
>> Due to demonetization bank witnessed higher repayment and prepayment in Overdraft and cash credit facility
which affected the loan growth. There was slightly muted disbursement on retail lending.
>> Decline in NIM was due to various factor including the impact of negative carry of interest on excess liquidity
imposed by RBI during the quarter to some extent. However management expect the NIM in the range of 4-4.3% going
forward.
>> Other expenses was lower as commission to dealer got impacted due to muted retail loan disbursement. There
was also reduction in staff number.
>> Fee income was impacted due to waive off of fee on card business. Also third party fee was muted mainly due to
lower insurance business fee.
Assets Quality Performance
*3Q FY17 Slippage is Basel disclosure number and hence may not be comaparable.
>> Around Rs 13000 Cr (US $2 Bn) of overseas loan got repayment linked to FCNR Deposits.
Concall Highlights:
Narnolia Securities Ltd
-
0.20
0.40
0.60
0.80
1.00
1.20
GNPA % NNPA % Restructured Assets %
67
68
69
70
71
72
73
74
Specific PCR %

Advances 3QFY15 4QFY15 1QFY16 2QFY16 3QFY16 4QFY16 1QFY17 2QFY17 3QFY17
Net Advances (Rs in Cr) 347088 365495 382010 418541 436364 464594 470622 494418 495043
Advances Growth YoY % 16.97 20.63 22.40 27.89 25.72 27.11 23.20 18.13 13.45
>> Growth QoQ % 6.05 5.30 4.52 9.56 4.26 6.47 1.30 5.06 0.13
Break-up of Advances % (As per internal business classification)
Advances Break Up % 3QFY15 4QFY15 1QFY16 2QFY16 3QFY16 4QFY16 1QFY17 2QFY17 3QFY17
Auto 13.14 12.79 13.11 12.81 12.91 12.33 12.66 13.03 13.24
Personal Loans 7.20 7.12 7.61 7.75 8.13 8.12 8.72 9.11 9.46
Home Loans 5.76 6.60 7.04 6.81 6.52 6.86 7.14 6.79 7.16
Business Banking 14.05 13.65 13.34 13.74 13.66 13.15 12.84 13.31 12.84
Kisan Gold Card 3.95 4.45 4.42 4.67 4.61 4.94 4.76 5.03 4.83
Credit Cards 4.43 4.42 4.41 4.30 4.51 4.42 4.52 4.32 4.78
CV/CE 7.19 6.83 6.93 6.92 6.82 6.66 6.68 6.79 6.97
Others 2.78 3.02 2.81 2.88 3.06 3.15 3.22 3.29 3.27
Two Wheelers 1.37 1.38 1.38 1.38 1.40 1.37 1.41 1.44 1.44
Gold Loans 1.13 1.11 1.11 1.04 1.01 0.99 1.04 1.03 0.97
Loans against securities 0.35 0.37 0.35 0.36 0.38 0.41 0.40 0.42 0.45
Total Retail Advances 61.33 61.75 62.53 62.66 63.00 62.38 63.39 64.55 65.41
Corp. and Overseas Adva. 38.67 38.25 37.47 37.34 37.00 37.62 36.61 35.45 34.59
Deposits 3QFY15 4QFY15 1QFY16 2QFY16 3QFY16 4QFY16 1QFY17 2QFY17 3QFY17
Deposits (Rs in Cr) 414128 450796 484175 506909 523997 546424 573755 591731 634705
>> Growth YoY % 18.59 22.72 30.13 29.75 26.53 21.21 18.50 16.73 21.13
>> Growth QoQ % 6.00 8.85 7.40 4.70 3.37 4.28 5.00 3.13 7.26
CA % 13.79 16.32 13.82 13.77 14.13 16.18 13.26 13.38 15.95
SA % 27.11 27.71 25.81 25.95 25.85 27.06 26.61 27.03 29.40
CASA % 40.90 44.03 39.63 39.72 39.98 43.25 39.87 40.41 45.36
>>CASA Growth YoY % 11.00 20.58 19.92 19.41 23.67 19.05 19.24 18.76 37.43
>> Growth QoQ % 0.46 17.18 -3.34 4.94 4.04 12.81 -3.19 4.51 20.40
Credit Deposit Ratio% 83.81 81.08 78.90 82.57 83.28 85.02 82.03 83.55 78.00
6
HDFCBANK
Please refer to the Disclaimers at the end of this Report
Narnolia Securities Ltd
-
5.0
10.0
15.0
20.0
25.0
30.0
-
10.0
20.0
30.0
40.0
50.0
60.0
70.0
Retail Adv. % Corp. and Overseas Adv. % Adv. Growth YoY %
-
5.0
10.0
15.0
20.0
25.0
30.0
35.0
40.0
-
5
10
15
20
25
30
35
40
45
50
CA % (of Deposits ) SA % (of Deposits)
CASA % >>CASA Growth YoY %

INCOME STATEMENT RATIOS
FY13 FY14 FY15 FY16 Business Ratios FY13 FY14 FY15 FY16
Int./disc. on advances / bills 26,822 31,687 37,181 44,828 Credit-Deposit(%) 80.9 82.5 81.1 85.0
Income on Investments 7,820 9,037 10,706 14,120 CASA % 47.0 45.0 44.0 43.0
Int. on bal.with RBI 282 356 517 362 Efficiency Ratios
Others 141 56 66 912 Emp. Cost as a % of Total Inco. (%) 17.5 15.8 15.1 14.9
Total Interest Income 35,065 41,136 48,470 60,221 Other Exp./Total Inco. (%) 32.1 29.8 29.4 29.4
Total Interest expended 19,254 22,653 26,074 32,630 Cost Income Ratio (%) 49.6 45.6 44.6 44.3
Net Interest Income 15,811 18,483 22,396 27,592 Spread Analysis As Calculated
Other Income 6,853 7,920 8,996 10,752 Yield on Advances (%) 12.3 12.2 11.8 11.5
Total Income 22,664 26,402 31,392 38,343 Yield on Investments (%) 8.5 8.6 8.7 8.9
Total Operating Expenses 11,236 12,042 13,988 16,980 Yield on Earning Assets (%) 10.5 10.4 10.4 10.3
Pre Provisioning Profit 11,428 14,360 17,404 21,364 Cost of Deposits (%) 6.0 5.7 5.7 5.9
Provisions and Contingencies 1,677 1,588 2,076 2,726 Cost of Fund (%) 6.4 6.0 5.8 5.9
Profit Before Tax 9,751 12,772 15,329 18,638 Interest Spread (%) 4.1 4.5 4.6 4.4
Tax 3,024 4,294 5,113 6,342 NIM (%) 4.6 4.4 4.4 4.3
PAT 6,726 8,478 10,216 12,296 Profitability Ratio
RoE % 20.3 21.3 19.4 18.3
RoA % 1.8 1.9 1.9 1.9
BALANCE SHEET Int. Expended / Int. Earned (%) 54.9 55.1 53.8 54.2
FY13 FY14 FY15 FY16 Provisions/PPP (%) 14.7 11.1 11.9 12.8
Capital 476 480 501 506 Other Income/Net Income (%) 30.2 30.0 28.7 28.0
Reserves & Surplus 35738 42999 61508 72172 Tax Rate (%) 31.0 33.6 33.4 34.0
Deposits 296247 367337 450796 546424 Asset Quality Ratio
Borrowings 33007 39439 45214 53018 GNPA (%) 1.01 0.98 0.93 0.94
Other Liabilities & Provisions 34864 41344 32484 36725 GNPA(Rs) 3018 2989 3438 4393
Total Capital & Liabilities 400332 491600 590503 708846 NNPA (%) 0.30 0.30 0.25 0.28
NNPA (Rs) 797 820 896 1320
Cash & Balances with RBI 14627 25346 27510 30058 PCR (%) 74 73 74 70.0
Bal. with Bank&Money at Call 12653 14238 8821 8861 Os. Std. Restr. Assets (%) 0.20 0.20 0.10 0.10
Investments 111614 120951 166460 163886
Advances 239721 303000 365495 464594 Capital Adequacy Ratio
Fixed Assets 2703 2940 3122 3343 Capital Adequacy Ratio (%) 16.8 16.1 16.8 15.5
Other Assets 19014 25125 19095 38104 Tier I Capital (%) 11.1 11.8 13.7 13.2
Total Assets 400332 491600 590503 708846 Tier II Capital (%) 5.7 4.3 3.1 2.3
7
Please refer to the Disclaimers at the end of this Report
HDFCBANK
Financials Snap Shot
(Rs in Crore)
(Rs in Crore)
Narnolia Securities Ltd
Recommended