HIV/HCV coinfection: what is the
impact on risk for cancer and
cardiovascular events? How can HCV
treatment induced SVR help?
Ligita JančorienėVUH Santaros klinikos Centre of Infectious Diseases
VU MF Institute of Clinical Medicine Clinic of Infectious Diseases and Dermatovenerology
20 September, 2019
HIV/HCV coinfections:impact on risk for cancer
•Until as recently as 2014, more people were living
with HIV than were living with cancer
•This is now not the case as there are more people
living with cancer
•The total prevalence of cancer worldwide is 43.8 mln
•40% of cancer cases are found in the lung, breast,
colon and prostate
Cancer and HIV
UNAIDS and the International Agency for Research on Cancer’s Global Cancer Observatory (IARC GLOBOCAN)
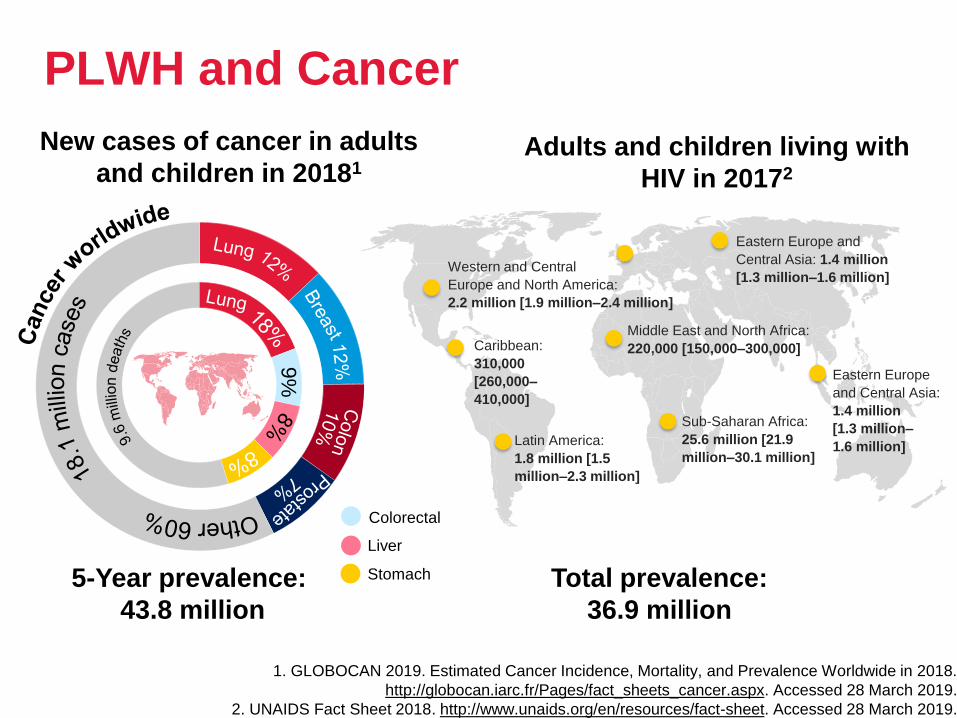
PLWH and Cancer
5-Year prevalence:
43.8 million
Total prevalence:
36.9 million
Caribbean:
310,000
[260,000–
410,000]
Latin America:
1.8 million [1.5
million–2.3 million]
Western and Central
Europe and North America:
2.2 million [1.9 million–2.4 million]
Sub-Saharan Africa:
25.6 million [21.9
million–30.1 million]
Eastern Europe and
Central Asia: 1.4 million
[1.3 million–1.6 million]
Middle East and North Africa:
220,000 [150,000–300,000]
Eastern Europe
and Central Asia:
1.4 million
[1.3 million–
1.6 million]
9%
Adults and children living with
HIV in 20172
New cases of cancer in adults
and children in 20181
Liver
Stomach
Colorectal
1. GLOBOCAN 2019. Estimated Cancer Incidence, Mortality, and Prevalence Worldwide in 2018.
http://globocan.iarc.fr/Pages/fact_sheets_cancer.aspx. Accessed 28 March 2019.
2. UNAIDS Fact Sheet 2018. http://www.unaids.org/en/resources/fact-sheet. Accessed 28 March 2019.
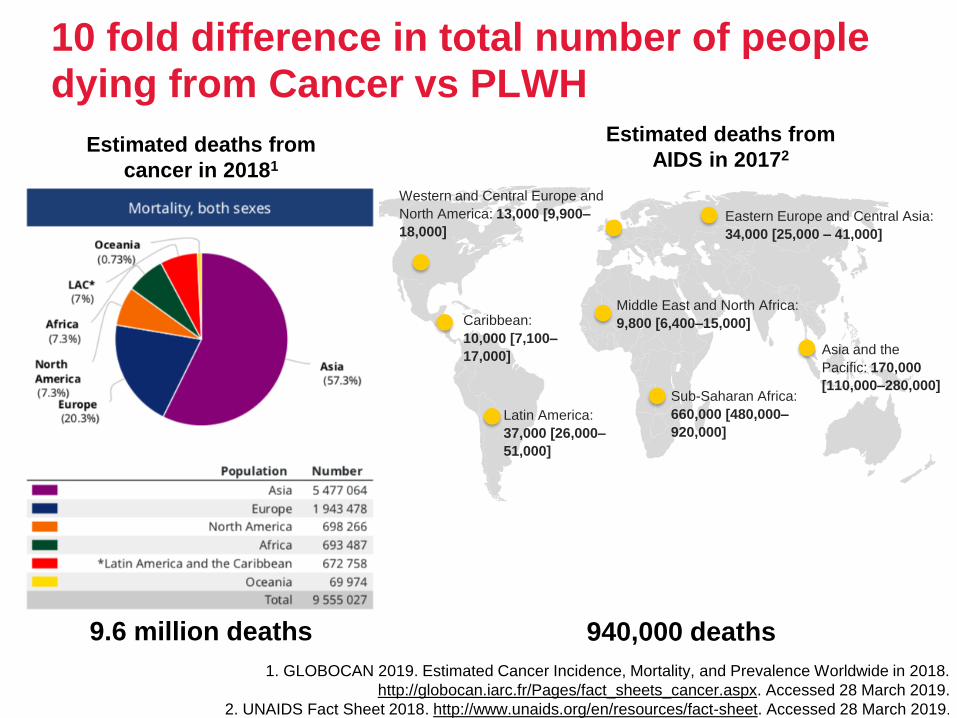
10 fold difference in total number of people dying from Cancer vs PLWH
Estimated deaths from
AIDS in 20172
940,000 deaths
Estimated deaths from
cancer in 20181
Caribbean:
10,000 [7,100–
17,000]
Latin America:
37,000 [26,000–
51,000]
Western and Central Europe and
North America: 13,000 [9,900–
18,000]
Sub-Saharan Africa:
660,000 [480,000–
920,000]
Eastern Europe and Central Asia:
34,000 [25,000 – 41,000]
Middle East and North Africa:
9,800 [6,400–15,000]
Asia and the
Pacific: 170,000
[110,000–280,000]
9.6 million deaths
1. GLOBOCAN 2019. Estimated Cancer Incidence, Mortality, and Prevalence Worldwide in 2018.
http://globocan.iarc.fr/Pages/fact_sheets_cancer.aspx. Accessed 28 March 2019.
2. UNAIDS Fact Sheet 2018. http://www.unaids.org/en/resources/fact-sheet. Accessed 28 March 2019.
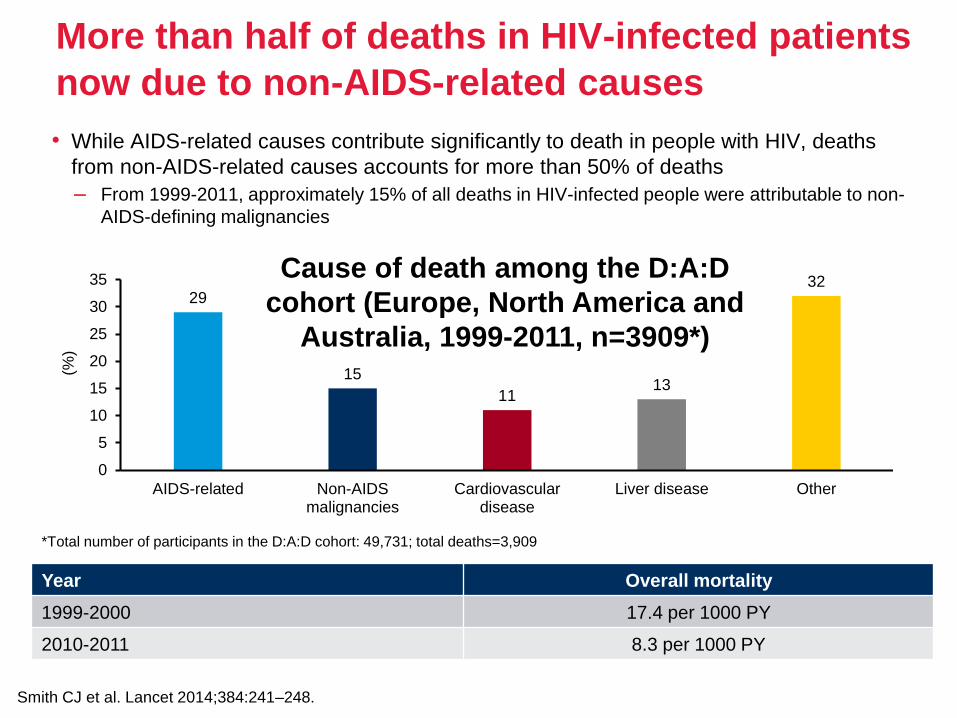
More than half of deaths in HIV-infected patients
now due to non-AIDS-related causes
• While AIDS-related causes contribute significantly to death in people with HIV, deaths
from non-AIDS-related causes accounts for more than 50% of deaths
– From 1999-2011, approximately 15% of all deaths in HIV-infected people were attributable to non-
AIDS-defining malignancies
Smith CJ et al. Lancet 2014;384:241–248.
*Total number of participants in the D:A:D cohort: 49,731; total deaths=3,909
Year Overall mortality
1999-2000 17.4 per 1000 PY
2010-2011 8.3 per 1000 PY
29
15
1113
32
0
5
10
15
20
25
30
35
AIDS-related Non-AIDSmalignancies
Cardiovasculardisease
Liver disease Other
Cause of death among the D:A:D
cohort (Europe, North America and
Australia, 1999-2011, n=3909*)
(%)
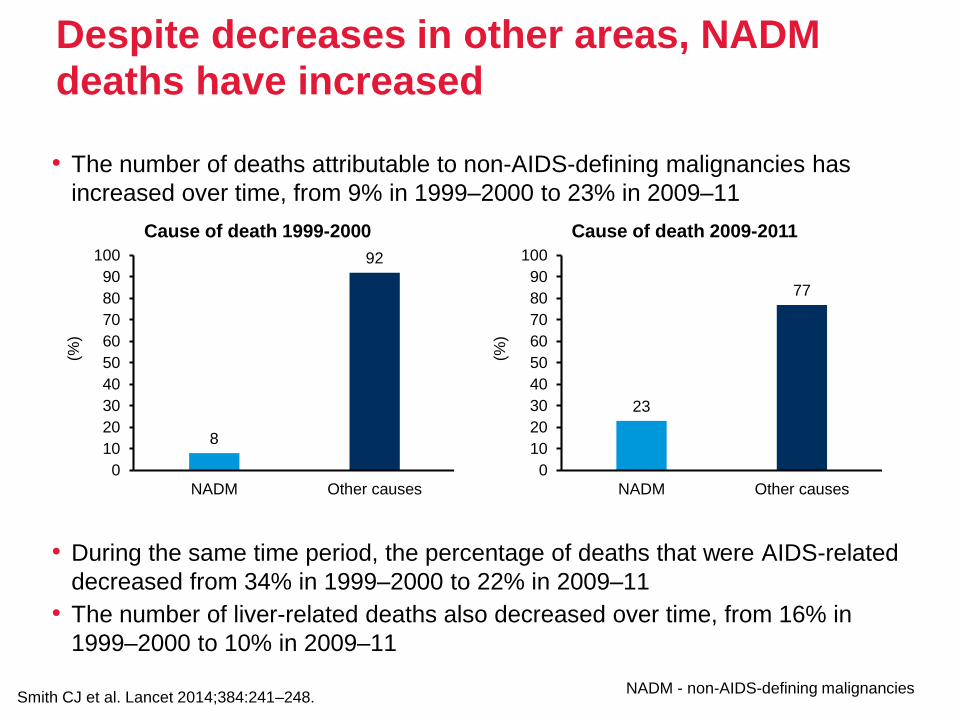
Despite decreases in other areas, NADM deaths have increased
• The number of deaths attributable to non-AIDS-defining malignancies has
increased over time, from 9% in 1999–2000 to 23% in 2009–11
• During the same time period, the percentage of deaths that were AIDS-related
decreased from 34% in 1999–2000 to 22% in 2009–11
• The number of liver-related deaths also decreased over time, from 16% in
1999–2000 to 10% in 2009–11
Smith CJ et al. Lancet 2014;384:241–248.
8
92
0
10
20
30
40
50
60
70
80
90
100
NADM Other causes
(%)
Cause of death 1999-2000
23
77
0
10
20
30
40
50
60
70
80
90
100
NADM Other causes(%
)
Cause of death 2009-2011
NADM - non-AIDS-defining malignancies
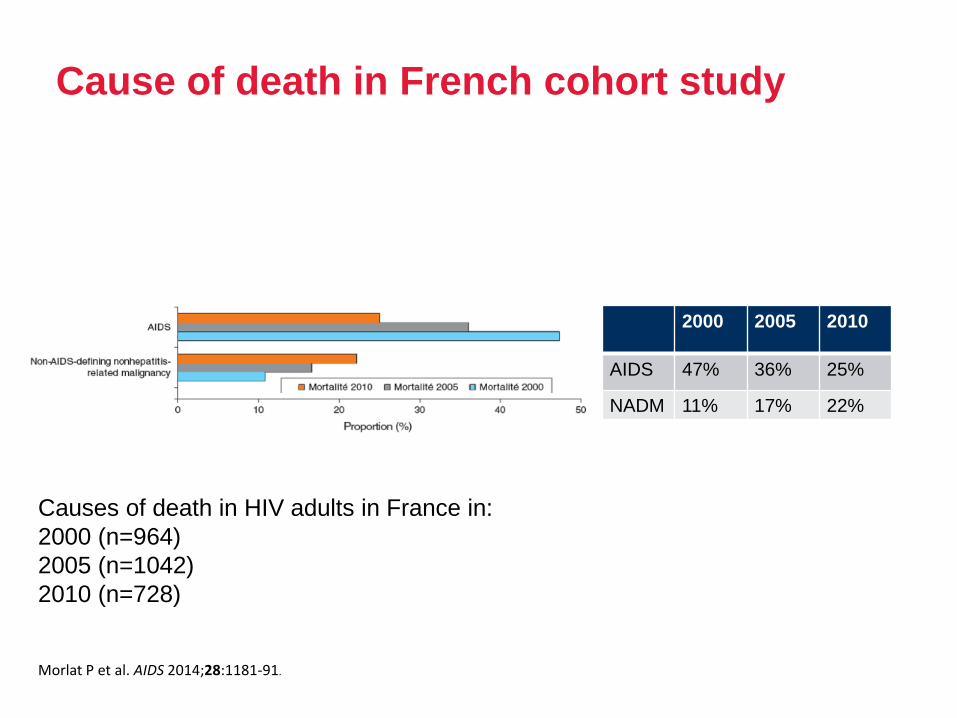
Cause of death in French cohort study
2000 2005 2010
AIDS 47% 36% 25%
NADM 11% 17% 22%
Morlat P et al. AIDS 2014;28:1181-91.
Causes of death in HIV adults in France in:
2000 (n=964)
2005 (n=1042)
2010 (n=728)
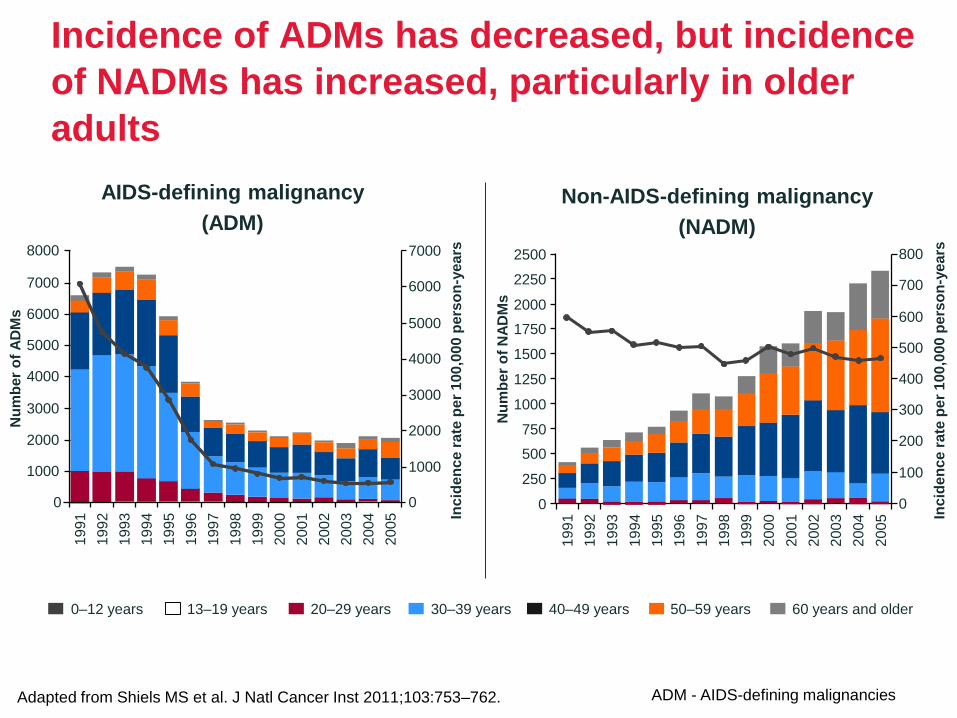
Incidence of ADMs has decreased, but incidence
of NADMs has increased, particularly in older
adults
Adapted from Shiels MS et al. J Natl Cancer Inst 2011;103:753–762.
1991
1993
1994
1995
1996
1997
1998
1999
2000
2001
2002
2003
2004
2005
1992
AIDS-defining malignancy
(ADM)
Non-AIDS-defining malignancy
(NADM)
Incid
en
ce
ra
te p
er
100
,00
0 p
ers
on
-ye
ars
Incid
en
ce
ra
te p
er
100
,00
0 p
ers
on
-ye
ars8000
7000
6000
5000
4000
3000
2000
1000
0
7000
6000
5000
4000
3000
2000
1000
0
1991
1992
1993
1994
1995
1996
1997
1998
1999
2000
2001
2002
2003
2004
2005
2500
2250
2000
1750
1500
1250
1000
750
500
250
0
800
700
600
500
400
300
200
100
0
0–12 years 20–29 years 40–49 years 60 years and older13–19 years 30–39 years 50–59 years
Nu
mb
er
of
NA
DM
s
Nu
mb
er
of
AD
Ms
ADM - AIDS-defining malignancies
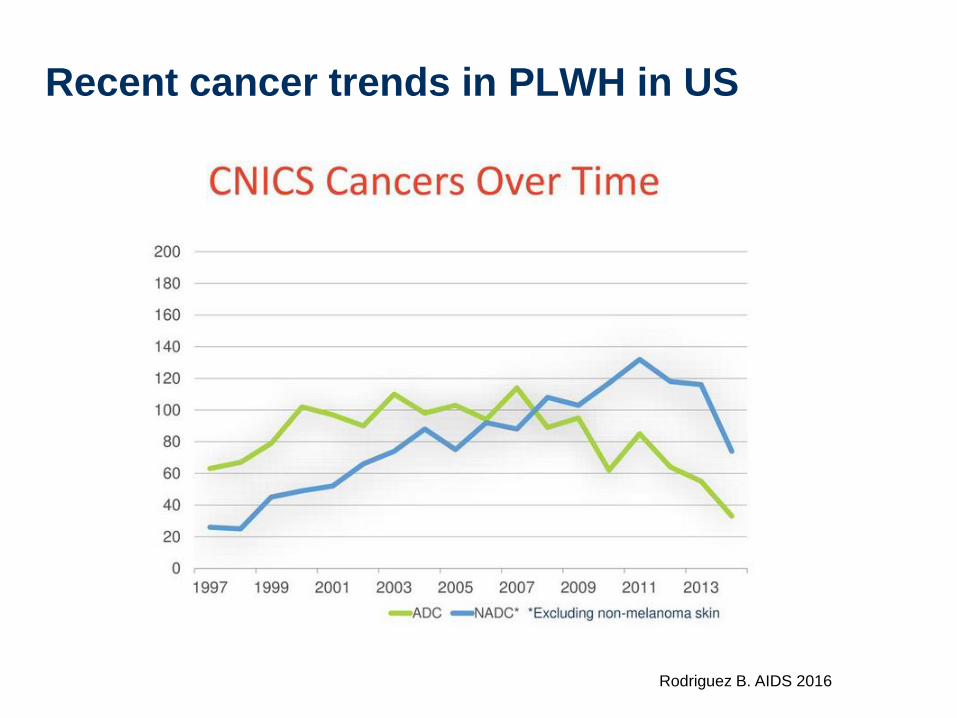
Recent cancer trends in PLWH in US
Rodriguez B. AIDS 2016
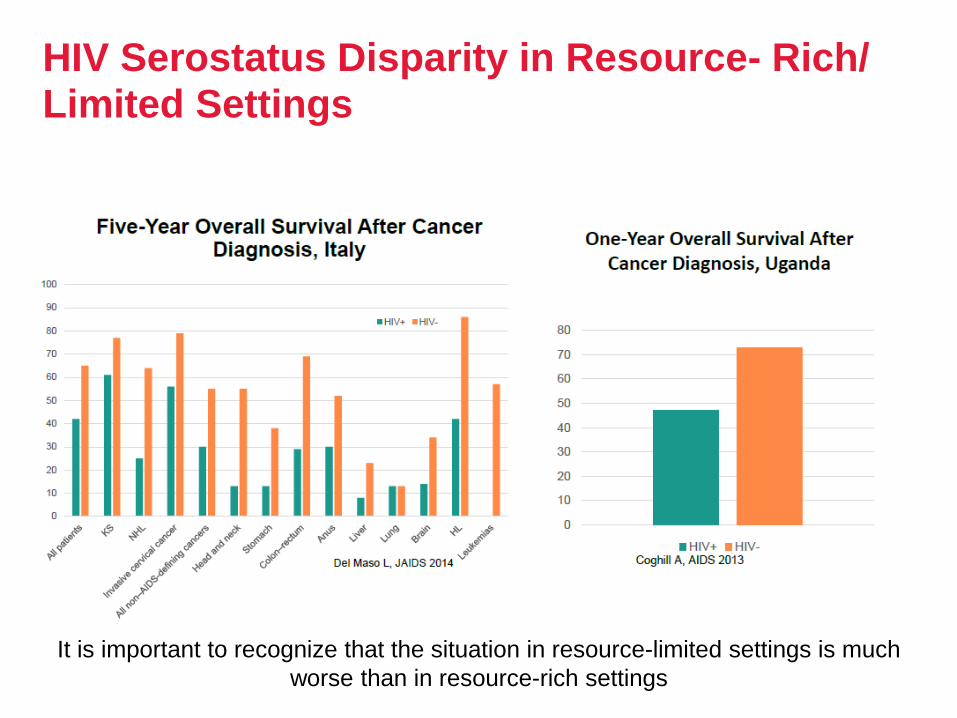
HIV Serostatus Disparity in Resource- Rich/ Limited Settings
It is important to recognize that the situation in resource-limited settings is much
worse than in resource-rich settings
Cancer and Ageing
• The underlying mechanism in both cancer and aging is the
time dependent accumulation of cellular damage
• Cancer and aging may seem like opposite processes
– cancer cells have the ‘gain of function and fitness’
– aging cells are characterized by a ‘loss of function and
fitness’
– cancer cells can be with advantageous mutations, rapid
cell division and increased energy consumption
– aged cells are hypoactive with accumulated
disadvantageous mutations, cells division inability and a
decreased ability for energy production and consumption
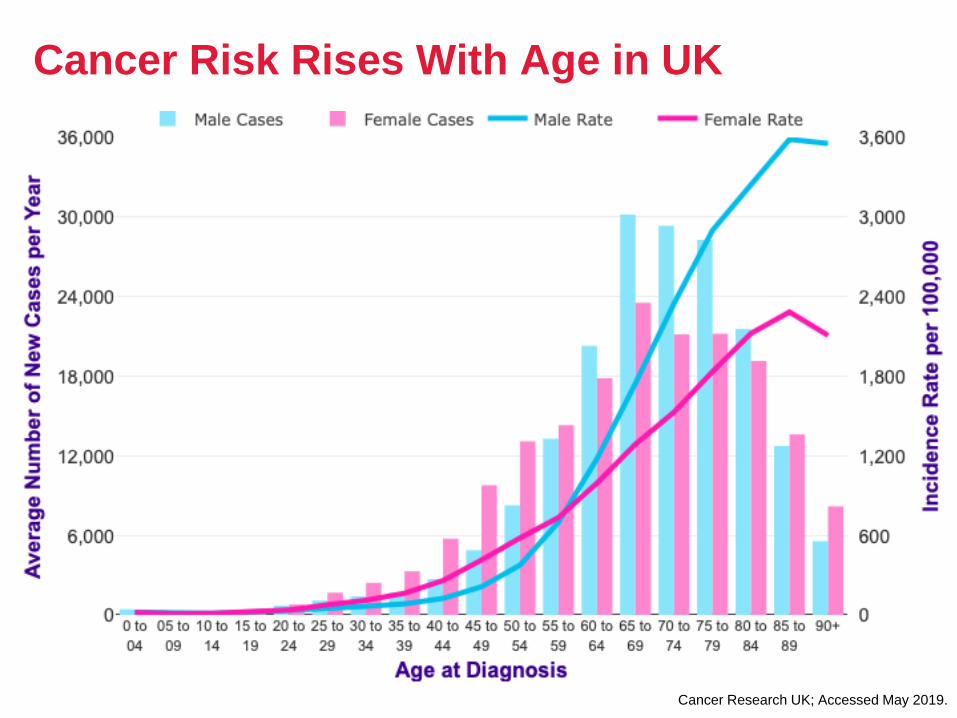
Cancer Risk Rises With Age in UK
Data from CRUK
Cancer Research UK; Accessed May 2019.
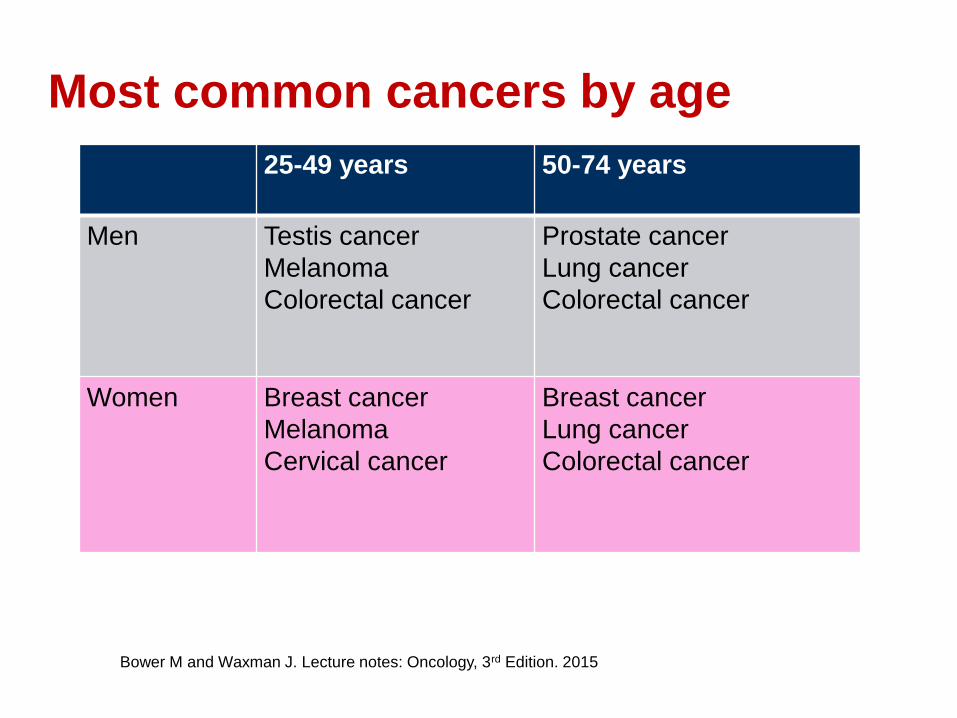
Most common cancers by age
Bower M and Waxman J. Lecture notes: Oncology, 3rd Edition. 2015
25-49 years 50-74 years
Men Testis cancer
Melanoma
Colorectal cancer
Prostate cancer
Lung cancer
Colorectal cancer
Women Breast cancer
Melanoma
Cervical cancer
Breast cancer
Lung cancer
Colorectal cancer
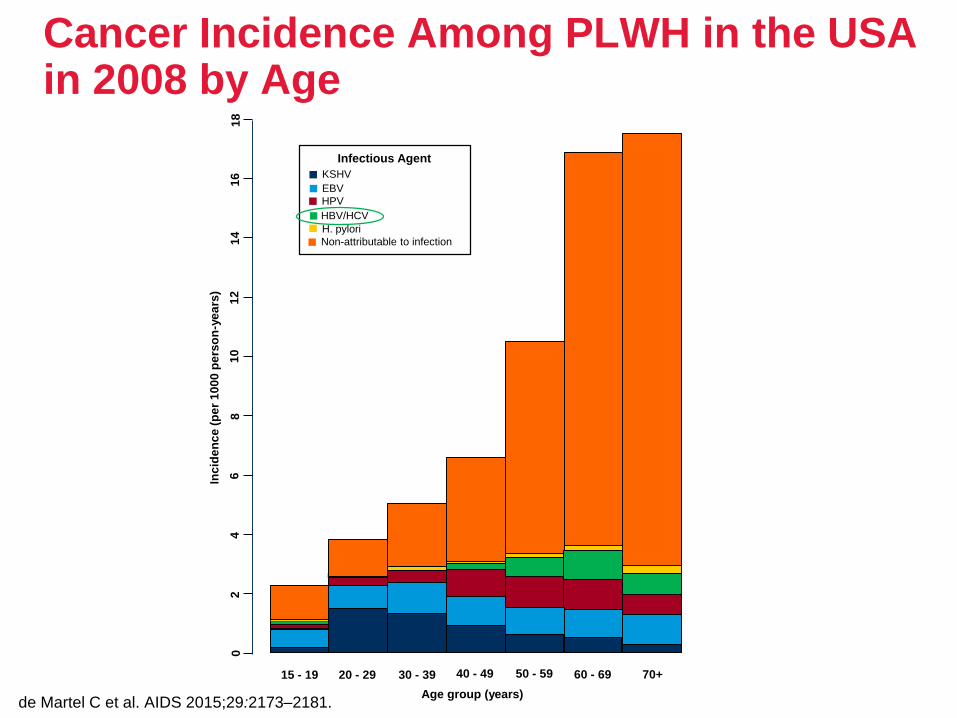
Cancer Incidence Among PLWH in the USA in 2008 by Age
de Martel C et al. AIDS 2015;29:2173–2181.
KSHV
EBV
HPV
HBV/HCV
H. pylori
Non-attributable to infection
Infectious Agent
Inc
ide
nc
e (
pe
r 1
00
0 p
ers
on
-ye
ars
)
15 - 19 20 - 29 30 - 39 40 - 49 50 - 59 60 - 69 70+
02
46
81
01
21
41
61
8
Age group (years)
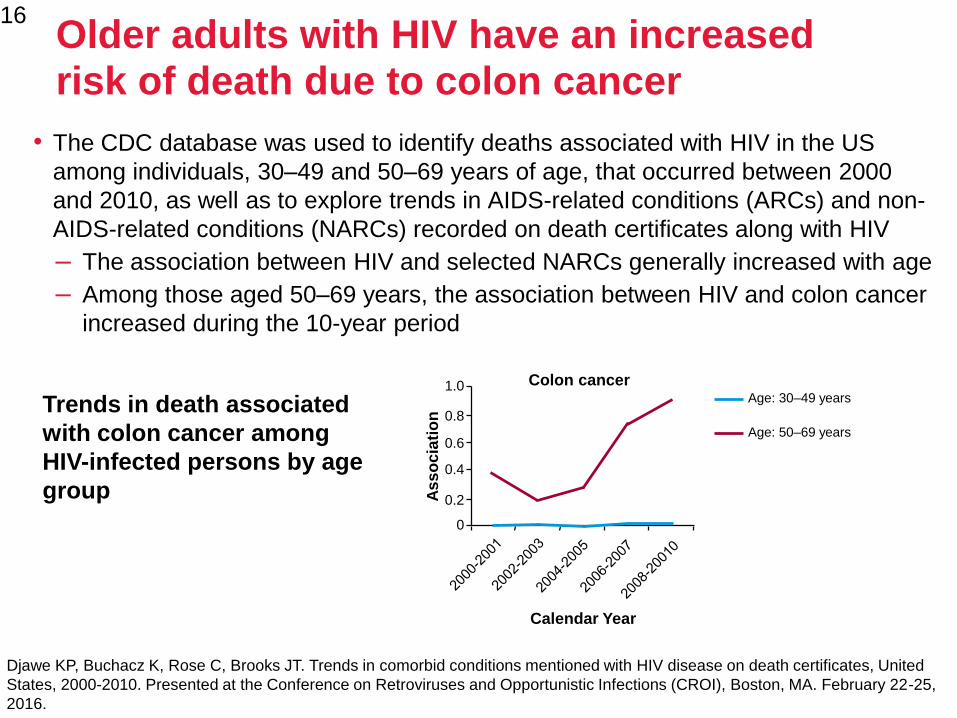
Older adults with HIV have an increased risk of death due to colon cancer
• The CDC database was used to identify deaths associated with HIV in the US
among individuals, 30–49 and 50–69 years of age, that occurred between 2000
and 2010, as well as to explore trends in AIDS-related conditions (ARCs) and non-
AIDS-related conditions (NARCs) recorded on death certificates along with HIV
– The association between HIV and selected NARCs generally increased with age
– Among those aged 50–69 years, the association between HIV and colon cancer
increased during the 10-year period
16
Djawe KP, Buchacz K, Rose C, Brooks JT. Trends in comorbid conditions mentioned with HIV disease on death certificates, United
States, 2000-2010. Presented at the Conference on Retroviruses and Opportunistic Infections (CROI), Boston, MA. February 22-25,
2016.
Trends in death associated
with colon cancer among
HIV-infected persons by age
group
Age: 30–49 years
Age: 50–69 yearsA
ss
oc
iati
on
0.4
0.6
0.8
1.0
0
0.2
Calendar Year
Colon cancer
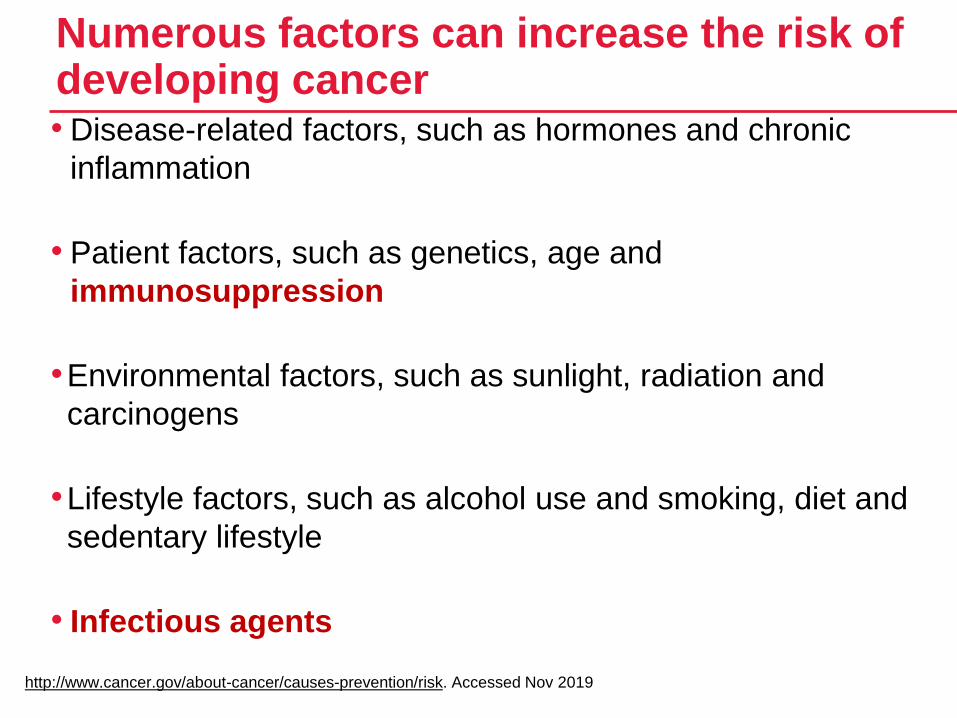
• Disease-related factors, such as hormones and chronic
inflammation
• Patient factors, such as genetics, age and
immunosuppression
•Environmental factors, such as sunlight, radiation and
carcinogens
•Lifestyle factors, such as alcohol use and smoking, diet and
sedentary lifestyle
• Infectious agents
Numerous factors can increase the risk of developing cancer
http://www.cancer.gov/about-cancer/causes-prevention/risk. Accessed Nov 2019
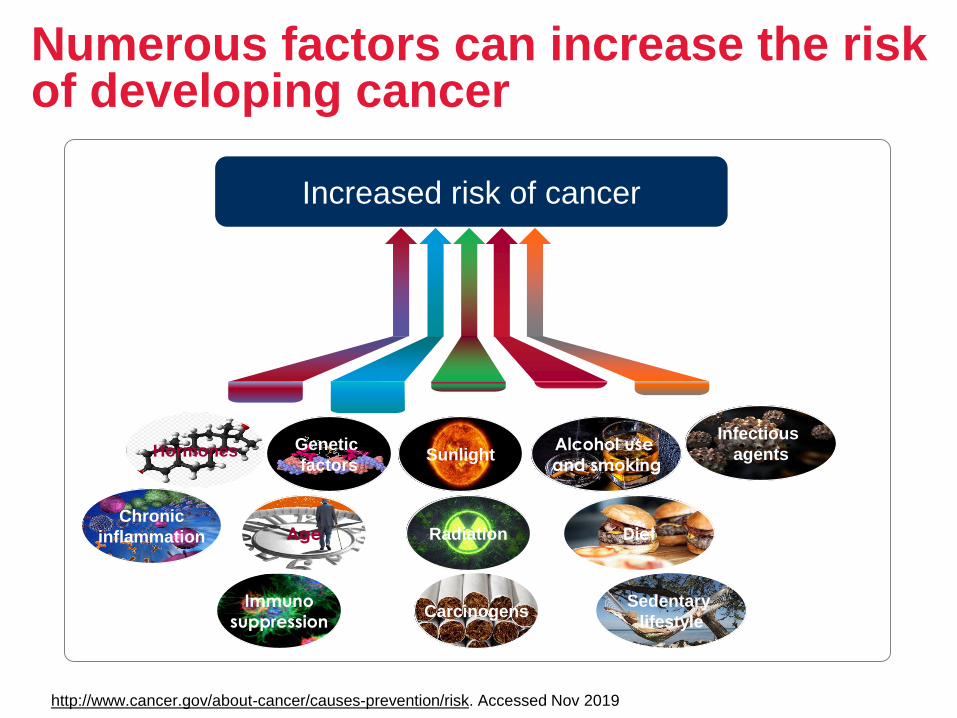
Numerous factors can increase the risk of developing cancer
http://www.cancer.gov/about-cancer/causes-prevention/risk. Accessed Nov 2019
Carcinogens
Diet
Immuno
suppression
Alcohol use
and smoking
Infectious
agentsGenetic
factors
Chronic
inflammation Radiation
SunlightHormones
Age
Sedentary
lifestyle
Increased risk of cancer
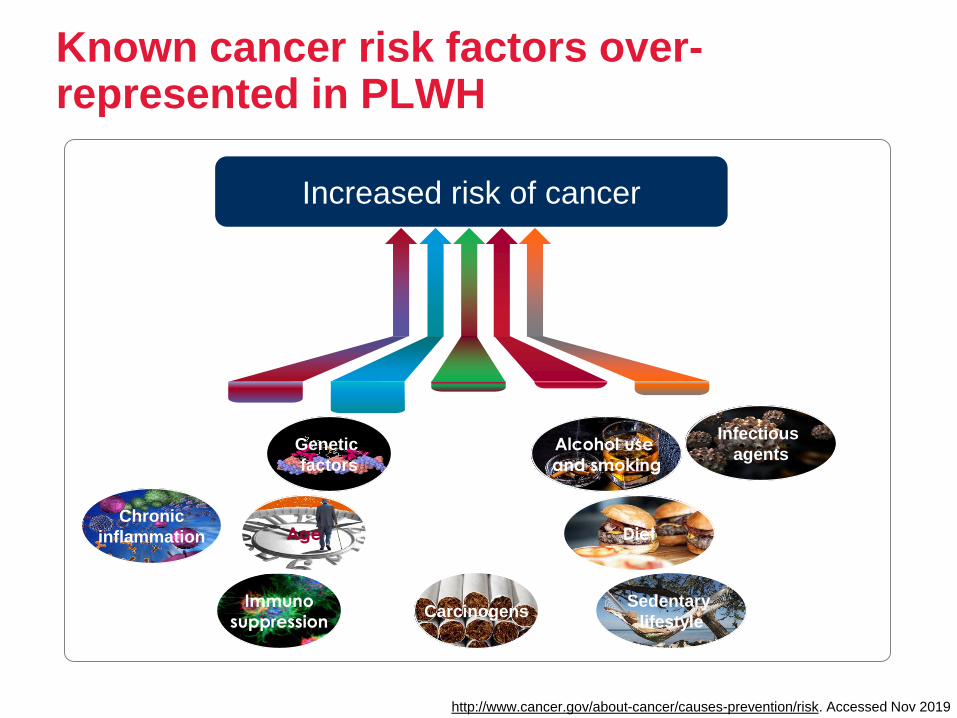
Known cancer risk factors over-represented in PLWH
http://www.cancer.gov/about-cancer/causes-prevention/risk. Accessed Nov 2019
Carcinogens
Diet
Immuno
suppression
Alcohol use
and smoking
Infectious
agentsGenetic
factors
Chronic
inflammation Age
Sedentary
lifestyle
Increased risk of cancer
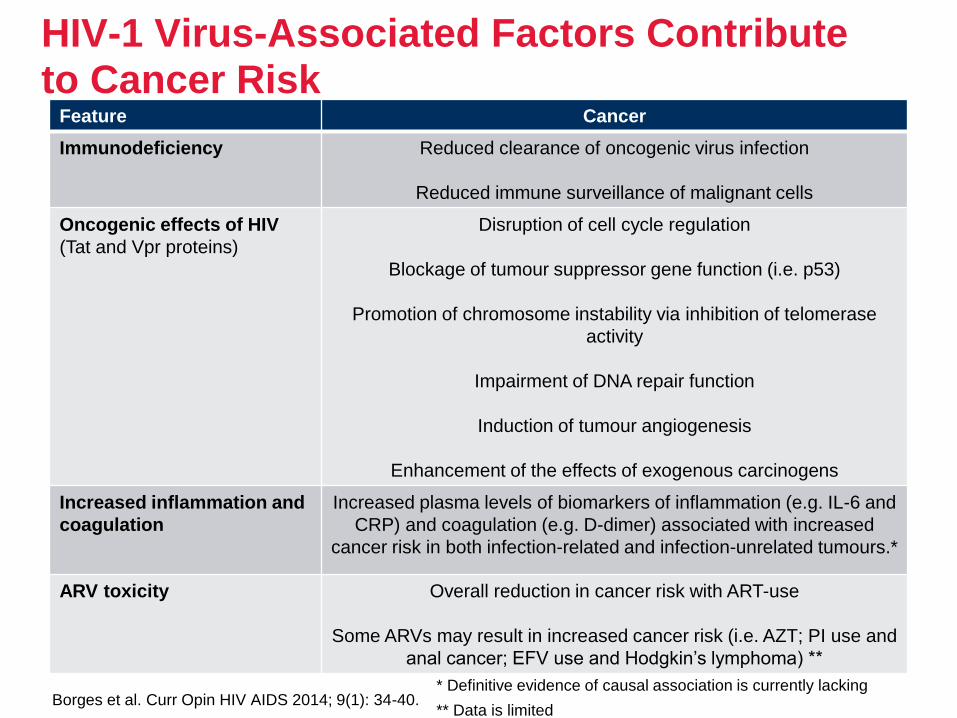
HIV-1 Virus-Associated Factors Contribute to Cancer Risk
Borges et al. Curr Opin HIV AIDS 2014; 9(1): 34-40.
Feature Cancer
Immunodeficiency Reduced clearance of oncogenic virus infection
Reduced immune surveillance of malignant cells
Oncogenic effects of HIV
(Tat and Vpr proteins)
Disruption of cell cycle regulation
Blockage of tumour suppressor gene function (i.e. p53)
Promotion of chromosome instability via inhibition of telomerase
activity
Impairment of DNA repair function
Induction of tumour angiogenesis
Enhancement of the effects of exogenous carcinogens
Increased inflammation and
coagulation
Increased plasma levels of biomarkers of inflammation (e.g. IL-6 and
CRP) and coagulation (e.g. D-dimer) associated with increased
cancer risk in both infection-related and infection-unrelated tumours.*
ARV toxicity Overall reduction in cancer risk with ART-use
Some ARVs may result in increased cancer risk (i.e. AZT; PI use and
anal cancer; EFV use and Hodgkin’s lymphoma) **
* Definitive evidence of causal association is currently lacking
** Data is limited
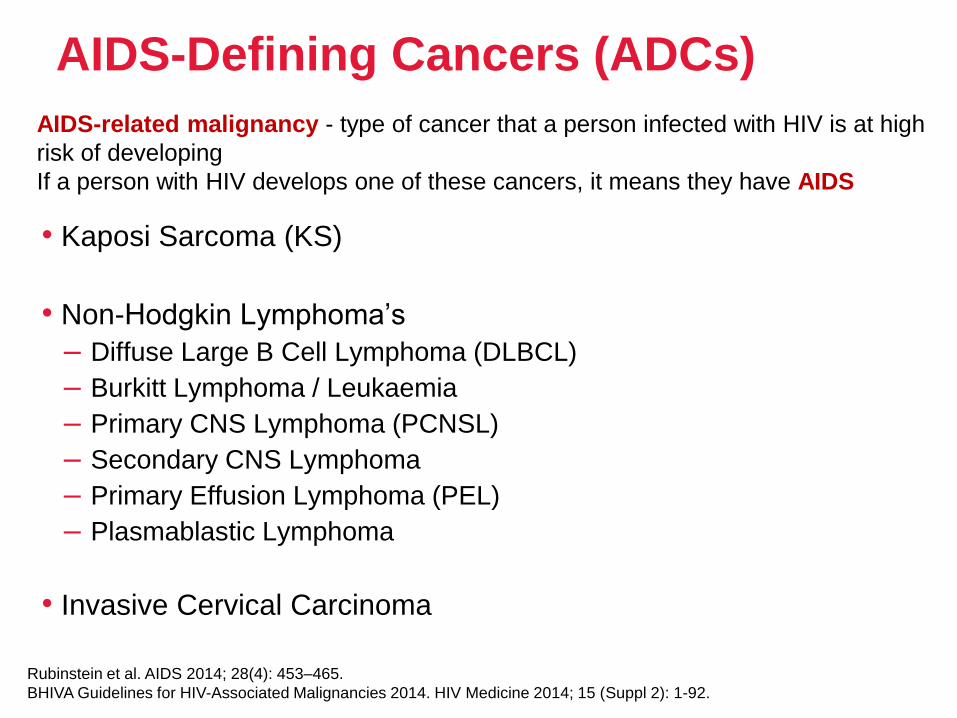
AIDS-Defining Cancers (ADCs)
• Kaposi Sarcoma (KS)
• Non-Hodgkin Lymphoma’s
– Diffuse Large B Cell Lymphoma (DLBCL)
– Burkitt Lymphoma / Leukaemia
– Primary CNS Lymphoma (PCNSL)
– Secondary CNS Lymphoma
– Primary Effusion Lymphoma (PEL)
– Plasmablastic Lymphoma
• Invasive Cervical Carcinoma
Rubinstein et al. AIDS 2014; 28(4): 453–465.
BHIVA Guidelines for HIV-Associated Malignancies 2014. HIV Medicine 2014; 15 (Suppl 2): 1-92.
AIDS-related malignancy - type of cancer that a person infected with HIV is at high
risk of developing
If a person with HIV develops one of these cancers, it means they have AIDS
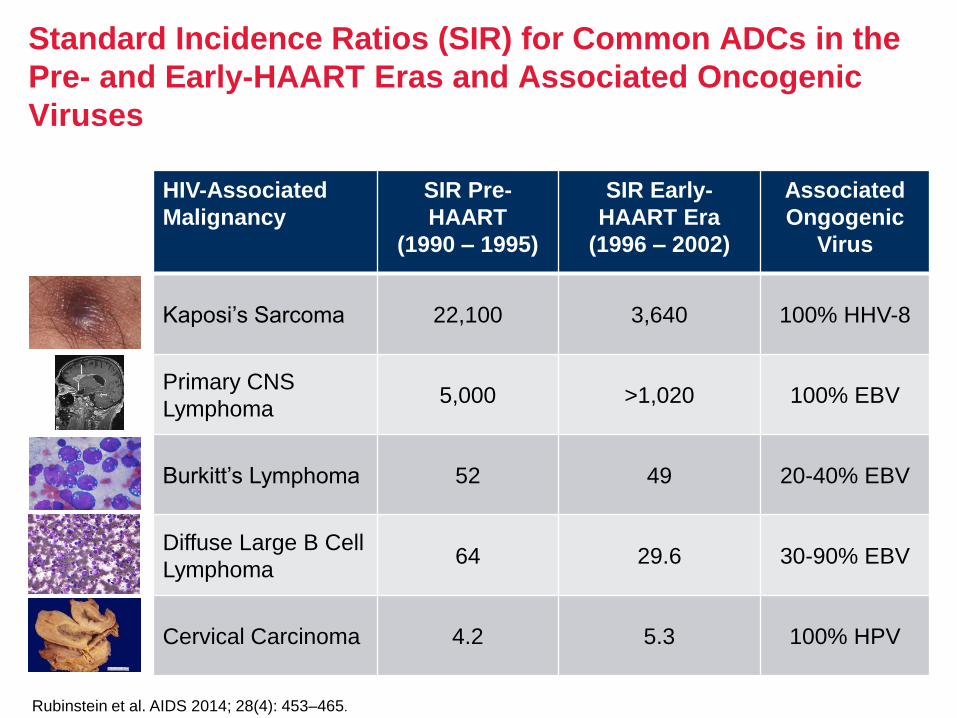
Standard Incidence Ratios (SIR) for Common ADCs in the
Pre- and Early-HAART Eras and Associated Oncogenic
Viruses
HIV-Associated
Malignancy
SIR Pre-
HAART
(1990 – 1995)
SIR Early-
HAART Era
(1996 – 2002)
Associated
Ongogenic
Virus
Kaposi’s Sarcoma 22,100 3,640 100% HHV-8
Primary CNS
Lymphoma5,000 >1,020 100% EBV
Burkitt’s Lymphoma 52 49 20-40% EBV
Diffuse Large B Cell
Lymphoma64 29.6 30-90% EBV
Cervical Carcinoma 4.2 5.3 100% HPV
Rubinstein et al. AIDS 2014; 28(4): 453–465.
The incidence of ADCs has been in decline since shortly after
the introduction of HAART, but remains greater even in treated
PLWH than in the general population
• KS and NHL accounted for 99% of all ADCs in the pre-HAART era
• When ART was introduced, the number of KS cases declined by 84% and
the number of NHL cases declined by 54%
• The incidence of all ADC’s decreased by 70%.
The incidence of ADCs
Rubinstein et al. AIDS 2014; 28(4): 453–465
• The etiological factors that contribute to both ADCs and
NADCs are multifactorial
• PLWH are susceptible to infection by oncogenic viruses:
– KSHV or HHV-8, EBV, HPV and HBV/HCV are implicated in
various ADCs and NADCs and are more prevalent than in the
general population
• These viruses can express miRNAs, small non-coding RNAs
that act as negative regulators of protein synthesis and can,
through various mechanisms, promote cancer
• HIV has been implicated in inhibiting tumour suppression
mechanisms
The etiological factors that contribute to ADCs and NADCs
Rubinstein et al. AIDS 2014; 28(4): 453–465
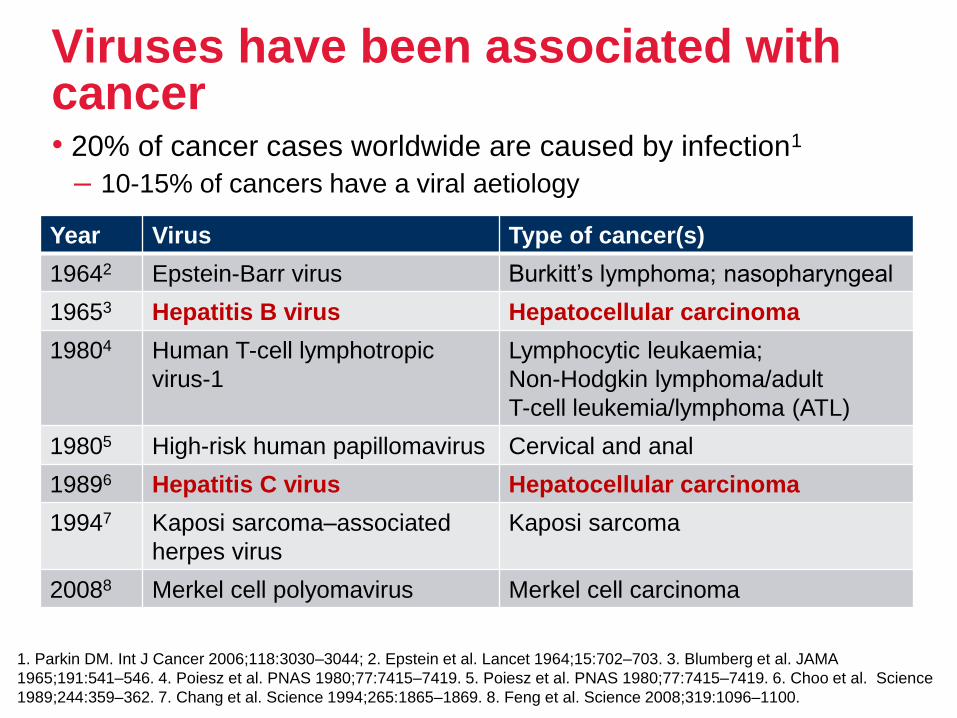
Viruses have been associated with cancer• 20% of cancer cases worldwide are caused by infection1
– 10-15% of cancers have a viral aetiology
1. Parkin DM. Int J Cancer 2006;118:3030–3044; 2. Epstein et al. Lancet 1964;15:702–703. 3. Blumberg et al. JAMA
1965;191:541–546. 4. Poiesz et al. PNAS 1980;77:7415–7419. 5. Poiesz et al. PNAS 1980;77:7415–7419. 6. Choo et al. Science
1989;244:359–362. 7. Chang et al. Science 1994;265:1865–1869. 8. Feng et al. Science 2008;319:1096–1100.
Year Virus Type of cancer(s)
19642 Epstein-Barr virus Burkitt’s lymphoma; nasopharyngeal
19653 Hepatitis B virus Hepatocellular carcinoma
19804 Human T-cell lymphotropic
virus-1
Lymphocytic leukaemia;
Non-Hodgkin lymphoma/adult
T-cell leukemia/lymphoma (ATL)
19805 High-risk human papillomavirus Cervical and anal
19896 Hepatitis C virus Hepatocellular carcinoma
19947 Kaposi sarcoma–associated
herpes virus
Kaposi sarcoma
20088 Merkel cell polyomavirus Merkel cell carcinoma
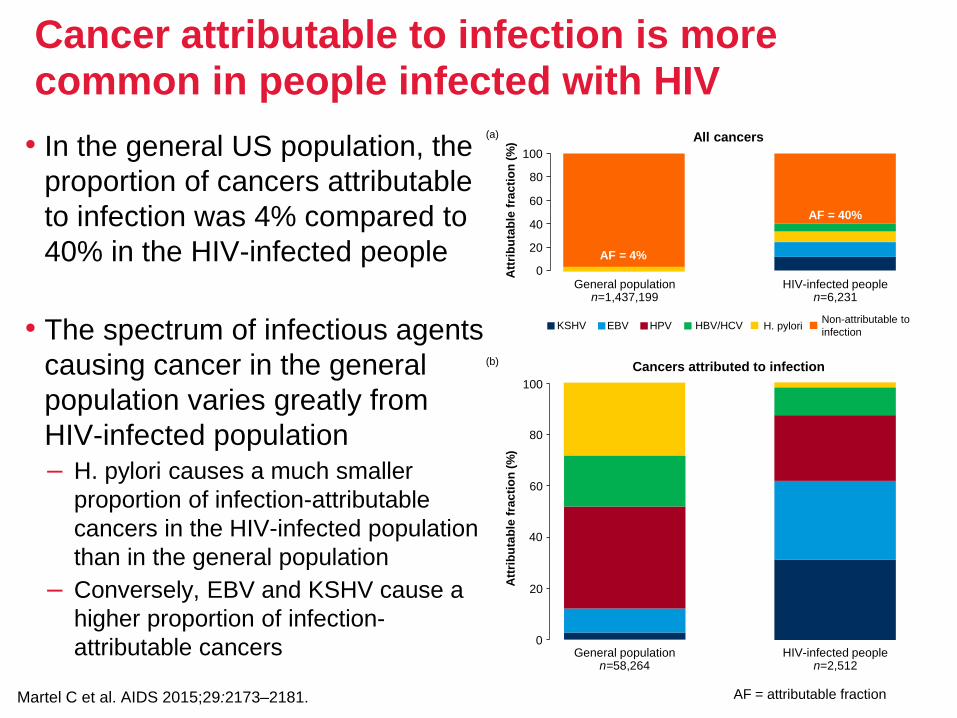
Cancer attributable to infection is more common in people infected with HIV
• In the general US population, the
proportion of cancers attributable
to infection was 4% compared to
40% in the HIV-infected people
• The spectrum of infectious agents
causing cancer in the general
population varies greatly from
HIV-infected population– H. pylori causes a much smaller
proportion of infection-attributable
cancers in the HIV-infected population
than in the general population
– Conversely, EBV and KSHV cause a
higher proportion of infection-
attributable cancers
Martel C et al. AIDS 2015;29:2173–2181.
0
20
40
60
80
100
Att
rib
uta
ble
fra
cti
on
(%
)
Cancers attributed to infection
General populationn=58,264
HIV-infected peoplen=2,512
(b)
0
20
40
60
80
100
Att
rib
uta
ble
fra
cti
on
(%
) All cancers
General populationn=1,437,199
HIV-infected peoplen=6,231
(a)
KSHV EBV HPV HBV/HCV H. pyloriNon-attributable to
infection
AF = 4%
AF = 40%
AF = attributable fraction
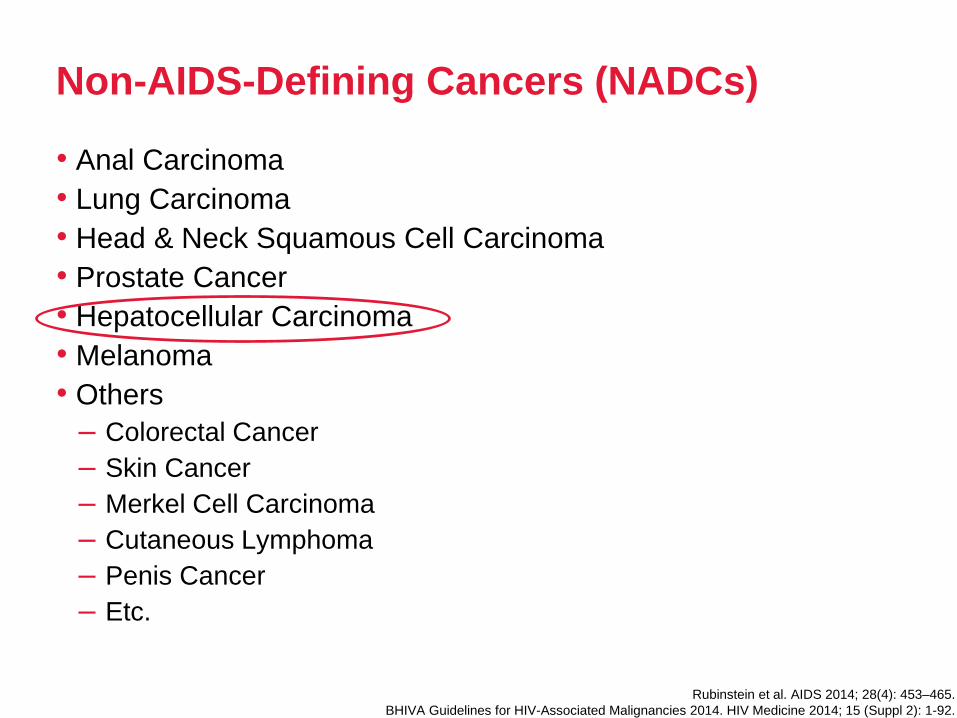
Non-AIDS-Defining Cancers (NADCs)
• Anal Carcinoma
• Lung Carcinoma
• Head & Neck Squamous Cell Carcinoma
• Prostate Cancer
• Hepatocellular Carcinoma
• Melanoma
• Others
– Colorectal Cancer
– Skin Cancer
– Merkel Cell Carcinoma
– Cutaneous Lymphoma
– Penis Cancer
– Etc.
Rubinstein et al. AIDS 2014; 28(4): 453–465.
BHIVA Guidelines for HIV-Associated Malignancies 2014. HIV Medicine 2014; 15 (Suppl 2): 1-92.
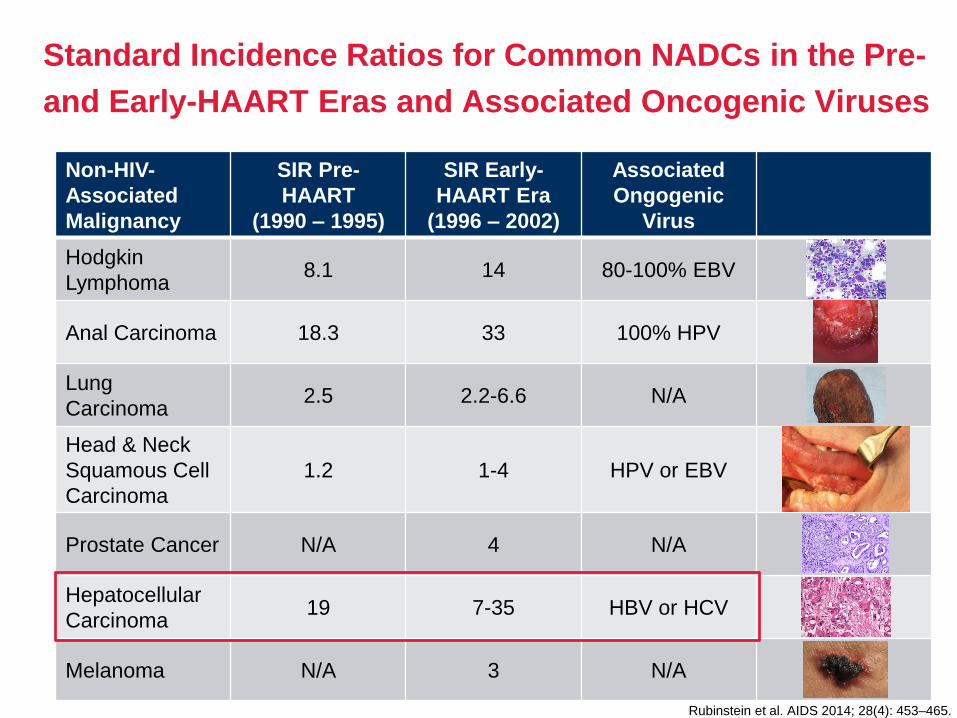
Standard Incidence Ratios for Common NADCs in the Pre-
and Early-HAART Eras and Associated Oncogenic Viruses
Non-HIV-
Associated
Malignancy
SIR Pre-
HAART
(1990 – 1995)
SIR Early-
HAART Era
(1996 – 2002)
Associated
Ongogenic
Virus
Hodgkin
Lymphoma8.1 14 80-100% EBV
Anal Carcinoma 18.3 33 100% HPV
Lung
Carcinoma2.5 2.2-6.6 N/A
Head & Neck
Squamous Cell
Carcinoma
1.2 1-4 HPV or EBV
Prostate Cancer N/A 4 N/A
Hepatocellular
Carcinoma19 7-35 HBV or HCV
Melanoma N/A 3 N/A
Rubinstein et al. AIDS 2014; 28(4): 453–465.
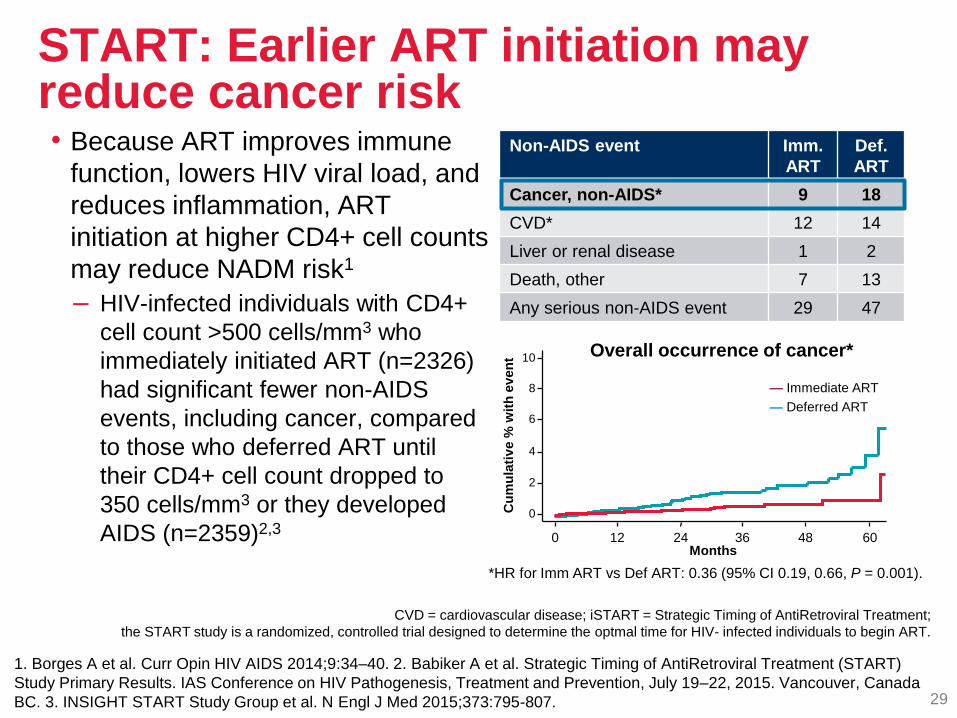
START: Earlier ART initiation may reduce cancer risk
1. Borges A et al. Curr Opin HIV AIDS 2014;9:34–40. 2. Babiker A et al. Strategic Timing of AntiRetroviral Treatment (START)
Study Primary Results. IAS Conference on HIV Pathogenesis, Treatment and Prevention, July 19–22, 2015. Vancouver, Canada
BC. 3. INSIGHT START Study Group et al. N Engl J Med 2015;373:795-807. 29
Non-AIDS event Imm.
ART
Def.
ART
Cancer, non-AIDS* 9 18
CVD* 12 14
Liver or renal disease 1 2
Death, other 7 13
Any serious non-AIDS event 29 47
• Because ART improves immune
function, lowers HIV viral load, and
reduces inflammation, ART
initiation at higher CD4+ cell counts
may reduce NADM risk1
– HIV-infected individuals with CD4+
cell count >500 cells/mm3 who
immediately initiated ART (n=2326)
had significant fewer non-AIDS
events, including cancer, compared
to those who deferred ART until
their CD4+ cell count dropped to
350 cells/mm3 or they developed
AIDS (n=2359)2,3
CVD = cardiovascular disease; iSTART = Strategic Timing of AntiRetroviral Treatment;
the START study is a randomized, controlled trial designed to determine the optmal time for HIV- infected individuals to begin ART.
Overall occurrence of cancer*
*HR for Imm ART vs Def ART: 0.36 (95% CI 0.19, 0.66, P = 0.001).
— Immediate ART
— Deferred ART
Cu
mu
lati
ve %
wit
h e
ven
t
4
6
8
0 48
2
10
60
0
12 24 36Months
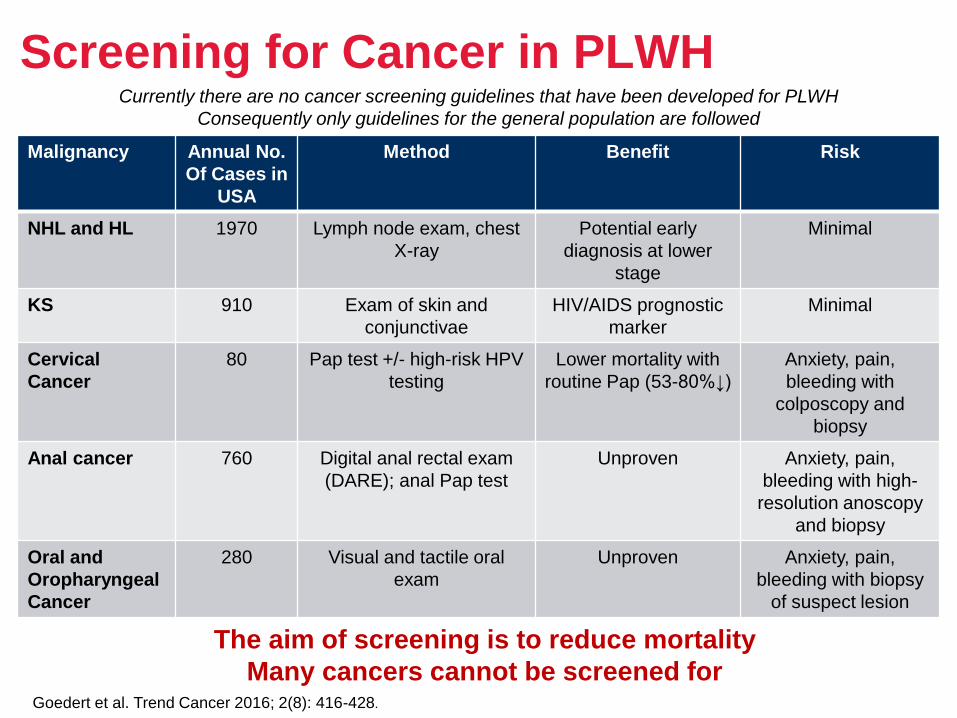
Screening for Cancer in PLWH
Malignancy Annual No.
Of Cases in
USA
Method Benefit Risk
NHL and HL 1970 Lymph node exam, chest
X-ray
Potential early
diagnosis at lower
stage
Minimal
KS 910 Exam of skin and
conjunctivae
HIV/AIDS prognostic
marker
Minimal
Cervical
Cancer
80 Pap test +/- high-risk HPV
testing
Lower mortality with
routine Pap (53-80%↓)
Anxiety, pain,
bleeding with
colposcopy and
biopsy
Anal cancer 760 Digital anal rectal exam
(DARE); anal Pap test
Unproven Anxiety, pain,
bleeding with high-
resolution anoscopy
and biopsy
Oral and
Oropharyngeal
Cancer
280 Visual and tactile oral
exam
Unproven Anxiety, pain,
bleeding with biopsy
of suspect lesion
Goedert et al. Trend Cancer 2016; 2(8): 416-428.
The aim of screening is to reduce mortality
Many cancers cannot be screened for
Currently there are no cancer screening guidelines that have been developed for PLWH
Consequently only guidelines for the general population are followed
Malignancy Annual No.
Of Cases in
USA
Method Benefit Risk
Liver Cancer 390 Liver sonography if
cirrhosis is suspected
Inconsistent
evidence for HBV, no
data for HCV and
other aetiologies
Anxiety, pain,
bleeding, possible
bile peritonitis or
pneumothorax with
biopsy of suspect
lesion
Lung Cancer 840 Low-dose computed
tomography (LD-CT)
Lower mortality in
current and recent
smokers of 30+ pack-
yrs (20%↓)
Anxiety, pain,
bleeding, possible
pneumothorax with
biopsy of suspect
lesion
Colorectal
cancer
360 Colonoscopy or annual
faecal occult blood test
18,800 fewer all-
cause deaths/ys in
USA
Colonoscopy-related
gut perforation,
bleeding
Breast cancer 180 Mammography Lower mortality (15-
35%↓)
Anxiety, pain
Prostate
Cancer
570 Prostate specific antigen
(PSA)
Inconsistent evidence
of minimally reduced
mortality (0.1%)
Anxiety, pain,
bleeding with biopsy
of suspect lesion
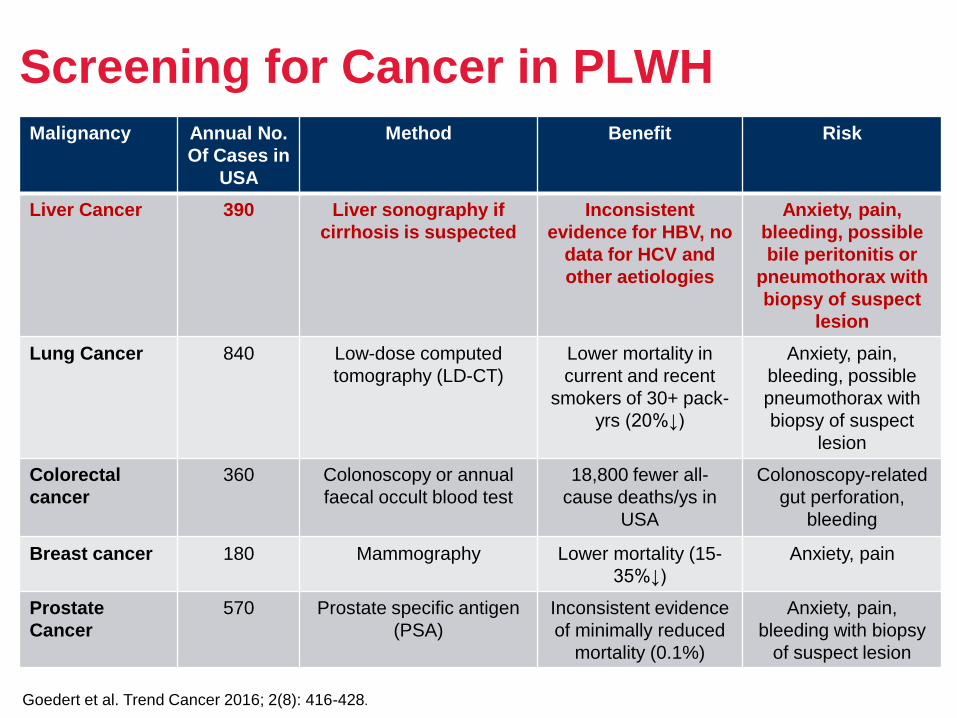
Screening for Cancer in PLWH
Goedert et al. Trend Cancer 2016; 2(8): 416-428.
Management of Malignancies in PLWH
• The clinical care of patients with ADCs and NADCs requires a
multidisciplinary approach drawing on the skills and experience of all
healthcare professional groups
– Optimal care can only be achieved by the close co-operation of oncologists,
haematologists and HIV physicians, and unless all these clinicians are
intimately involved in the care of patients it is likely that the outcome will be
less favourable
– Several studies and a Cochrane review have shown that the more HIV
patients treated by a centre, the better the outcomes1–3
– Patients with HIV-associated malignancies should therefore only be managed
in a centre dealing with large numbers of patients with these tumours4
• PLWH often present with more aggressive and advanced disease at the
time of diagnosis. Currently, the epidemiology of this is not well-
understood5
1. Curtis JR et al. Crit Care Med 1998; 26: 668–675.
2. Handford CD et al. AIDS Care 2012; 24: 267–282.
3. Rackal JM et al. Cochrane Database Syst Rev 2011; 6: CD003938.
4. BHIVA Guidelines for HIV-Associated Malignancies 2014. HIV Medicine 2014; 15(S2): 1-92.
5. Rubinstein PG et al. AIDS 2014; 28(4): 453-465.
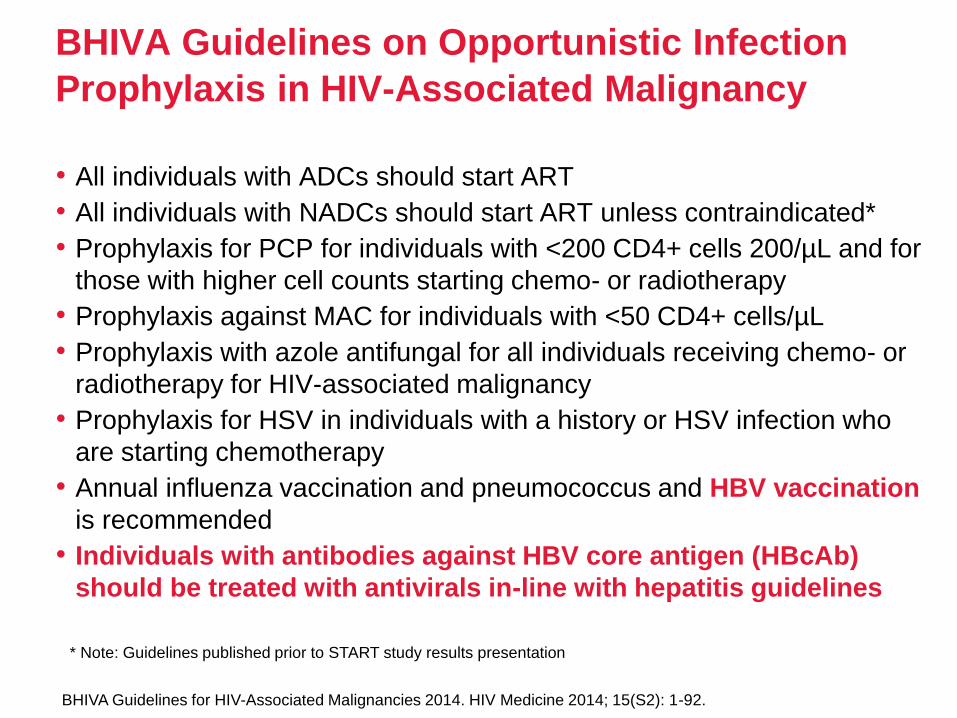
BHIVA Guidelines on Opportunistic Infection
Prophylaxis in HIV-Associated Malignancy
• All individuals with ADCs should start ART
• All individuals with NADCs should start ART unless contraindicated*
• Prophylaxis for PCP for individuals with <200 CD4+ cells 200/µL and for
those with higher cell counts starting chemo- or radiotherapy
• Prophylaxis against MAC for individuals with <50 CD4+ cells/µL
• Prophylaxis with azole antifungal for all individuals receiving chemo- or
radiotherapy for HIV-associated malignancy
• Prophylaxis for HSV in individuals with a history or HSV infection who
are starting chemotherapy
• Annual influenza vaccination and pneumococcus and HBV vaccination
is recommended
• Individuals with antibodies against HBV core antigen (HBcAb)
should be treated with antivirals in-line with hepatitis guidelines
BHIVA Guidelines for HIV-Associated Malignancies 2014. HIV Medicine 2014; 15(S2): 1-92.
* Note: Guidelines published prior to START study results presentation
HIV/HCV coinfections:impact on risk for cardiovascular events
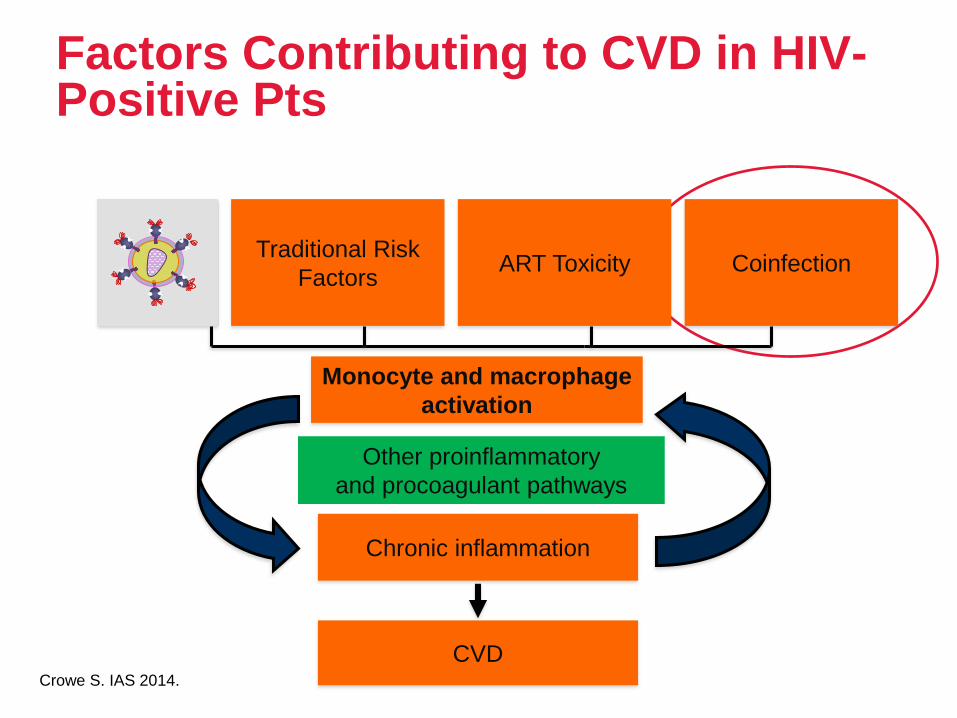
Factors Contributing to CVD in HIV-Positive Pts
Traditional Risk
FactorsART Toxicity Coinfection
CVD
Monocyte and macrophage
activation
Chronic inflammation
Other proinflammatory
and procoagulant pathways
Crowe S. IAS 2014.
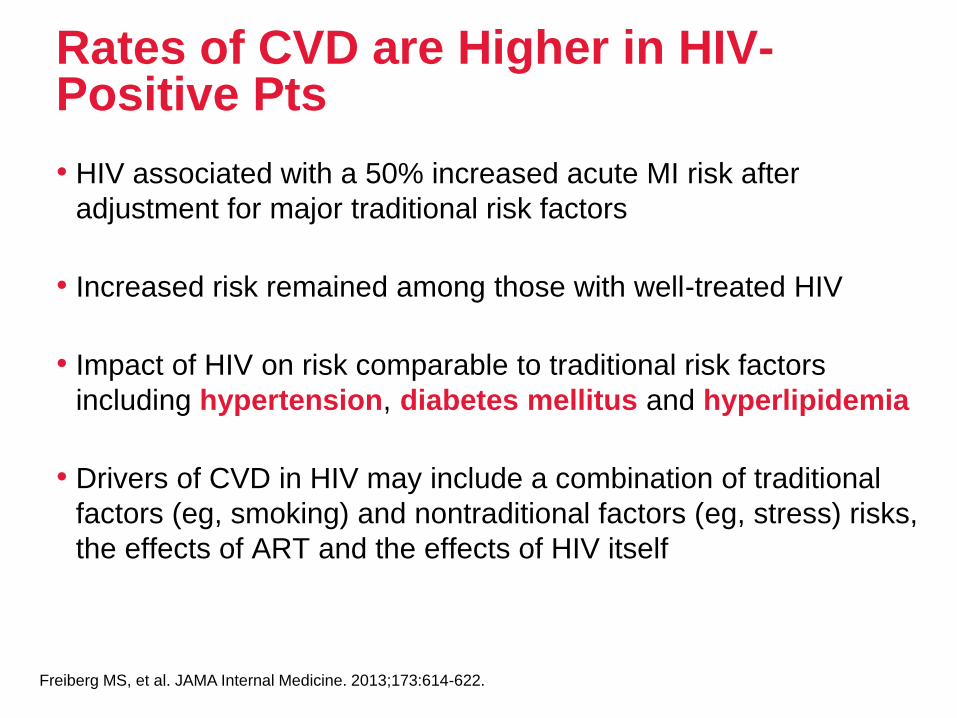
Rates of CVD are Higher in HIV-Positive Pts
• HIV associated with a 50% increased acute MI risk after
adjustment for major traditional risk factors
• Increased risk remained among those with well-treated HIV
• Impact of HIV on risk comparable to traditional risk factors
including hypertension, diabetes mellitus and hyperlipidemia
• Drivers of CVD in HIV may include a combination of traditional
factors (eg, smoking) and nontraditional factors (eg, stress) risks,
the effects of ART and the effects of HIV itself
Freiberg MS, et al. JAMA Internal Medicine. 2013;173:614-622.
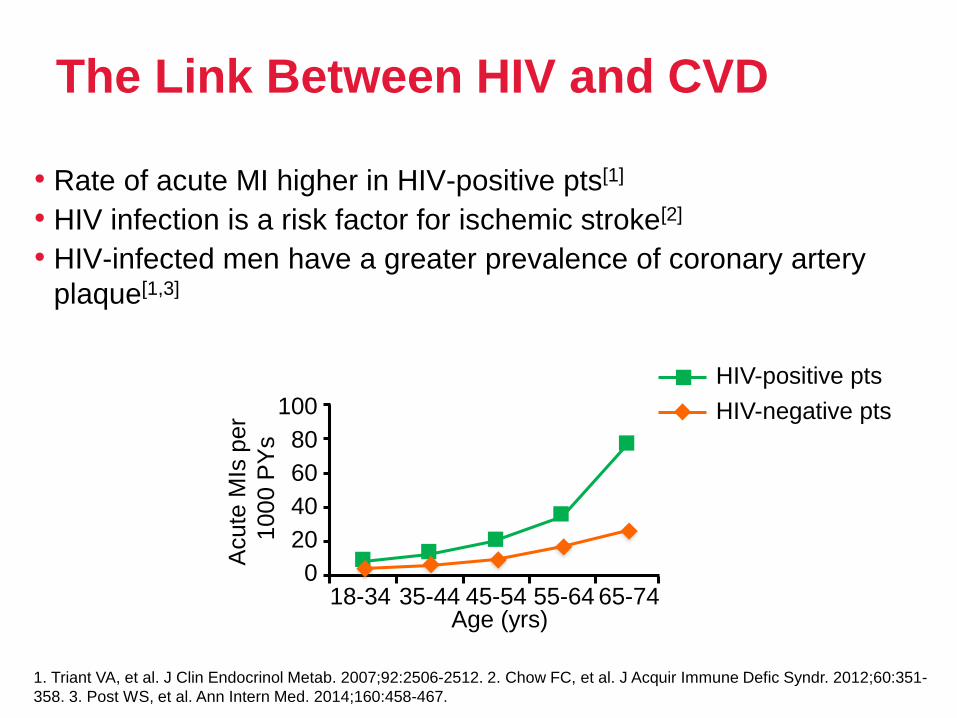
The Link Between HIV and CVD
• Rate of acute MI higher in HIV-positive pts[1]
• HIV infection is a risk factor for ischemic stroke[2]
• HIV-infected men have a greater prevalence of coronary artery
plaque[1,3]
1. Triant VA, et al. J Clin Endocrinol Metab. 2007;92:2506-2512. 2. Chow FC, et al. J Acquir Immune Defic Syndr. 2012;60:351-
358. 3. Post WS, et al. Ann Intern Med. 2014;160:458-467.
Acute
MIs
per
1000 P
Ys
18-34 35-44 45-54 55-64 65-740
20
40
80
100
60
HIV-positive pts
HIV-negative pts
Age (yrs)
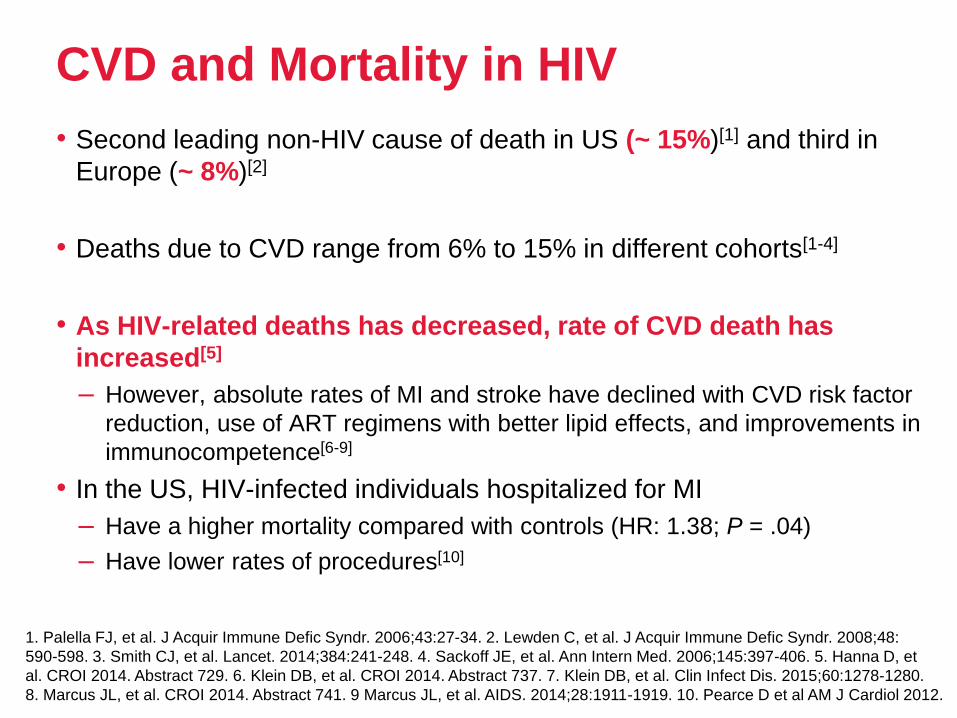
CVD and Mortality in HIV
• Second leading non-HIV cause of death in US (~ 15%)[1] and third in
Europe (~ 8%)[2]
• Deaths due to CVD range from 6% to 15% in different cohorts[1-4]
• As HIV-related deaths has decreased, rate of CVD death has
increased[5]
– However, absolute rates of MI and stroke have declined with CVD risk factor
reduction, use of ART regimens with better lipid effects, and improvements in
immunocompetence[6-9]
• In the US, HIV-infected individuals hospitalized for MI
– Have a higher mortality compared with controls (HR: 1.38; P = .04)
– Have lower rates of procedures[10]
1. Palella FJ, et al. J Acquir Immune Defic Syndr. 2006;43:27-34. 2. Lewden C, et al. J Acquir Immune Defic Syndr. 2008;48:
590-598. 3. Smith CJ, et al. Lancet. 2014;384:241-248. 4. Sackoff JE, et al. Ann Intern Med. 2006;145:397-406. 5. Hanna D, et
al. CROI 2014. Abstract 729. 6. Klein DB, et al. CROI 2014. Abstract 737. 7. Klein DB, et al. Clin Infect Dis. 2015;60:1278-1280.
8. Marcus JL, et al. CROI 2014. Abstract 741. 9 Marcus JL, et al. AIDS. 2014;28:1911-1919. 10. Pearce D et al AM J Cardiol 2012.
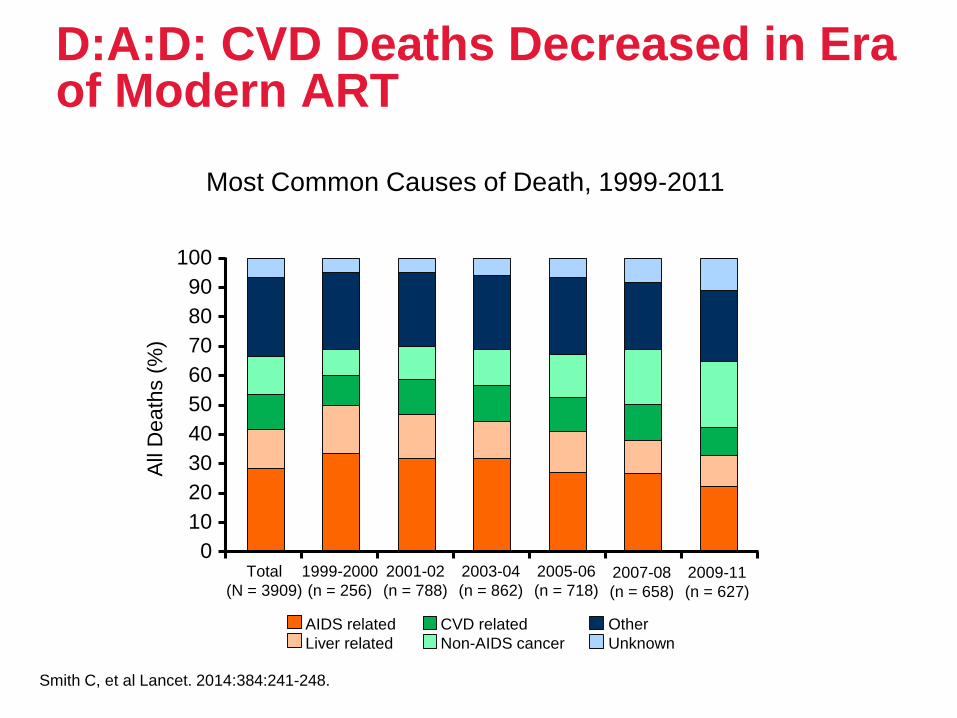
D:A:D: CVD Deaths Decreased in Era of Modern ART
Smith C, et al Lancet. 2014:384:241-248.
Most Common Causes of Death, 1999-2011
100
90
80
70
60
50
40
30
20
10
0
All
Death
s (
%)
Total
(N = 3909)
1999-2000
(n = 256)
2001-02
(n = 788)
2003-04
(n = 862)
2005-06
(n = 718)2007-08
(n = 658)
2009-11
(n = 627)
AIDS related
Liver related
CVD related
Non-AIDS cancer
Other
Unknown
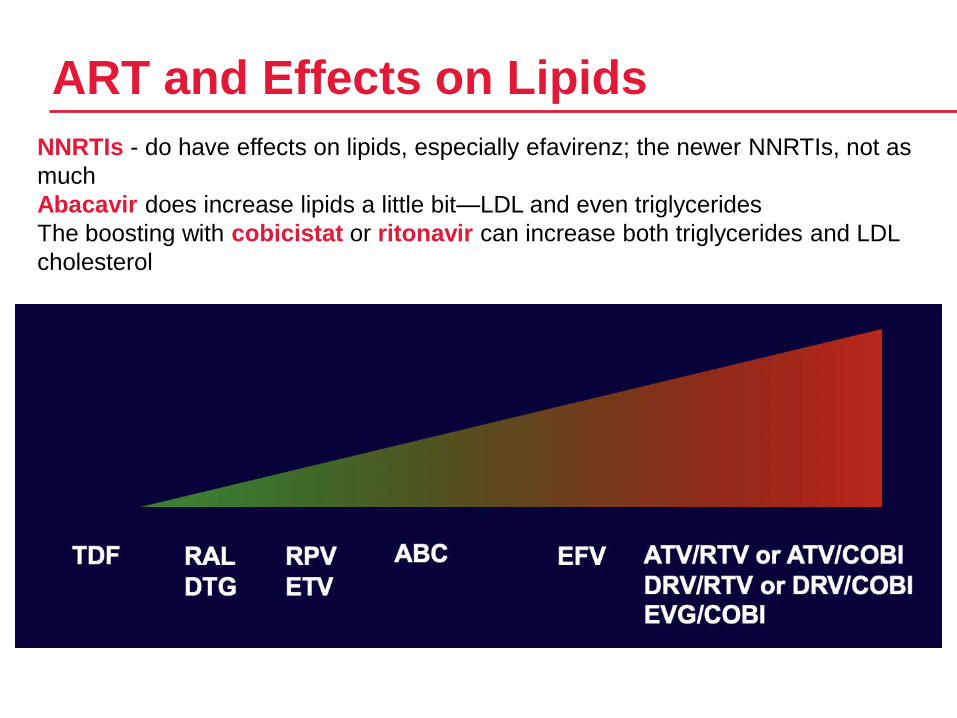
ART and Effects on Lipids
NNRTIs - do have effects on lipids, especially efavirenz; the newer NNRTIs, not as
much
Abacavir does increase lipids a little bit—LDL and even triglycerides
The boosting with cobicistat or ritonavir can increase both triglycerides and LDL
cholesterol
• It is estimated that 15%-30% of HIV-infected individuals are
also infected with HCV
• The emergence of improved ART has increased the life
expectancy of HIV-infected individuals, although there is an
increased susceptibility to developing CVD
• The risk for CVD is even higher among people with HIV/HCV
coinfection because of the increased inflammatory
response, which may synergistically impact CVD risk
HIV/HCV coinfection and the risk of cardiovascular disease
J Viral Hepat. 2017;24:998–1004.
• The risk of CVD in HIV-infected individuals has been
reported to be 61% higher compared to HIV-uninfected
individuals
• In HCV-infected individuals, the risk of CAD and stroke has been
estimated to be 25% and 27% higher, respectively, compared to
HCV-uninfected individuals
• HIV and HCV have the potential to synergistically increase the
risk of CVD in coinfected individuals due to the persistent
inflammatory responses of both viruses
• Meta-analysis of 33 723 participants with HIV/HCV coinfection
was associated with a 24%-33% increased risk of CVD compared
to HIV monoinfection
HIV/HCV coinfection and the risk of cardiovascular disease
J Viral Hepat. 2017;24:998–1004. CAD – coronary artery disease; CVD – cardiovascular disease
• The increased risk of CVD found in HIV-infected individuals to be
secondary to chronic inflammatory and immunologic responses caused by
the virus
• It can be heightened by the influence of traditional risk factors such as
smoking, prevalent in this population
• Individuals with HIV have a 2-fold increased risk for acute MI and are more
than twice as likely to be hospitalized for ischaemic heart disease
compared to HIV-uninfected individuals
• It was reported an increase in the prevalence of CVD risk factors and
established CVD among individuals with HCV infection by mechanisms
similar to the HIV
• The risk of heart failure hospitalization is more than 2 times higher in HCV
positive individuals compared to HCV negative individuals
HIV/HCV coinfection and the risk of cardiovascular disease J Viral Hepat. 2017;24:998–1004.
Management of CV risk in HIV pts
• To reduce the CVD risk as well as other comorbidities such as metabolic
abnormalities, liver and kidney diseases associated with HIV/HCV
coinfection, early initiation of ART is recommended, even though
certain ART drugs may increase lipids
• In addition, DAA should be used for the treatment of HCV in accordance
with guidelines
• CVD risk can be assessed by considering
– traditional risk factors
– HIV-related factors
• Statins have been shown to be effective in reducing CV risk in pts
without HIV infection and should be used as indicated in HIV-infected
pts
HIV/HCV coinfections:how can HCV treatment induced SVR help
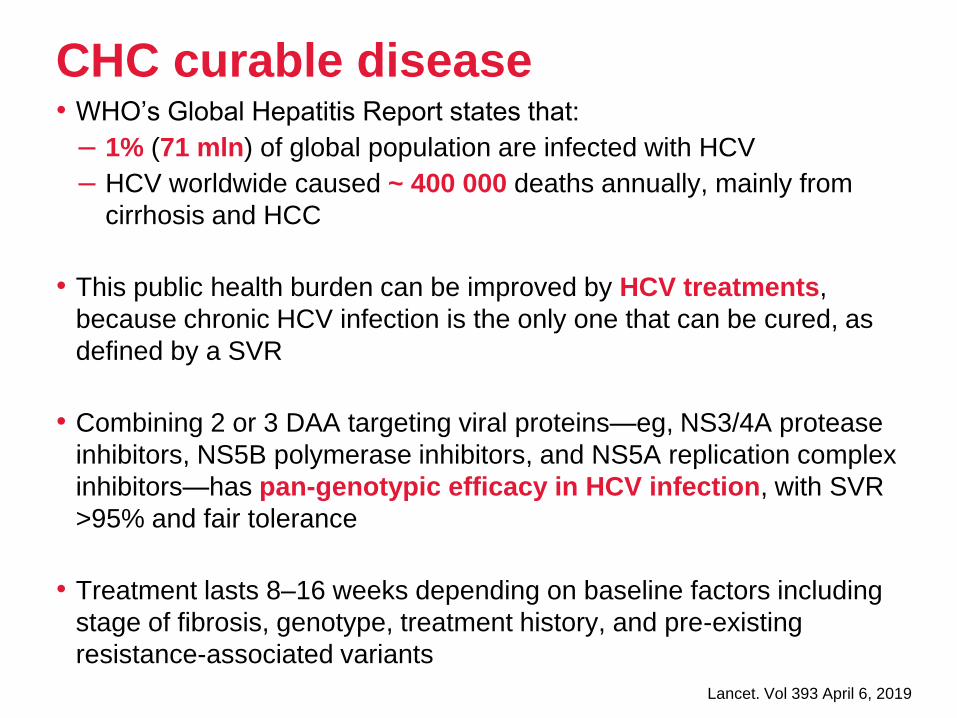
• WHO’s Global Hepatitis Report states that:
– 1% (71 mln) of global population are infected with HCV
– HCV worldwide caused ~ 400 000 deaths annually, mainly from
cirrhosis and HCC
• This public health burden can be improved by HCV treatments,
because chronic HCV infection is the only one that can be cured, as
defined by a SVR
• Combining 2 or 3 DAA targeting viral proteins—eg, NS3/4A protease
inhibitors, NS5B polymerase inhibitors, and NS5A replication complex
inhibitors—has pan-genotypic efficacy in HCV infection, with SVR
>95% and fair tolerance
• Treatment lasts 8–16 weeks depending on baseline factors including
stage of fibrosis, genotype, treatment history, and pre-existing
resistance-associated variants
CHC curable disease
Lancet. Vol 393 April 6, 2019
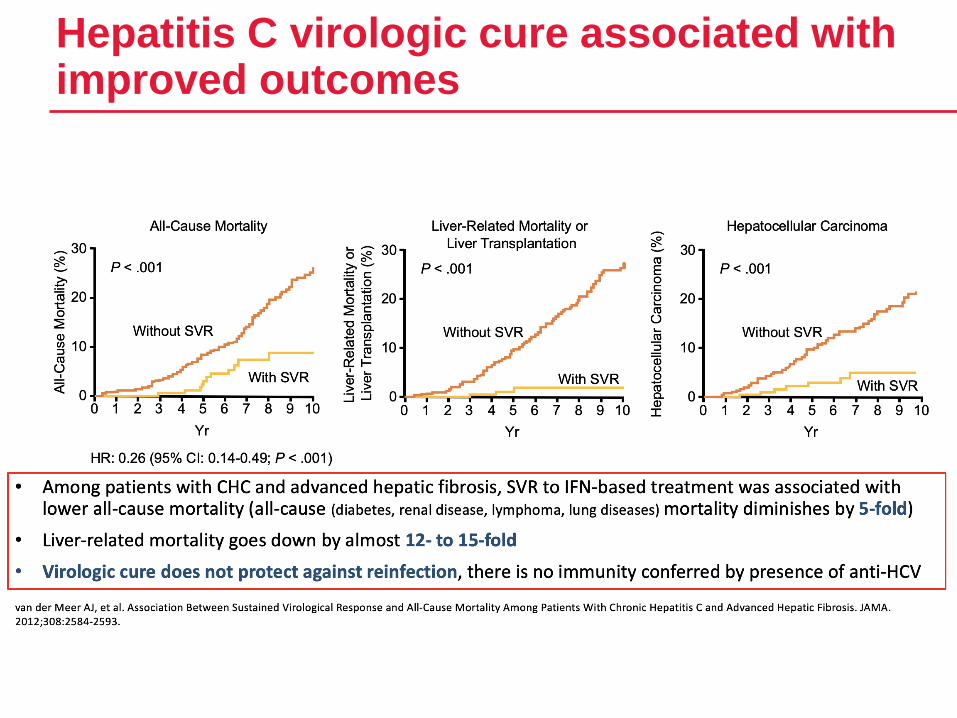
Hepatitis C virologic cure associated with improved outcomes

SVR in patients with CHC associated with a lower all-cause mortality rate
Berenguer J, et al. J Acquir Immune Defic Syndr 2014; 66:280–287.
Fre
e-S
urv
iva
l (%
)
100
95
90
15
10
5
0
85
0 12 24 36 48 60 72 84 96
Follow-Up (Months)
SV
RNo
SVR
P = 0.01
0
695 HIV/HCV co-infected patients (64% infected with HCV GT1 or GT4) with
F0–F2 fibrosis treated with IFN/RBV were followed for a median of 4.9 years
All-cause mortality
Risk of overall mortality
was significantly lower
in patients achieving SVR
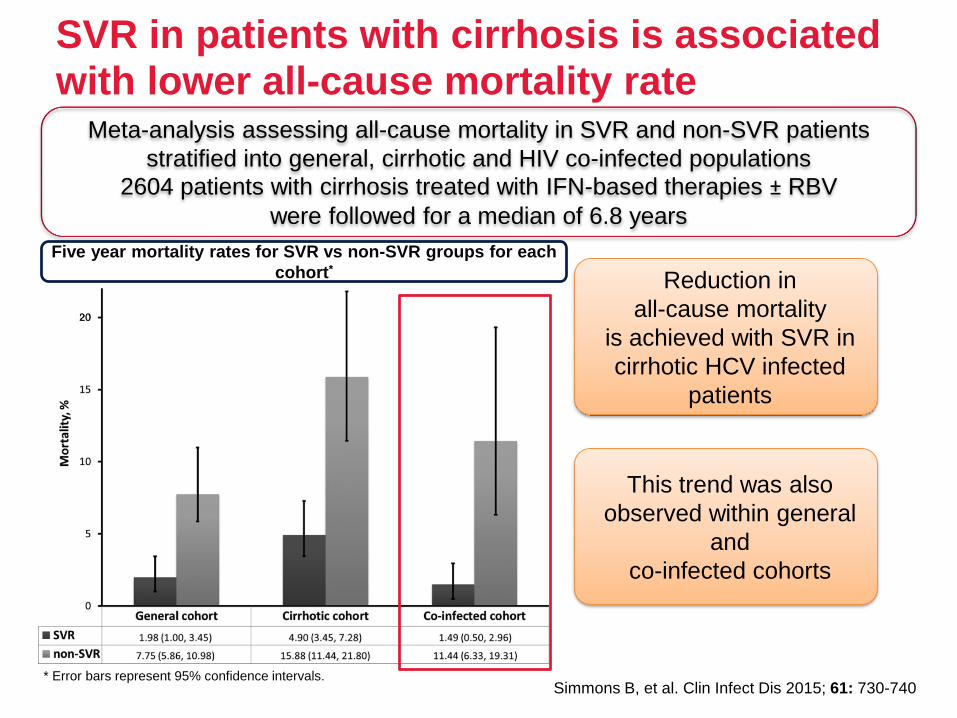
SVR in patients with cirrhosis is associated with lower all-cause mortality rate
Simmons B, et al. Clin Infect Dis 2015; 61: 730-740* Error bars represent 95% confidence intervals.
Five year mortality rates for SVR vs non-SVR groups for each
cohort*
Meta-analysis assessing all-cause mortality in SVR and non-SVR patients
stratified into general, cirrhotic and HIV co-infected populations
2604 patients with cirrhosis treated with IFN-based therapies ± RBV
were followed for a median of 6.8 years
Reduction in
all-cause mortality
is achieved with SVR in
cirrhotic HCV infected
patients
This trend was also
observed within general
and
co-infected cohorts
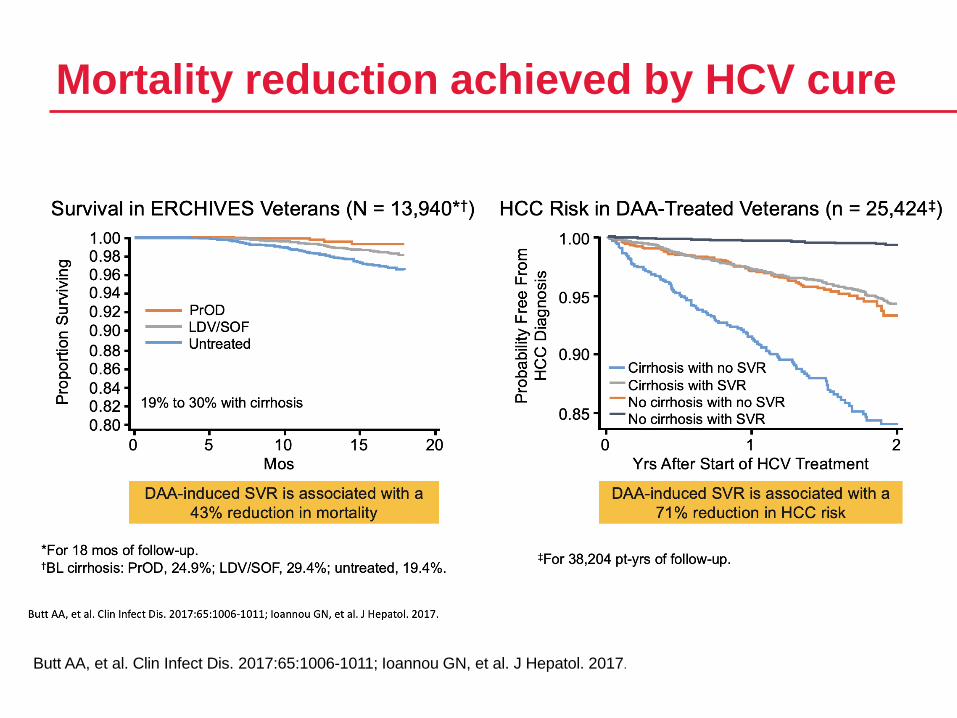
Mortality reduction achieved by HCV cure
Butt AA, et al. Clin Infect Dis. 2017:65:1006-1011; Ioannou GN, et al. J Hepatol. 2017.
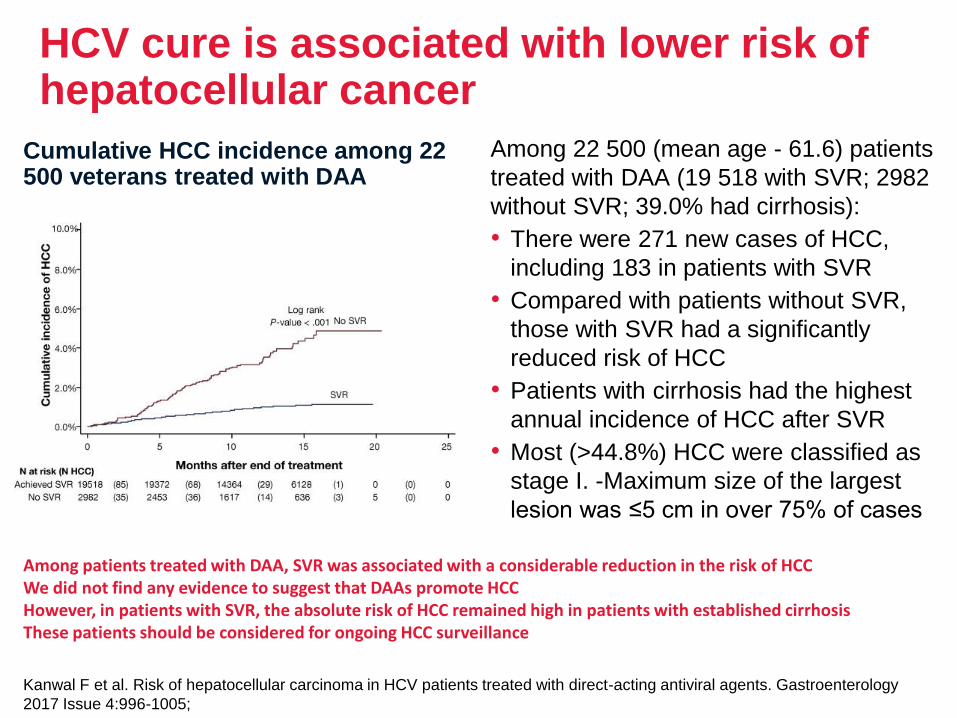
HCV cure is associated with lower risk of hepatocellular cancer
Among 22 500 (mean age - 61.6) patients
treated with DAA (19 518 with SVR; 2982
without SVR; 39.0% had cirrhosis):
• There were 271 new cases of HCC,
including 183 in patients with SVR
• Compared with patients without SVR,
those with SVR had a significantly
reduced risk of HCC
• Patients with cirrhosis had the highest
annual incidence of HCC after SVR
• Most (>44.8%) HCC were classified as
stage I. -Maximum size of the largest
lesion was ≤5 cm in over 75% of cases
Cumulative HCC incidence among 22 500 veterans treated with DAA
Kanwal F et al. Risk of hepatocellular carcinoma in HCV patients treated with direct-acting antiviral agents. Gastroenterology
2017 Issue 4:996-1005;
Among patients treated with DAA, SVR was associated with a considerable reduction in the risk of HCCWe did not find any evidence to suggest that DAAs promote HCCHowever, in patients with SVR, the absolute risk of HCC remained high in patients with established cirrhosisThese patients should be considered for ongoing HCC surveillance
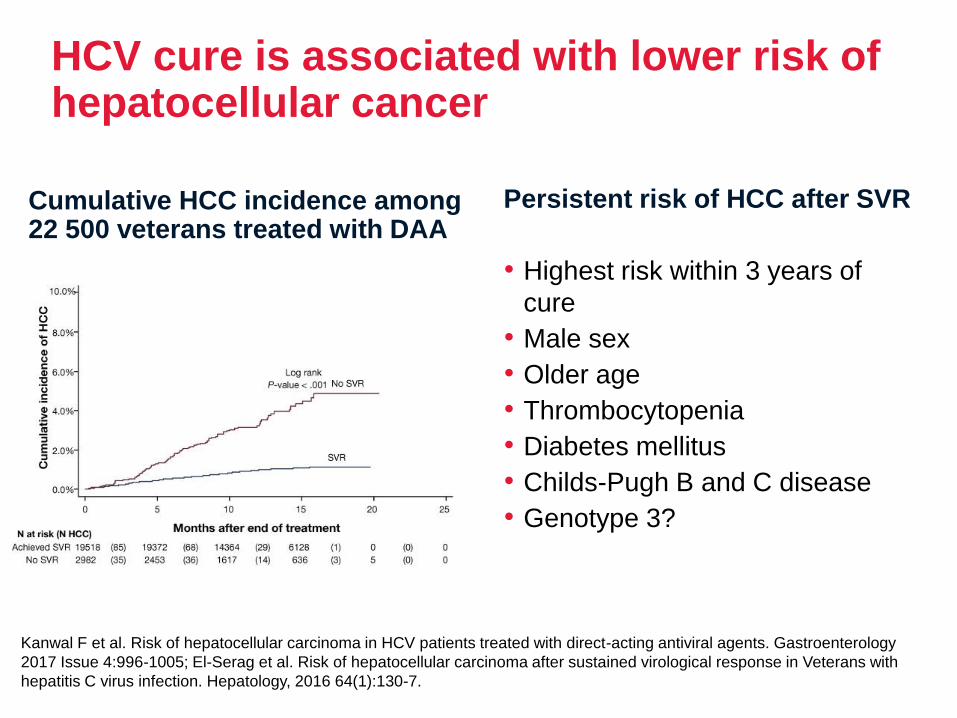
HCV cure is associated with lower risk of hepatocellular cancer
Persistent risk of HCC after SVR
• Highest risk within 3 years of
cure
• Male sex
• Older age
• Thrombocytopenia
• Diabetes mellitus
• Childs-Pugh B and C disease
• Genotype 3?
Cumulative HCC incidence among 22 500 veterans treated with DAA
Kanwal F et al. Risk of hepatocellular carcinoma in HCV patients treated with direct-acting antiviral agents. Gastroenterology
2017 Issue 4:996-1005; El-Serag et al. Risk of hepatocellular carcinoma after sustained virological response in Veterans with
hepatitis C virus infection. Hepatology, 2016 64(1):130-7.
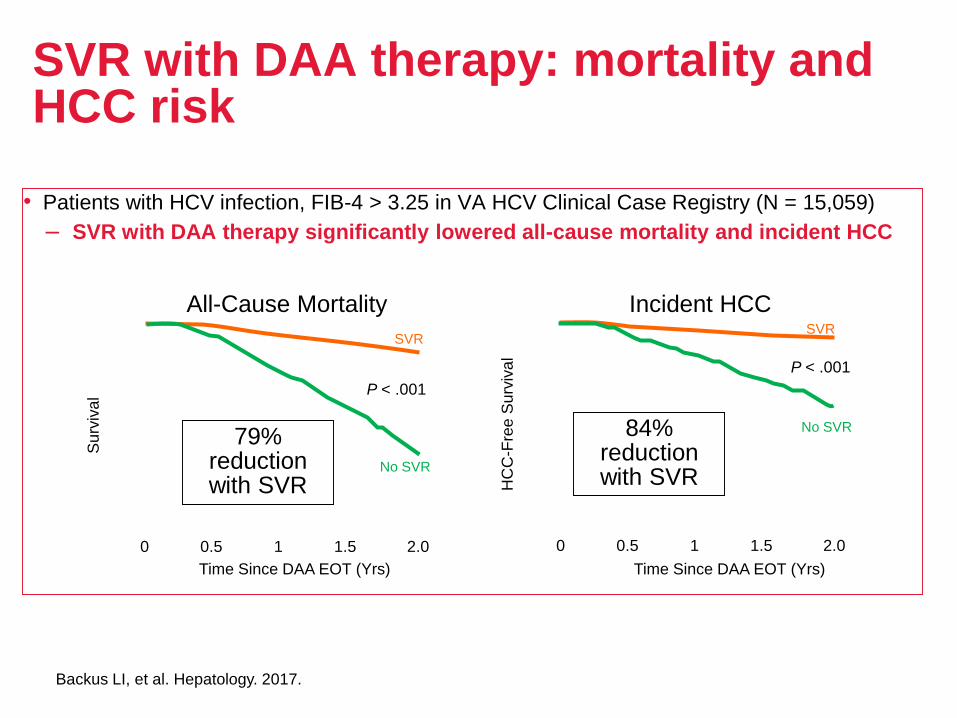
SVR with DAA therapy: mortality and HCC risk
• Patients with HCV infection, FIB-4 > 3.25 in VA HCV Clinical Case Registry (N = 15,059)
– SVR with DAA therapy significantly lowered all-cause mortality and incident HCC
All-Cause Mortality
Su
rviv
al
No SVR
Time Since DAA EOT (Yrs)
SVR
P < .001
Incident HCC
HC
C-F
ree
Su
rviv
al
No SVR
SVR
P < .001
Time Since DAA EOT (Yrs)
79% reduction with SVR
84% reduction with SVR
0 1 2.01.50.5 0 1 2.01.50.5
Backus LI, et al. Hepatology. 2017.
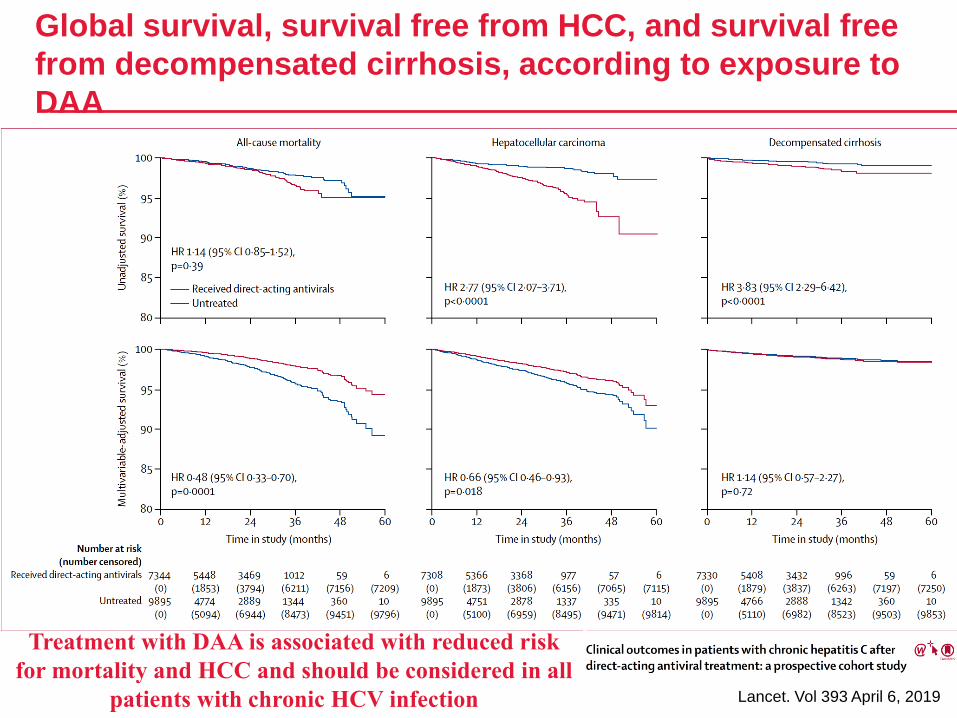
Global survival, survival free from HCC, and survival free
from decompensated cirrhosis, according to exposure to
DAA
Lancet. Vol 393 April 6, 2019
Treatment with DAA is associated with reduced risk
for mortality and HCC and should be considered in all
patients with chronic HCV infection
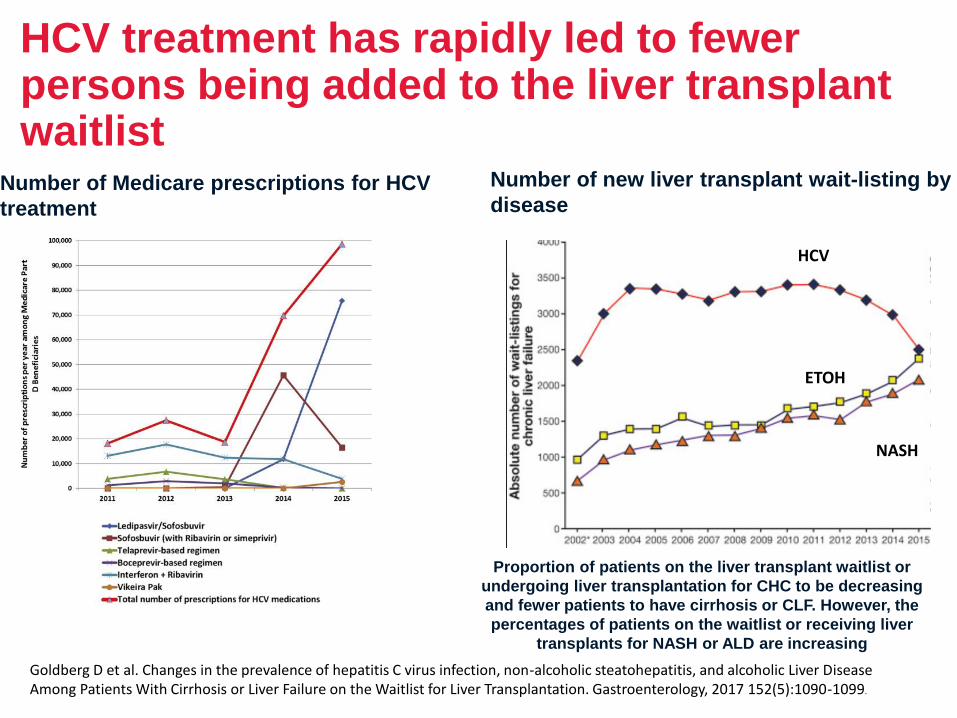
HCV treatment has rapidly led to fewer persons being added to the liver transplant waitlist
Number of Medicare prescriptions for HCV
treatment
Number of new liver transplant wait-listing by
disease
Goldberg D et al. Changes in the prevalence of hepatitis C virus infection, non-alcoholic steatohepatitis, and alcoholic Liver Disease Among Patients With Cirrhosis or Liver Failure on the Waitlist for Liver Transplantation. Gastroenterology, 2017 152(5):1090-1099.
HCV
ETOH
NASH
Proportion of patients on the liver transplant waitlist or
undergoing liver transplantation for CHC to be decreasing
and fewer patients to have cirrhosis or CLF. However, the
percentages of patients on the waitlist or receiving liver
transplants for NASH or ALD are increasing
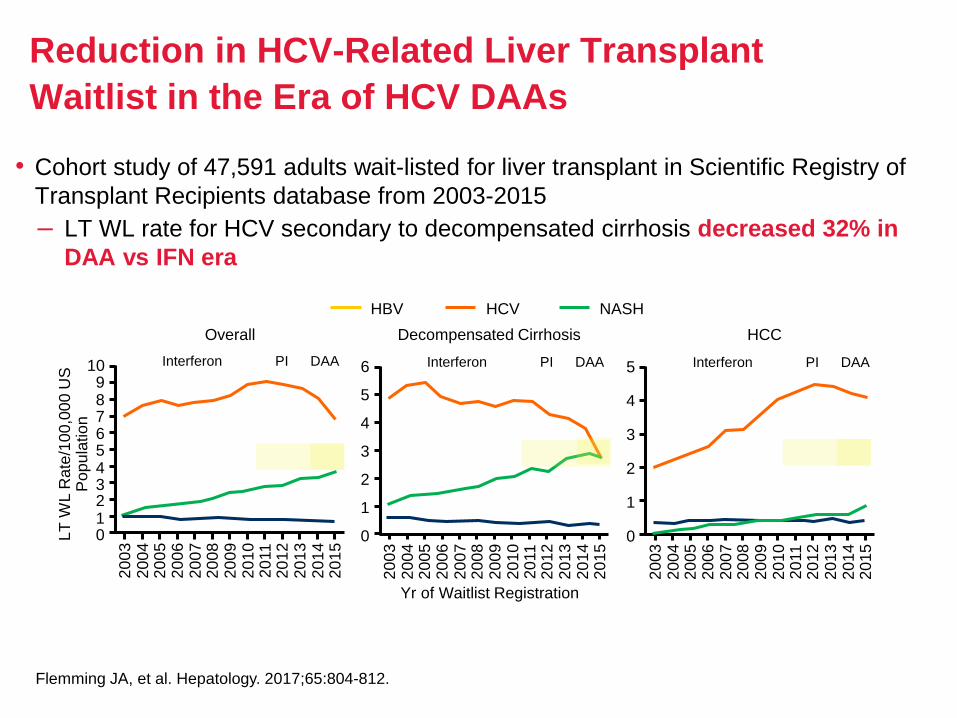
Reduction in HCV-Related Liver Transplant
Waitlist in the Era of HCV DAAs
• Cohort study of 47,591 adults wait-listed for liver transplant in Scientific Registry of
Transplant Recipients database from 2003-2015
– LT WL rate for HCV secondary to decompensated cirrhosis decreased 32% in
DAA vs IFN era
Overall Decompensated Cirrhosis HCC
Yr of Waitlist Registration
LT
WL R
ate
/10
0,0
00 U
S
Po
pu
latio
n
Flemming JA, et al. Hepatology. 2017;65:804-812.
HBV HCV NASH
109876543210
20
03
20
04
20
05
20
06
20
07
20
08
20
09
20
10
20
11
20
12
20
13
20
14
20
15
Interferon PI DAA 6
5
4
3
2
1
0
20
03
20
04
20
05
20
06
20
07
20
08
20
09
20
10
20
11
20
12
20
13
20
14
20
15
Interferon PI DAA 5
4
3
2
1
0
20
03
20
04
20
05
20
06
20
07
20
08
20
09
20
10
20
11
20
12
20
13
20
14
20
15
Interferon PI DAA
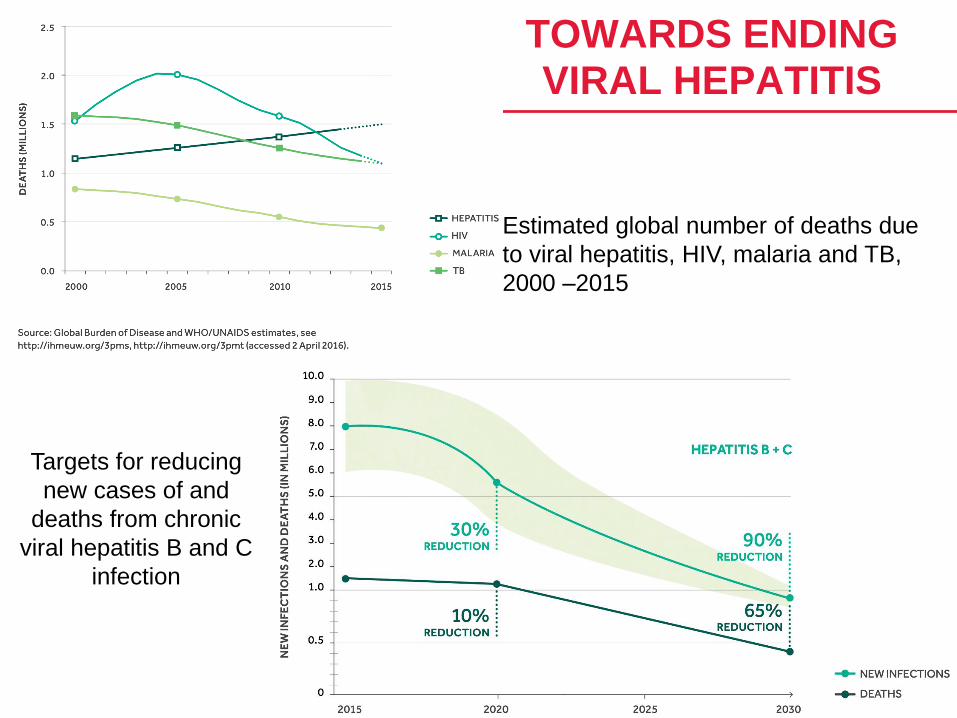
Targets for reducing
new cases of and
deaths from chronic
viral hepatitis B and C
infection
Estimated global number of deaths due
to viral hepatitis, HIV, malaria and TB,
2000 –2015
TOWARDS ENDING VIRAL HEPATITIS
Recommended