University of South FloridaScholar Commons
Graduate Theses and Dissertations Graduate School
January 2013
Hispanic Acculturation and Social MediaEngagement: A Uses and Gratifications PerspectiveRoland Rahe MassaUniversity of South Florida, [email protected]
Follow this and additional works at: http://scholarcommons.usf.edu/etd
Part of the Mass Communication Commons
This Thesis is brought to you for free and open access by the Graduate School at Scholar Commons. It has been accepted for inclusion in GraduateTheses and Dissertations by an authorized administrator of Scholar Commons. For more information, please contact [email protected].
Scholar Commons CitationMassa, Roland Rahe, "Hispanic Acculturation and Social Media Engagement: A Uses and Gratifications Perspective" (2013). GraduateTheses and Dissertations.http://scholarcommons.usf.edu/etd/4537

Hispanic Acculturation and Social Media Engagement:
A Uses and Gratifications Perspective
by
Roland Massa
A thesis submitted in partial fulfillment
of the requirements for the degree of
Master of Arts
Department of Mass Communications
College of Arts and Sciences
University of South Florida
Major Professor: Kelly Page Werder, Ph.D.
Scott Liu, Ph.D.
Kelli Burns, Ph.D.
Date of Approval:
March 27, 2013
Keywords: Hispanics, Culture, Twitter, Survey, Spanish
Copyright © 2013, Roland Massa

i
TABLE OF CONTENTS
List of Tables ...................................................................................................................... ii
List of Figures .................................................................................................................... iv
Abstract ................................................................................................................................v
Chapter 1: Introduction ........................................................................................................1
Chapter 2: Literature Review ...............................................................................................5
Origin of Uses and Gratifications Theory ................................................................5
Evolution of Uses and Gratifications Theory ........................................................11
Technology and Uses and Gratifications Theory...................................................13
The Uses and Gratifications of Social Media ........................................................18
Uses and Gratifications in Demography ................................................................21
Acculturation..........................................................................................................22
Purpose of Study ....................................................................................................34
Chapter 3: Methodology ....................................................................................................36
Data Collection ......................................................................................................36
Variables ................................................................................................................40
Pretest .....................................................................................................................44
Data Analysis .........................................................................................................44
Chapter 4: Results ..............................................................................................................47
Sample Descriptives...............................................................................................47
Data Analysis Related to Research Questions .......................................................54
Chapter 5: Discussion ........................................................................................................60
Research Question 1 ..............................................................................................60
Research Question 2 ..............................................................................................61
Research Question 3 ..............................................................................................63
Research Question 4 ..............................................................................................63
Research Questions 5 and 6 ...................................................................................68
Conclusion .............................................................................................................71
References Cited ................................................................................................................75
Appendices .........................................................................................................................82
Appendix A: IRB Approval Letter ........................................................................83
Appendix B: Survey Instrument ............................................................................84
Appendix C: Online Questionnaire ........................................................................90

ii
LIST OF TABLES
Table 1: Frequency of Education Level among Hispanic-American Sample ....................48
Table 2: Frequency of Generation among Hispanic-American Sample ............................48
Table 3: Items Measuring Acculturation Factor of Cultural Heritage ...............................49
Table 4: Items Measuring Acculturation Factor of Ethnic Interaction ..............................49
Table 5: Items Measuring Acculturation Factor of Language Use ....................................49
Table 6: Items Measuring Acculturation Factor of Ethnic Identity ...................................50
Table 7: Frequency of Visitation to Social Media Sites ....................................................50
Table 8: Frequency of Online Activity Performance .........................................................51
Table 9: Rotated Factor Matrix ..........................................................................................53
Table 10: Composite Mean Scores for Acculturation Factors ...........................................53
Table 11: Significance of Education Level upon Social Media Engagement ...................54
Table 12: Significance of Generation upon Social Media Engagement ............................54
Table 13: One Way ANOVA – Language Use Based on Generation ...............................55
Table 14: Post Hoc Test – Language Use Based on Generation .......................................55
Table 15: One Way ANOVA – Ethnic Identity Based on Generation ..............................56
Table 16: Post Hoc Test – Ethnic Identity Based on Generation ......................................56
Table 17: One Way ANOVA – Cultural Heritage Based on Generation ..........................56
Table 18: Post Hoc Test – Cultural Heritage Based on Generation ..................................57
Table 19: One Way ANOVA – Ethnic Interaction Based on Generation .........................57
Table 20: Post Hoc Test – Ethnic Interaction Based on Generation..................................57

iii
Table 21: Acculturation Factors and Social Media Engagement Correlations ..................58
Table 22: Correlations Including Generation and Education Level ..................................59

iv
LIST OF FIGURES
Figure 1: Psychological Motivations Matrix .....................................................................11

v
ABSTRACT
Uses and gratifications theory posits that media use is an intentional and selective
process by individuals in order to satisfy emotional needs. Basis this theory, the author
conducted an exploratory study to compare social media engagement with four factors of
acculturation among Hispanic Americans. These variables were also compared to the
variables of education level and generation in order to test for a relationship. An online
questionnaire captured data from a sample of Hispanic American participants (N = 85).
Correlation analysis was performed, and results indicated that generation had a
significant relationship with social media engagement and three out of four of the factors
of acculturation.
1
CHAPTER 1: INTRODUCTION
Hispanics represent the fastest growing segment of the American population over
the last decade. In 2010, Hispanics accounted for 16% of the American population at 50.5
million people. By comparison, this same population was 35.3 million people ten years
earlier. This represents a 43% growth rate in the Hispanic population over the last decade.
The Hispanic demographic also represented over half of the nation’s population growth
from the year 2000 to the year 2010. Hispanic adults aged 18 and over constituted 14.2%
of the American population in 2010, as compared to 12.2% of African-Americans and
4.7% of Asians (Passel, Cohn & Lopez, 2011).
The rapid explosion in the Hispanic population is forecasted to continue. By the
year 2050, the Hispanic demographic is estimated to comprise 29% of the U.S.
population. This will represent almost one-third of all Americans and a 214% increase in
the size of this population group. Conversely, the non-Hispanic white population will
decrease from 67% today to an estimated 47% in 2050 (Passel & Cohn, 2008).
In previous years, population growth among Hispanics was attributed to
immigration. Recently that trend is in decline, with Hispanic immigration being
surpassed by Asians (Yen, 2012). According to Yen, the increase in the Hispanic
population is due to higher birth rates among immigrants already settled in the United
States. Acculturation of the Hispanic demographic is occurring, as well as among other
population groups of foreign origin. Acculturation is the process of “cultural modification

2
of an individual, group, or people by adapting to or borrowing traits from another
culture” (Merriam-Webster’s).
There is little dispute among academics that mass media is a highly influential
and powerful tool in the acculturation process, and many have studied its effects upon
creation of knowledge about American culture (Albarran & Umphrey, 1993; Chaffee,
Nass, & Yang, 1991; Greenberg, 1986; Kim, 1977; Messaris & Woo, 1991; Tan, 1988;
Walker, 1999). The media channel upon which many of these studies focus is television.
While television was a relevant media source upon which to focus in previous years, the
rapid introduction and diffusion of social media has presented new opportunities for
communications research.
User statistics illustrate the relevance of social media in the world today.
Facebook recently announced that it has surpassed 1 billion active users on its site, based
on monthly traffic (Bilton & Sengupta, 2012). Facebook is far and away the most popular
social media site based on number of subscribers, but it exists in a highly crowded social
media environment. Other popular sites such as YouTube (4 billion daily views),
Google+ (400 million users), and Twitter (140 million users) also compete for attention,
among dozens of others with varying degrees of success. Hispanics specifically account
for a large number of social media users, as described by Carrasquillo (2011):
A recent report by the Pew Internet and American Life Project found that
while online non-Hispanic whites and non-Hispanic blacks use Twitter at
5 percent and 13 percent respectively, 18 percent of Hispanics online are
Twitter users. When it comes to Facebook, it’s more of the same. In all,
54.2 percent of Hispanics online regularly use Facebook, just above non-
Latino blacks at 47.7 percent and non-Latino whites at 43 percent.

3
With the prevalence of Hispanics on social media, the opportunity exists to
explore the relationship between acculturation and social media engagement. One
potential theoretical basis for study of this relationship is Uses and Gratifications Theory.
Uses and Gratifications Theory was postulated by Katz, Haas and Gurevitch
(1973) as a means of explaining what motivations drive human behavior, and how certain
information sources are used to fulfill needs and desires. The underlying premise of the
theory is that humans actively seek and process information that fulfills their needs. If an
information source does not satisfy their needs, they reject that information and seek
alternatives. A historical perspective on Uses and Gratifications Theory is offered in
Chapter 2.
Based on existing literature, the influence of traditional media channels such as
television upon the acculturation process is apparent. However, a gap in the scholarship
exists with regards to the relationship between acculturation and newer communications
technology such as social media. This gap affords the opportunity for current study,
based on Uses and Gratifications Theory, to collect quantifiable data for the purpose of
exploring this topic.
The current study is relevant to the field of strategic communication because it
offers insight into the values and motivations that entice Hispanics to engage in social
media communications. An understanding of these qualities of Hispanics, particularly in
their role as consumers, would benefit corporations who seek an audience with Hispanics
for the purpose of marketing to them via social media. Insight into Hispanic motivations
would allow businesses to more effectively target, attract and maintain a growing

4
Hispanic consumer base. This knowledge served as the impetus for the research to pursue
the current study.
In the following chapter, a historical literature review of Uses and Gratifications
and its compatibility with technology is presented, followed by an introduction and
elaboration upon the concept of acculturation.

5
CHAPTER 2: LITERATURE REVIEW
The following chapter provides an historical overview of Uses and Gratifications
Theory, as well as an in-depth review of acculturation.
Origin of Uses and Gratifications Theory
Uses and gratifications theory (U&G) has evolved over decades of research to
become a widely accepted postulate regarding the motivations that drive human
consumption of media and information. The historical origin of the theory can be traced
back to Herzog (1941), who produced a study of radio listeners and their gratifications
for listening to soap opera broadcasts. In her study Herzog identified three gratifications
which would form the basis for future research: emotional release, imagination, and
adjustment. Emotional release suggested that radio listeners chose to listen in order to
relieve tensions of everyday life and empathize with others who shared their feelings.
Imagination was the ability of listeners to place themselves into the stories and fantasize
about becoming the characters; in other words fantasy became reality for a brief time.
Lastly, adjustment reflected an ideology by which listeners could appraise their
respective situation and make changes to their lives.
Around this same time Maslow (1943) introduced his theory of human
motivation. This theory would later evolve into what is today accepted as Maslow’s
hierarchy of needs; a theory that is rooted in psychology and offers an explanation for the
motivations that allow for human survival and development. The results of the study were

6
later developed into a pyramid, not created by Maslow himself, with the most basic of
human needs at the bottom tier, including breathing, food, and sleep. The pyramid
progresses up through the tiers with the assumption that needs in the lower tier have been
satisfied. As needs at the lower levels are met, humans move up the pyramid to fulfill
their needs in the higher levels. The tiers in sequence from lowest to highest are labeled
physiological, safety, love and belonging, esteem, and self-actualization. At any given
time, humans work to satisfy needs in all five tiers. Since fulfillment of higher tiers is
contingent upon fulfillment of needs in lower tiers, should survival become threatened
then people will focus on fulfillment of their lower tier needs and sacrifice fulfillment of
their needs in the higher tiers.
The basic needs are those which are physiological in nature, and which humans
must fulfill in order to exist. An example Maslow paints of a physiological need is
hunger, which is the most dire and basic of human needs. If this need is not satisfied, the
person will perish. Hunger and other physiological needs therefore take precedence over
all others. Upon achievement of basic needs gratification, the next level of needs is
safety. Maslow establishes the need for safety based on the behaviors of infants whose
emotional and intellectual capacities are not yet developed. Babies understand only very
simple needs; among them the feeling of security. When an infant senses a disturbance in
its safety and comfort, such as pain, they immediately and outwardly express it. Adults
are trained to inhibit these reactions, but this does not mean they do not exist. Humans
never lose their need for security; they just become less reliant upon others to provide it
as they mature. With security gratifications met, the next need is love. This need is
synonymous with affection and the development of human relationships for the purpose

7
of social inclusion. The need for love now begins to transcend the physical gratifications
obtained for basic and safety needs, and moves into the emotional and cognitive realm of
gratifications sought. The need for love is a need for emotional fulfillment, and is
disassociated from sex which is a purely physiological need according to Maslow. The
next need is esteem, which is reflective of a human desire for self-respect and praise from
others. This need satisfies the gratifications of achievement and confidence, as well as
recognition and appreciation by others. Fulfillment of these needs affirms self-esteem and
provides feelings of strength and capability to overcome the challenges one is destined to
encounter throughout life. The final need, once all other needs are satisfied, is that of self-
actualization. This need addresses human potential, and the ability of people to surpass
their current state in order to achieve more and become more than they currently are. This
need can be exemplified through an athlete’s desire to win a championship or for an
employee to gain a promotion at work. Maslow argues that gratification of all five needs
creates a satisfied person, who is content and happy in their life.
The terms uses and gratifications was first penned by are Katz, Haas and
Gurevitch (1973), and these three men are often cited as the brain trust behind the
formation of uses and gratifications theory. This theory was developed as an alternative
to the “hypodermic needle” or “magic bullet” theories of mass communications, which
posited that media audiences were easily influenced and susceptible to assimilate any
message they received without interpretation or cognition (Severin & Tankard, 2001, p.
262). Although the hypodermic needle theory was never attributed to any particular
scholar, it was the overwhelmingly accepted theory of mass communication prior to the
research conducted by these three scholars. Over time the magic bullet theory was

8
shunned in favor of uses and gratifications theory, which gradually chipped away at its
credibility and eventually rendered it obsolete.
Based on Maslow, the authors described three principal needs which media can
fulfill: cognitive, affective and integrative. Cognitive needs fulfill the desire for
information, knowledge and understanding. Affective needs relate to aesthetic or
emotional desires. Integrative needs are a mixture of cognitive and affective, and most
often relate to the desire for credibility, status and self-actualization. These needs were
cross-analyzed with various technological media channels available at the time, such as
newspapers, books, television, and radio. The consideration of technology is an important
variable introduced by the authors, and one which will be discussed in more detail further
on in this study. Among the discoveries made during this research, several stand out. The
first is that individuals indicated a hierarchy of importance related to information
attainment; newspapers were most important, followed by radio, television, and books.
Secondly, affective needs are satisfied by different media types dependent on the specific
need. Self-reflection and discovery are supported by books; entertainment is best served
by television and books, and self-confidence is promoted through newspapers. The study
also briefly touched upon education level as an indicator of media choice; with higher
educated individuals selecting books and newspapers while those of lower education
prefer television. Another minor aspect of the study was related to media selection as a
byproduct of socialization. Television nurtured strong connections with family and
friends, but books and newspapers provided users with the necessary information and
content to establish communications.

9
The following year in 1974, Katz and Gurevitch teamed up with Blumler to
extrapolate upon uses and gratifications theory they had put forth through a historical
narrative of research to date, as well as critique their own work and propose alternatives.
One interesting distinction that authors point out was the lack of theory around
psychological needs associated with uses and gratifications, and calling for more research
into this area. It was fortuitous that around that same time McGuire (1974) offered a
detailed perspective on the association between psychological motivations and
communication gratifications. McGuire raises the issue of what individual psychological
needs are fulfilled through information consumption, and provides an extensive
explanation of sixteen human motivations for media use. These motivations are
categorized as either cognitive or affective; whereby cognitive motives satisfy a need for
information and ideas and affective motives emphasize feelings and emotional states.
Within each of these two frameworks, further distinction is given between current
equilibrium and growth. Current equilibrium is concerned with maintenance of the status
quo and continuity, whereas growth is concerned with development and change. For ease
of reference, these sixteen motivations are illustrated in the psychological motivations
matrix outlined in Figure 1.
What follows is a brief summation of each of the sixteen motivations:
Consistency: Concerned with cohesion to inner experiences and consistency
Attribution: Focus on the external orientation and interpretation of environmental stimuli
Categorization: Concerned with categorical organization of experiences for ease of
reference

10
Objectification: Presents a deficiency in cognitive ability and subsequent reliance on
external cues for formation of attitudes
Autonomy: Depicts a self-realization through development of an independent identity
Stimulation: Emphasizes an external orientation driven by curiosity, novelty and
exploration
Teleological: Analogous to computer coding, and reflects the degree of acuity between
situational perception and pre-defined outcomes
Utilitarian: Demonstrates the ability to solve problems and approach situations with a
desire for expansion of knowledge or skills
Tension-reduction: Seeks escape from arousal and establishment of a Zen-like state
Expressive: Obtaining gratification through self-expression and acts of remembrance
Ego-defensive: Concerned with self-image development and preservation
Reinforcement: Focuses on behavior for attainment of rewards that functioned similarly
in past situations
Assertion: Seeks competition, achievement and success in order to enhance self-esteem
Affiliation: Relates to altruism as a function of seeking affection and acceptance in
relationships
Identification: The acquisition of role identities for self-acceptance and satisfaction
Modeling: Focuses on the human tendency to empathize with others and to model our
behavior on that which is observed

11
Cognitive Affective
Equilibrium Growth Equilibrium Growth A
ctiv
e
Consistency Autonomy Tension-
reduction
Assertion
Attribution Stimulation Expressive Affiliation
Pas
sive Categorization Teleological Ego-defensive Identification
Objectification Utilitarian Reinforcement Modeling
Figure 1: Psychological Motivations Matrix (McGuire, 1974)
Evolution of Uses and Gratifications Theory
Uses and gratifications theory has been replicated in recent years through new
research. Bracken and Lombard (2001) performed a study which copied the methods
employed by Katz et al., and tested for motivations toward media selection among
college students. Subjects were asked to rate the importance of goals, and then asked to
rate the usefulness of various media channels toward achievement of those goals. The
purpose of the study was a comparative analysis among historic media to gauge any
potential shift in the importance of these media in needs fulfillment. Results indicated
that over half of respondents felt that media remains important; however these same
respondents indicated low levels of trust in the media. This suggests that students
perceive a loss of objectivity among media coverage of global events. Consistent with
findings from 1973 study by Katz et al., the current study also discovered a correlation
between need “distance” and media importance. This means that subjects view media as a
tool which facilitates access to events occurring outside their local environment and
sphere of influence. Lastly subjects indicated agreement with the idea of media

12
specialization; a new concept as compared with the original research. This can be
attributed to the fact that media selection is greater today than it was at the time of Katz et
al’s study. Media have become far more segmented and specialized than they were in the
three decades prior to the current study.
Emotions also play a vital role in media use, as explored by Bartsch, Mangold,
Viehoff and Vorderer (2006). Several concepts related to emotional gratifications are
outlined. Mood management reflects behaviors that solicit an increase in positive feelings
and a decrease in negative feelings. Sensation seeking refers to a pattern of risk-taking for
the arousal of heightened emotions. Intrinsic motivation is the conquest of challenges that
contributes to feelings of success and confidence. Modes of reception is a state of
connecting emotional experience with the overcoming of other goals related to those
emotions. Mood adjustment indicates an ability to adapt emotions to a current situation.
Meta-emotion describes the tendency to view specific feelings in a gender-centric
positive or negative light. Downward social comparison refers to the use of media for
self-esteem reinforcement through visualizations of others in worse situations. Seeking an
integrative approach to emotional motivations toward media use, the authors posit a
model to illustrate the process. A media offer is received and immediately analyzed by
the receiver. This analysis stimulates an emotional response which now guides the
receiver’s evaluation process of the offer; placing the offer temporarily aside. These
emotions are now analyzed for three types of gratifications: stimulus, intent, and
symbolism. Stimulus gratification infers whether the emotion raised is pleasant or
dissatisfying. Intentional gratification determines if the emotion is useful for goal
attainment. Symbolic gratification appraises the potential benefits to self-esteem from the

13
emotion. These three gratifications combine to produce meta-emotions, which determine
media selection. The proposal of this research therefore is that receivers focus less on the
external communication itself and more on their internal emotions when making a
decision regarding media use.
Technology and Uses and Gratifications Theory
Technology is an important consideration with regards to uses and gratifications.
Advances in technology have brought about changes in human behavior with regards to
mass communications. As technology evolves, so too must theoretical scholarship to
keep pace with changes in human behaviors associated with communications. One of the
most significant inventions of communication technology in the 20th
century was
television. Its effects upon society and human life were profound, as discussed by
Schramm, Lyle and Parker (1961) in their research regarding the effects of television
upon children. At the time of their study television was still in its infancy, which
presented ideal conditions for the study of television use as a determinant of human
attitudes and behavior. This study was also important for its focus on children as
consumers of media. As explained by the authors, “a child is a young animal learning to
be human” (p. 142). This description paints a vivid picture of children as emotionally
vulnerable creatures, highly susceptible to influence from multiple sources. Some
examples of the needs of a child include a sense of belonging, the opportunity for self-
expression, and a feeling of security in an uncertain world. These needs resemble those
posited by Maslow, suggesting that while these needs are manifested at an early age they
also remain with individuals throughout adulthood. Several variables influence the

14
interaction level between television and children receiving needs gratification from it.
Mental ability refers to a child’s ability to learn, explore, and discern from the
information presented. Social norm implies the degree to which a child has adopted
“middle of the road” cognitions and recognizes television as a reflection of reality. Social
relationships favor healthy, loving relationships with parents and peers to the extent that a
child uses television as a source of entertainment instead of an escape from problems.
Based on these assumptions, it is argued that television is unlikely to provide the same
level of needs gratification as can be obtained through real life and physical relationships.
Television was therefore a medium that received great scrutiny upon its arrival for
its ability to satisfy human needs. As a result, uses and gratifications research fell out of
favor for several years but experienced a revival with the arrival of telecommunications
technology such as cable television and home computing. A strong advocate for uses and
gratifications theory is Ruggiero (2000), who suggests why the theory has added
relevance in the age of computer mediated communication. The author suggests three
characteristics of the Internet which allow it to surpass older forms of media. The first of
these is interactivity. Based upon the concept of the active user, the Internet satisfies three
distinct personality types who use this medium. For those seeking diversion and fun, the
choices available online provide a source of entertainment. Task-oriented users receive a
multitude of information options to satisfy their needs. Expressive users are able to share
and reciprocate information with other users of common interest. The second
characteristic is demassification. This implies that the Internet offers users the ability to
select from an abundance of choices which were previously reserved for an exclusive
few. This feature also allows for customization of online content, so users receive only

15
messages they deem relevant and important. The final characteristic is asynchroneity.
This aspect refers to the ability of Internet users to retrieve information at their leisure, at
a time and location that suits them. Combined these three attributes form a powerful
medium which has once again attracted the attention of uses and gratifications
researchers.
Ruggiero endorses U&G because it is a communications model that is flexible
and adaptable through technological innovation and the passage of time. He suggests that
the focus of inquiry has shifted from the media to the audience, and that new technologies
have freed researchers to study a variety of topics related to uses and gratifications. These
include media dependency, rituals, communication enablement, social education, and role
reinforcement. The foundational core of needs remains the psychological bedrock upon
which the theory is constructed and upon which many other communications theories are
based. Ruggiero states that U&G is not about reaching a definitive conclusion of absolute
certainty. To coin a phrase, uses and gratifications research is about the journey; not the
destination. Ruggiero expresses confidence that the theory is well positioned, based on a
combination of traditional methods as well as developmental models, to address
communications issues going forward.
At the dawn of the 21st century many scholars are reexamining uses and
gratifications theory as it relates to online interaction. Shao (2009) explored the appeal of
user-generated media (UGM), which is media content delivered online that requires
creative effort and is manifested outside of the professional establishment. UGM
according to Shao has three distinct levels of interaction. Consumption is the basic
activity of receiving content without input or feedback from the user. This behavior is

16
typically motivated by the need for information seeking and entertainment. Information
seeking is motivated by the desire to increase awareness and knowledge about self and
the outside world. Entertainment motivations can include diversion, escape from personal
crises, killing time, and emotional release. Of the three uses of UGM, consumption is the
most passive in nature. Participation steps up the level of user engagement through actual
interaction over the internet. Users can immerse themselves into user-to-content
interaction which includes activities such as rating content or sharing with others, and
user-to-user interaction which involves direct contact with other individuals through
forums such as message boards or instant messaging. Participation is synonymous with
the desire for social interaction, which is facilitated through a more informal online
setting. Participation can also lead to the formation of virtual communities, which is
discussed in more detail below. Production is the highest level of UGM engagement as it
involves creating original content and posting it online. This content can take the form of
blogs, photos, or videos. Motivations for production include self-expression for the
purpose of identity and personality presentation, and self-actualization which entails
reflection upon one’s own personality for the purpose of self-efficacy.
Tonteri, Kosonen, Ellonen, and Tarkiainen (2011) carried the exploration of
online engagement further through research on a sense of virtual community (SOVC),
which is defined “as human experience of a community feeling in a virtual environment”
(p. 2216). This concept has five primary motivational attributes: a feeling of membership
with associated community rights and responsibilities, a feeling of community influence,
a feeling of identity and individuality in the community, a feeling of shared social identity
within the community, and a feeling of emotional connection with other community

17
members. SOVC also provides four benefits to its members. Cognitive benefits confer
knowledge and learning. Social integrative benefits establish relationships for the purpose
of inclusion and belonging. Personal integrative benefits contribute to a sense of self-
efficacy and having influence upon the social group. Affective benefits foster pleasure and
enjoyment within the user. Based upon numerous hypotheses, the authors cross
referenced each of these attributes and benefits with two levels of online participation:
reading and posting messages. It was determined that participation by reading messages
was motivated by the desire for cognitive and personal integrative benefits. In other
words, community members read messages for the purpose of gaining knowledge and
improving social status. The act of posting messages, on the other hand, was motivated
by social integrative and personal integrative benefits. This discovery suggests that
community members create online content based on the desire for self-realization and
social interaction.
Another application of uses and gratifications theory to online media was
conducted by Dimmick, Ramirez, Wang, and Lin (2007). Although this study was
concerned with telephone, email, and instant messaging, and not Internet activity, the
communication framework offered by the researchers could be applicable to online
interaction as well. The two variables of network characteristics and gratifications utility
were compared to three communications technologies to explore the relationship among
these variables. Network characteristics include size, intimacy level, and geographic
location. Gratification utility simply refers to the ease by which gratifications are
satisfied. Most notably it was discovered that instant messaging, which is the newest of
the three forms of communication media studied, received the strongest association with

18
the variables of network characteristics and gratification utility. It was also discovered
that network size in particular was a significant determinant of gratification utilities
obtained through the use of communication media. This finding is relevant to this study
because social networks will be similarly explored based upon perceived ability to satisfy
gratifications.
The Uses and Gratifications of Social Media
The latest communications technology to receive attention from scholars is social
media; a new form of online communication which has experienced rapid adoption and
revolutionized how people, as well as organizations, communicate with one another.
There are countless choices available within the social media environment; however the
most prevalent and arguably most popular social media sites are Facebook and Twitter.
Quan-Haase and Young (2010) compared social media use between Facebook and
instant messaging based on U&G theory. In their study the researchers investigated what
needs compelled social media users to interact via Facebook and instant messaging, as
well as what gratifications were obtained by doing so. The specific purpose was to
identify what motivations drive social media use. Disregarding instant messaging for
purposes of this study, insight into Facebook utilization as well as motivations for its use
are practical. Six primary gratifications from Facebook use were defined. Pastime is
related to qualities of entertainment and relaxation, and offers users the opportunity to
escape the daily stresses of life temporarily. Affection encompasses the opportunity to
express friendship and compassion toward others. Fashion relates to appearances of
social popularity and trendiness; or put simply the act of associating with others as a
means of social inclusion and avoidance of solitariness. Sociability describes the
19
willingness to meet new people and overcome social inhibitions. Sharing problems
relates to the ability among users to share concerns with others and solicit empathy.
Finally social information concerns acquisition of knowledge about friends and peers in
order to feel involved in the lives of social acquaintances. Through surveys and
qualitative interviews it was determined that sociability served as the highest gratification
users obtained from interaction through social media. These findings reinforce the idea
that social media use is driven by the need to engage with others, while simultaneously
forging a sense of community among its members.
Building off the concept of sociability, Chen (2011) also explored social media
use and its effect upon human connectedness based on uses and gratifications theory. The
central social media component analyzed in this study was Twitter; a newer entrant to the
social media universe that was founded after Facebook and therefore has received less
scholarly examination. Chen explored the capability of Twitter to satisfy the need for
human connection and the gratifications acquired which motivated users to use the
medium again. The focus of the research was on frequency of social media use and its
effect on feelings of social connectedness. It was hypothesized that active Twitter use
would constitute the strongest factor leading to fulfillment of the gratification to connect
with others. Once again the “active” user terminology was employed and in this case
operationalized as two separate variables; the length of time that had passed since users
had joined Twitter (measured in months) as well as how much time they spent using the
medium (measured in hours per day and days per week). The principal discovery of the
research was that length of time on Twitter since enrollment was more responsible for
gratification of the need for human connection than daily usage time. The caveat to this

20
finding was that actual usage of the medium through sending messages and replying to
others’ tweets were more important to this gratification than simple Twitter presence; i.e.
creation of a profile. Therefore a positive correlation between active Twitter use and
social connectedness gratification was supported.
Muntinga, Moorman and Smit (2011) related social media use to the concept of
consumer behavior, defined as online brand-related activities (COBRAs). Types of
COBRAs were placed into one of three categories based on ascending involvement level
with brand-related online content. The consuming type includes participants with
minimum activity level, such as reading others posts or downloading content from brand
sites. The contributing type is a moderately active participant who comments on others
posts or engages a brand through their social media page. The creating type publishes
original brand content, such as blogs about a certain product or videos, pictures and other
media related to a brand. Based on U&G the authors also propose six motivations for
social media use:
1) Entertainment covers activities related to diversion from responsibility, relaxation
or cultural enjoyment.
2) Integration and social interaction covers behaviors toward affiliation with others,
including family and friends.
3) Personal identity covers gratifications related to self, such as reinforcing values or
gaining recognition from colleagues.
4) Information covers surveillance of events in society for the sake of knowledge
and risk avoidance.

21
5) Remuneration covers engagement for the purpose of gaining future benefit or
reward.
6) Empowerment covers exertion of influence or power over others.
While the focus of this current study is not related to branding, it is evident how
these motivations, as well as three levels of brand-related content, are similar to the three
levels of basic social media engagement as posited by Shao (2009). This similarity will
be explored further in the methodology section of this research.
Uses and Gratifications in Demography
Since the focus of this study concerns Hispanics, it would be remiss not to address
the concept of race as related to online activity. Correa and Jeong (2011) investigated the
relationship between ethnicity and online content creation. The stimulus for this study
was based on historical data which suggested that racial minorities are disadvantaged
when it comes to technological adoption, yet demonstrate higher online participation
rates than the traditional white demographic. The study employed a two-pronged
approach. Survey methodology was used to measure frequency of online engagement
within various ethnicities. Examples of online activities included instant messaging,
posting blogs, Twitter participation, Facebook networking, chat room discussion,
uploading videos or photos, and file sharing. Focus groups were also held with
undergraduate students of various races to obtain elaborative information about
motivations for online engagement. Quantitative data supported the notion that minorities
are more active online than whites. Asians were ranked highest overall in online
participation rates, followed closely by Hispanics in activities such as Twitter and social

22
networking via Facebook. Focus groups revealed several prominent themes regarding
motivation for social network use. Staying connected to family and friends was identified
as a strong motivation, especially for Hispanics who often have family spread out across
various geographic areas. Family is a bedrock of Hispanic social culture, so keeping
those connections intact is of vital importance. Panelists also identified the need to stay
connected with niche community groups reflective of their culture. Relating to others
with similar values or interests was also identified as a strong motivator for online
activity. Other motivations including self-expression and self-promotion were discussed,
but these related prominently to Asians and African-Americans and were of little
importance to Hispanic participants. The combined survey and focus group data suggest
that Hispanics are a highly engaged demographic online with two motivations:
maintaining relationships with family and establishing relationships with others of
common interest.
Acculturation
One of the preeminent scholars on the topic of acculturation is Berry, who cites
acculturation as “phenomena which result when groups of individuals having different
cultures come into continuous first-hand contact with subsequent changes in the original
culture patterns of either or both groups” (Berry, 1997, p. 7). Put another way,
acculturation is the degree to which a foreign demographic adapts to and adopts
behaviors and customs of the culture in which they reside. Immigration leads to cultural
plurality, which is the concept of many cultures coming together to form a new and
diverse society. Within this society a power structure develops based on a combination of

23
economic, political and other factors, with different levels of power categorized into
cultural groups. Berry classifies these cultural groups as dominant and non-dominant (p.
8). The dominant group is presumed to be the group upon whose values and behaviors
cultural norms are established. The non-dominant group typically describes the
immigrant, who faces the ritual of acculturation upon entry into a new society. This
power structure gives rise to terms such as “majority” and “minority” to describe each
social group within the larger society.
There are four acculturation strategies immigrants can employ, according to Berry
(p. 9). Assimilation is when individuals relinquish their native cultural identity in order to
interact with other cultures. Separation is when individuals hold onto their original
culture and eschew contact with others. Integration is the process whereby individuals
seek to maintain their original culture and simultaneously interact with members of the
greater society. Lastly, marginalization is the abandonment of native culture and
avoidance of interaction with others. These four strategies are organized into an
orthogonal model with four quadrants, one for each strategy. The horizontal axis
represents a positive or negative perception of self-identity maintenance, while the
vertical axis represents a positive or negative perception of societal relationships
maintenance. The method of acculturation is not always freely chosen by the immigrant
however. Some dominant group societies are inherently diverse and open to new cultures.
In such countries immigrants may employ the integration or separation modes of
acculturation as they choose. Other dominant group societies may be more segregated or
homogenous, thereby forcing immigrants to acculturate through assimilation or
marginalization.

24
Berry indicates that several pre-existing environmental factors also contribute to
the acculturation process (p. 21). These factors include age, education, social status, and
cultural distance. Age has a significant impact upon acculturation. The earlier in life one
begins the acculturation process, the higher the likelihood of a smooth transition. Those
who begin acculturation later in life tend to have a harder time adapting to a new cultural
norm. Education is a typical predictor of acculturation success. This is attributed to
higher capacity for problem solving; an attribute which comes in handy when adapting to
a new culture. Education also correlates to other resources, including occupation and
income, which facilitate acculturation. Finally, education introduces immigrants to the
language, customs and norms of their new cultural surroundings. Social status can be a
challenge to acculturation, since immigrants tend to lose any previously attained status as
a result of entry into a new culture. In a sense, any status achievements from one’s native
culture are rendered neutral and individuals have to “start from scratch” as the saying
goes. Cultural distance refers to the dissimilarities between the two cultures in an
individual’s life. Generally speaking, the greater the distance between the two cultures,
the more difficulty the individual will encounter during the acculturation process. Of
these four environmental factors, the concept of education is an important consideration
for the current study and will be further elaborated upon in the research methodology.
Of the four acculturation strategies posited by Berry, integration is usually the
most successful. This is attributed to the elements of mutual cooperation and
accommodation, involvement across dual cultural communities, and flexibility on the part
of the individual. Another reason for the attributed success of the integration mode of
acculturation is the fact that many societies today are multicultural by definition. There

25
are very few purely homogenous and exclusive societies in existence in the world today,
with the exception of nations ruled by autocratic governments (for example; North
Korea). Since many societies are inclusive to foreign cultures, and therefore integrative in
nature, it stands to reason that integration would be the most successful acculturation
strategy in a society of similar premise.
The principle of acculturation has also been studied from a dimensional
perspective. Ryder, Alden, and Paulhus (2000) examined two competing acculturation
models: the unidimensional model and the bidimensional model. In both models the
relationship between two cultures is examined. Heritage culture is the culture of birth or
upbringing, and mainstream culture is the surrounding cultural environment. The
unidimensional approach places individuals on a continuum where heritage falls on one
end of the spectrum and mainstream falls on the other. The core belief of the
unidimensional model is that movement along the continuum implies a simultaneous
increase in one culture with a decrease in the other. In other words, as an individual
becomes more acculturated into the mainstream culture, they lose behaviors and values
from the heritage culture. An increase in one culture must result in a decrease of the
other, and vice versa. Therefore heritage and mainstream culture are inversely related in
the unidimensional model. The bidimensional model suggests that heritage and
mainstream culture are independent of one another, and that an increase in one culture is
not contingent on a decrease in the other. This phenomenon can occur, but it is not
mutually exclusive. According to the bidimensional model, mainstream and heritage
cultures can both increase or both decrease as well. The bidimensional model closely

26
resembles Berry’s acculturation strategies, with four distinct quadrants and axes
indicating high or low heritage and mainstream culture.
The purpose of study by Ryder et al. (2000) was to compare the unidimensional
model against the bidimensional model to determine which model provided the more
useful conceptualization of acculturation. Three separate studies were performed to
explore the validity of the two models against other variables of interest, including
personality traits, self-identity, psychosocial adjustment, and interpersonal adjustment.
Personality traits included characteristics such as conscientiousness, extraversion, and
neuroticism. Self-identity refers to the dichotomy of individualism (autonomy and
independence) versus collectivism (interconnectivity with others). Psychosocial
adjustment refers to the ability of people to cope with stresses related to acculturation.
Interpersonal adjustment considers the ability of an individual to socialize with others in
a comfortable manner. Across all variables the bidimensional model received greater
support statistically as the more thorough framework for acculturation processes. This
discovery is significant because it lends credibility to the orthogonal model posited by
Berry, whereas acculturation variables of self-identity and social interaction can be
independently measured. The findings of Ryder et al’s study support the idea that
acculturation is not necessarily a process whereby one culture is sacrificed in favor of
another.
Focusing specifically on Hispanics, Cuéllar, Arnold, and Maldonado (1995)
developed the Acculturation Rating Scale for Mexican Americans II (ARSMA), which is
based off a previously published measurement tool of the same name developed years
earlier by Cuéllar and other associates (Cuéllar, Harris & Jasso, 1980). The original

27
ARSMA was linear in scope, similar to the unidimensional model studied by Ryder et al.,
which limited acculturation to falling somewhere along a continuum. In the case of the
original ARSMA, the polar ends of the cultural scale were categorized as either Mexican
or American. This model limited individuals going through the acculturation process to
lean toward either category, but did not allow for multiculturalism. Similar to previous
linear models, the original ARSMA suggested that Mexicans favored either Mexican or
American culture, but could not incorporate both. Therefore Cuéllar et al. developed the
ARSMA II which was based upon the orthogonal model put forth by Berry. In the revised
ARSMA II scale, bicultural Mexicans were now able to be measured independently for
the variables of Mexican and American acculturation. The four quadrants of the ARSMA
II scale resemble the four quadrants of Berry’s scale; however they are labeled differently
to capture acculturation specific to Mexican immigrants. Acculturation can also be
measured linearly along each axis for each culture; however the predominant benefit of
the revised scale is the ability to categorize acculturation within one of the four
quadrants.
The ARSMA II includes questions designed to measure four factors of
acculturation: 1) language use and preference, 2) ethnic identity and classification, 3)
cultural heritage and ethnic behaviors, and 4) ethnic interaction. Within the ARSMA II
instrument are two distinct scales. Scale 1 measures the acculturation modes of
integration and assimilation. Scale 2 measures the acculturation modes of separation and
marginalization. Each scale can be measured and scored independently of the other, or in
conjunction to present a multidimensional aspect of acculturation. The ARSMA II scale

28
will be replicated for the current study to assess factors of acculturation. The reasoning
behind selection of this instrument will be explained in further detail in the methodology.
The ARSMA II was utilized by Cuéllar, Nyberg and Maldonado to explore the
acculturation level among young Mexican-origin college students (1997). Acculturation
was explored with relation to the concept of ethnic identity; a term that encompasses
choices regarding values and beliefs, as well as a respect for one’s past and future goals.
The ethnic identity measure was performed using a different instrument called the
Multigroup Ethnic Identity Measure (MEIM), which is different from the ARSMA in that
it focuses strictly on identity and behavioral factors, and excludes language factors. The
research indicated that ethnic identity diminishes with increased acculturation. This
suggests that as Mexicans become more acclimated to American culture, their Hispanic
values and beliefs are minimized or possibly eliminated entirely. It was also proposed by
the researchers that highly acculturated individuals sense greater openness and affiliation
with people from ethnic groups outside their own. While ethnic identity is not a focus of
the current study, it is interesting to note the inverse relationship that exists between this
concept and acculturation.
Education, as previously referenced by Berry (1995), is an important component
of the acculturation process. Recent data shows that more Hispanics are enrolling and
graduating from college than at any previous time in American history. Perez-Peña
(2012) states, “46 percent of Hispanics were enrolled in college last year, up from 37
percent in 2008,” while Fox News Latino reports, “just over 14 percent of … Latinos had
a bachelors degree in 2011, compared with 11.1 percent in 2001” (2012). As Hispanic

29
education levels rise, members of this demographic should become more acculturated
through higher accommodation and familiarity with American cultural norms.
Education was the focus of an acculturation study by Roche, Ghazarian, and
Fernandez-Esquer (2012). These researchers examined how cultural orientations
impacted educational attainment by Mexican-origin immigrant children in the United
States. While not overtly stated, the assumption is that a majority of Hispanic immigrants
in America originate from Mexico due to its geographical proximity to the United States
as opposed to other Spanish speaking countries. Traditionally children of Hispanic
immigrants suffer in terms of education due to their parents’ poor education level or
family values which place emphasis on work above education, or a combination of these
attributes. Either way, acculturation proves difficult for Hispanic children brought up in
these conditions. The authors discovered that a combination of proficiency in English and
high family placement on family correlated positively with educational attainment among
Hispanic youth. Ironically, socialization of youths’ parents with U.S. born individuals
had a negative effect on educational attainment. This was theorized to be attributed to
lack of social ties and values necessary for development of cultural identity, which
benefited youth educational success. Another obstacle to educational attainment was the
value youth placed on work for income. As noted earlier, lack of family education may
impose cultural dissonance with regards to children achieving education. When work
with immediate short-term financial benefit to family arises, children may feel compelled
to sacrifice education that would provide long-term benefits. For purposes of the current
study, it was important to note that educational achievement excelled in youth who

30
received a balance of Hispanic heritage in the home and American cultural values in
school. Therefore the principle that education contributes to acculturation is suggested.
Another factor highly salient to the acculturation process is media choice. One
particular study by Moon and Park investigated the effects of mass media upon Korean
immigrants’ acculturation process (2007). The study by Moon and Park sought to
determine if Korean immigrants used television and other media to establish bicultural
norms (consistent with Berry’s integration acculturation mode), or if they would favor
one culture over another (consistent with the assimilation or separation modes of
acculturation). Results of the study indicated that Koreans did develop positive
associations toward American culture as a result of media consumption, which influenced
their behaviors, beliefs, and values. However, the study did not support the concept of
biculturalism among the Korean community. One caveat of the study, and a possible
explanation for this discovery, is that the Korean population is small in comparison to
other nationalities. There is not an abundance of media choices available in the Korean
language in the United States, and those that are available are greatly overshadowed by
American media. This lies in sharp contrast to Hispanic media, which caters to a much
larger percentage of the population and features nationwide media channels such as
Univision and Telemundo (Allen, 2012).
Lee (1993) studied acculturation with regard to Taiwanese immigrants and
susceptibility to American advertising. Immigrants typically fall into two categories of
acculturation: accommodation and ethnic affirmation. Accommodation occurs when
individuals move away from their culture of origin and embrace behaviors and values
consistent with their surrounding culture. Ethnic affirmation is the opposite response;

31
individuals shun their adopted culture and maintain cultural behaviors and attitudes from
their native homeland. This is similar to the unidimensional model of acculturation
studied by Ryder et al. (2000), where accommodation and ethnic affirmation lay on
opposite ends of the continuum. Accommodation lies toward mainstream culture, and
ethnic affirmation lies toward heritage culture. Immigrants undergoing the acculturation
process also tend to trust advertising as an information source about their adopted culture,
despite the inherent consumer-directed messaging. This is due to the fact that advertising
presents value statements and symbolic representations of the American way of life.
Lee’s research indicates that acculturating individuals possess more favorable attitudes
toward advertising than resident Americans. Whereas Americans develop negative
attitudes toward advertising due to a media-saturated environment, immigrants are
unaccustomed to this phenomenon and are more tolerant of advertising messages.
Acculturating Taiwanese view advertising as simply another information source about
American culture; similar to a newspaper or television program. Television is a trusted
source of information for immigrants going through the acculturation process, and they
perceive the images on television as representative of the cultural norms of their adopted
homeland.
Stilling (1997) investigated the relationship between television viewing and
acculturation level among Hispanic viewers. The study was divided into three phases.
Phase 1 tested the correlation between acculturation and three measures of television
viewing: absolute total television exposure (overall number of hours of television
viewing), total exposure to English-language television (content-specific television
viewing hours), and a proportional measure of content-specific exposure to the total

32
number of hours spent watching television. These three measures were hypothesized to
have a positive correlation with acculturation level, which was measured based on
Cuéllar et al’s 1980 ARSMA scale. Of the three measures, proportional television
viewing was found to have the strongest correlation with acculturation. This suggests that
immigrants who spent the majority of their television viewing time watching English
content experience higher acculturation levels. Phase 2 of the research introduced the
mediating variables of information seeking motivation and perceived reality as they
related to English-language television viewing. Put another way, the researcher
hypothesized that the effect of television exposure on acculturation would increase as
immigrants increasingly used English-language television for information gathering and
forming perceptions of reality. Results indicated that information seeking motivation for
television viewing was slightly stronger than forming perceptions of reality, although
both correlated positively. This suggests that immigrants use television primarily for
information gathering about their new cultural surroundings, and secondarily to develop
perceptions of their new reality. Phase 3 of the study explored the relationship between
duration of residence in a new culture and level of television exposure (low or high). It
was predicted that among immigrants with low television exposure, those whose duration
of residence was longer would experience higher acculturation levels. It was also
predicted that among those immigrants with high television exposure, there would be no
significant difference between short-term and long-term duration towards acculturation
level. The research supported the conclusion that longer duration resulted in higher
acculturation level among the low television exposure group. This makes sense
considering that immigrants who have resided in a foreign culture longer have been

33
exposed to other cultural influences besides television, such as social groups and cultural
activities. The research also discovered that high television exposure surprisingly made
little difference between low and high duration immigrants with regards to acculturation.
This is attributed to the short amount of time that newly arrived immigrants have had to
process the information gathered from television viewing, despite the high frequency.
The overall discovery from Stilling’s study is that acculturation level increases with
higher amount of content-specific television viewing, although duration of residency also
plays a significant role in this relationship.
Media use also contributes to acculturation with regards to linguistic
development. Specifically related to English proficiency among immigrants, Dalisay
(2012) analyzed the association between English language media use and two variables:
English proficiency and favorability towards English use in social interactions. Results of
a survey indicated that immigrants used English language media more frequently than
native language media upon establishment of residency in the United States. The results
also showed that English language media use facilitated higher English proficiency in
immigrants; particularly those who were exposed to English language media prior to
immigration. Findings also demonstrated a preference among immigrants to use English
in daily social interactions with use of English language media post-immigration.
Increases in English language media use correlated positively with English language
ability. This study demonstrates that media not only helps immigrants acclimate to
American behaviors and values; it also provides a practical tool for immigrants to
become proficient in a new language.

34
Purpose of Study
Based on the literature, the influence of traditional media channels such as
television upon the acculturation process is apparent. However, a gap in the scholarship
exists with regards to the relationship between acculturation and newer communications
technology such as social media. This gap affords the opportunity for current study,
based on uses and gratifications theory, to collect quantifiable data for the purpose of
exploring this topic.
For purposes of this study, acculturation was measured based upon the four
factors of acculturation posited by Cuéllar et al (1995) in the ARSMA II scale: 1)
language use and preference, 2) ethnic identity and classification, 3) cultural heritage and
ethnic behaviors, and 4) ethnic interaction. Citing the lack of previously identified
research, each of these factors of acculturation were studied against the concept of social
media engagement to determine if a relationship exists, and if so to what degree each
acculturation factor correlates to social media engagement. The variable of social media
engagement (SME) will also provide insight into motivations and needs fulfilled, based
upon research by Shao (2009) and Muntinga et al. (2011).
This leads to the following research questions:
RQ1: Are there significant differences in social media engagement among Hispanic
Americans due to education level?
RQ2: Are there significant differences in social media engagement among Hispanic
Americans due to generation?
RQ3: Are there significant differences in four acculturation factors among Hispanic
Americans due to education?

35
RQ4: Are there significant differences in four acculturation factors among Hispanic
Americans due to generation?
RQ5: What relationship exists between acculturation and social media engagement?
RQ6: How do Hispanic Americans use social media to engage with others among the
Hispanic and American populations?
The next chapter provides the methodology used to collect data to inform the
research questions of importance in this study. It includes a review of the data collection
procedure, a brief description of the variables of acculturation and social media
engagement, and an explanation of the data analysis procedure.
36
CHAPTER 3: METHODOLOGY
The purpose of this study is to investigate the relationships between three
indicators of acculturation and social media engagement. The three indicators of
acculturation are education, language proficiency, and generation. Each of these three
indicators will be measured against social media engagement to determine if a
relationship exists, and whether that relationship is positive or negative in nature.
Furthermore, the extent of social media engagement will be categorized based upon the
three levels of UGM as posited by Shao (2009).
Data Collection
An online survey instrument was used to gather data for this study. The purpose
of conducting a survey, which also happens to be one of its advantages, was the ability to
select a representative sample from among the general population.. One of the strongest
arguments in support of survey research is its generalizability. Put simply, the researcher
can form conclusions about a larger population from examination of a sample chosen
from that same population (“Survey Research,” n.d., Strengths). Survey methodology
was also ideal for the nature of this study due to some of its other advantages. The cost of
survey distribution was low, especially online where there is no financial overhead.
Surveys could be administered around the world instantaneously online, allowing for
greater reach and the potential for a larger sample. A larger sample also increased the
opportunity for statistically significant results. Surveys were also standardized, which

37
means that every participant received the exact same research instrument. This increases
survey uniformity and reliability, allowing for survey duplication, while it also minimizes
the possibility for respondent subjectivity and data skewing. Finally, confidentiality was
also increased because online survey respondents were not required to login or present
any identifying information about themselves (“Survey Research,” n.d., Strengths).
The survey was published using SurveyMonkey; a popular online method of
gathering survey data (Leland, 2011). Distribution of the survey was to be accomplished
via the researcher’s Twitter account through snowball sampling. Snowball sampling is a
form of convenience sampling with the intent of recruiting an initial sample group who,
upon completion of the survey, recruit further participants to take the survey.
Historically, this method is used to recruit research participants for studies involving risk
to the subjects; for example illegal drug users who risk arrest should their identity be
revealed. There is no such risk associated with this study, since it is strictly a measure of
benign activities focusing on social media use. Snowball sampling empowers the initial
research subjects perform the work of the researcher via networking within their social
framework, thereby recruiting further survey participants from among their friends,
family, business colleagues, etc. (“Snowball,” n.d., Advantages, para. 7-9).
The motive for selection of the snowball sampling distribution method was based
on two assumptions: the opportunity for a larger sample and respondent confidentiality.
Some of the primary survey participants who were approached over Twitter are Hispanic
social media professionals, including a news director with a major Hispanic media outlet
with over 7,000 followers and the founder of a Latino social advocacy group with over
3,000 followers. Therefore, the researcher presumed to gain high survey response rates

38
because the Twitter followers recruited for this research would not only be asked to
participate in the survey themselves but also encourage their followers to participate;
hence the snowball sampling method alluded to previously. The other consideration for
snowball sampling was confidentiality. Since the majority of respondents were expected
to be recruited through virtual word of mouth online, it would not be possible to tell
which respondents fell within the primary recruitment group and which did not. In
addition, the online survey instrument required no login or other such identifying
characteristics that could be associated to any of the respondents.
The recruitment procedure via Twitter was considered the ideal method of
attracting the most possible survey participants quickly, due to time restraints associated
with the USF academic calendar. Under ideal circumstances, the researcher would have
several months or longer to collect survey responses. In this case however, there was a
very brief time frame of only a few weeks during which the researcher could gather data.
This was another justification for using Twitter for survey distribution. By its very nature,
Twitter is a social network with rapid access and communication capability. It was the
speed aspect of Twitter that the researcher sought to capitalize upon in order to distribute
the survey expediently.
The anticipated effect of snowball sampling failed to manifest a sufficient number
of participants in the opening days after the survey went live, however. Therefore the
researcher adapted the recruiting procedure to initiate more one-on-one direct contact
with potential survey respondents via Twitter. On Twitter, the researcher located
Hispanic social groups with large numbers of followers and began sending tweets on an
39
individual basis to followers of each of those groups. Tweets contained the following
script:
Please take brief survey on #Hispanic social media use for #USF graduate study:
http://svy.mk/VpWMV3 Please RT! Thank you.
The words Hispanic and USF were incorporated with hashtags, which are a
method via Twitter of having tweets be presented in search results when users search for
specific keywords or phrases. In order to create a Twitter hashtag, users simply precede
any desired search term with the # symbol. This creates an active link in the tweet which
can be clicked on to initiate a search. The purpose of these two hashtags was therefore to
make the tweets visible to members of the Hispanic as well as USF communities. The
survey link was created using a bitly, which is shortener for uniform resource locators (or
URLs, which in common jargon means a Web address) for the purpose of including it in
an online post with space limitations. This was done because Twitter restricts tweets to
140 characters, thereby necessitating a shorter URL that could be incorporated within the
tweets and also meet USF research study regulations. Finally, people contacted via
Twitter were asked to RT, which is acronym for “retweet;” a process on Twitter whereby
a user retransmits tweets in their news feed to their followers. The assumption was that
other Twitter users would see the tweet being retransmitted and also participate in the
survey, since the message came from a trusted source. The retweet strategy was
moderately successful from the perspective that many users who were contacted did
retweet the survey link; however it is not known if any survey participants were actually
recruited through this method.

40
Due to the fact that many survey participants were recruited directly via Twitter,
absolute confidentiality was not satisfied (meaning total anonymity was absent).
However due also to the structure of survey instruments created on SurveyMonkey,
whereby no identifying information is requested or captured from participants,
confidentiality was still protected. This is to say that although many participants were
recruited directly via Twitter and their identities were known, there is no way to associate
individual survey responses to those people who participated in the survey. Survey
respondents may be known, but how they answered the survey is not.
Twitter was not used exclusively for recruitment of survey participants. Other
survey respondents were also recruited via the researcher’s professional contacts and
personal network. Several colleagues from the researcher’s employment were asked to
participate in the survey, as well as personal friends. In both cases their identities were
known; however participant responses to the survey remained anonymous because it was
not known how each individual completed the questionnaire.
Variables
There were two variables of interest in this study. The first variable was the
concept of acculturation, which was measured employing a survey framework adapted
from the ARSMA II scale developed by Cuéllar et al (1995) to test for the four factors of
acculturation, as well as the variables of education and generation based upon the same
scholarly framework. Education was a progressive interval ranking of highest completed
education level that included high school, bachelor’s degree, master’s degree, and
doctoral degree. Generation probed whether respondents were first generation immigrants

41
to the United States (born overseas) or descendants of prior generations of immigrants
(born in America). The five categories of generation were defined as follows:
1. First generation = you were born in another country.
2. Second generation = you were born in USA; either parent born in another
country.
3. Third generation = you were born in USA; both parents born in USA and all
grandparents born in another country.
4. Fourth generation = you and your parents were born in USA; at least one
grandparent born in USA.
5. Fifth generation = you, your parents and all grandparents were born in USA.
Age was also presented as an optional open-ended question for respondents to
complete.
The four factors of acculturation reexamined in this study were adapted from
Scale One of the ARSMA II (Cuéllar et al., 1995) framework: 1) language use, 2) ethnic
identity, 3) cultural heritage and 4) ethnic interaction. A series of Likert-type statements
of frequency probed how often respondents performed certain activities related to the
four factors of acculturation. Each item was ranked by subjects on a five-point frequency
scale, with qualifiers of never, rarely, occasionally, frequently, and very frequently.
These four items were used to measure the acculturation factor of language use:
I enjoy English language movies
I enjoy English language TV
I enjoy reading (books, etc.) in English
I write (letters, etc.) in English

42
These three items were used to measure the acculturation factor of ethnic identity:
My mother identifies herself as Hispanic
My father identifies himself as Hispanic
I like to identify myself as Hispanic
These eight items were used to measure the acculturation factor of cultural
heritage:
I enjoy speaking Spanish
My thinking is done in Spanish
I speak Spanish
I enjoy reading (books, etc.) in Spanish
I write (letters, etc.) in Spanish
I enjoy listening to Spanish language music
I enjoy Spanish language movies
I enjoy Spanish language TV
These seven items were used to measure the acculturation factor of ethnic
interaction:
I associate with Americans
My thinking is done in English
I speak English
My friends are now of American origin
My friends while I was growing up were of American origin
I like to identify myself as American
I associate with Hispanic-Americans

43
It is necessary to point out that Cuéllar et al explained that the ARSMA II was
designed and intended for use strictly with the Mexican-American demographic (1995, p.
276). However the authors also mention that the survey could have limited applicability
to other Hispanic populations. In order to capture data about a diverse Hispanic
demographic, the survey items used in this study were modified from the original
ARSMA II to replace the terms “Mexican” or “Mexican-American,” with the term
“Hispanic.” This term conveys a general inclusion of all members of the Hispanic race,
regardless of nationality, which was the goal of the current study. Also, the term “Anglo”
as originally used in the ARSMA II was replaced with “American” so as not to
differentiate between other nationalities that may not fall under the “Anglo” vernacular.
The second variable of interest in this study was social media engagement. The
variable of social media engagement was measured following a framework based on a
combination of the three tiers of UGM interactivity posited by Shao (2009) and the
COBRA categorizations detailed by Muntinga et al (2011). Subjects were evaluated on
their social media engagement level based on questions that measured how often they
participate in certain online activities. These activities were categorized according to
three tiers of social media use: casual, contributory and creative. Casual use is defined as
activities that involve the least amount of effort, such as viewing videos or reading news
stories. Contributive use is defined as activities which involve a greater amount of
interaction but stop short of new ideas, such as sharing content or posting comments.
Creative use requires the highest degree of involvement as it includes activities such as
publishing a blog or managing a personal Web site, which demand innovative thought
and original ideas.

44
Similar to language measurement, each activity was also ranked by subjects on a
five-point frequency scale, with qualifiers of never, rarely, occasionally, frequently, and
very frequently. A higher frequency selected for each activity would be considered a
higher indicator of social media engagement. These activities would also shed light on
the motivations and needs fulfilled through uses and gratifications theory.
Pretest
A pretest of the survey instrument was conducted by the supervising professor on
the researcher’s thesis committee; a faculty member of the School of Mass
Communications at the University of South Florida; prior to distribution to survey
panelists via Twitter. During pretest the professor was asked to consider the following
questions regarding the instrument’s validity:
What did you understand to be the purpose of the survey?
Was the survey designed in a manner that was easy to complete?
Were any questions confusing or misleading?
Please describe any difficulties you encountered in completing the survey.
Please provide any other feedback you wish to share about the survey.
Finding the survey well-organized and without difficulty, the professor authorized
survey distribution to begin.
Data Analysis
To inform the research questions asked in this study, a variety of data analysis
procedures were used. First, frequencies and descriptives were run in order to view

45
individual and cumulative percentages of item responses. Next, the internal consistency
of the multi-item scales used to measure SME and the four factors of acculturation were
examined using Cronbach’s alpha coefficient. Composite measures were created using
items that demonstrated alpha coefficients above .70 (Stacks, 2011). To inform for RQ1
through RQ4, Analysis of Variance (ANOVA) was used. For RQ1, the independent
variable was education level and the dependent variable was SME. For RQ2, the
independent variable was generation and the dependent variable was SME. For RQ3, the
independent variable was education level and the dependent variable was acculturation
factors. For RQ4, the independent variable was generation and the dependent variable
was acculturation factors.
To inform for RQ5, correlation analysis was used. Correlation tests for the
existence of any relationship between previously unrelated variables. The term
“correlation” was first proposed by Sir Francis Galton in 1885 (Rodgers & Nicewander,
1988). Ten years later, Karl Pearson published his formula for the correlation coefficient.
Prior to the work of Galton and Pearson, many researchers sought to establish a causal
relationship; whereby the independent variable was identified as the root cause of
changes in the dependent variable. Correlation focuses not on causality, but on the
strength of relationships. “Today, the correlation coefficient – and its associated
regression equation – constitutes the principal statistical methodology for observational
experiments in many disciplines” (Rodgers & Nicewander, 1998, p. 61). Correlation is
therefore a useful tool for measuring how the value of an independent variable affects the
value of a dependent variable. The results of the correlation analysis will provide better
understanding of the relationships between acculturation factors and social media

46
engagement among Hispanic Americans. In addition, a close examination of the
correlation analysis should reveal information to better understand how Hispanic
Americans use and engage with various types of social media. This analysis will inform
RQ6.
The next chapter summarizes results of the data analysis, including scores
obtained through the various tests, and explains their significance.

47
CHAPTER 4: RESULTS
This chapter summarizes data analysis for the following research questions:
RQ1: Are there significant differences in social media engagement among Hispanic
Americans due to education level?
RQ2: Are there significant differences in social media engagement among Hispanic
Americans due to generation?
RQ3: Are there significant differences in four acculturation factors among Hispanic
Americans due to education?
RQ4: Are there significant differences in four acculturation factors among Hispanic
Americans due to generation?
RQ5: What relationship exists between acculturation and social media engagement?
RQ6: How do Hispanic Americans use social media to engage with others among the
Hispanic and American populations?
Sample Descriptives
Ninety-two (92) individuals participated in the survey. However, seven
participants failed to complete at least half of the questionnaire; therefore they were
omitted from analysis. This resulted in eighty-five (N=85) valid responses for analysis.
This represents a 92.3% response rate among those who initiated the survey and
answered all questions through to completion.

48
The first item on the questionnaire asked respondents to indicate their highest
completed education level. Six respondents completed high school (7.1%), 55 completed
college (64.7%), 18 completed masters degrees (21.2%), and six completed doctoral
degrees (7.1%). These results are shown in Table 1:
Table 1: Frequency of Education Level among Hispanic-American Sample
Measure Frequency Percent Valid Percent Cumulative Percent
High School 6 7.1 7.1 7.1
College 55 64.7 64.7 71.8
Masters 18 21.2 21.2 93.0
Doctorate 6 7.1 7.1 100.0
Total 85 100.0 100.0
The second item on the questionnaire asked respondents to indicate their
generation, based on categories identified by the ARSMA II scale. Thirty-two
respondents indicated they were first generation immigrants (37.6%), 33 respondents
indicated they were second generation (38.8%), nine indicated they were third generation
(10.6%), six indicated they were fourth generation (7.1%), and five indicated they were
fifth generation (5.9%). These results are shown in Table 2:
Table 2: Frequency of Generation among Hispanic-American Sample
Measure Frequency Percent Valid Percent Cumulative Percent
First Generation 32 37.6 37.6 37.6
Second Generation 33 38.8 38.8 76.4
Third Generation 9 10.6 10.6 87.0
Fourth Generation 6 7.1 7.1 94.1
Fifth Generation 5 5.9 5.9 100.0
Total 85 100.0 100.0
The third item on the questionnaire, which was optional, asked respondents to
specify their age. Sixty-three participants responded to this question, with a minimum age
of 20 and a maximum age of 70. The mean age of respondents was 34 years old.

49
The fourth item on the questionnaire asked respondents to indicate their frequency
of performance of items that measured the four factors of acculturation: cultural heritage,
ethnic interaction, language use, and ethnic identity. Eight items were used to measure
the acculturation factor of cultural heritage, and results are shown in Table 3:
Table 3: Items Measuring Acculturation Factor of Cultural Heritage
Item Frequency Mean Standard Deviation
I enjoy speaking Spanish 84 4.1310 1.07300
My thinking is done in Spanish 85 3.2706 1.45887
I speak Spanish 85 3.9176 1.21706
I enjoy reading (books, etc.) in Spanish 85 2.8941 1.42280
I write (letters, etc.) in Spanish 85 2.9176 1.50564
I enjoy listening to Spanish language
music 85 4.2353 .99579
I enjoy Spanish language movies 85 3.3294 1.29457
I enjoy Spanish language TV 85 3.0588 1.28501
Seven items were used to measure the acculturation factor of ethnic interaction,
and results are shown in Table 4:
Table 4: Items Measuring Acculturation Factor of Ethnic Interaction
Item Frequency Mean Standard Deviation
I associate with Americans 85 4.4235 .83633
My thinking is done in English 85 4.3882 .93978
I speak English 85 4.8353 .55307
My friends are now of American origin 85 4.0353 .86530
My friends while I was growing up were
of American origin 83 3.3976 1.39633
I like to identify myself as American 84 3.7024 1.47084
I associate with Hispanic-Americans 85 4.3647 .82875
Four items were used to measure the acculturation factor of language use, and
results are shown in Table 5:
Table 5: Items Measuring Acculturation Factor of Language Use
Item Frequency Mean Standard Deviation
I enjoy English language movies 84 4.5833 .74782
I enjoy English language TV 84 4.4762 .76798
I enjoy reading (books, etc.) in English 85 4.3059 .98831
I write (letters, etc.) in English 84 4.2619 1.03107

50
Three items were used to measure the acculturation factor of ethnic identity, and
results are shown in Table 6:
Table 6: Items Measuring Acculturation Factor of Ethnic Identity
Item Frequency Mean Standard Deviation
My mother identifies herself as Hispanic 83 4.0723 1.54433
My father identifies himself as Hispanic 83 4.1446 1.53124
I like to identify myself as Hispanic 85 4.1765 1.38165
Next, respondents were asked to indicate their frequency of visitation to specific
social media sites. Of the five social media selections offered to participants, Facebook
was the most frequently visited and Pinterest was the least frequently visited. Results are
shown in Table 7:
Table 7: Frequency of Visitation to Social Media Sites
Item Frequency Mean Standard Deviation
Facebook 84 4.5595 .99821
YouTube 83 3.8916 .93720
Twitter 84 4.3095 1.23187
Google+ 84 2.6548 1.47668
Pinterest 82 2.6098 1.44663
Finally, respondents were asked to indicate their frequency of performance of
online activities. The most frequently performed social media activity was reading news
stories, and the least frequently performed activity was participating in chats. Results are
shown in Table 8:

51
Table 8: Frequency of Online Activity Performance
Item Frequency Mean Standard Deviation
Watch videos 85 3.9765 .97561
Read news stories 85 4.5176 .83967
View friends’ posts 85 4.4118 1.00350
Listen to music (not downloading) 85 4.4353 .94424
Look at photos 85 4.3882 .86043
Read a blog 84 3.6310 1.16970
Rate online content 85 2.8941 1.28196
Download music 85 3.0118 1.34070
Comment on posts 85 3.6588 1.21060
Participate in chats 85 2.6118 1.21591
Upload videos or music 85 2.5765 1.31273
Publish a blog 85 2.6588 1.46021
Manage a website 84 2.8929 1.62820
Share photographs 85 3.9176 1.17728
Create original posts 84 3.7857 1.21310
The multi-item scales used to measure social media engagement (SME) and
acculturation were assessed for internal consistency using Cronbach’s alpha. The 20 item
scale for SME yielded an alpha coefficient of .876, indicating a strong internal
consistency. Thus the items were collapsed to create a composite measure, or average, of
SME (N = 79, = 3.6108, St.Dev. = .64513). The dimensionality of the 25 items used to
measure the four acculturation constructs – 1) language use, 2) ethnic identity, 3) cultural
heritage, and 4) ethnic interaction – were assessed using maximum likelihood factor
analysis. First, the factorability of the correlation matrix was assessed. The Kaiser-
Meyer-Olkin measure of sampling adequacy was .817, indicating an adequate sample. In
addition, Bartlett’s Test of Sphericity was significant (p=.000).
Further analysis of the acculturation variables was conducted in two stages,
according to the procedures outlined by Green, Salkind, and Akey (2000). Factor
extraction in stage one was conducted using principal components analysis and a scree
plot. In the first factor analysis test, principal components analysis indicated a six factor

52
solution, based on Eigenvalues above 1.0. However, a priori assumptions suggested a
four factor solution. Therefore, a four-factor solution was forced using the Maximum
Likelihood procedure with Varimax rotation. Three items from the survey (7, 20, and 22)
did not load on any factor, so they were dropped and the analysis was repeated. The
repeated analysis produced four unique factors with clean loadings. The 22 items were
examined for fit with the conceptual definitions of the four aspects of acculturation
identified by Cuéllar, et al (1995). A goodness of fit was determined, and the four factors
were labeled: cultural heritage, ethnic interaction, language use, and ethnic identity.
Finally, the internal consistency of the multi-item scales for the four acculturation factors
was examined using Cronbach’s alpha. The alpha coefficient for all four factors was
high, suggesting strong internal consistency. The rotated factor matrix is shown below in
Table 9. Composite measures of the four factors of acculturation were also created.
Composite mean scores are shown in Table 10.
Tables 9 and 10 are shown below:

53
Table 9: Rotated Factor Matrix
Cultural
Heritage
Ethnic
Interaction
Language
Use
Ethnic
Identity
I enjoy speaking Spanish .901
My thinking is done in Spanish .875
I speak Spanish .871
I enjoy reading (books, etc.) in Spanish .764
I write (letters, etc.) in Spanish .760
I enjoy listening to Spanish language
music .629
I enjoy Spanish language movies .623
I enjoy Spanish language TV .555
I associate with Americans .758
My thinking is done in English .684
I speak English .680
My friends are now of American origin .672
My friends while I was growing up were
of American origin .563
I like to identify myself as American .445
I associate with Hispanic-Americans .425
I enjoy English language movies .847
I enjoy English language TV .840
I enjoy reading (books, etc.) in English .744
I write (letters, etc.) in English .533
My mother identifies herself as Hispanic .923
My father identifies himself as Hispanic .757
I like to identify myself as Hispanic .728
Eigen Values 6.230 5.064 1.934 1.628
Cronbach’s Alpha Coefficient .914 .795 .852 .884 Extraction Method: Maximum Likelihood
Rotation Method: Varimax with Kaiser Normalization
Rotation converged in 6 iterations.
Table 10: Composite Mean Scores for Acculturation Factors
N Minimum Maximum Mean Std. Deviation
Language Use 82 1.00 5.00 4.4085 .74795
Ethnic Identity 83 1.00 5.00 4.1245 1.34317
Cultural Heritage 84 1.00 5.00 3.4524 1.01678
Ethnic Interaction 82 1.00 5.00 4.1585 .69189

54
Data Analysis Related to Research Questions
RQ1 and RQ2
Research questions 1 and 2 were designed to test the relationship between the
dependent variable of social media engagement (SME) and the independent variables of
education level and generation, respectively. The first research question explored whether
SME was influenced as a result of education level. The results of one-way ANOVA
indicated no significant differences in SME due to education level, F(3, 78) = 1.565, p =
.205. Post hoc tests were then performed upon each group within education level. Results
indicate a statistically significant difference in SME between college graduates ( =
3.7010, St.Dev. = .55523) and those with doctoral degrees ( = 3.1417, St.Dev. = 87374).
This result is shown in Table 11.
Table 11: Significance of Education Level upon Social Media Engagement
Education Level 1 Education Level 2 Mean Difference Significance
College Doctorate .55929 .046
The second research question explored whether SME was influenced by
generation. The results of one-way ANOVA indicated no significant differences in SME
due to generation, F(4, 78) = 1.23, p = .306.. However, post hoc analysis revealed a
statistically significant difference in SME between second and third generation
Hispanics. Specifically, second generation Hispanics ( = 3.7677, St.Dev. = .60863)
reported higher overall SME than third generation Hispanics ( = 3.2438, St.Dev. =
.69253). This result is shown in Table 12.
Table 12: Significance of Generation upon Social Media Engagement
Generation 1 Generation 2 Mean Difference Significance
Second generation Third generation .52399 .043

55
RQ3 and RQ4
Research questions 3 and 4 examined differences in acculturation among Hispanic
Americans due to education level and generation, respectively. A series of ANOVA tests
indicated no significant differences in the four factors of acculturation due to education.
The acculturation factors were language use, F(3, 81) = .528, p = .664; ethnic identity,
F(3, 82) = 1.239, p = .301; cultural heritage, F(3, 83) = .472, p = .703; and ethnic
interaction, F(3, 81) = .427, p = .735.
However, ANOVA tests did indicate significant differences in acculturation
factors due to generation. The acculturation factor of language use, F(4, 81) = 2.662, p =
.039 indicated that second generation Hispanics ( = 4.6515, St.Dev. = .38497) had
higher language use than third generation Hispanics ( = 3.7857, St.Dev. = .97285).
These results are shown in Tables 13 and 14.
Table 13: One Way ANOVA – Language Use Based on Generation
N Mean Std. Deviation Std. Error
First Generation 31 4.3871 .87283 .15676
Second Generation 33 4.6515 .38497 .06701
Third Generation 7 3.7857 .97285 .36770
Fourth Generation 6 4.1667 .99582 .40654
Fifth Generation 5 4.1000 .62750 .28062
Total 82 4.4085 .74795 .08260
Table 14: Post Hoc Test – Language Use Based on Generation
Generation 1 Generation 2 Mean Difference Significance
Third Generation Second Generation -.86580 .005
The acculturation factor of ethnic identity, F(4, 82) = 4.622, p = .002 indicated
that fifth generation Hispanics ( = 1.8333, St.Dev. = 1.10554) had lower ethnic identity
than all of the other generations. Fourth generation ( = 3.9444, St.Dev. = 1.06284), third
generation ( = 3.5556, St.Dev. = 1.92931), second generation ( = 4.4545, St.Dev. =

56
1.00284), and first generation ( = 4.2688, St.Dev. = 1.26906) all showed more
significant relationships to ethnic identity. These results are shown in Tables 15 and 16.
Table 15: One Way ANOVA – Ethnic Identity Based on Generation
N Mean Std. Deviation Std. Error
First Generation 31 4.2688 1.26906 .22793
Second Generation 33 4.4545 1.00284 .17457
Third Generation 9 3.5556 1.92931 .64310
Fourth Generation 6 3.9444 1.06284 .43390
Fifth Generation 4 1.8333 1.10554 .55277
Total 83 4.1245 1.34317 .14743
Table 16: Post Hoc Test – Ethnic Identity Based on Generation
Generation 1 Generation 2 Mean Difference Significance
Fifth Generation
First Generation -2.43548 .000
Second Generation -2.62121 .000
Third Generation -1.72222 .023
Fourth Generation -2.11111 .010
The acculturation factor of cultural heritage, F(4, 83) = 5.045, p = .001 indicated
that first generation Hispanics ( = 3.9609, St.Dev. = .95748) had higher cultural heritage
than all other generations. Second generation ( = 3.3594, St.Dev. = .90460), third
generation ( = 2.7917, St. Dev. = .64952), fourth generation ( = 2.8542, St.Dev. =
1.11640), and fifth generation ( = 2.7000, St.Dev. = 1.11313) all showed less significant
relationships to cultural heritage. These results are shown in Tables 17 and 18.
Table 17: One Way ANOVA – Cultural Heritage Based on Generation
N Mean Std. Deviation Std. Error
First Generation 32 3.9609 .95748 .16926
Second Generation 32 3.3594 .90460 .15991
Third Generation 9 2.7917 .64952 .21651
Fourth Generation 6 2.8542 1.11640 .45577
Fifth Generation 5 2.7000 1.11313 .49781
Total 84 3.4524 1.01678 .11094
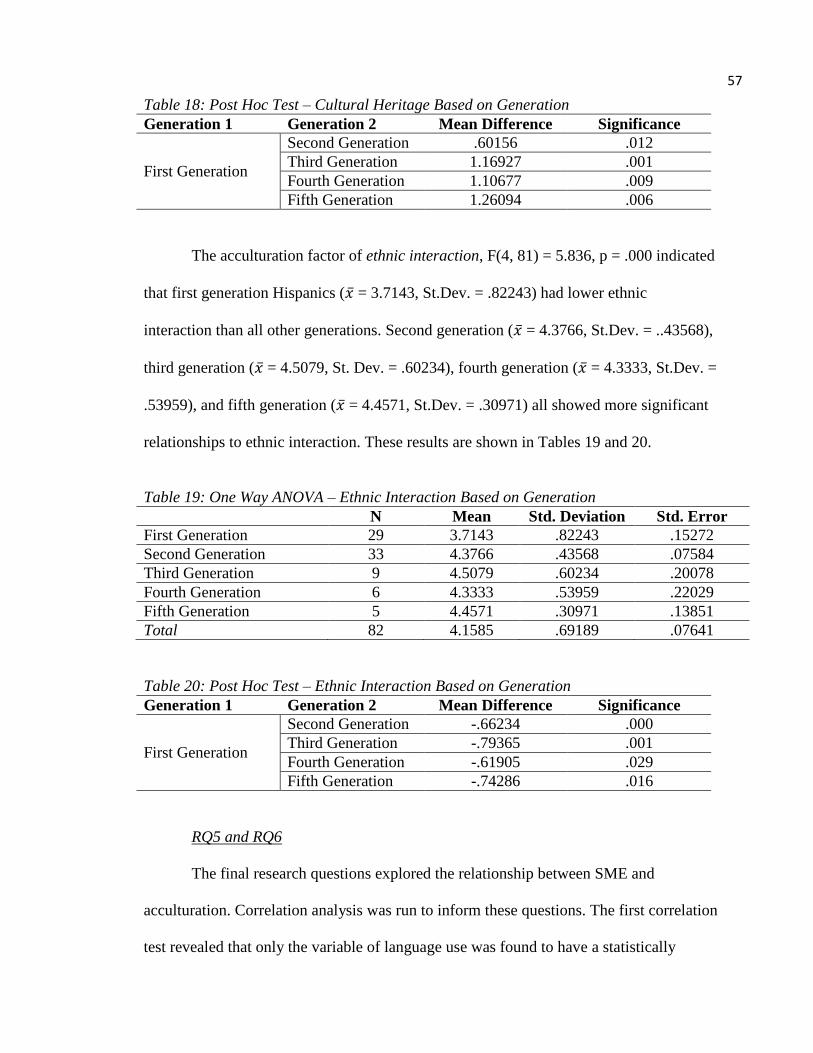
57
Table 18: Post Hoc Test – Cultural Heritage Based on Generation
Generation 1 Generation 2 Mean Difference Significance
First Generation
Second Generation .60156 .012
Third Generation 1.16927 .001
Fourth Generation 1.10677 .009
Fifth Generation 1.26094 .006
The acculturation factor of ethnic interaction, F(4, 81) = 5.836, p = .000 indicated
that first generation Hispanics ( = 3.7143, St.Dev. = .82243) had lower ethnic
interaction than all other generations. Second generation ( = 4.3766, St.Dev. = ..43568),
third generation ( = 4.5079, St. Dev. = .60234), fourth generation ( = 4.3333, St.Dev. =
.53959), and fifth generation ( = 4.4571, St.Dev. = .30971) all showed more significant
relationships to ethnic interaction. These results are shown in Tables 19 and 20.
Table 19: One Way ANOVA – Ethnic Interaction Based on Generation
N Mean Std. Deviation Std. Error
First Generation 29 3.7143 .82243 .15272
Second Generation 33 4.3766 .43568 .07584
Third Generation 9 4.5079 .60234 .20078
Fourth Generation 6 4.3333 .53959 .22029
Fifth Generation 5 4.4571 .30971 .13851
Total 82 4.1585 .69189 .07641
Table 20: Post Hoc Test – Ethnic Interaction Based on Generation
Generation 1 Generation 2 Mean Difference Significance
First Generation
Second Generation -.66234 .000
Third Generation -.79365 .001
Fourth Generation -.61905 .029
Fifth Generation -.74286 .016
RQ5 and RQ6
The final research questions explored the relationship between SME and
acculturation. Correlation analysis was run to inform these questions. The first correlation
test revealed that only the variable of language use was found to have a statistically

58
significant and positive relationship with SME (r = .237, p = .038). Results are shown in
Table 21.
Table 21: Acculturation Factors and Social Media Engagement Correlations
SM
E
Lan
guag
e U
se
Eth
nic
Iden
tity
Cult
ura
l H
erit
age
Eth
nic
Inte
ract
ion
SME
Pearson Correlation 1 .237 .187 .208 .079
Significance (2-tailed) .038 .103 .068 .499
N 79 77 77 78 76
Language Use
Pearson Correlation .237* 1 .261 .222 .483
Significance (2-tailed) .038 .019 .046 .000
N 77 82 80 81 79
Ethnic Identity
Pearson Correlation .187 .261 1 .241 .091
Significance (2-tailed) .103 .019 .029 .419
N 77 80 83 82 81
Cultural Heritage
Pearson Correlation .208 .222 .241 1 -.173
Significance (2-tailed) .068 .046 .029 .123
N 78 81 82 84 81
Ethnic Interaction
Pearson Correlation .079 .483 .091 -.173 1
Significance (2-tailed) .499 .000 .419 .123
N 76 79 81 81 82
*Correlation is significant at the 0.05 level (2-tailed).
A second exploratory correlation analysis added the variables of generation and
education level to test the relationship between these variables with SME and
acculturation factors. The most meaningful relationship was established between
generation and the acculturation factors of ethnic identity, cultural heritage, and ethnic
interaction. These results are shown in Table 22.

59
Table 22: Correlations Including Generation and Education Level
SM
E
Lan
guag
e U
se
Eth
nic
Iden
tity
Cult
ura
l H
erit
age
Eth
nic
Inte
ract
ion
SME
Pearson Correlation 1 .237 .187 .208 .079
Significance (2-tailed) .038 .103 .068 .499
N 79 77 77 78 76
Language Use
Pearson Correlation .237 1 .261 .222 .483
Significance (2-tailed) .038 .019 .046 .000
N 77 82 80 81 79
Ethnic Identity
Pearson Correlation .187 .261 1 .241 .091
Significance (2-tailed) .103 .019 .029 .419
N 77 80 83 82 81
Cultural Heritage
Pearson Correlation .208 .222 .241 1 -.173
Significance (2-tailed) .068 .046 .029 .123
N 78 81 82 84 81
Ethnic Interaction
Pearson Correlation .079 .483 .091 -.173 1
Significance (2-tailed) .499 .000 .419 .123
N 76 79 81 81 82
Generation
Pearson Correlation -.002 -.161 -.323**
-.419**
.352**
Significance (2-tailed) .984 .148 .003 .000 .001
N 79 82 83 84 82
Education Level
Pearson Correlation -.175 -.093 -.119 .127 -.068
Significance (2-tailed) .122 .407 .283 .251 .541
N 79 82 83 84 82
**Correlation is significant at the 0.01 level (2-tailed).
The next chapter presents interpretation and discussion of data results.

60
CHAPTER 5: DISCUSSION
What follows is an interpretation and discussion around the data collected from
those who participated in the survey process.
Research Question 1
Findings indicate no significant difference in social media engagement (SME) due
to education level. However, post hoc evaluation between education levels with regards
to the dependent variable of SME did reveal an interesting discovery. Those with a
college education did display a higher level of SME than counterparts with a doctorate
degree. There are several possible explanations for this. According to Perez-Peña (2012),
more Hispanics are enrolling college than in years past; however there is no specific
mention of graduation rates among this demographic. Also no mention is given to those
Hispanics who progress past the undergraduate level to achieve a Masters or Doctorate
level education. This suggests that many Hispanics are reaching for an undergraduate
college education, but few reach higher. This assumption is supported by the descriptive
education statistics, which indicate that 64% of survey respondents completed college;
whereas only a cumulative 28% went on to achieve Masters or Doctorate degrees.
Therefore, a higher level of SME may exist among college graduates simply because
there are more of them among the Hispanic population.
Another possible explanation for this variance is that social media by its very
nature appeals to the younger members of society. According to research by Pingdom

61
(2012) on social media demographics, just over half (51%) of social media users fall
within the age range of 25 to 44 years of age. This was an overall finding across 24 social
media sites, including Twitter. Specifically related to Twitter, the survey indicated that
55% of Twitter users are over the age of 35; however this is practically an even split with
those under the age of 35. It is presumed that Masters or Doctorate graduates are more
likely to be older, due to the time commitment required to complete these degrees.
Earning a Doctoral degree specifically can be a long process, sometimes lasting up to ten
years (Mason, 2012). Also many who earn Doctorate degrees are likely to enter into
academic employment, where there is simply not enough time to participate in social
media networking due to professional commitments. Mason wrote, “In a survey we
conducted of all doctoral students at the University of California, more than 70 percent of
women and over half of all men said they considered a career at a research university to
be too hard-driving and unfriendly to family life” (2012). These factors may also explain
why college level graduates possess higher SME scores than doctorate level individuals.
Research Question 2
There was no significant difference in SME due to generation considered as a
whole. However, post hoc analysis revealed a significantly higher level of SME for
second generation Hispanics than among those of third generation. This may be
explained due to differences between stages of acculturation. According to Correa and
Jeong (2011), Hispanics were identified as heavy social media users; second only to
Asians. Motivations for social media use among Hispanics included maintenance of
family ties and establishment of relationships with others of similar culture. Second

62
generation Hispanics were born in the United States but either parent was born overseas;
whereas third generation Hispanics and their parents were all born in the United States.
While not explicitly stated, second generation Hispanics may still have their parents
residing in another country, or they may simply live far apart within the United States. In
either case, maintenance of family relationships was previously established as a strong
motivation among Hispanics to engage in social media. Because second generation
Hispanics have parents who were born overseas, their parents may still be undergoing the
acculturation process. As mentioned by Berry (1997), those who begin acculturation later
in life tend to have a more difficult transition into a new cultural environment. Second
generation immigrants would possess more familiarity with cultural norms in America
than their parents would; simply due to lifetime exposure to these norms having been
born and raised in that culture. Contrast that with third generation Hispanics, whose
parents were both born in the United States. For this generation, acculturation has most
likely become even more inherent since American cultural norms were previously
instilled in their parents from birth, and subsequently passed down to the third generation
individual. In a sense, the further down the generational scale an individual resides, the
more diluted the acculturation process becomes. In other words, less acculturation occurs
since prior generations have spent more time and become more assimilated into the
native culture. This suggests a dichotomy with regards to SME. With a lower degree of
acculturation attributed to generation, combined with an emphasis on maintenance of
family relationships, it becomes apparent why second generation Hispanics may score
higher for SME than third generation Hispanics.

63
Research Question 3
No significant difference was evident between acculturation factors and education
level. This is a surprising discovery considering the emphasis that Berry (1997) placed
upon education as an indicator of acculturation success. Berry suggested that education
contributes to variables similar to language use and cultural heritage from current study.
This is attributed to frequent exposure to foreign speech, behaviors and customs which
immigrants receive in an educational setting. Unfortunately, no significant relationship
was discovered through current study to support these assumptions. This presents the
opportunity for more refined future study regarding the relationship between education
and acculturation factors.
Research Question 4
There were several significant relationships discovered between generation and
the four factors of acculturation, each one considered separately. The first acculturation
factor of language use showed significant association with generation. Post hoc tests
specifically revealed that third generation Hispanics ranker higher in language use than
first or second generation Hispanics. This is consistent with findings by Cuéllar et al
(1995) during their introductory study employing the ARSMA II scale. The authors’
results showed that Mexican orientation scores decreased with each passing generation,
while Anglo orientation scores increased. This is similar to what occurred in the current
study, where language use factors (i.e. those factors associated with English use) were
higher among third-generation Hispanics than among first or second-generation
Hispanics. This discovery is logical considering that third-generation Hispanics would

64
have more exposure to language use descriptors, such as English language television and
books, than higher-tiered generations who may receive exposure to these descriptors
infrequently or later in life.
The second acculturation factor of ethnic identity also demonstrated strong
significance with generation. Post hoc tests showed a relationship approaching
significance between second-generation Hispanics and third-generation Hispanics;
although the ANOVA value of .057 registered just shy of the significance value. Two
relationships that did surpass the value for significance were between third and fifth
generation Hispanics, as well as fourth and fifth generation Hispanics. In both cases, the
higher tiered generation (i.e. that with a lower numerical prefix) ranked higher for ethnic
identity than the lower generation. That is to say that third generation Hispanics
demonstrated higher ethnic identity scores than fourth generation Hispanics. Likewise
fourth generation Hispanics scored higher on ethnic identity than fifth generation
Hispanics. This discovery also closely resembles the findings by Cuéllar et al (1995)
regarding orientation along the Mexican-Anglo continuum of the ARSMA II scale,
whereby each passing generation scores lower in Mexican orientation and scores higher
in Anglo orientation. Substituting terms salient to the current study, results of the post
hoc tests suggest a higher degree of ethnic identity among second generation Hispanics
over third generation Hispanics. The same is true between third and fifth generation, as
well as fourth and fifth generation. What is surprising about these findings is that no
significant relationship of ethnic identity was present between first and second generation
Hispanics. Significant scores of ethnic identity among generations did not manifest until
the second generation. It was assumed that a first generation Hispanic would experience

65
the highest levels of ethnic identity, especially when compared to second generation
Hispanics, since that person was born outside the United States and raised with a
different set of linguistic and cultural behaviors. This assumption was formulated basis
prior study by Cuéllar et al (1997), which stated, “a diminishment in one’s sense of ethnic
identity occurs for Mexican Americans with increased acculturation into the Anglo or
mainstream culture” (Cuéllar et al, 1997, p. 545). While not overtly stated, the underlying
implication from this statement is that the acculturation factor of ethnic identity would be
strongest upon initial entry into the dominant culture. This assumption was not supported
by the data.
The third acculturation factor of cultural heritage showed strong significance to
generation. This was shown in post hoc tests to be especially true for first generation
Hispanics, who were born in another country, as compared to all other generations of
Hispanics who were born in the United States. Cultural heritage, as adapted from the
ARSMA II scale by Cuéllar et al (1995), identifies those behaviors which are reflective
of the individual’s native culture of birth. In the case of current study these behaviors
were classified according to participation in activities conducted in Spanish, such as
speaking Spanish and enjoying Spanish language movies or television. The fact that first
generation Hispanics show the highest degree of cultural heritage is consistent with the
unidimensional model of acculturation studied by Ryder et al (2000), which suggests that
Hispanic and American cultures lie on opposite extremes of a continuum. According to
this model, an individual undergoing the acculturation process moves away from their
heritage culture of birth and progresses toward the mainstream culture in their new
surrounding environment. This model implies that at the onset of acculturation, heritage

66
culture is highest; an implication which is supported by post hoc tests. Cultural heritage
behaviors include such statements as “My thinking is done in Spanish” and “I enjoy
Spanish language TV,” among others. The basis of the acculturation factor of cultural
heritage in current study is that the behaviors are indicative of the individual’s native
culture. A first generation Hispanic by definition was born in another country; therefore
their behaviors would be consistent with their culture of origin. Second generation, as
well as subsequent generations, would be more acclimated to American culture and
would therefore score lower on cultural heritage indicators. Put another way, second
through fifth generation Hispanics progressively display higher acculturation tendencies
toward the mainstream culture as their generation level moves into the lower tiers (i.e., a
third generation Hispanic is on a higher tier of the generation scale than a fifth generation
Hispanic). This is evidenced by decreasing recurrence of statistically significant
relationships between the variables of generation and cultural heritage as the generation
level moves down. Stated simply, the native culture of second through fifth generation
Hispanics is the United States.
The final acculturation factor of ethnic interaction also showed strong significance
to generation. Similar to cultural heritage, post hoc tests revealed higher levels for this
acculturation factor among first generation Hispanics as compared to second through fifth
generation Hispanics. This finding is curious from the perspective that it appears to
contradict previous findings regarding cultural heritage. Whereas the acculturation factor
of ethnic interaction is concerned with behaviors associated with the mainstream culture,
the acculturation factor of cultural heritage relates to behaviors synonymous with the
heritage culture. The outward appearance is that first generation Hispanics scored higher

67
for both acculturation factors of ethnic interaction and cultural heritage, which according
to the unidimensional model lie on opposing sides of the acculturation spectrum and
should therefore not be possible. This occurrence is actually possible when based on the
bidimensional model of acculturation, which forms the theoretical framework for the
ARSMA II scale posited by Cuéllar, et al (1995). In the bidimensional model,
mainstream and heritage cultures can either increase or decrease independently of one
another. For example, an increase in behaviors associated with the mainstream culture is
no longer contingent upon a decrease in behaviors associated with the heritage culture.
The benefit of the bidimensional model is that individuals can maintain their native
culture while simultaneously adopting and adapting to the mainstream culture. This is
what has occurred in the current study based upon significance scores among first
generation Hispanics. Post hoc tests for ethnic interaction reveal high significance scores
for first generation Hispanics. This suggests that first generation Hispanics engage in
ethnic interaction behaviors with increased regularity over other generations. These
behaviors include concepts such as “I associate with Americans” and “I speak English,”
among others.
The relevance of strong significance scores among first generation Hispanics for
both acculturation factors of cultural heritage and ethnic interaction suggests that these
immigrants place equal importance on maintenance of native cultural norms, as well as
adoption of new cultural practices associated with their surroundings. This behavior is
consistent with the acculturation strategy of integration posited by Berry (1997), whereby
individuals seek to maintain their original culture and simultaneously interact with

68
members of the greater society. Results of the post hoc tests for cultural heritage and
ethnic interaction support this conclusion.
Research Questions 5 and 6
A significant relationship was discovered between SME and the acculturation
factor of language use, which is associated with mainstream culture activities such as “I
enjoy English language TV” and “I write (letters, etc.) in English.” Based upon the user-
generated media (UGM) framework established by Shao (2009), SME measured a
baseline of social media activity which could be compared to the four acculturation
factors. The relationship between SME and language use was found to be a positive
correlation of moderate strength. A positive correlation between SME and language use
suggests that Hispanics use social media as an information source about the American
mainstream culture. As established by Moon and Park (2007), media is a trusted source
of information used by immigrants to gain knowledge about a new culture. Although that
study focused on Koreans, the implication is not lost on the Hispanic population. It could
be argued that the idea of media use as information source would carry more widespread
applicability, since the Hispanic population in the United States is larger than the Korean
population. This correlation therefore points to the suggestion that Hispanics use social
media in combination with other traditional media forms, such as television and books, in
order to advance the acculturation process. This utilization of social media is consistent
with the social information gratification from the six motivations for social media use
established by Quan-Haase and Young (2010); although this motivation goes beyond
acquisition of knowledge solely about personal acquaintances. Media choices of movies,

69
television, and books serve more than an entertainment purpose; they also educate and
inform Hispanics about American culture.
A separate correlation was run adding the variables of generation and education
level, to compare with SME and the four acculturation factors. No correlations were
discovered between the variables of education level and acculturation factors. However, a
few significant correlations did manifest between the variable of generation and
acculturation factors; specifically ethnic identity, cultural heritage and ethnic interaction.
Generation and ethnic identity were found to have a negative correlation of moderate
strength. Generation and cultural heritage also displayed a negative correlation of
moderate strength. Finally, generation and ethnic interaction showed a positive
correlation of moderate strength.
The negative relationship between generation and the acculturation factors of
ethnic identity and cultural heritage suggests that a Hispanic person’s generation
inversely affects their involvement with native cultural behaviors and attitudes. The data
indicates that as Hispanics progress through generations, their engagement in activities
related to cultural heritage and ethnic identity diminishes. This suggests that a first
generation is more likely than a second generation Hispanic to engage in cultural heritage
behaviors, such as speaking Spanish, as well as ethnic identity behaviors, such as
identifying themselves as Hispanic. Likewise a second generation Hispanic displays these
behaviors more frequently than a third generation Hispanic, and so on. The negative
correlation between generation and the acculturation factors of ethnic identity and
cultural heritage strongly suggests that as Hispanics become more incorporated into

70
American mainstream culture, they relinquish attitudes and behaviors reflective of their
Hispanic heritage culture.
Conversely, generation was found to have a positive correlation of moderate
strength with the acculturation factor of ethnic interaction. The data indicates that as
Hispanics progress through generations, their engagement in activities related to ethnic
interaction increases. This suggests that a second generation Hispanic is more likely than
a first generation Hispanic to engage in ethnic interaction behaviors, such as associating
with Americans and identifying themselves as American. The positive correlation
between generation and the acculturation factor of ethnic interaction strongly suggests
that as Hispanics become more integrated into American mainstream culture, they
embrace behaviors and attitudes consistent with their surrounding environment.
This correlational data lends credibility to the unidimensional model of
acculturation; whereby an increase in mainstream culture simultaneously accompanies a
decrease in heritage culture. This is consistent with research by Ryder et al (2000) and
detracts from the bidimensional model, where mainstream and heritage cultures lie on
distinct axes of an orthogonal grid with four distinct quadrants. Results from the current
study do not support the orthogonal model of acculturation. Instead they suggest that
from one generation to the next, the acculturation factors of cultural heritage and ethnic
identity decrease while ethnic interaction increases. This is consistent with findings by
Cuéllar et al (1997), where the authors discovered “a diminishment in one’s sense of
ethnic identity … with increased acculturation into the mainstream culture” (p. 545). The
current study also calls into question the reliability of the ARSMA II scale of
acculturation; however Cuéllar et al (1995) also point out that “ARSMA II is a …

71
orthogonal acculturation scale that is also capable of generating linear acculturation
scores” (p. 295). The orthogonal model therefore remains reliable; however it was not
supported based on results from current study.
Conclusion
This research was an exploratory study into the relationships between the
variables of Hispanic acculturation and social media engagement. A review of the
literature suggests that prior studies have focused on social media engagement with
regards to basic demographic qualities, such as gender, age, race, etc. However a gap in
the literature was identified with a more specific approach toward the aspect of Hispanic
acculturation and its comparison to social media use. This formed the impetus for this
research.
A few limitations were identified in the current study. The most glaring handicap
to the data collected is the sample size, which is extremely small. Eighty-five (85) survey
participants is a weak representation of the larger Hispanic population. This small sample
size is attributed to the time period restraints under which the researcher was able to
gather data. Data was gathered over a period of only three weeks; this short time frame
was a result of the compact schedule to which the researcher was constrained due to the
academic calendar at University of South Florida. With a longer time period, the
likelihood of recruiting more participants would increase and allow for more data
gathering. The small sample size therefore limits the generalizability of the study results.
The use of Twitter for recruiting participants was extremely time-consuming,
since the anticipated benefit of retweets did not materialize. It was anticipated that

72
retweets would attract more survey participants through word of mouth “snowball”
sampling. The researcher’s tweet soliciting survey participation was retweeted several
times to estimated thousands of people. However no noticeable increase in survey
completion immediately followed these retweets. The researcher was forced to improvise
and approach potential survey participants on an individual basis; sending over 500
tweets to followers of influential Hispanic groups on Twitter. The success (or failure) of
the Twitter distribution strategy, particularly with regards to retweets, cannot be
ascertained with certainty however because participants were not asked to disclose how
they learned of the survey. While this information would have proven valuable, it may
also have presented a violation of participant confidentiality.
One positive quality of Twitter distribution was that participants recruited for the
survey were collected from all across the United States. This was the anticipated benefit
of using Twitter for survey distribution; the ability to reach many people quickly and
independent of geographic limitations. Many users include information on their Twitter
profiles that shows their location of residence. This information is usually limited to city
and state; however it still reveals a basic geographic proximity. While participant location
was not solicited nor recorded in the survey (again for purposes of protecting respondent
confidentiality), the researcher was able to see that respondents were located in various
regions across the United States. Twitter represents the “cutting edge” method of rapid
communication in the Internet age, and it was this characteristic of Twitter that the
researcher anticipated would result in a larger sample population. This did not materialize
however, most likely due to the perception of inconvenience by those individuals
contacted of completing a survey. In addition, the researcher was unknown to those

73
people contacted for participation. Many people approached for survey participation most
likely ignored the tweets due to the nature of receiving communication from a complete
stranger.
Due to primary reliance on Twitter for recruitment of survey participants, results
also do not count for individuals who do not use social media. This is an important
distinction to be made. As the focus of this study was on social media engagement, the
researcher determined that using the very same tool as that which was studied would
prove advantageous. Results do not support this assumption; however this is most likely
attributed again to the small sample gathered and not the method of data collection.
However, what cannot be ignored is that a randomly selected representative sample of
Hispanic Americans was not collected. While many Hispanics are social media users, the
opinions of those who do not use social media were not included in this research. This is
a difficult quandary to balance. On the one hand, recruitment of only those people who
use social media is desirable because they would have familiarity with the tool being
studied and could competently answer the survey instrument. The downfall is that those
who do not use social media are excluded from the sampling population. On the other
hand, going outside of social media for survey recruitment would be a more objective and
random method of sampling. However the opportunity exists to gather less reliable data
since those who do not use social media would not be able to provide any useful data
about the research topic. Future research should aim to replicate the results of this study
using a formal approach with more rigorous random sampling methods.
Alternatives for data gathering could include direct mail or direct recruitment in
person of a Hispanic social club or organization. However, there are cost considerations

74
with these methods of recruitment; both financial and time. The advantage of using
Twitter was also its cost, which is free. It is an inexpensive and rapid method of
information dispersal, which was the allure of using it for survey distribution. More
information regarding the success of Twitter as a survey distribution method is needed;
and should be collected in future research.

75
REFERENCES CITED
[Oct 2012 Update] How Many People Use the Top Social Media? Retrieved from
http://expandedramblings.com/index.php/resource-how-many-people-use-the-top-
social-media/
Acculturation. (n.d.). In Merriam-Webster Dictionary online. Retrieved from
http://www.merriam-webster.com/dictionary/acculturation
Albarran, A. B., & Umphrey, D. (1993). An examination of television motivations and
program preferences by Hispanics, Blacks, and Whites. Journal of Broadcasting
& Electronic Media, 37, 95–103.
Allen, G. (2012). Media Outlets Adapt to Growing Hispanic Audience. Retrieved from
http://www.npr.org/2012/04/03/149845056/media-outlets-adapt-to-growing-
hispanic-audience
Bartsch, A., Mangold, R., Viehoff, R., & Vorderer, P. (2006). Emotional gratifications
during media use – An integrative approach. Communications, 31, 261-278.
Berry, J.W. (1997). Immigration, Acculturation, and Adaptation. Applied Psychology: An
International Review, 46(1), 5-68.
Bilton, N. & Sengupta, S. (2012). A Billion Users Raise Stakes at Facebook for Revenue.
Retrieved from http://bits.blogs.nytimes.com/2012/10/04/facebook-passes-1-
billion-active-users/
Bracken, C. & Lombard, M. (2001). Uses and Gratifications: A Classic Methodology
Revisited. The New Jersey Journal of Communication, 9(1), 103-116.

76
Carrasquillo, A. (2011). How Latinos Will Use Social Media to Change the World.
Retrieved from http://latino.foxnews.com/latino/lifestyle/2011/01/11/latinos-rule-
social-media/
Chaffee, S., Nass, C., & Yang, S. (1991). The bridging role of television in immigrant
political socialization. Human Communication Research, 17, 266–288.
Chen, G.M. (2011). Tweet this: A uses and gratifications perspective on how active
Twitter use gratifies a need to connect with others. Computers in Human
Behavior, 27, 755-762.
Commentary on Survey Research (n.d.). In Colorado State University Writing Guide.
Retrieved from http://writing.colostate.edu/guides/page.cfm?pageid=1421
Correa, T. & Jeong, S.H. (2011). Race and Online Content Creation. Information,
Communication & Society, 14(5), 638-659.
Cuéllar, I., Arnold, B., & Maldonado, R. (1995). Acculturation Rating Scale for Mexican
Americans II: A Revision of the Original ARSMA Scale. Hispanic Journal of
Behavioral Sciences, 17(3), 275-304.
Cuéllar, I., Nyberg, B., & Maldonado, R. (1997). Ethnic Identity and Acculturation in a
Young Adult Mexican-Origin Population. Journal of Community Psychology,
25(6), 535-549.
Dalisay, F. (2012). Media Use and Acculturation of New Immigrants in the United
States. Communication Research Reports, 29(2), 148-160.
Dimmick, J., Ramirez, A., Wang, T., & Lin, S. (2007). ‘Extending society’: The role of
personal networks and gratification-utilities in the use of interactive
communications media. New Media & Society, 9(5), 795-810.

77
Green, S. B., Salkind, N. J., & Akey, T. M. (2000). Using SPSS for Windows: Analyzing
and understanding data (2 ed.). Upper Saddle River, NJ: Prentice Hall.
Greenberg, B. (1986). Minorities and the mass media. In J. Bryant & D. Zillmann (Eds.),
Perception on media effects, 165–188. Hilldale, NJ: Lawrence Erlbaum
Associates.
Herzog, H. (1941). On Borrowed Experience. Studies in Philosophy and Social Science,
11, 65-95.
Katz, E., Blumler, J. G., & Gurevitch, M. (1974). Utilization of mass communication by
the individual. The Uses of Mass Communications: Current Perspectives on
Gratifications Research (19-34). London, England: SAGE.
Katz, E., Haas, H., & Gurevitch, M. (1973). On the Use of the Mass Media for Important
Things. American Sociological Review, 38, 164-181.
Kim, Y. (1977). Communication patterns of foreign immigrants in the process of
acculturation. Human Communication Research, 4, 66–77.
Lee, W. N. (1993). Acculturation and Advertising Communication Strategies: A Cross-
Cultural Study of Chinese and Americans. Psychology and Marketing, 10(5), 381-
397.
Leland, E. (2011). A Few Good Online Survey Tools. Retrieved from
http://www.idealware.org/articles/fgt_online_surveys.php
Maslow, A.H. (1943). A Theory of Human Motivation. Psychological Review, 50(4),
370-396.
Mason, M.A. (2012). The Future of the Ph.D. Retrieved from
http://chronicle.com/article/The-Future-of-the-PhD/131749/

78
McGuire, W. (1974). Psychological Motives and Communication Gratification. The Uses
of Mass Communications: Current Perspectives on Gratifications Research (167-
195). London, England: SAGE.
Messaris, P., & Woo, J. (1991). Image vs. reality in Korean Americans’ response to
mass-mediated depictions of the United States. Critical Studies in Mass
Communication, 8, 74–90.
Moon, S. & Park, C.Y. (2007). Media Effects on Acculturation and Biculturalism: A
Case Study of Korean Immigrants in Los Angeles' Koreatown. Mass
Communication and Society, 10(3), 319-343.
Muntinga, D., Moorman, M., & Smit, E.G. (2011). Introducing COBRAs: Exploring
motivations for brand-related social media use. International Journal of
Advertising, 30(1), 13-46.
Number of Latinos with College Degrees Soars 80 Percent. (2012) Retrieved from
http://latino.foxnews.com/latino/news/2012/02/25/number-latinos-with-college-
degrees-soars-80-percent/
Pérez-Peña, R. (2012). More Hispanics Are in College, Report Finds. Retrieved from
http://www.nytimes.com/2012/08/21/education/hispanics-college-enrollment-
surges-report-finds.html?_r=0
Passel, J. & Cohn, D. (2008). U.S. Population Projections: 2005-2050. Retrieved from
http://www.pewhispanic.org/2008/02/11/us-population-projections-2005-2050/
79
Passel, J., Cohn, D., & Lopez, M. (2011). Hispanics Account for More than Half of
Nation's Growth in Past Decade. Retrieved from:
http://www.pewhispanic.org/2011/03/24/hispanics-account-for-more-than-half-of-
nations-growth-in-past-decade/
Quan-Haase, A. & Young, A. L. (2010). Uses and Gratifications of Social Media: A
Comparison of Facebook and Instant Messaging. Bulletin of Science, Technology
and Society, 30(5), 350-361.
Report: Social network demographics in 2012. Retrieved from:
http://royal.pingdom.com/2012/08/21/report-social-network-demographics-in-
2012/
Roche, K., Ghazarian, S. & Fernandez-Esquer, M.E. (2012). Unpacking Acculturation:
Cultural Orientations and Educational Attainment Among Mexican-Origin Youth.
Journal of Youth Adolescence, 41, 920-931.
Rodgers, J.L. & Nicewander, W.A. (1988). Thirteen Ways to Look at the Correlation
Coefficient. The American Statistician, 42(1), 59-66.
Ruggiero, T. (2000). Uses and Gratifications Theory in the 21st Century. Mass
Communication & Society, 3(1), 3-37.
Ryder, A., Alden, L., & Paulhus, D. (2000). Is Acculturation Unidimensional or
Bidimensional? A Head-to-Head Comparison in the Prediction of Personality,
Self-Identity, and Adjustment. Journal of Personality and Social Psychology,
79(1), 49-65.
Schramm, W., Lyle, J., & Parker, E. (1961). Television in the lives of our children (135-
168). Stanford, CA: Stanford University Press.

80
Severin, W. & Tankard, J. (2001). Communication Theories: Origins, Methods and Uses
in the Mass Media (262-289). Longman, New York, New York.
Shao, G. (2009). Understanding the appeal of user-generated media: a uses and
gratifications perspective. Internet Research, 19(1), 7-25.
Snowball sampling (n.d.). In Laerd Dissertation. Retrieved from
http://dissertation.laerd.com/snowball-sampling.php
Stacks, D. W. (2011). Primer of public relations research, 2nd Ed. NY: The Guilford
Press.
Stilling, E. (1997). The Electronic Melting Pot Hypothesis: The Cultivation of
Acculturation Among Hispanics Through Television Viewing. Howard Journal of
Communication, 8, 77-100.
Tan, A. S. (1988). American TV and social stereotypes of Americans in Thailand.
Journalism Quarterly, 65, 648–654.
Tonteri, L., Kosonen, M., Ellonen, H., & Tarkiainen, A. (2011). Antecedents of an
experienced sense of virtual community. Computers in Human Behavior, 27,
2215-2223.
Walker, D. (1999). The media’s role in immigrant adaptation: How first-year Haitians in
Miami use the media. Journalism & Communication Monographs, 1, 157–196.
What is a Survey? (n.d). Retrieved from
http://www.whatisasurvey.info/chapters/chapter7.htm
81
Yen, H. (2012). Hispanic immigration to US has peaked, Asian immigration is rising.
Retrieved from http://www.csmonitor.com/USA/Latest-News-
Wires/2012/1206/Hispanic-immigration-to-US-has-peaked-Asian-immigration-is-
rising
Yen, H. (2012). Census: White Population Will Lose Majority In U.S. By 2043.
Retrieved from http://www.huffingtonpost.com/2012/12/12/census-hispanics-and-
black-unseat-whites-as-majority-in-united-states-population_n_2286105.html

82
APPENDICES

83
APPENDIX A: IRB APPROVAL LETTER
84
APPENDIX B: SURVEY INSTRUMENT
Informed Consent to Participate in Research
Information to Consider Before Taking Part in this Research Study
You are being asked to take part in a research study. Research studies include only people
who choose to take part. This page is called an informed consent form. Please read this
information carefully and take your time making your decision. The nature of the study,
risks, benefits, and other important information about the study are detailed below.
The title of this research study is called Hispanic Acculturation and Social Media
Engagement. The person in charge of this research study is Roland Massa; a graduate
student at the University of South Florida (USF). This person is called the Principal
Investigator. However, other research staff may be involved and can act on behalf of the
person in charge. Roland is being guided in this research by Dr. Kelly Werder, Ph.D; a
graduate level instructor at USF.
The research will be conducted online via survey instrument administered at
SurveyMonkey.com.
Purpose of the study
The purpose of this study is to explore the relationship between the concept of
acculturation, which is the process of adapting new cultural surroundings, and social
media engagement. You have been selected for this research due to your cultural

85
background. This study is being conducted by a graduate level student for a Masters
Degree thesis project.
Alternatives
You do not have to participate in this research study. If you wish you may exit the survey
now.
Benefits
We are unsure if you will receive any benefits by taking part in this research study.
Risks or Discomfort
This research is considered to be minimal risk. That means that the risks associated with
this study are the same as what you face every day. There are no known additional risks
to those who take part in this study.
Compensation
You will receive no payment or other compensation for taking part in this study.
Privacy and Confidentiality
We will keep your survey responses private and confidential. At no point during this
study will your name or any other identifying information be requested. Certain people
may need to see your survey responses. By law, anyone who looks at your responses
must keep them completely confidential. The only people who will be allowed to see
these responses are the Principal Investigator and a committee of three USF professors.
86
The only others who may review the results of this study are the USF Institutional
Review Board (IRB) and its related staff who have oversight responsibilities for this
study, staff in the USF Office of Research and Innovation, USF Division of Research
Integrity and Compliance, and other USF offices who oversee this research.
We may publish what we learn from this study. If we do, your name or any other
identifying information will not be included. We will not publish anything that would let
people know who you are.
Voluntary Participation / Withdrawal
You should only take part in this study if you want to volunteer. You should not feel that
there is any pressure to take part in the study. You are free to participate in this research
or withdraw at any time. There will be no penalty or loss of benefits you are entitled to
receive if you stop taking part in this study. If you are a student or employee of USF,
decision to participate or not to participate will not affect your student status (course
grade) or job status.
Consent to Take Part in this Research Study
If you consent to participate in this research study and are in agreement with all
previously given statements, please proceed to the next page to begin the survey.
Otherwise you may exit the survey now.

87
Please select the highest education level you completed in school:
1. Elementary
2. High School
3. College
4. Masters
5. Doctorate
Please indicate the generation that defines you best. Please select only one:
6. First generation = you were born in another country.
7. Second generation = you were born in USA; either parent born in another country.
8. Third generation = you were born in USA; both parents born in USA and all
grandparents born in another country.
9. Fourth generation = you and your parents were born in USA; at least one
grandparent born in USA.
10. Fifth generation = you, your parents and all grandparents were born in USA.
Please indicate your age (optional): ______
Please select a response from the following scale that indicates how often you perform
each of the following activities: Never, Rarely, Occasionally, Frequently, Very
Frequently
1. I speak Spanish
2. I speak English
3. I enjoy speaking Spanish
4. I associate with Americans
5. I associate with Hispanic-Americans

88
6. I enjoy listening to Spanish language music
7. I enjoy listening to English language music
8. I enjoy Spanish language TV
9. I enjoy English language TV
10. I enjoy Spanish language movies
11. I enjoy English language movies
12. I enjoy reading (books, etc.) in Spanish
13. I enjoy reading (books, etc.) in English
14. I write (letters, etc.) in Spanish
15. I write (letters, etc.) in English
16. My thinking is done in English
17. My thinking is done in Spanish
18. My father identifies himself as Hispanic
19. My mother identifies herself as Hispanic
20. My friends while I was growing up were of Hispanic origin
21. My friends while I was growing up were of American origin
22. My friends are now of Hispanic origin
23. My friends are now of American origin
24. I like to identify myself as Hispanic
25. I like to identify myself as American
Please select a response from the following scale that indicates how often you perform
each of the following activities online: Never, Rarely, Occasionally, Frequently, Very
Frequently

89
1. Watch videos
2. Read news stories
3. View friends’ posts
4. Listen to music (not downloading)
5. Look at photos
6. Read a blog
7. Rate online content
8. Download music
9. Comment on posts
10. Participate in chats
11. Upload videos or music
12. Publish a blog
13. Manage a website
14. Share photographs
15. Create original posts
Please indicate how often you visit each of the following social media Websites: Never,
Rarely, Occasionally, Frequently, Very Frequently
1. Facebook
2. YouTube
3. Twitter
4. Google+
5. Pinterest

90
APPENDIX C: ONLINE QUESTIONNAIRE

91

92

93

94

95

96
Recommended