
Prepared for ORR
February 2016
FINAL REPORT FOR
PUBLICATION
Highways England’s
Supply Chain
Capability
Page 2
Ref: ORR005
This report has been prepared by Credo Business Consulting LLP (“Credo”) on the basis of the Form of Agreement with Office of Rail
and Road (ORR) dated 20th November 2015, in relation to contract CT/15-40
This report is for the benefit and information of ORR. We will not accept responsibility or liability to any other reader of this report
All surveys, observations, analysis and forecasts contained in the report have been made on the basis of the information available at
the time of the assignment and has been prepared as at 19th February 2016. We have not undertaken to update our report for events or
circumstances arising after that date. Credo cannot be liable for any subsequent changes
In preparing the report, Credo relied upon, and assumed the accuracy of, information obtained from a variety of sources, including but
not limited to: data provided by Highways England (HE); interviews with members of HE’s supply chain and representatives of industry
associations; workshop sessions with Highways Monitor’s Panel of Experts group; financial, government and economic statistics and
forecasts; published academic and economic research and public filings of financial information. Credo accepts no responsibil ity and
will not be liable in the event that information provided to Credo during the course of the assignment from such sources and relied upon
by Credo is subsequently found to be inaccurate
Credo’s aggregate liability in respect of all claims for all addressees of this report shall be limited to £1million
Notice
Page 3
Ref: ORR005
Contents
Executive summary
Market situation and background
Supply chain capacity assessment
HE approach to procurement and project management
Key Performance Indicators and recommendations for ORR
Appendix
pp.4 - 11
pp.12 - 27
pp.28 - 60
pp.61 - 68
pp.69 - 74
pp.75 - 78
Page 4
Ref: ORR005
Agenda
Executive summary
Market situation and background
Supply chain capacity assessment
HE approach to procurement and project management
Key Performance Indicators and recommendations for ORR
Appendix
Page 5
Ref: ORR005
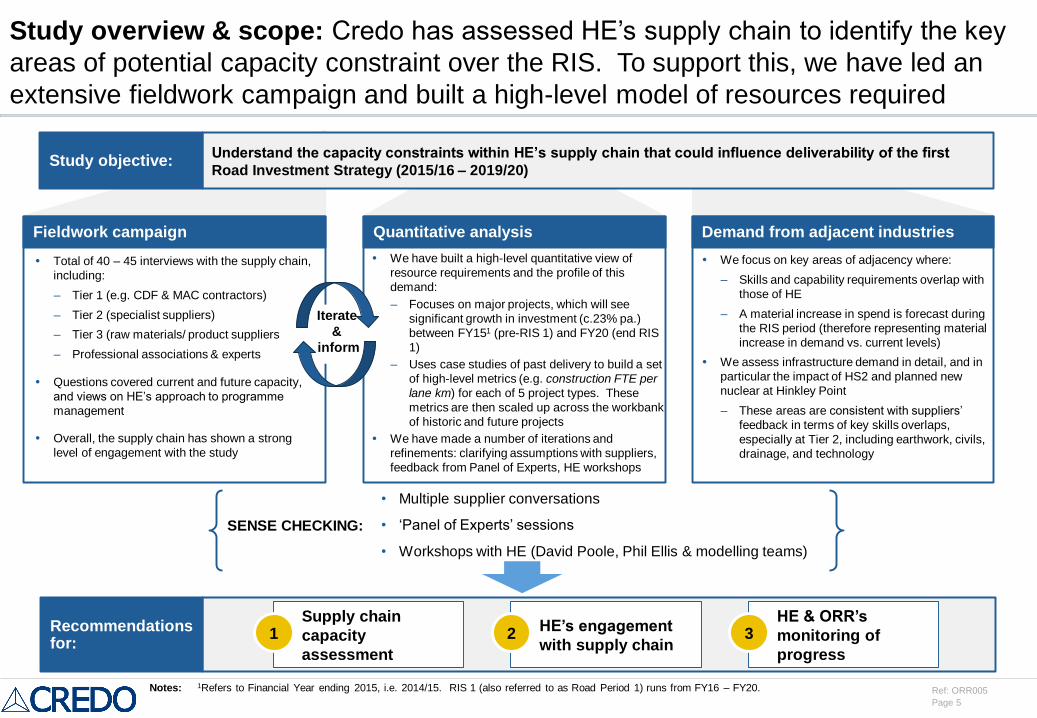
Study overview & scope: Credo has assessed HE’s supply chain to identify the key
areas of potential capacity constraint over the RIS. To support this, we have led an
extensive fieldwork campaign and built a high-level model of resources required
Understand the capacity constraints within HE’s supply chain that could influence deliverability of the first
Road Investment Strategy (2015/16 – 2019/20)Study objective:
Fieldwork campaign Demand from adjacent industriesQuantitative analysis
Iterate
&
inform
Recommendations for:
• Multiple supplier conversations
• ‘Panel of Experts’ sessions
• Workshops with HE (David Poole, Phil Ellis & modelling teams)
SENSE CHECKING:
Supply chain
capacity
assessment
1HE’s engagement
with supply chain2
HE & ORR’s
monitoring of
progress
3
Total of 40 – 45 interviews with the supply chain,
including:
– Tier 1 (e.g. CDF & MAC contractors)
– Tier 2 (specialist suppliers)
– Tier 3 (raw materials/ product suppliers
– Professional associations & experts
Questions covered current and future capacity,
and views on HE’s approach to programme
management
Overall, the supply chain has shown a strong
level of engagement with the study
We have built a high-level quantitative view of
resource requirements and the profile of this
demand:
– Focuses on major projects, which will see
significant growth in investment (c.23% pa.)
between FY151 (pre-RIS 1) and FY20 (end RIS
1)
– Uses case studies of past delivery to build a set
of high-level metrics (e.g. construction FTE per
lane km) for each of 5 project types. These
metrics are then scaled up across the workbank
of historic and future projects
We have made a number of iterations and
refinements: clarifying assumptions with suppliers,
feedback from Panel of Experts, HE workshops
We focus on key areas of adjacency where:
– Skills and capability requirements overlap with
those of HE
– A material increase in spend is forecast during
the RIS period (therefore representing material
increase in demand vs. current levels)
We assess infrastructure demand in detail, and in
particular the impact of HS2 and planned new
nuclear at Hinkley Point
– These areas are consistent with suppliers’
feedback in terms of key skills overlaps,
especially at Tier 2, including earthwork, civils,
drainage, and technology
Notes: 1Refers to Financial Year ending 2015, i.e. 2014/15. RIS 1 (also referred to as Road Period 1) runs from FY16 – FY20.
Page 6
Ref: ORR005
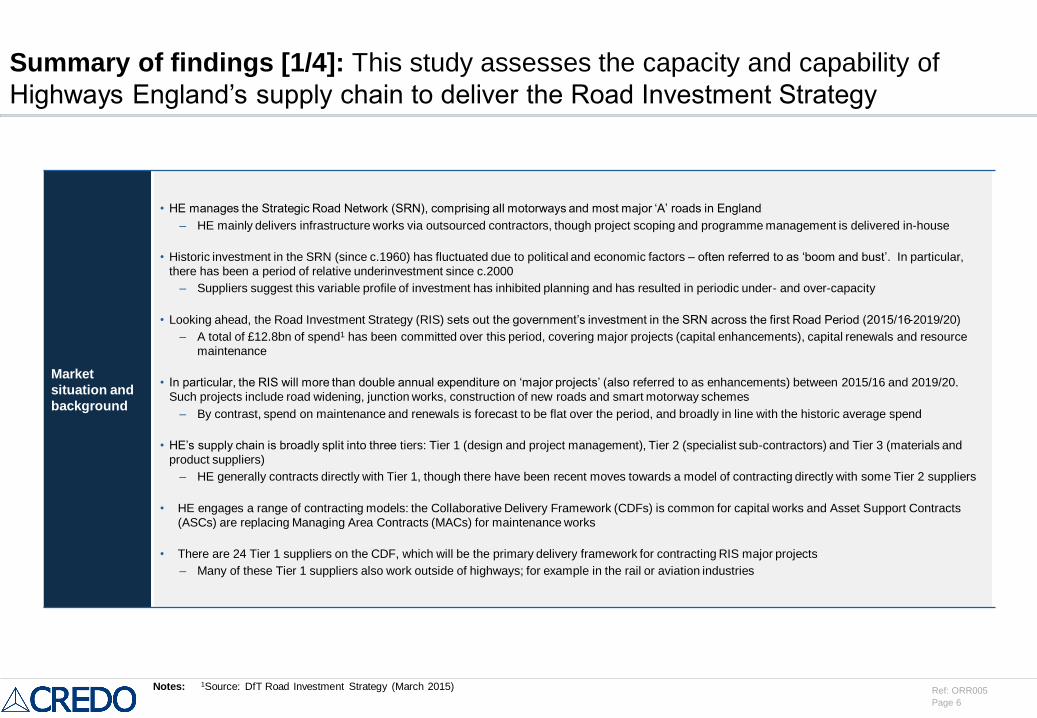
Summary of findings [1/4]: This study assesses the capacity and capability of
Highways England’s supply chain to deliver the Road Investment Strategy
Market
situation and
background
• HE manages the Strategic Road Network (SRN), comprising all motorways and most major ‘A’ roads in England
– HE mainly delivers infrastructure works via outsourced contractors, though project scoping and programme management is delivered in-house
• Historic investment in the SRN (since c.1960) has fluctuated due to political and economic factors – often referred to as ‘boom and bust’. In particular,
there has been a period of relative underinvestment since c.2000
– Suppliers suggest this variable profile of investment has inhibited planning and has resulted in periodic under- and over-capacity
• Looking ahead, the Road Investment Strategy (RIS) sets out the government’s investment in the SRN across the first Road Period (2015/16-2019/20)
– A total of £12.8bn of spend1 has been committed over this period, covering major projects (capital enhancements), capital renewals and resource
maintenance
• In particular, the RIS will more than double annual expenditure on ‘major projects’ (also referred to as enhancements) between 2015/16 and 2019/20.
Such projects include road widening, junction works, construction of new roads and smart motorway schemes
– By contrast, spend on maintenance and renewals is forecast to be flat over the period, and broadly in line with the historic average spend
• HE’s supply chain is broadly split into three tiers: Tier 1 (design and project management), Tier 2 (specialist sub-contractors) and Tier 3 (materials and
product suppliers)
– HE generally contracts directly with Tier 1, though there have been recent moves towards a model of contracting directly with some Tier 2 suppliers
• HE engages a range of contracting models: the Collaborative Delivery Framework (CDFs) is common for capital works and Asset Support Contracts
(ASCs) are replacing Managing Area Contracts (MACs) for maintenance works
• There are 24 Tier 1 suppliers on the CDF, which will be the primary delivery framework for contracting RIS major projects
– Many of these Tier 1 suppliers also work outside of highways; for example in the rail or aviation industries
Notes: 1Source: DfT Road Investment Strategy (March 2015)
Page 7
Ref: ORR005
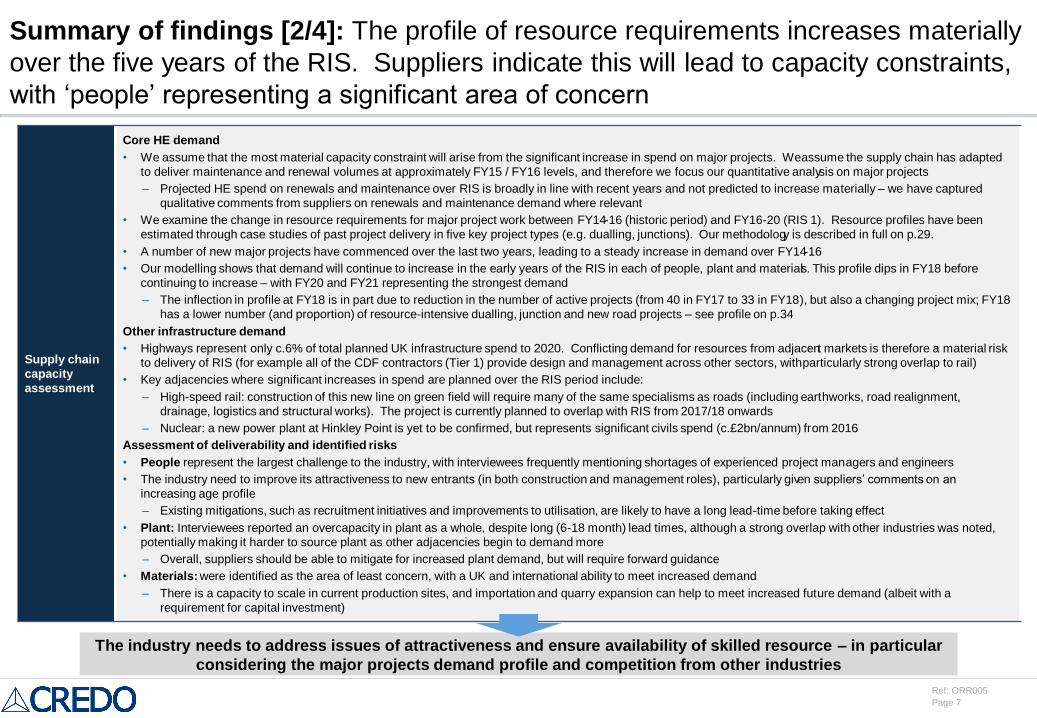
Summary of findings [2/4]: The profile of resource requirements increases materially
over the five years of the RIS. Suppliers indicate this will lead to capacity constraints,
with ‘people’ representing a significant area of concern
Supply chain
capacity
assessment
Core HE demand
• We assume that the most material capacity constraint will arise from the significant increase in spend on major projects. Weassume the supply chain has adapted
to deliver maintenance and renewal volumes at approximately FY15 / FY16 levels, and therefore we focus our quantitative analysis on major projects
– Projected HE spend on renewals and maintenance over RIS is broadly in line with recent years and not predicted to increase materially – we have captured
qualitative comments from suppliers on renewals and maintenance demand where relevant
• We examine the change in resource requirements for major project work between FY14-16 (historic period) and FY16-20 (RIS 1). Resource profiles have been
estimated through case studies of past project delivery in five key project types (e.g. dualling, junctions). Our methodology is described in full on p.29.
• A number of new major projects have commenced over the last two years, leading to a steady increase in demand over FY14-16
• Our modelling shows that demand will continue to increase in the early years of the RIS in each of people, plant and materials. This profile dips in FY18 before
continuing to increase – with FY20 and FY21 representing the strongest demand
– The inflection in profile at FY18 is in part due to reduction in the number of active projects (from 40 in FY17 to 33 in FY18), but also a changing project mix; FY18
has a lower number (and proportion) of resource-intensive dualling, junction and new road projects – see profile on p.34
Other infrastructure demand
• Highways represent only c.6% of total planned UK infrastructure spend to 2020. Conflicting demand for resources from adjacent markets is therefore a material risk
to delivery of RIS (for example all of the CDF contractors (Tier 1) provide design and management across other sectors, with particularly strong overlap to rail)
• Key adjacencies where significant increases in spend are planned over the RIS period include:
– High-speed rail: construction of this new line on green field will require many of the same specialisms as roads (including earthworks, road realignment,
drainage, logistics and structural works). The project is currently planned to overlap with RIS from 2017/18 onwards
– Nuclear: a new power plant at Hinkley Point is yet to be confirmed, but represents significant civils spend (c.£2bn/annum) from 2016
Assessment of deliverability and identified risks
• People represent the largest challenge to the industry, with interviewees frequently mentioning shortages of experienced project managers and engineers
• The industry need to improve its attractiveness to new entrants (in both construction and management roles), particularly given suppliers’ comments on an
increasing age profile
– Existing mitigations, such as recruitment initiatives and improvements to utilisation, are likely to have a long lead-time before taking effect
• Plant: Interviewees reported an overcapacity in plant as a whole, despite long (6-18 month) lead times, although a strong overlap with other industries was noted,
potentially making it harder to source plant as other adjacencies begin to demand more
– Overall, suppliers should be able to mitigate for increased plant demand, but will require forward guidance
• Materials: were identified as the area of least concern, with a UK and international ability to meet increased demand
– There is a capacity to scale in current production sites, and importation and quarry expansion can help to meet increased future demand (albeit with a
requirement for capital investment)
The industry needs to address issues of attractiveness and ensure availability of skilled resource – in particular
considering the major projects demand profile and competition from other industries
Page 8
Ref: ORR005
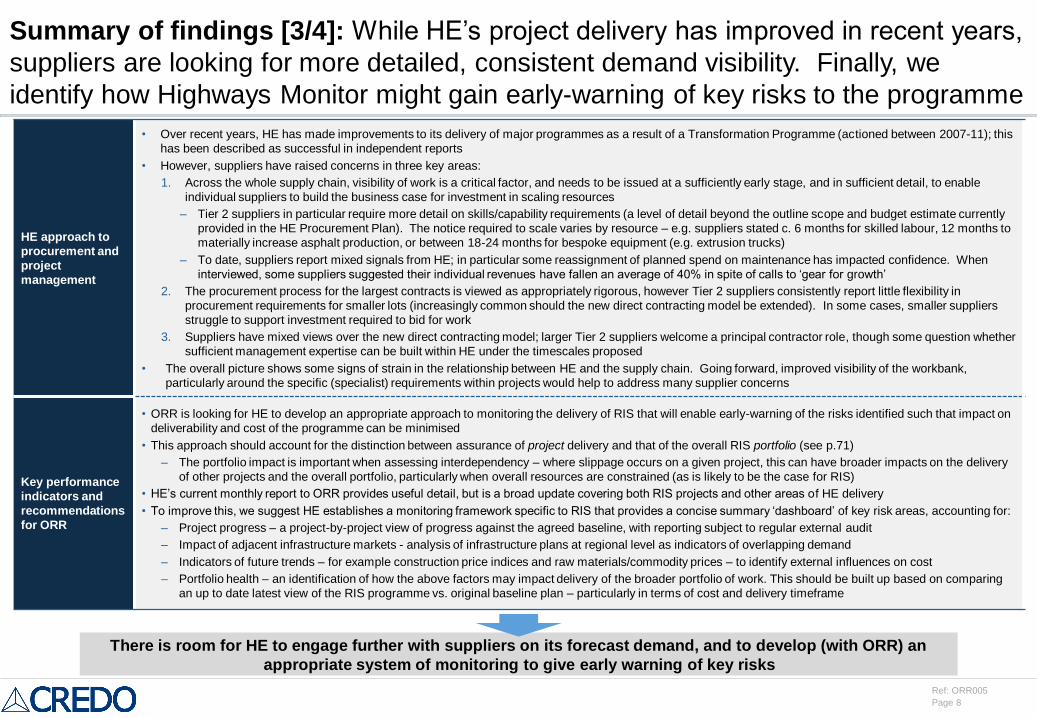
Summary of findings [3/4]: While HE’s project delivery has improved in recent years,
suppliers are looking for more detailed, consistent demand visibility. Finally, we
identify how Highways Monitor might gain early-warning of key risks to the programme
HE approach to
procurement and
project
management
• Over recent years, HE has made improvements to its delivery of major programmes as a result of a Transformation Programme (actioned between 2007-11); this
has been described as successful in independent reports
• However, suppliers have raised concerns in three key areas:
1. Across the whole supply chain, visibility of work is a critical factor, and needs to be issued at a sufficiently early stage, and in sufficient detail, to enable
individual suppliers to build the business case for investment in scaling resources
– Tier 2 suppliers in particular require more detail on skills/capability requirements (a level of detail beyond the outline scope and budget estimate currently
provided in the HE Procurement Plan). The notice required to scale varies by resource – e.g. suppliers stated c. 6 months for skilled labour, 12 months to
materially increase asphalt production, or between 18-24 months for bespoke equipment (e.g. extrusion trucks)
– To date, suppliers report mixed signals from HE; in particular some reassignment of planned spend on maintenance has impacted confidence. When
interviewed, some suppliers suggested their individual revenues have fallen an average of 40% in spite of calls to ‘gear for growth’
2. The procurement process for the largest contracts is viewed as appropriately rigorous, however Tier 2 suppliers consistently report little flexibility in
procurement requirements for smaller lots (increasingly common should the new direct contracting model be extended). In some cases, smaller suppliers
struggle to support investment required to bid for work
3. Suppliers have mixed views over the new direct contracting model; larger Tier 2 suppliers welcome a principal contractor role, though some question whether
sufficient management expertise can be built within HE under the timescales proposed
• The overall picture shows some signs of strain in the relationship between HE and the supply chain. Going forward, improved visibility of the workbank,
particularly around the specific (specialist) requirements within projects would help to address many supplier concerns
Key performance
indicators and
recommendations
for ORR
• ORR is looking for HE to develop an appropriate approach to monitoring the delivery of RIS that will enable early-warning of the risks identified such that impact on
deliverability and cost of the programme can be minimised
• This approach should account for the distinction between assurance of project delivery and that of the overall RIS portfolio (see p.71)
– The portfolio impact is important when assessing interdependency – where slippage occurs on a given project, this can have broader impacts on the delivery
of other projects and the overall portfolio, particularly when overall resources are constrained (as is likely to be the case for RIS)
• HE’s current monthly report to ORR provides useful detail, but is a broad update covering both RIS projects and other areas of HE delivery
• To improve this, we suggest HE establishes a monitoring framework specific to RIS that provides a concise summary ‘dashboard’ of key risk areas, accounting for:
– Project progress – a project-by-project view of progress against the agreed baseline, with reporting subject to regular external audit
– Impact of adjacent infrastructure markets - analysis of infrastructure plans at regional level as indicators of overlapping demand
– Indicators of future trends – for example construction price indices and raw materials/commodity prices – to identify external influences on cost
– Portfolio health – an identification of how the above factors may impact delivery of the broader portfolio of work. This should be built up based on comparing
an up to date latest view of the RIS programme vs. original baseline plan – particularly in terms of cost and delivery timeframe
There is room for HE to engage further with suppliers on its forecast demand, and to develop (with ORR) an
appropriate system of monitoring to give early warning of key risks
Page 9
Ref: ORR005
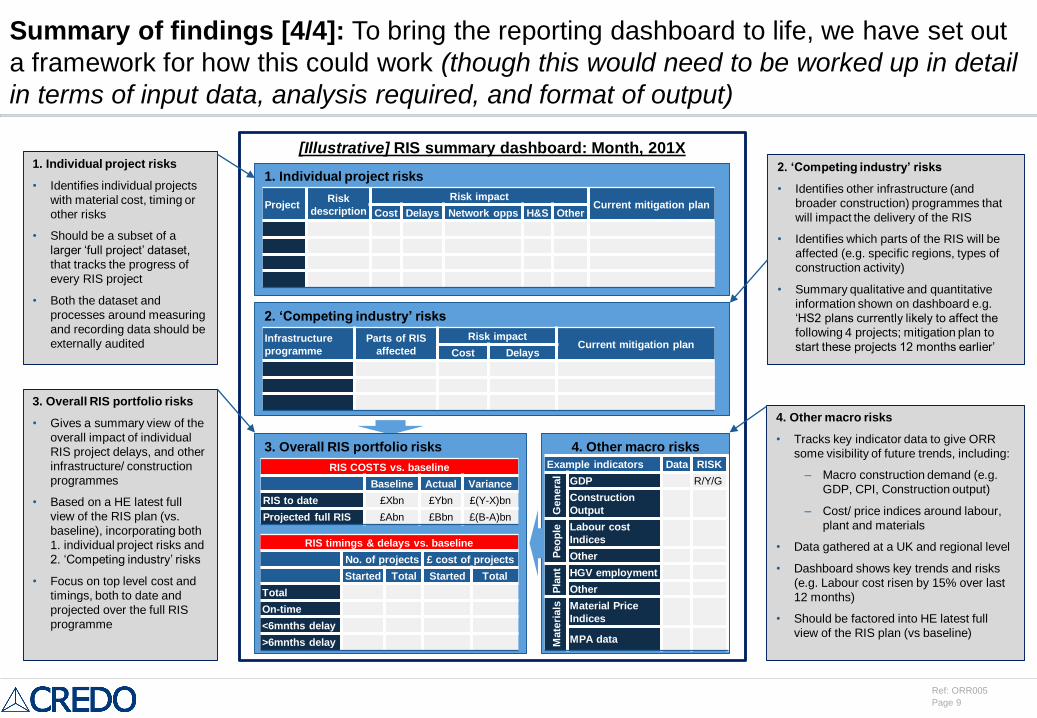
Summary of findings [4/4]: To bring the reporting dashboard to life, we have set out
a framework for how this could work (though this would need to be worked up in detail
in terms of input data, analysis required, and format of output)
[Illustrative] RIS summary dashboard: Month, 201X
1. Individual project risks
ProjectRisk
description
Risk impactCurrent mitigation plan
Cost Delays Network opps H&S Other
2. ‘Competing industry’ risks
Infrastructure
programme
Parts of RIS
affected
Risk impactCurrent mitigation plan
Cost Delays
3. Overall RIS portfolio risks
RIS COSTS vs. baseline
Baseline Actual Variance
RIS to date £Xbn £Ybn £(Y-X)bn
Projected full RIS £Abn £Bbn £(B-A)bn
RIS timings & delays vs. baseline
No. of projects £ cost of projects
Started Total Started Total
Total
On-time
<6mnths delay
>6mnths delay
4. Other macro risks
Example indicators Data RISK
Gen
era
l
GDP R/Y/G
Construction
Output
Peo
ple Labour cost
Indices
OtherP
lan
t HGV employment
Other
Mate
rials Material Price
Indices
MPA data
1. Individual project risks
• Identifies individual projects
with material cost, timing or
other risks
• Should be a subset of a
larger ‘full project’ dataset,
that tracks the progress of
every RIS project
• Both the dataset and
processes around measuring
and recording data should be
externally audited
2. ‘Competing industry’ risks
• Identifies other infrastructure (and
broader construction) programmes that
will impact the delivery of the RIS
• Identifies which parts of the RIS will be
affected (e.g. specific regions, types of
construction activity)
• Summary qualitative and quantitative
information shown on dashboard e.g.
‘HS2 plans currently likely to affect the
following 4 projects; mitigation plan to
start these projects 12 months earlier’
3. Overall RIS portfolio risks
• Gives a summary view of the
overall impact of individual
RIS project delays, and other
infrastructure/ construction
programmes
• Based on a HE latest full
view of the RIS plan (vs.
baseline), incorporating both
1. individual project risks and
2. ‘Competing industry’ risks
• Focus on top level cost and
timings, both to date and
projected over the full RIS
programme
4. Other macro risks
• Tracks key indicator data to give ORR
some visibility of future trends, including:
‒ Macro construction demand (e.g.
GDP, CPI, Construction output)
‒ Cost/ price indices around labour,
plant and materials
• Data gathered at a UK and regional level
• Dashboard shows key trends and risks
(e.g. Labour cost risen by 15% over last
12 months)
• Should be factored into HE latest full
view of the RIS plan (vs baseline)
Page 10
Ref: ORR005
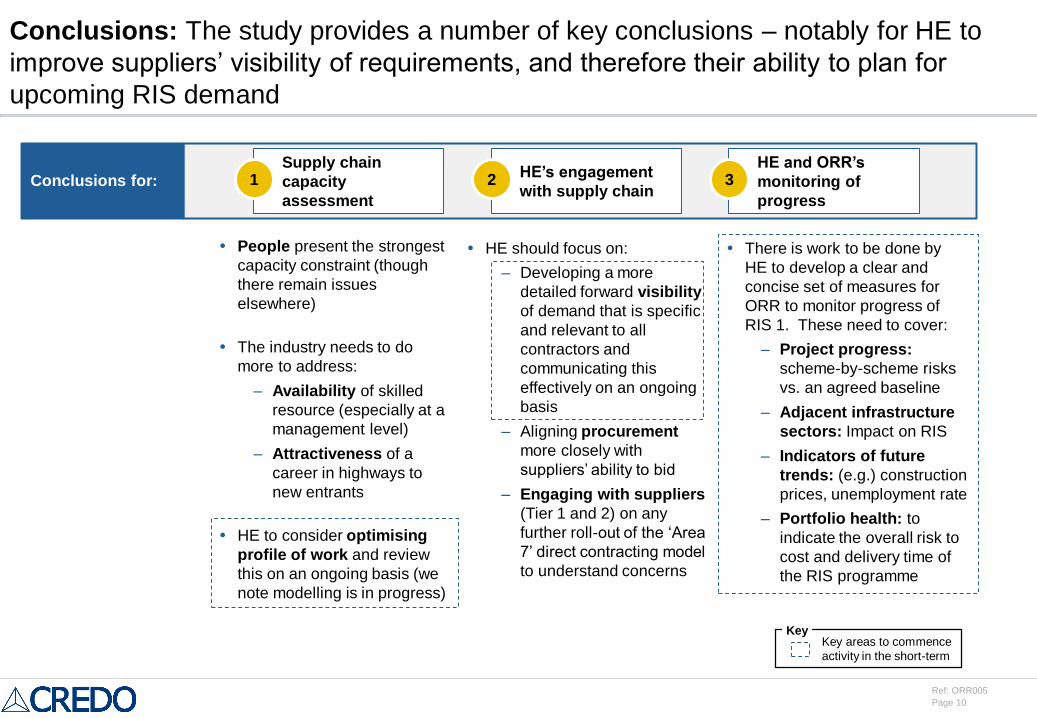
HE should focus on:
– Developing a more
detailed forward visibility
of demand that is specific
and relevant to all
contractors and
communicating this
effectively on an ongoing
basis
– Aligning procurement
more closely with
suppliers’ ability to bid
– Engaging with suppliers
(Tier 1 and 2) on any
further roll-out of the ‘Area
7’ direct contracting model
to understand concerns
Conclusions: The study provides a number of key conclusions – notably for HE to
improve suppliers’ visibility of requirements, and therefore their ability to plan for
upcoming RIS demand
Conclusions for:Supply chain
capacity
assessment
1HE’s engagement
with supply chain2
HE and ORR’s
monitoring of
progress
3
There is work to be done by
HE to develop a clear and
concise set of measures for
ORR to monitor progress of
RIS 1. These need to cover:
– Project progress:
scheme-by-scheme risks
vs. an agreed baseline
– Adjacent infrastructure
sectors: Impact on RIS
– Indicators of future
trends: (e.g.) construction
prices, unemployment rate
– Portfolio health: to
indicate the overall risk to
cost and delivery time of
the RIS programme
People present the strongest
capacity constraint (though
there remain issues
elsewhere)
The industry needs to do
more to address:
– Availability of skilled
resource (especially at a
management level)
– Attractiveness of a
career in highways to
new entrants
HE to consider optimising
profile of work and review
this on an ongoing basis (we
note modelling is in progress)
KeyKey areas to commence
activity in the short-term
Page 11
Ref: ORR005
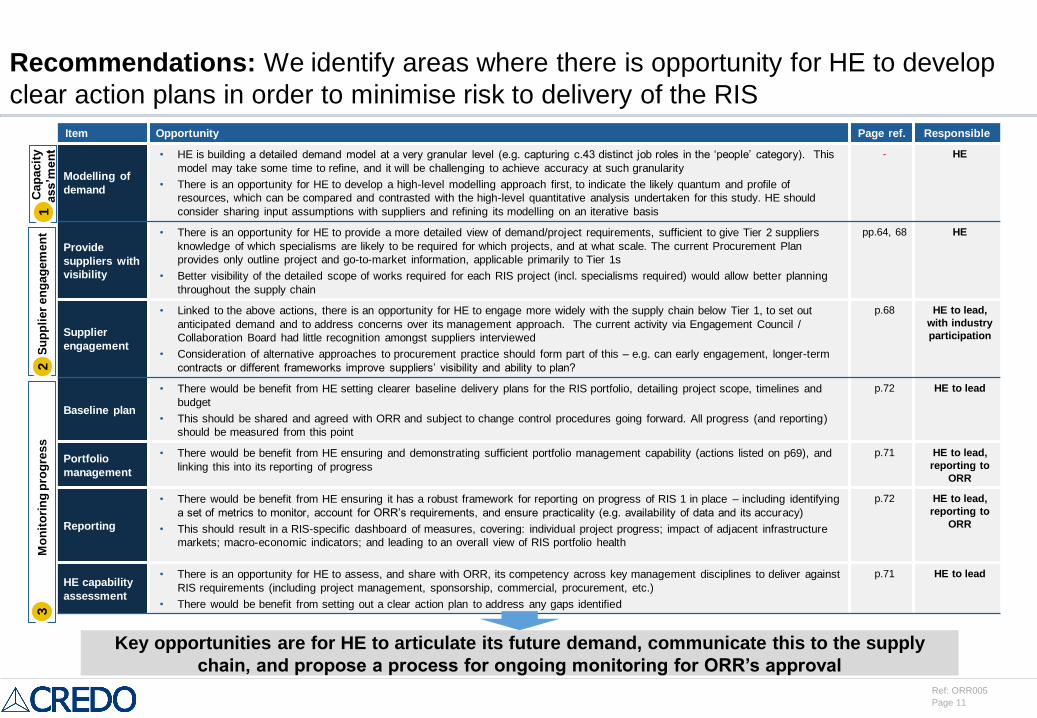
Recommendations: We identify areas where there is opportunity for HE to develop
clear action plans in order to minimise risk to delivery of the RIS
Cap
acit
y
ass’m
en
tM
on
ito
rin
g p
rog
ress
Su
pp
lier
en
gag
em
en
t2
13
Item Opportunity Page ref. Responsible
Modelling of
demand
• HE is building a detailed demand model at a very granular level (e.g. capturing c.43 distinct job roles in the ‘people’ category). This
model may take some time to refine, and it will be challenging to achieve accuracy at such granularity
• There is an opportunity for HE to develop a high-level modelling approach first, to indicate the likely quantum and profile of
resources, which can be compared and contrasted with the high-level quantitative analysis undertaken for this study. HE should
consider sharing input assumptions with suppliers and refining its modelling on an iterative basis
- HE
Provide
suppliers with
visibility
• There is an opportunity for HE to provide a more detailed view of demand/project requirements, sufficient to give Tier 2 suppliers
knowledge of which specialisms are likely to be required for which projects, and at what scale. The current Procurement Plan
provides only outline project and go-to-market information, applicable primarily to Tier 1s
• Better visibility of the detailed scope of works required for each RIS project (incl. specialisms required) would allow better planning
throughout the supply chain
pp.64, 68 HE
Supplier
engagement
• Linked to the above actions, there is an opportunity for HE to engage more widely with the supply chain below Tier 1, to set out
anticipated demand and to address concerns over its management approach. The current activity via Engagement Council /
Collaboration Board had little recognition amongst suppliers interviewed
• Consideration of alternative approaches to procurement practice should form part of this – e.g. can early engagement, longer-term
contracts or different frameworks improve suppliers’ visibility and ability to plan?
p.68 HE to lead,
with industry
participation
Baseline plan
• There would be benefit from HE setting clearer baseline delivery plans for the RIS portfolio, detailing project scope, timelines and
budget
• This should be shared and agreed with ORR and subject to change control procedures going forward. All progress (and reporting)
should be measured from this point
p.72 HE to lead
Portfolio
management
• There would be benefit from HE ensuring and demonstrating sufficient portfolio management capability (actions listed on p69), and
linking this into its reporting of progress
p.71 HE to lead,
reporting to
ORR
Reporting
• There would be benefit from HE ensuring it has a robust framework for reporting on progress of RIS 1 in place – including identifying
a set of metrics to monitor, account for ORR’s requirements, and ensure practicality (e.g. availability of data and its accuracy)
• This should result in a RIS-specific dashboard of measures, covering: individual project progress; impact of adjacent infrastructure
markets; macro-economic indicators; and leading to an overall view of RIS portfolio health
p.72 HE to lead,
reporting to
ORR
HE capability
assessment
• There is an opportunity for HE to assess, and share with ORR, its competency across key management disciplines to deliver against
RIS requirements (including project management, sponsorship, commercial, procurement, etc.)
• There would be benefit from setting out a clear action plan to address any gaps identified
p.71 HE to lead
Key opportunities are for HE to articulate its future demand, communicate this to the supply
chain, and propose a process for ongoing monitoring for ORR’s approval
Page 12
Ref: ORR005
Agenda
Executive summary
Market situation and background
– The Strategic Road Network and Highways England
– Supply chain overview
– Historic and future investment profile
Supply chain capacity assessment
HE approach to procurement and project management
Key Performance Indicators and recommendations for ORR
Appendix
Page 13
Ref: ORR005
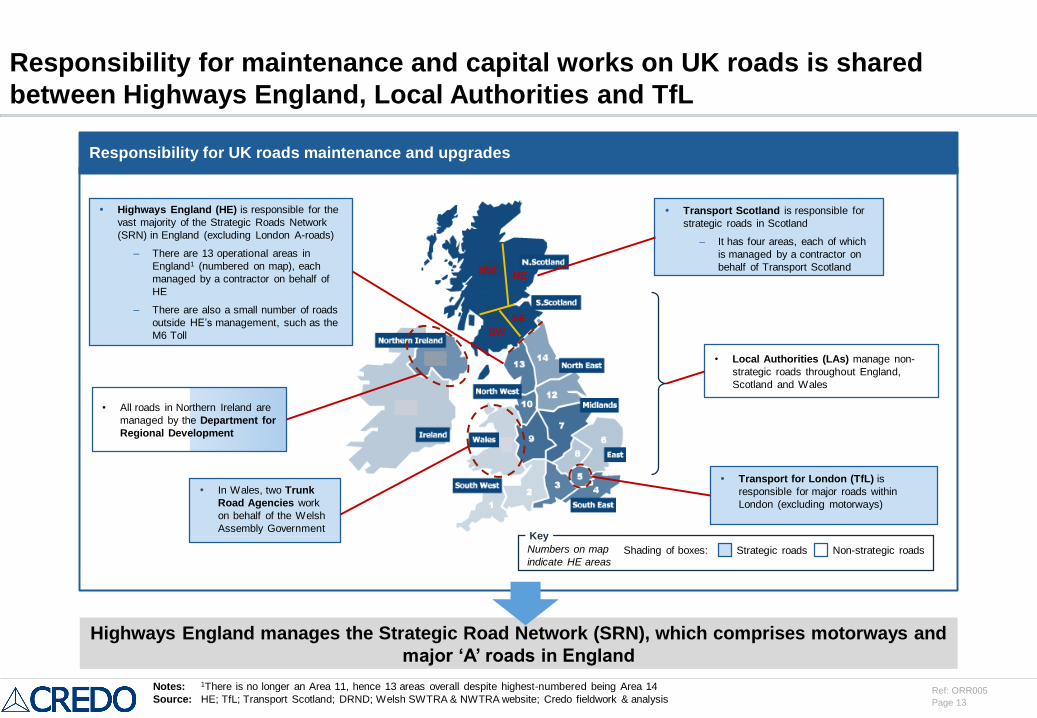
Responsibility for maintenance and capital works on UK roads is shared
between Highways England, Local Authorities and TfL
Responsibility for UK roads maintenance and upgrades
Highways England manages the Strategic Road Network (SRN), which comprises motorways and
major ‘A’ roads in England
Highways England (HE) is responsible for the
vast majority of the Strategic Roads Network
(SRN) in England (excluding London A-roads)
– There are 13 operational areas in
England1 (numbered on map), each
managed by a contractor on behalf of
HE
– There are also a small number of roads
outside HE’s management, such as the
M6 Toll
In Wales, two Trunk
Road Agencies work
on behalf of the Welsh
Assembly Government
• Local Authorities (LAs) manage non-
strategic roads throughout England,
Scotland and Wales
• All roads in Northern Ireland are
managed by the Department for
Regional Development
Transport for London (TfL) is
responsible for major roads within
London (excluding motorways)
Transport Scotland is responsible for
strategic roads in Scotland
– It has four areas, each of which
is managed by a contractor on
behalf of Transport ScotlandNW
SW
NE
SE
Notes: 1There is no longer an Area 11, hence 13 areas overall despite highest-numbered being Area 14
Source: HE; TfL; Transport Scotland; DRND; Welsh SWTRA & NWTRA website; Credo fieldwork & analysis
Numbers on map
indicate HE areas
Key
Strategic roads Non-strategic roadsShading of boxes:
Page 14
Ref: ORR005
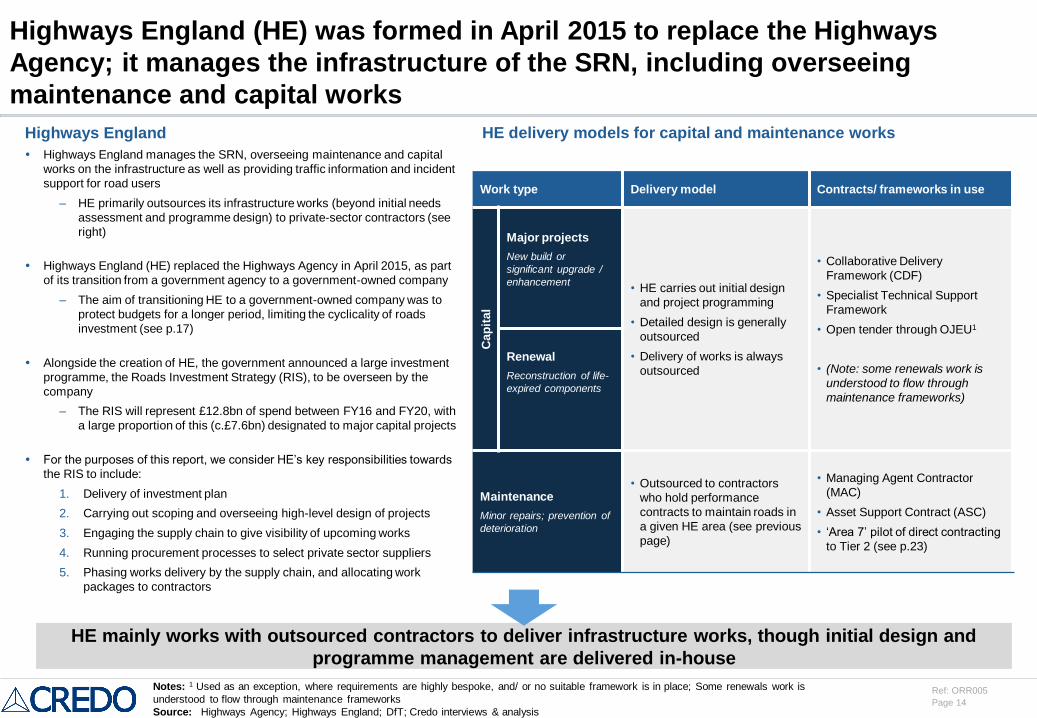
Highways England (HE) was formed in April 2015 to replace the Highways
Agency; it manages the infrastructure of the SRN, including overseeing
maintenance and capital works
Highways England
Highways England manages the SRN, overseeing maintenance and capital
works on the infrastructure as well as providing traffic information and incident
support for road users
– HE primarily outsources its infrastructure works (beyond initial needs
assessment and programme design) to private-sector contractors (see
right)
Highways England (HE) replaced the Highways Agency in April 2015, as part
of its transition from a government agency to a government-owned company
– The aim of transitioning HE to a government-owned company was to
protect budgets for a longer period, limiting the cyclicality of roads
investment (see p.17)
Alongside the creation of HE, the government announced a large investment
programme, the Roads Investment Strategy (RIS), to be overseen by the
company
– The RIS will represent £12.8bn of spend between FY16 and FY20, with
a large proportion of this (c.£7.6bn) designated to major capital projects
For the purposes of this report, we consider HE’s key responsibilities towards
the RIS to include:
1. Delivery of investment plan
2. Carrying out scoping and overseeing high-level design of projects
3. Engaging the supply chain to give visibility of upcoming works
4. Running procurement processes to select private sector suppliers
5. Phasing works delivery by the supply chain, and allocating work
packages to contractors
HE delivery models for capital and maintenance works
Work type Delivery model Contracts/ frameworks in use
Cap
ital
Major projects
New build or
significant upgrade /
enhancement• HE carries out initial design
and project programming
• Detailed design is generally
outsourced
• Delivery of works is always
outsourced
• Collaborative Delivery
Framework (CDF)
• Specialist Technical Support
Framework
• Open tender through OJEU1
• (Note: some renewals work is
understood to flow through
maintenance frameworks)
Renewal
Reconstruction of life-
expired components
Maintenance
Minor repairs; prevention of
deterioration
• Outsourced to contractors
who hold performance
contracts to maintain roads in
a given HE area (see previous
page)
• Managing Agent Contractor
(MAC)
• Asset Support Contract (ASC)
• ‘Area 7’ pilot of direct contracting
to Tier 2 (see p.23)
HE mainly works with outsourced contractors to deliver infrastructure works, though initial design and
programme management are delivered in-house
Notes: 1 Used as an exception, where requirements are highly bespoke, and/ or no suitable framework is in place; Some renewals work is
understood to flow through maintenance frameworks
Source: Highways Agency; Highways England; DfT; Credo interviews & analysis
Page 15
Ref: ORR005
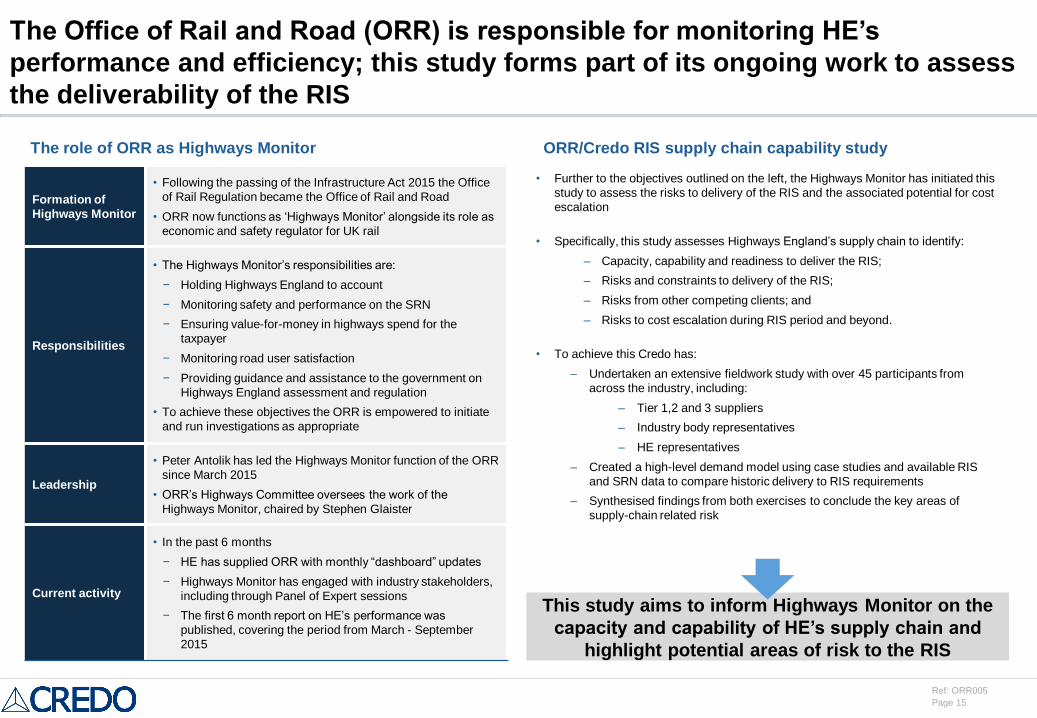
The Office of Rail and Road (ORR) is responsible for monitoring HE’s
performance and efficiency; this study forms part of its ongoing work to assess
the deliverability of the RIS
The role of ORR as Highways Monitor
• Further to the objectives outlined on the left, the Highways Monitor has initiated this
study to assess the risks to delivery of the RIS and the associated potential for cost
escalation
• Specifically, this study assesses Highways England’s supply chain to identify:
– Capacity, capability and readiness to deliver the RIS;
– Risks and constraints to delivery of the RIS;
– Risks from other competing clients; and
– Risks to cost escalation during RIS period and beyond.
• To achieve this Credo has:
– Undertaken an extensive fieldwork study with over 45 participants from
across the industry, including:
– Tier 1,2 and 3 suppliers
– Industry body representatives
– HE representatives
– Created a high-level demand model using case studies and available RIS
and SRN data to compare historic delivery to RIS requirements
– Synthesised findings from both exercises to conclude the key areas of
supply-chain related risk
Formation of
Highways Monitor
• Following the passing of the Infrastructure Act 2015 the Office
of Rail Regulation became the Office of Rail and Road
• ORR now functions as ‘Highways Monitor’ alongside its role as
economic and safety regulator for UK rail
Responsibilities
• The Highways Monitor’s responsibilities are:
− Holding Highways England to account
− Monitoring safety and performance on the SRN
− Ensuring value-for-money in highways spend for the
taxpayer
− Monitoring road user satisfaction
− Providing guidance and assistance to the government on
Highways England assessment and regulation
• To achieve these objectives the ORR is empowered to initiate
and run investigations as appropriate
Leadership
• Peter Antolik has led the Highways Monitor function of the ORR
since March 2015
• ORR’s Highways Committee oversees the work of the
Highways Monitor, chaired by Stephen Glaister
Current activity
• In the past 6 months
− HE has supplied ORR with monthly “dashboard” updates
− Highways Monitor has engaged with industry stakeholders,
including through Panel of Expert sessions
− The first 6 month report on HE’s performance was
published, covering the period from March - September
2015
This study aims to inform Highways Monitor on the
capacity and capability of HE’s supply chain and
highlight potential areas of risk to the RIS
ORR/Credo RIS supply chain capability study
Page 16
Ref: ORR005
Agenda
Executive summary
Market situation and background
– The Strategic Road Network and Highways England
– Historic and future investment profile
– Supply chain overview
Supply chain capacity assessment
HE approach to procurement and project management
Key Performance Indicators and recommendations for ORR
Page 17
Ref: ORR005
£0.0bn
£0.5bn
£1.0bn
£1.5bn
£2.0bn
£2.5bn
£3.0bn
1960-61 1970-71 1980-81 1990-91 2000-01 2010-11
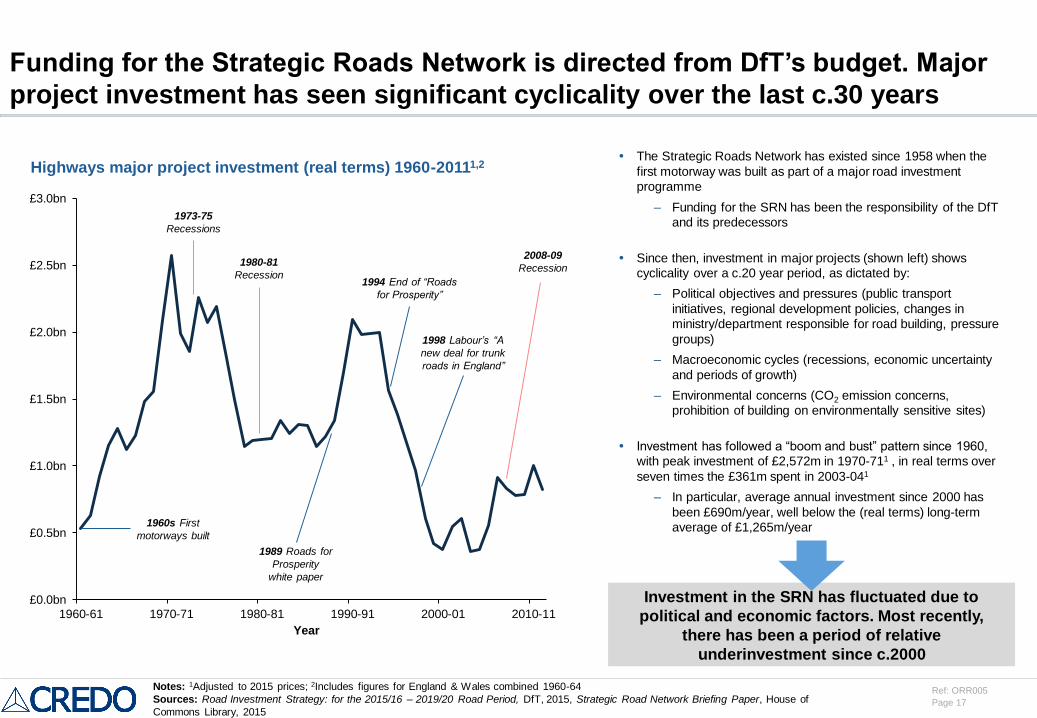
Funding for the Strategic Roads Network is directed from DfT’s budget. Major
project investment has seen significant cyclicality over the last c.30 years
The Strategic Roads Network has existed since 1958 when the
first motorway was built as part of a major road investment
programme
– Funding for the SRN has been the responsibility of the DfT
and its predecessors
Since then, investment in major projects (shown left) shows
cyclicality over a c.20 year period, as dictated by:
– Political objectives and pressures (public transport
initiatives, regional development policies, changes in
ministry/department responsible for road building, pressure
groups)
– Macroeconomic cycles (recessions, economic uncertainty
and periods of growth)
– Environmental concerns (CO2 emission concerns,
prohibition of building on environmentally sensitive sites)
Investment has followed a “boom and bust” pattern since 1960,
with peak investment of £2,572m in 1970-711 , in real terms over
seven times the £361m spent in 2003-041
– In particular, average annual investment since 2000 has
been £690m/year, well below the (real terms) long-term
average of £1,265m/year
Highways major project investment (real terms) 1960-20111,2
1989 Roads for
Prosperity
white paper
Investment in the SRN has fluctuated due to
political and economic factors. Most recently,
there has been a period of relative
underinvestment since c.2000
1994 End of “Roads
for Prosperity”
1998 Labour’s “A
new deal for trunk
roads in England”
1960s First
motorways built
Year
1973-75
Recessions
1980-81
Recession
2008-09
Recession
Notes: 1Adjusted to 2015 prices; 2Includes figures for England & Wales combined 1960-64
Sources: Road Investment Strategy: for the 2015/16 – 2019/20 Road Period, DfT, 2015, Strategic Road Network Briefing Paper, House of
Commons Library, 2015
Page 18
Ref: ORR005
Annual Growth
Description
FY10-15 FY15-20
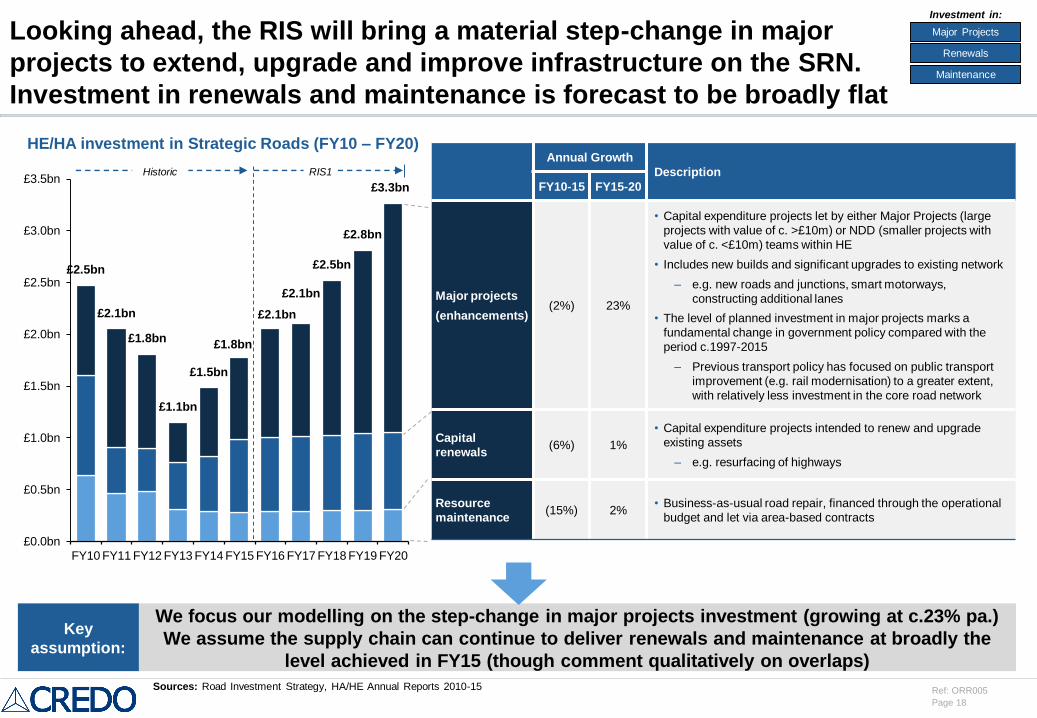
Major projects
(enhancements)(2%) 23%
• Capital expenditure projects let by either Major Projects (large
projects with value of c. >£10m) or NDD (smaller projects with
value of c. <£10m) teams within HE
• Includes new builds and significant upgrades to existing network
– e.g. new roads and junctions, smart motorways,
constructing additional lanes
• The level of planned investment in major projects marks a
fundamental change in government policy compared with the
period c.1997-2015
– Previous transport policy has focused on public transport
improvement (e.g. rail modernisation) to a greater extent,
with relatively less investment in the core road network
Capital
renewals(6%) 1%
• Capital expenditure projects intended to renew and upgrade
existing assets
– e.g. resurfacing of highways
Resource
maintenance(15%) 2%
• Business-as-usual road repair, financed through the operational
budget and let via area-based contracts
Looking ahead, the RIS will bring a material step-change in major
projects to extend, upgrade and improve infrastructure on the SRN.
Investment in renewals and maintenance is forecast to be broadly flat
HE/HA investment in Strategic Roads (FY10 – FY20)
£2.5bn
£2.1bn
£1.8bn
£1.1bn
£1.5bn
£1.8bn
£2.1bn
£2.1bn
£2.5bn
£2.8bn
£3.3bn
£0.0bn
£0.5bn
£1.0bn
£1.5bn
£2.0bn
£2.5bn
£3.0bn
£3.5bn
FY10 FY11 FY12 FY13 FY14 FY15 FY16 FY17 FY18 FY19 FY20
We focus our modelling on the step-change in major projects investment (growing at c.23% pa.)
We assume the supply chain can continue to deliver renewals and maintenance at broadly the
level achieved in FY15 (though comment qualitatively on overlaps)
Major Projects
Renewals
Maintenance
Investment in:
Sources: Road Investment Strategy, HA/HE Annual Reports 2010-15
Key
assumption:
RIS1Historic
Page 19
Ref: ORR005
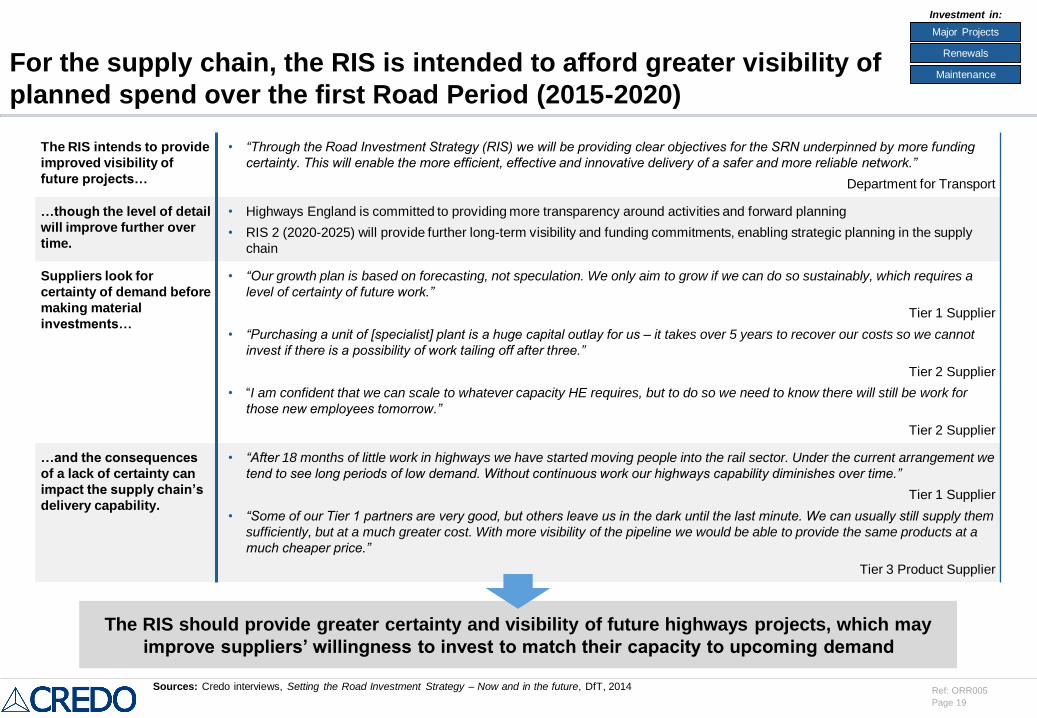
The RIS intends to provide
improved visibility of
future projects…
• “Through the Road Investment Strategy (RIS) we will be providing clear objectives for the SRN underpinned by more funding
certainty. This will enable the more efficient, effective and innovative delivery of a safer and more reliable network.”
Department for Transport
…though the level of detail
will improve further over
time.
• Highways England is committed to providing more transparency around activities and forward planning
• RIS 2 (2020-2025) will provide further long-term visibility and funding commitments, enabling strategic planning in the supply
chain
Suppliers look for
certainty of demand before
making material
investments…
• “Our growth plan is based on forecasting, not speculation. We only aim to grow if we can do so sustainably, which requires a
level of certainty of future work.”
Tier 1 Supplier
• “Purchasing a unit of [specialist] plant is a huge capital outlay for us – it takes over 5 years to recover our costs so we cannot
invest if there is a possibility of work tailing off after three.”
Tier 2 Supplier
• “I am confident that we can scale to whatever capacity HE requires, but to do so we need to know there will still be work for
those new employees tomorrow.”
Tier 2 Supplier
…and the consequences
of a lack of certainty can
impact the supply chain’s
delivery capability.
• “After 18 months of little work in highways we have started moving people into the rail sector. Under the current arrangement we
tend to see long periods of low demand. Without continuous work our highways capability diminishes over time.”
Tier 1 Supplier
• “Some of our Tier 1 partners are very good, but others leave us in the dark until the last minute. We can usually still supply them
sufficiently, but at a much greater cost. With more visibility of the pipeline we would be able to provide the same products at a
much cheaper price.”
Tier 3 Product Supplier
For the supply chain, the RIS is intended to afford greater visibility of
planned spend over the first Road Period (2015-2020)
The RIS should provide greater certainty and visibility of future highways projects, which may
improve suppliers’ willingness to invest to match their capacity to upcoming demand
Sources: Credo interviews, Setting the Road Investment Strategy – Now and in the future, DfT, 2014
Major Projects
Renewals
Maintenance
Investment in:
Page 20
Ref: ORR005
£1.8bn
£2.1bn £2.1bn
£2.5bn
£2.8bn
£3.3bn
£0.0bn
£0.5bn
£1.0bn
£1.5bn
£2.0bn
£2.5bn
£3.0bn
£3.5bn
FY15 FY16 FY17 FY18 FY19 FY20
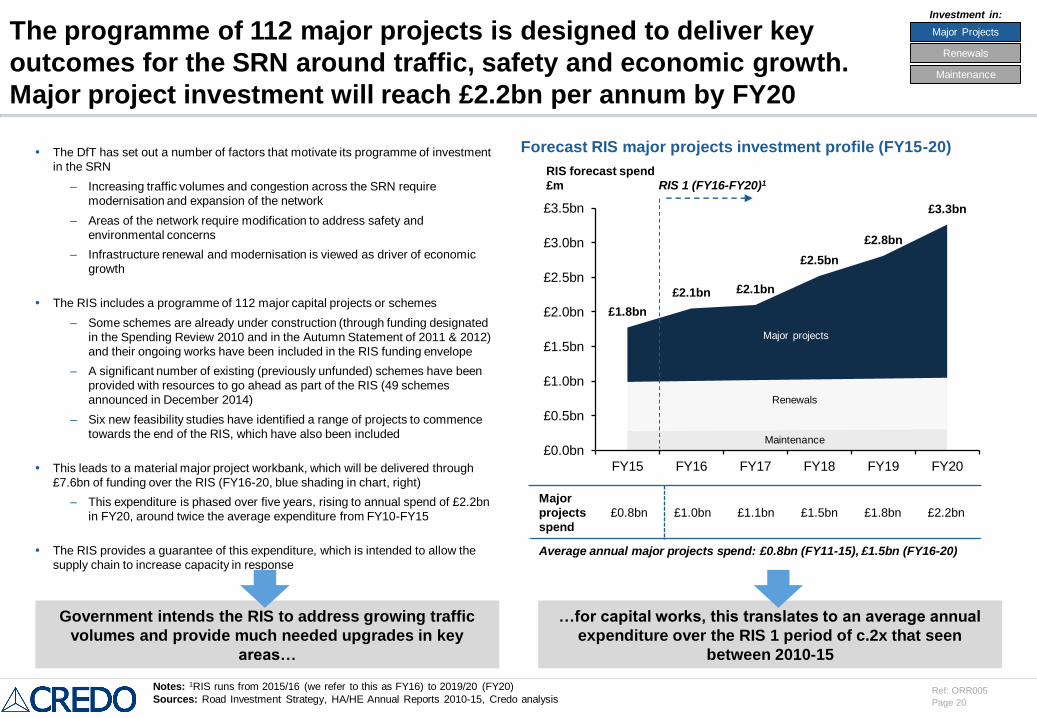
The programme of 112 major projects is designed to deliver key
outcomes for the SRN around traffic, safety and economic growth.
Major project investment will reach £2.2bn per annum by FY20
The DfT has set out a number of factors that motivate its programme of investment
in the SRN
– Increasing traffic volumes and congestion across the SRN require
modernisation and expansion of the network
– Areas of the network require modification to address safety and
environmental concerns
– Infrastructure renewal and modernisation is viewed as driver of economic
growth
The RIS includes a programme of 112 major capital projects or schemes
– Some schemes are already under construction (through funding designated
in the Spending Review 2010 and in the Autumn Statement of 2011 & 2012)
and their ongoing works have been included in the RIS funding envelope
– A significant number of existing (previously unfunded) schemes have been
provided with resources to go ahead as part of the RIS (49 schemes
announced in December 2014)
– Six new feasibility studies have identified a range of projects to commence
towards the end of the RIS, which have also been included
This leads to a material major project workbank, which will be delivered through
£7.6bn of funding over the RIS (FY16-20, blue shading in chart, right)
– This expenditure is phased over five years, rising to annual spend of £2.2bn
in FY20, around twice the average expenditure from FY10-FY15
The RIS provides a guarantee of this expenditure, which is intended to allow the
supply chain to increase capacity in response
Forecast RIS major projects investment profile (FY15-20)
…for capital works, this translates to an average annual
expenditure over the RIS 1 period of c.2x that seen
between 2010-15
Government intends the RIS to address growing traffic
volumes and provide much needed upgrades in key
areas…
RIS forecast spend
£m
Notes: 1RIS runs from 2015/16 (we refer to this as FY16) to 2019/20 (FY20)
Sources: Road Investment Strategy, HA/HE Annual Reports 2010-15, Credo analysis
Major Projects
Renewals
Maintenance
Investment in:
Major projects
Renewals
Maintenance
Major
projects
spend
£0.8bn £1.0bn £1.1bn £1.5bn £1.8bn £2.2bn
Average annual major projects spend: £0.8bn (FY11-15), £1.5bn (FY16-20)
RIS 1 (FY16-FY20)1
Page 21
Ref: ORR005
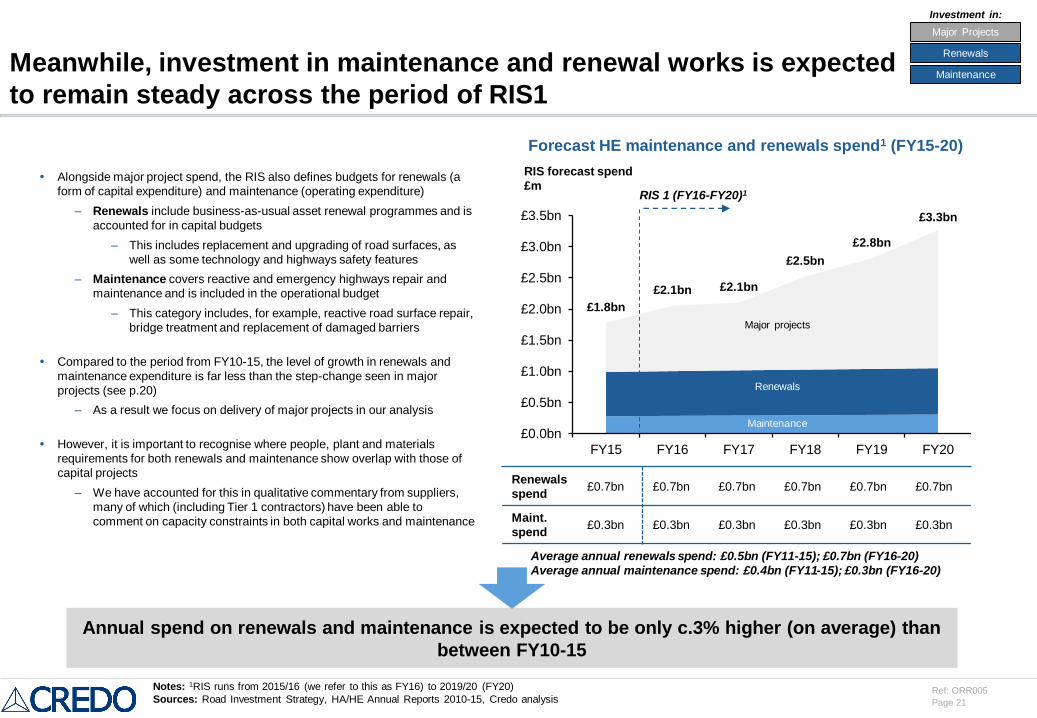
Meanwhile, investment in maintenance and renewal works is expected
to remain steady across the period of RIS1
Alongside major project spend, the RIS also defines budgets for renewals (a
form of capital expenditure) and maintenance (operating expenditure)
– Renewals include business-as-usual asset renewal programmes and is
accounted for in capital budgets
– This includes replacement and upgrading of road surfaces, as
well as some technology and highways safety features
– Maintenance covers reactive and emergency highways repair and
maintenance and is included in the operational budget
– This category includes, for example, reactive road surface repair,
bridge treatment and replacement of damaged barriers
Compared to the period from FY10-15, the level of growth in renewals and
maintenance expenditure is far less than the step-change seen in major
projects (see p.20)
– As a result we focus on delivery of major projects in our analysis
However, it is important to recognise where people, plant and materials
requirements for both renewals and maintenance show overlap with those of
capital projects
– We have accounted for this in qualitative commentary from suppliers,
many of which (including Tier 1 contractors) have been able to
comment on capacity constraints in both capital works and maintenance
Forecast HE maintenance and renewals spend1 (FY15-20)
Annual spend on renewals and maintenance is expected to be only c.3% higher (on average) than
between FY10-15
Notes: 1RIS runs from 2015/16 (we refer to this as FY16) to 2019/20 (FY20)
Sources: Road Investment Strategy, HA/HE Annual Reports 2010-15, Credo analysis
RIS forecast spend
£m
Major Projects
Renewals
Maintenance
Investment in:
£1.8bn
£2.1bn £2.1bn
£2.5bn
£2.8bn
£3.3bn
£0.0bn
£0.5bn
£1.0bn
£1.5bn
£2.0bn
£2.5bn
£3.0bn
£3.5bn
FY15 FY16 FY17 FY18 FY19 FY20
Maintenance
Renewals
Major projects
Renewals
spend£0.7bn £0.7bn £0.7bn £0.7bn £0.7bn £0.7bn
Maint.
spend£0.3bn £0.3bn £0.3bn £0.3bn £0.3bn £0.3bn
Average annual renewals spend: £0.5bn (FY11-15); £0.7bn (FY16-20)
Average annual maintenance spend: £0.4bn (FY11-15); £0.3bn (FY16-20)
RIS 1 (FY16-FY20)1
Page 22
Ref: ORR005
Agenda
Executive summary
Market situation and background
– The Strategic Road Network and Highways England
– Historic and future investment profile
– Supply chain overview
Supply chain capacity assessment
HE approach to procurement and project management
Key Performance Indicators and recommendations for ORR
Appendix
Page 23
Ref: ORR005
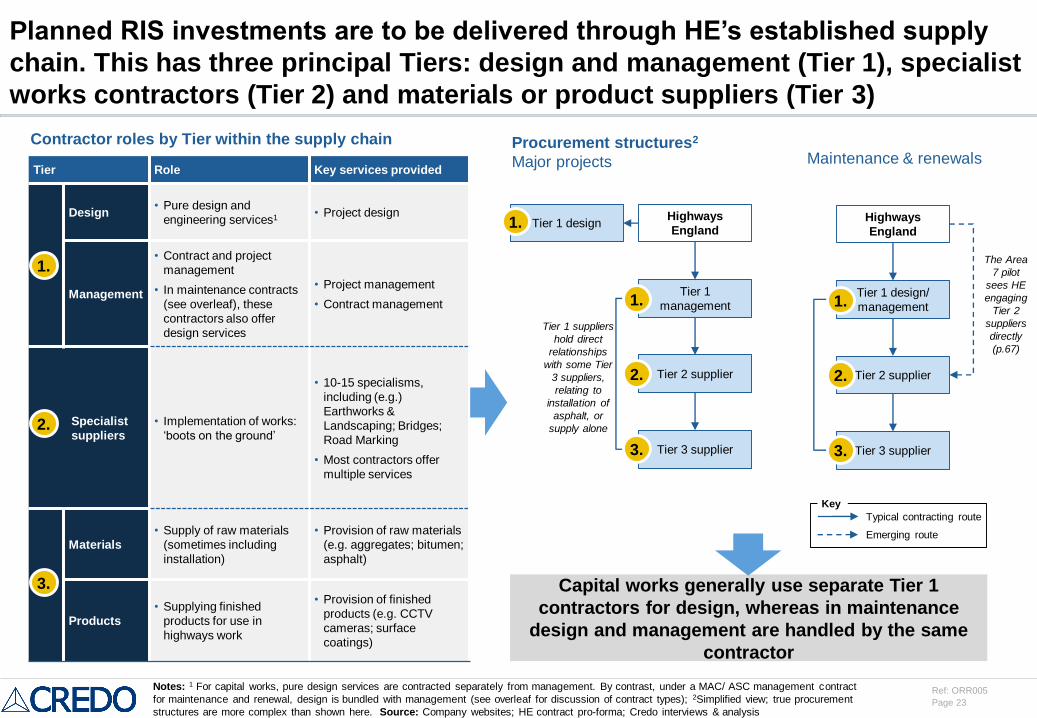
Planned RIS investments are to be delivered through HE’s established supply
chain. This has three principal Tiers: design and management (Tier 1), specialist
works contractors (Tier 2) and materials or product suppliers (Tier 3)
Tier Role Key services provided
Design• Pure design and
engineering services1 • Project design
Management
• Contract and project
management
• In maintenance contracts
(see overleaf), these
contractors also offer
design services
• Project management
• Contract management
Specialist
suppliers
• Implementation of works:
‘boots on the ground’
• 10-15 specialisms,
including (e.g.)
Earthworks &
Landscaping; Bridges;
Road Marking
• Most contractors offer
multiple services
Materials
• Supply of raw materials
(sometimes including
installation)
• Provision of raw materials
(e.g. aggregates; bitumen;
asphalt)
Products
• Supplying finished
products for use in
highways work
• Provision of finished
products (e.g. CCTV
cameras; surface
coatings)
3.
2.
1.
Highways
England
Tier 1 design/
management
Tier 2 supplier
Tier 3 supplier
The Area
7 pilot
sees HE
engaging
Tier 2
suppliers
directly
(p.67)
Procurement structures2
Major projects
Capital works generally use separate Tier 1
contractors for design, whereas in maintenance
design and management are handled by the same
contractor
Typical contracting route
Emerging route
Key
3.
2.
1.
Notes: 1 For capital works, pure design services are contracted separately from management. By contrast, under a MAC/ ASC management contract
for maintenance and renewal, design is bundled with management (see overleaf for discussion of contract types); 2Simplified view; true procurement
structures are more complex than shown here. Source: Company websites; HE contract pro-forma; Credo interviews & analysis
Highways
England
Tier 1
management
Tier 2 supplier
Tier 3 supplier
Tier 1 suppliers
hold direct
relationships
with some Tier
3 suppliers,
relating to
installation of
asphalt, or
supply alone
3.
2.
1.
Tier 1 design
Procurement Schematic
Maintenance & renewals
1.
Contractor roles by Tier within the supply chain
Page 24
Ref: ORR005
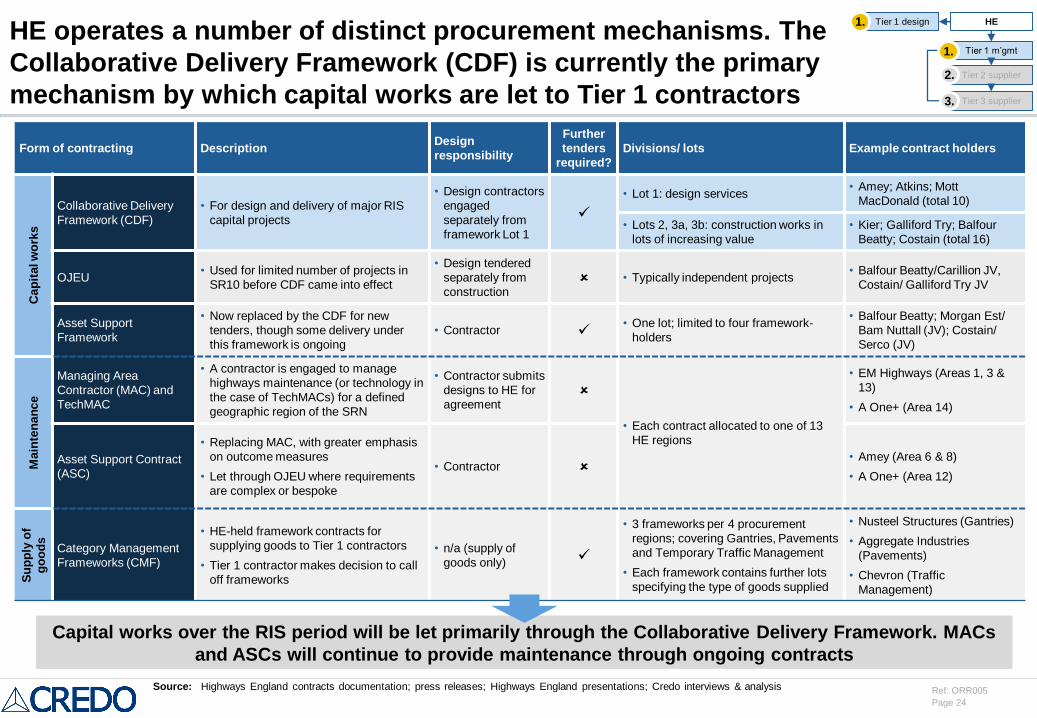
HE operates a number of distinct procurement mechanisms. The
Collaborative Delivery Framework (CDF) is currently the primary
mechanism by which capital works are let to Tier 1 contractors
Form of contracting DescriptionDesign
responsibility
Further
tenders
required?
Divisions/ lots Example contract holders
Cap
ital w
ork
s
Collaborative Delivery
Framework (CDF)
• For design and delivery of major RIS
capital projects
• Design contractors
engaged
separately from
framework Lot 1
• Lot 1: design services• Amey; Atkins; Mott
MacDonald (total 10)
• Lots 2, 3a, 3b: construction works in
lots of increasing value
• Kier; Galliford Try; Balfour
Beatty; Costain (total 16)
OJEU• Used for limited number of projects in
SR10 before CDF came into effect
• Design tendered
separately from
construction • Typically independent projects
• Balfour Beatty/Carillion JV,
Costain/ Galliford Try JV
Asset Support
Framework
• Now replaced by the CDF for new
tenders, though some delivery under
this framework is ongoing
• Contractor • One lot; limited to four framework-
holders
• Balfour Beatty; Morgan Est/
Bam Nuttall (JV); Costain/
Serco (JV)
Main
ten
an
ce
Managing Area
Contractor (MAC) and
TechMAC
• A contractor is engaged to manage
highways maintenance (or technology in
the case of TechMACs) for a defined
geographic region of the SRN
• Contractor submits
designs to HE for
agreement
• Each contract allocated to one of 13
HE regions
• EM Highways (Areas 1, 3 &
13)
• A One+ (Area 14)
Asset Support Contract
(ASC)
• Replacing MAC, with greater emphasis
on outcome measures
• Let through OJEU where requirements
are complex or bespoke
• Contractor
• Amey (Area 6 & 8)
• A One+ (Area 12)
Su
pp
lyo
f
go
od
s
Category Management
Frameworks (CMF)
• HE-held framework contracts for
supplying goods to Tier 1 contractors
• Tier 1 contractor makes decision to call
off frameworks
• n/a (supply of
goods only)
• 3 frameworks per 4 procurement
regions; covering Gantries, Pavements
and Temporary Traffic Management
• Each framework contains further lots
specifying the type of goods supplied
• Nusteel Structures (Gantries)
• Aggregate Industries
(Pavements)
• Chevron (Traffic
Management)
Capital works over the RIS period will be let primarily through the Collaborative Delivery Framework. MACs
and ASCs will continue to provide maintenance through ongoing contracts
Source: Highways England contracts documentation; press releases; Highways England presentations; Credo interviews & analysis
HE
Tier 1 m’gmt
Tier 2 supplier
Tier 3 supplier
2.
1.
Tier 1 design1.
3.
Page 25
Ref: ORR005
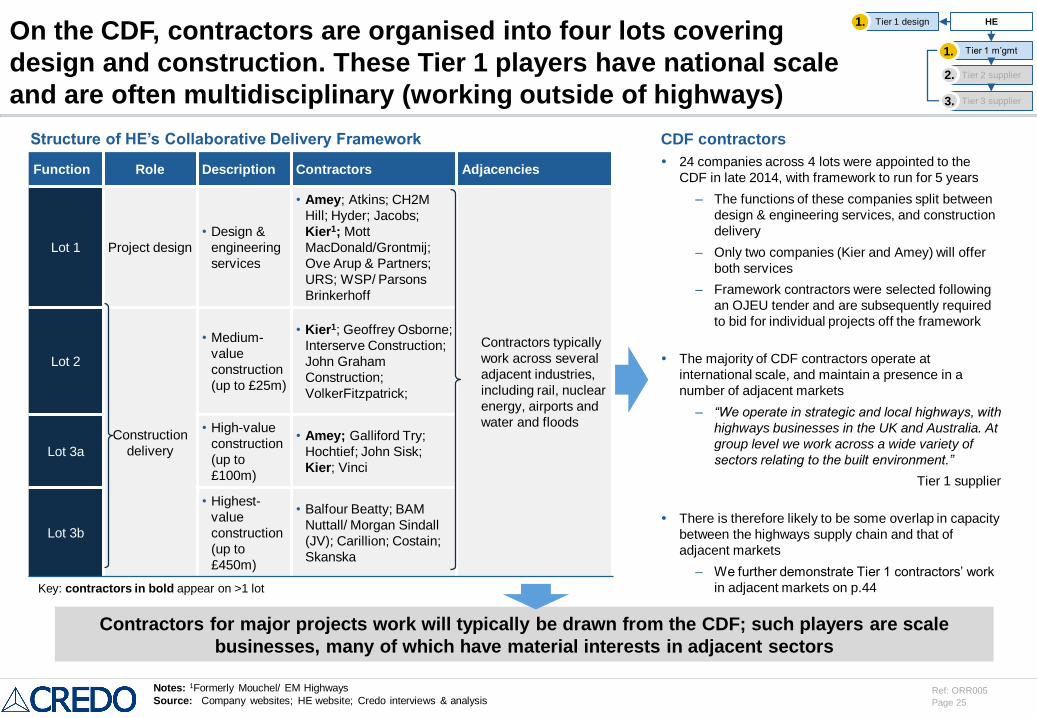
On the CDF, contractors are organised into four lots covering
design and construction. These Tier 1 players have national scale
and are often multidisciplinary (working outside of highways)
Function Role Description Contractors Adjacencies
Lot 1 Project design
• Design &
engineering
services
• Amey; Atkins; CH2M
Hill; Hyder; Jacobs;
Kier1; Mott
MacDonald/Grontmij;
Ove Arup & Partners;
URS; WSP/ Parsons
Brinkerhoff
Contractors typically
work across several
adjacent industries,
including rail, nuclear
energy, airports and
water and floods
Lot 2
Construction
delivery
• Medium-
value
construction
(up to £25m)
• Kier1; Geoffrey Osborne;
Interserve Construction;
John Graham
Construction;
VolkerFitzpatrick;
Lot 3a
• High-value
construction
(up to
£100m)
• Amey; Galliford Try;
Hochtief; John Sisk;
Kier; Vinci
Lot 3b
• Highest-
value
construction
(up to
£450m)
• Balfour Beatty; BAM
Nuttall/ Morgan Sindall
(JV); Carillion; Costain;
Skanska
Contractors for major projects work will typically be drawn from the CDF; such players are scale
businesses, many of which have material interests in adjacent sectors
Notes: 1Formerly Mouchel/ EM Highways
Source: Company websites; HE website; Credo interviews & analysis
CDF contractors
24 companies across 4 lots were appointed to the
CDF in late 2014, with framework to run for 5 years
– The functions of these companies split between
design & engineering services, and construction
delivery
– Only two companies (Kier and Amey) will offer
both services
– Framework contractors were selected following
an OJEU tender and are subsequently required
to bid for individual projects off the framework
The majority of CDF contractors operate at
international scale, and maintain a presence in a
number of adjacent markets
– “We operate in strategic and local highways, with
highways businesses in the UK and Australia. At
group level we work across a wide variety of
sectors relating to the built environment.”
Tier 1 supplier
There is therefore likely to be some overlap in capacity
between the highways supply chain and that of
adjacent markets
– We further demonstrate Tier 1 contractors’ work
in adjacent markets on p.44Key: contractors in bold appear on >1 lot
Structure of HE’s Collaborative Delivery Framework
HE
Tier 1 m’gmt
Tier 2 supplier
Tier 3 supplier
2.
1.
Tier 1 design1.
3.
Page 26
Ref: ORR005
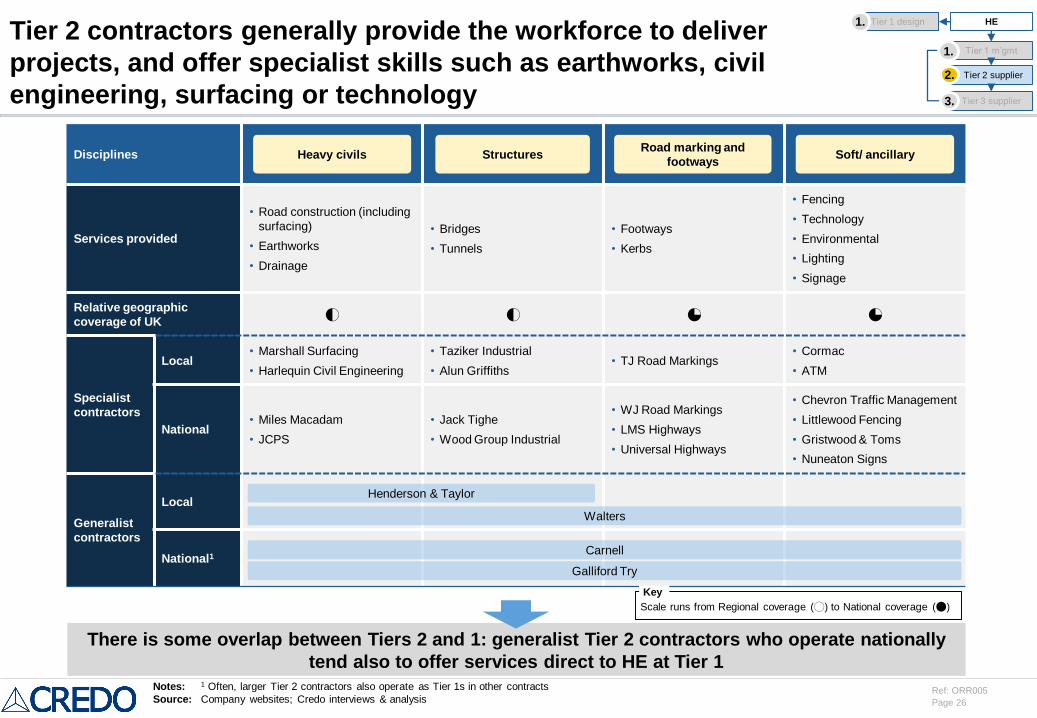
Disciplines
Services provided
• Road construction (including
surfacing)
• Earthworks
• Drainage
• Bridges
• Tunnels
• Footways
• Kerbs
• Fencing
• Technology
• Environmental
• Lighting
• Signage
Relative geographic
coverage of UK6 6 5 5
Specialist
contractors
Local• Marshall Surfacing
• Harlequin Civil Engineering
• Taziker Industrial
• Alun Griffiths• TJ Road Markings
• Cormac
• ATM
National• Miles Macadam
• JCPS
• Jack Tighe
• Wood Group Industrial
• WJ Road Markings
• LMS Highways
• Universal Highways
• Chevron Traffic Management
• Littlewood Fencing
• Gristwood & Toms
• Nuneaton Signs
Generalist
contractors
Local
National1
Tier 2 contractors generally provide the workforce to deliver
projects, and offer specialist skills such as earthworks, civil
engineering, surfacing or technology
There is some overlap between Tiers 2 and 1: generalist Tier 2 contractors who operate nationally
tend also to offer services direct to HE at Tier 1
Road marking and
footwaysHeavy civils Structures Soft/ ancillary
Henderson & Taylor
Carnell
Galliford Try
Notes: 1 Often, larger Tier 2 contractors also operate as Tier 1s in other contracts
Source: Company websites; Credo interviews & analysis
Walters
HE
Tier 1 m’gmt
Tier 2 supplier
Tier 3 supplier
2.
1.
Tier 1 design1.
3.
Scale runs from Regional coverage (0) to National coverage (4)
Key
Page 27
Ref: ORR005
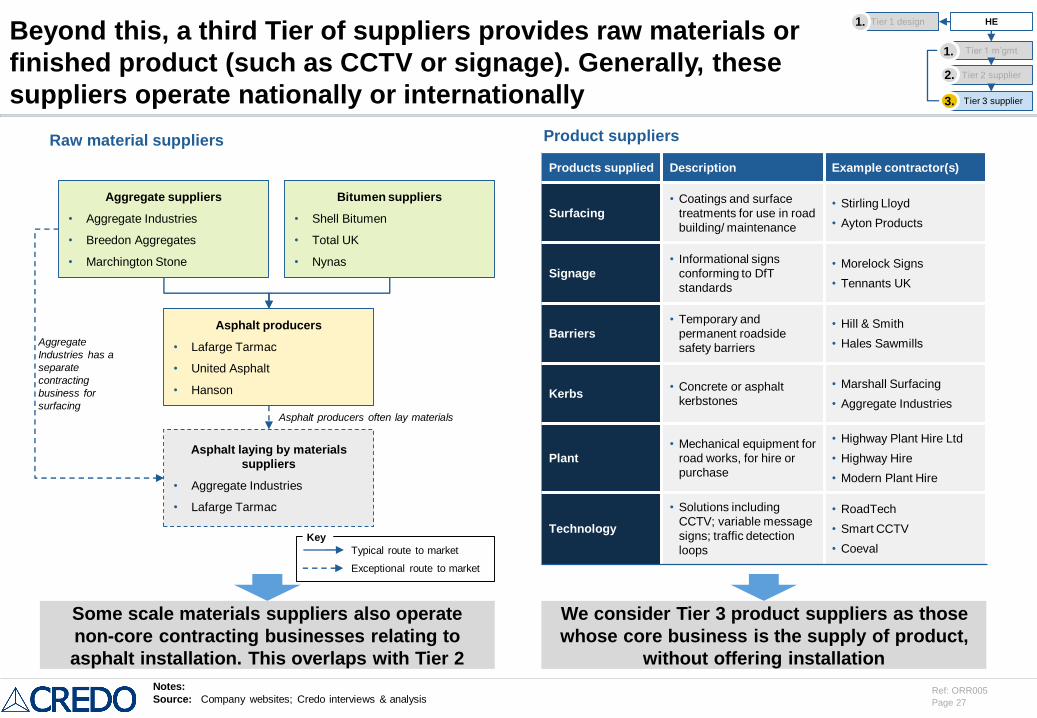
Beyond this, a third Tier of suppliers provides raw materials or
finished product (such as CCTV or signage). Generally, these
suppliers operate nationally or internationally
Raw material suppliers Product suppliers
Products supplied Description Example contractor(s)
Surfacing
• Coatings and surface
treatments for use in road
building/ maintenance
• Stirling Lloyd
• Ayton Products
Signage
• Informational signs
conforming to DfT
standards
• Morelock Signs
• Tennants UK
Barriers
• Temporary and
permanent roadside
safety barriers
• Hill & Smith
• Hales Sawmills
Kerbs• Concrete or asphalt
kerbstones
• Marshall Surfacing
• Aggregate Industries
Plant
• Mechanical equipment for
road works, for hire or
purchase
• Highway Plant Hire Ltd
• Highway Hire
• Modern Plant Hire
Technology
• Solutions including
CCTV; variable message
signs; traffic detection
loops
• RoadTech
• Smart CCTV
• Coeval
Some scale materials suppliers also operate
non-core contracting businesses relating to
asphalt installation. This overlaps with Tier 2
We consider Tier 3 product suppliers as those
whose core business is the supply of product,
without offering installation
Aggregate suppliers
• Aggregate Industries
• Breedon Aggregates
• Marchington Stone
Bitumen suppliers
• Shell Bitumen
• Total UK
• Nynas
Asphalt producers
• Lafarge Tarmac
• United Asphalt
• Hanson
Asphalt laying by materials
suppliers
• Aggregate Industries
• Lafarge Tarmac
Notes:
Source: Company websites; Credo interviews & analysis
Typical route to market
Exceptional route to market
Key
Asphalt producers often lay materials
Aggregate
Industries has a
separate
contracting
business for
surfacing
HE
Tier 1 m’gmt
Tier 2 supplier
Tier 3 supplier
2.
1.
Tier 1 design1.
3.
Page 28
Ref: ORR005
Agenda
Executive summary
Market situation and background
Supply chain capacity assessment
– Core HE demand
– Other infrastructure demand
– Assessment of deliverability and identified risks
HE approach to procurement and project management
Key Performance Indicators and recommendations for ORR
Appendix
Page 29
Ref: ORR005
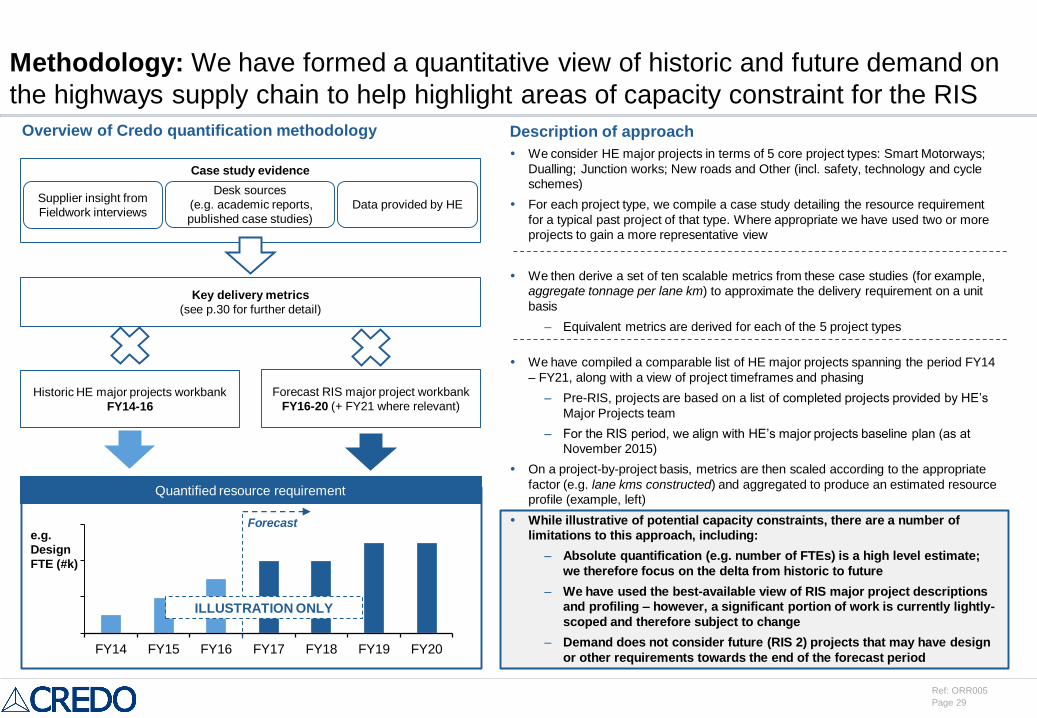
Methodology: We have formed a quantitative view of historic and future demand on
the highways supply chain to help highlight areas of capacity constraint for the RIS
Case study evidence
Key delivery metrics
(see p.30 for further detail)
Overview of Credo quantification methodology
FY14 FY15 FY16 FY17 FY18 FY19 FY20
ILLUSTRATION ONLY
Forecast
Quantified resource requirement
Historic HE major projects workbank
FY14-16
Forecast RIS major project workbank
FY16-20 (+ FY21 where relevant)
Supplier insight from
Fieldwork interviews
Desk sources
(e.g. academic reports,
published case studies)
Data provided by HE
e.g.
Design
FTE (#k)
Description of approach
We consider HE major projects in terms of 5 core project types: Smart Motorways;
Dualling; Junction works; New roads and Other (incl. safety, technology and cycle
schemes)
For each project type, we compile a case study detailing the resource requirement
for a typical past project of that type. Where appropriate we have used two or more
projects to gain a more representative view
We then derive a set of ten scalable metrics from these case studies (for example,
aggregate tonnage per lane km) to approximate the delivery requirement on a unit
basis
– Equivalent metrics are derived for each of the 5 project types
We have compiled a comparable list of HE major projects spanning the period FY14
– FY21, along with a view of project timeframes and phasing
– Pre-RIS, projects are based on a list of completed projects provided by HE’s
Major Projects team
– For the RIS period, we align with HE’s major projects baseline plan (as at
November 2015)
On a project-by-project basis, metrics are then scaled according to the appropriate
factor (e.g. lane kms constructed) and aggregated to produce an estimated resource
profile (example, left)
While illustrative of potential capacity constraints, there are a number of
limitations to this approach, including:
– Absolute quantification (e.g. number of FTEs) is a high level estimate;
we therefore focus on the delta from historic to future
– We have used the best-available view of RIS major project descriptions
and profiling – however, a significant portion of work is currently lightly-
scoped and therefore subject to change
– Demand does not consider future (RIS 2) projects that may have design
or other requirements towards the end of the forecast period
Page 30
Ref: ORR005
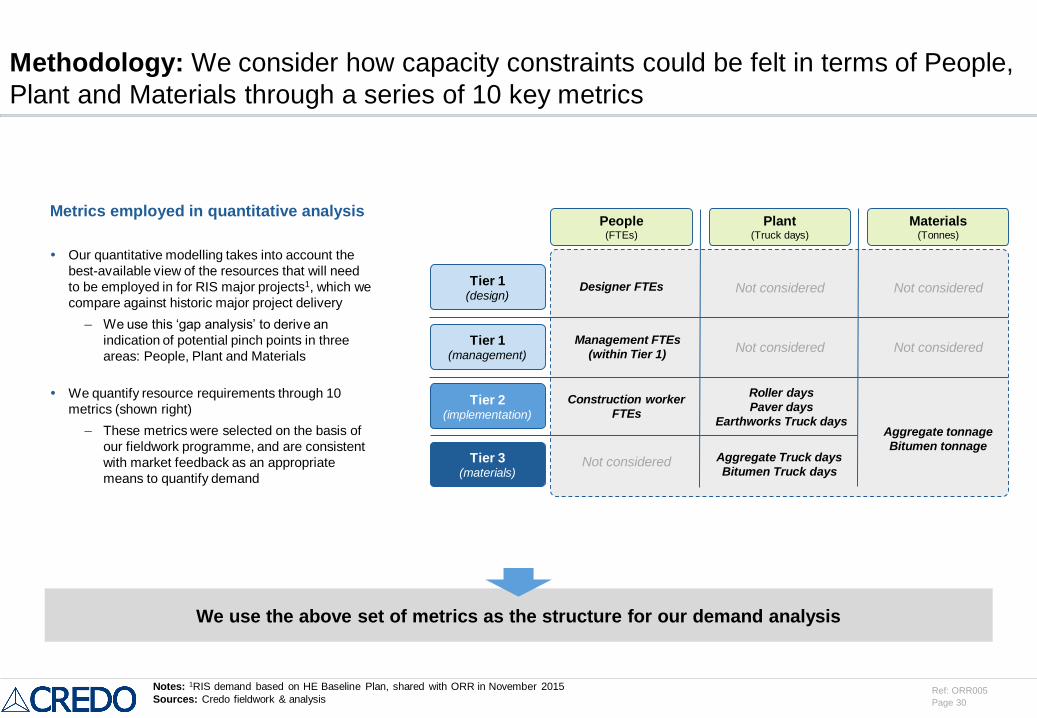
Methodology: We consider how capacity constraints could be felt in terms of People,
Plant and Materials through a series of 10 key metrics
We use the above set of metrics as the structure for our demand analysis
Metrics employed in quantitative analysis
Our quantitative modelling takes into account the
best-available view of the resources that will need
to be employed in for RIS major projects1, which we
compare against historic major project delivery
– We use this ‘gap analysis’ to derive an
indication of potential pinch points in three
areas: People, Plant and Materials
We quantify resource requirements through 10
metrics (shown right)
– These metrics were selected on the basis of
our fieldwork programme, and are consistent
with market feedback as an appropriate
means to quantify demand
Tier 1 (design)
Tier 2 (implementation)
People(FTEs)
Plant(Truck days)
Materials(Tonnes)
Tier 3 (materials)
Tier 1 (management)
Designer FTEs Not considered
Construction worker
FTEs
Management FTEs
(within Tier 1)
Not considered
Not considered
Roller days
Paver days
Earthworks Truck days
Aggregate Truck days
Bitumen Truck days
Aggregate tonnage
Bitumen tonnage
Not considered
Not considered
Notes: 1RIS demand based on HE Baseline Plan, shared with ORR in November 2015
Sources: Credo fieldwork & analysis
Page 31
Ref: ORR005
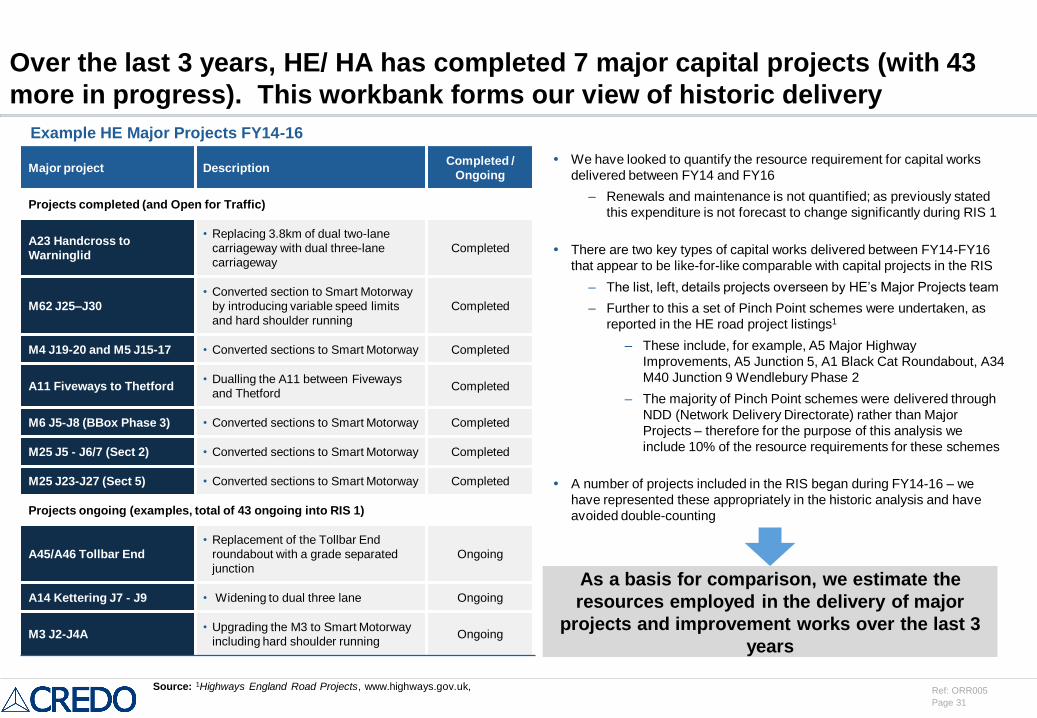
Over the last 3 years, HE/ HA has completed 7 major capital projects (with 43
more in progress). This workbank forms our view of historic delivery
We have looked to quantify the resource requirement for capital works
delivered between FY14 and FY16
– Renewals and maintenance is not quantified; as previously stated
this expenditure is not forecast to change significantly during RIS 1
There are two key types of capital works delivered between FY14-FY16
that appear to be like-for-like comparable with capital projects in the RIS
– The list, left, details projects overseen by HE’s Major Projects team
– Further to this a set of Pinch Point schemes were undertaken, as
reported in the HE road project listings1
– These include, for example, A5 Major Highway
Improvements, A5 Junction 5, A1 Black Cat Roundabout, A34
M40 Junction 9 Wendlebury Phase 2
– The majority of Pinch Point schemes were delivered through
NDD (Network Delivery Directorate) rather than Major
Projects – therefore for the purpose of this analysis we
include 10% of the resource requirements for these schemes
A number of projects included in the RIS began during FY14-16 – we
have represented these appropriately in the historic analysis and have
avoided double-counting
Major project DescriptionCompleted /
Ongoing
Projects completed (and Open for Traffic)
A23 Handcross to
Warninglid
• Replacing 3.8km of dual two-lane
carriageway with dual three-lane
carriageway
Completed
M62 J25–J30
• Converted section to Smart Motorway
by introducing variable speed limits
and hard shoulder running
Completed
M4 J19-20 and M5 J15-17 • Converted sections to Smart Motorway Completed
A11 Fiveways to Thetford• Dualling the A11 between Fiveways
and ThetfordCompleted
M6 J5-J8 (BBox Phase 3) • Converted sections to Smart Motorway Completed
M25 J5 - J6/7 (Sect 2) • Converted sections to Smart Motorway Completed
M25 J23-J27 (Sect 5) • Converted sections to Smart Motorway Completed
Projects ongoing (examples, total of 43 ongoing into RIS 1)
A45/A46 Tollbar End
• Replacement of the Tollbar End
roundabout with a grade separated
junction
Ongoing
A14 Kettering J7 - J9 • Widening to dual three lane Ongoing
M3 J2-J4A• Upgrading the M3 to Smart Motorway
including hard shoulder runningOngoing
Example HE Major Projects FY14-16
As a basis for comparison, we estimate the
resources employed in the delivery of major
projects and improvement works over the last 3
years
Source: 1Highways England Road Projects, www.highways.gov.uk,
Page 32
Ref: ORR005
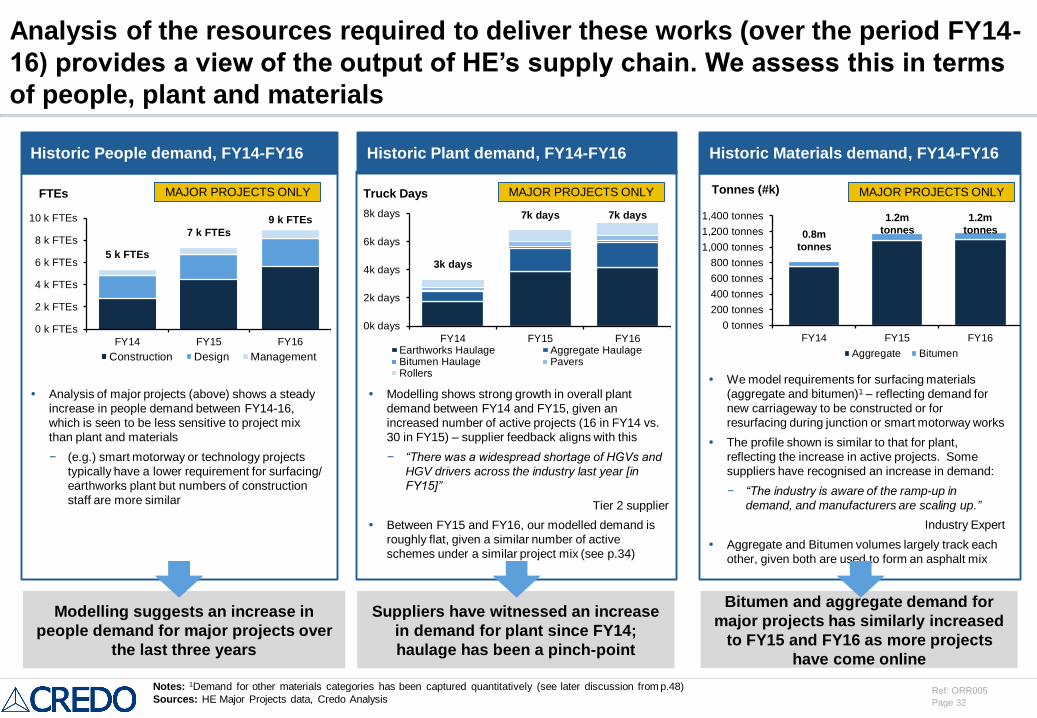
0.8m
tonnes
1.2m
tonnes
1.2m
tonnes
0 tonnes
200 tonnes
400 tonnes
600 tonnes
800 tonnes
1,000 tonnes
1,200 tonnes
1,400 tonnes
FY14 FY15 FY16
Aggregate Bitumen
Analysis of the resources required to deliver these works (over the period FY14-
16) provides a view of the output of HE’s supply chain. We assess this in terms
of people, plant and materials
Historic People demand, FY14-FY16 Historic Plant demand, FY14-FY16 Historic Materials demand, FY14-FY16
Modelling suggests an increase in
people demand for major projects over
the last three years
Analysis of major projects (above) shows a steady
increase in people demand between FY14-16,
which is seen to be less sensitive to project mix
than plant and materials
− (e.g.) smart motorway or technology projects
typically have a lower requirement for surfacing/
earthworks plant but numbers of construction
staff are more similar
Truck Days
Modelling shows strong growth in overall plant
demand between FY14 and FY15, given an
increased number of active projects (16 in FY14 vs.
30 in FY15) – supplier feedback aligns with this
− “There was a widespread shortage of HGVs and
HGV drivers across the industry last year [in
FY15]”
Tier 2 supplier
Between FY15 and FY16, our modelled demand is
roughly flat, given a similar number of active
schemes under a similar project mix (see p.34)
We model requirements for surfacing materials
(aggregate and bitumen)1 – reflecting demand for
new carriageway to be constructed or for
resurfacing during junction or smart motorway works
The profile shown is similar to that for plant,
reflecting the increase in active projects. Some
suppliers have recognised an increase in demand:
− “The industry is aware of the ramp-up in
demand, and manufacturers are scaling up.”
Industry Expert
Aggregate and Bitumen volumes largely track each
other, given both are used to form an asphalt mix
Tonnes (#k)
Suppliers have witnessed an increase
in demand for plant since FY14;
haulage has been a pinch-point
Bitumen and aggregate demand for
major projects has similarly increased
to FY15 and FY16 as more projects
have come online
5 k FTEs
7 k FTEs
9 k FTEs
0 k FTEs
2 k FTEs
4 k FTEs
6 k FTEs
8 k FTEs
10 k FTEs
FY14 FY15 FY16
Construction Design Management
3k days
7k days 7k days
0k days
2k days
4k days
6k days
8k days
FY14 FY15 FY16Earthworks Haulage Aggregate HaulageBitumen Haulage PaversRollers
FTEs
Notes: 1Demand for other materials categories has been captured quantitatively (see later discussion from p.48)
Sources: HE Major Projects data, Credo Analysis
MAJOR PROJECTS ONLY MAJOR PROJECTS ONLY MAJOR PROJECTS ONLY
Page 33
Ref: ORR005
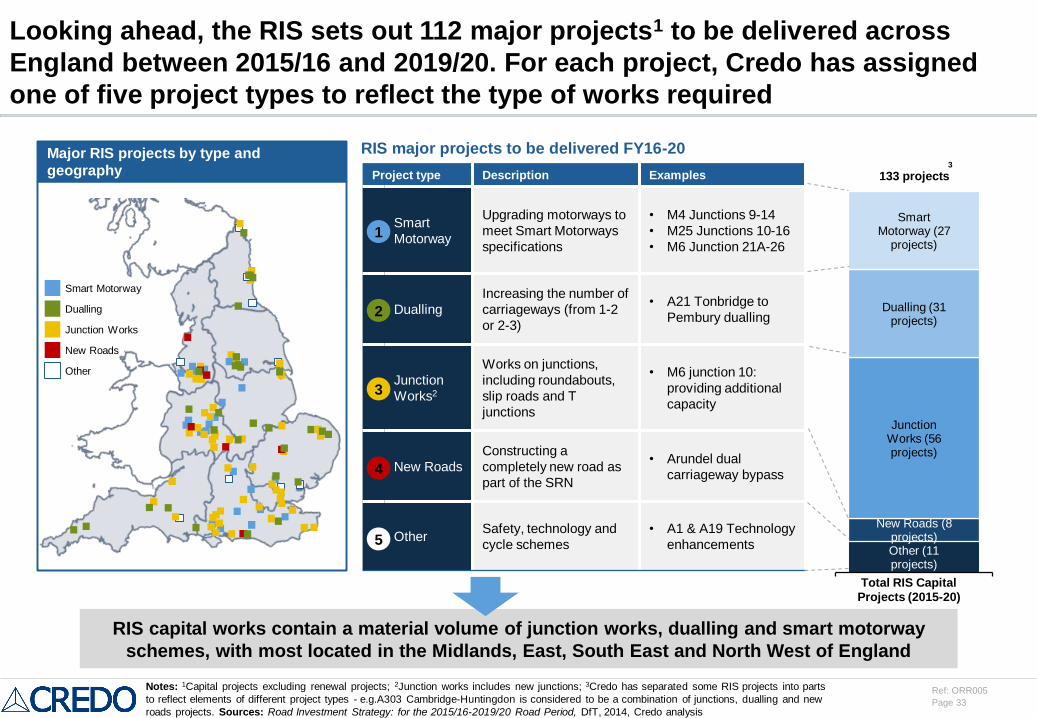
Other (11 projects)
New Roads (8 projects)
Junction Works (56 projects)
Dualling (31 projects)
Smart Motorway (27
projects)
133 projects
Looking ahead, the RIS sets out 112 major projects1 to be delivered across
England between 2015/16 and 2019/20. For each project, Credo has assigned
one of five project types to reflect the type of works required
Notes: 1Capital projects excluding renewal projects; 2Junction works includes new junctions; 3Credo has separated some RIS projects into parts
to reflect elements of different project types - e.g.A303 Cambridge-Huntingdon is considered to be a combination of junctions, dualling and new
roads projects. Sources: Road Investment Strategy: for the 2015/16-2019/20 Road Period, DfT, 2014, Credo analysis
RIS capital works contain a material volume of junction works, dualling and smart motorway
schemes, with most located in the Midlands, East, South East and North West of England
Project type Description Examples
Smart
Motorway
Upgrading motorways to
meet Smart Motorways
specifications
• M4 Junctions 9-14
• M25 Junctions 10-16
• M6 Junction 21A-26
Dualling
Increasing the number of
carriageways (from 1-2
or 2-3)
• A21 Tonbridge to
Pembury dualling
Junction
Works2
Works on junctions,
including roundabouts,
slip roads and T
junctions
• M6 junction 10:
providing additional
capacity
New Roads
Constructing a
completely new road as
part of the SRN
• Arundel dual
carriageway bypass
OtherSafety, technology and
cycle schemes
• A1 & A19 Technology
enhancements
Smart Motorway
Dualling
Junction Works
New Roads
Other
1
2
3
4
5
Major RIS projects by type and
geography
Total RIS Capital
Projects (2015-20)
3
RIS major projects to be delivered FY16-20
Page 34
Ref: ORR005
5
11 1214
68
38
38
1
47
10
108
20
14
1
3
23
12
5
5
9
9 9
9
1110
1811
45 4
2 2
0%
10%
20%
30%
40%
50%
60%
70%
80%
90%
100%
FY14 FY15 FY16 FY17 FY18 FY19 FY20 FY21
Dualling Junctions New roads Smart motorways Other
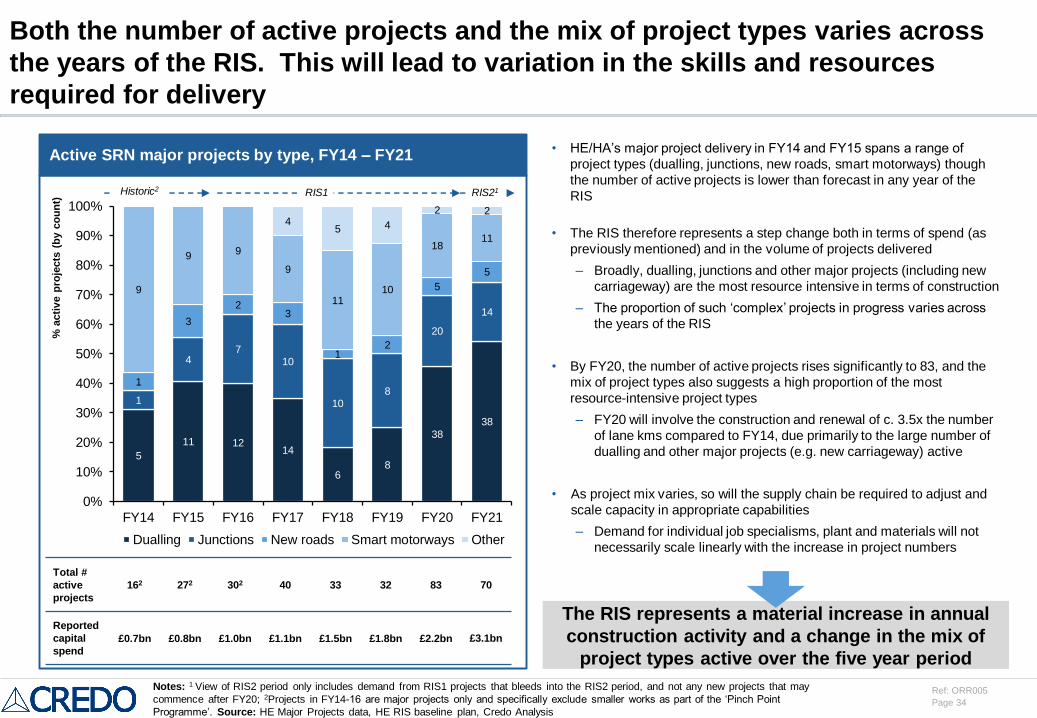
• HE/HA’s major project delivery in FY14 and FY15 spans a range of
project types (dualling, junctions, new roads, smart motorways) though
the number of active projects is lower than forecast in any year of the
RIS
• The RIS therefore represents a step change both in terms of spend (as
previously mentioned) and in the volume of projects delivered
– Broadly, dualling, junctions and other major projects (including new
carriageway) are the most resource intensive in terms of construction
– The proportion of such ‘complex’ projects in progress varies across
the years of the RIS
• By FY20, the number of active projects rises significantly to 83, and the
mix of project types also suggests a high proportion of the most
resource-intensive project types
– FY20 will involve the construction and renewal of c. 3.5x the number
of lane kms compared to FY14, due primarily to the large number of
dualling and other major projects (e.g. new carriageway) active
• As project mix varies, so will the supply chain be required to adjust and
scale capacity in appropriate capabilities
– Demand for individual job specialisms, plant and materials will not
necessarily scale linearly with the increase in project numbers
Both the number of active projects and the mix of project types varies across
the years of the RIS. This will lead to variation in the skills and resources
required for delivery
Active SRN major projects by type, FY14 – FY21
The RIS represents a material increase in annual
construction activity and a change in the mix of
project types active over the five year period
Notes: 1 View of RIS2 period only includes demand from RIS1 projects that bleeds into the RIS2 period, and not any new projects that may
commence after FY20; 2Projects in FY14-16 are major projects only and specifically exclude smaller works as part of the ‘Pinch Point
Programme’. Source: HE Major Projects data, HE RIS baseline plan, Credo Analysis
Total #
active
projects
162 272 302 40 33 32 83 70
Reported
capital
spend
£0.7bn £0.8bn £1.0bn £1.1bn £1.5bn £1.8bn £2.2bn £3.1bn
RIS1 RIS21Historic2
% a
cti
ve p
roje
cts
(b
y c
ou
nt)
Page 35
Ref: ORR005
0
1,000
2,000
3,000
4,000
FY16 FY17 FY18 FY19 FY20 FY21
0
5
10
15
20
25
FY16 FY17 FY18 FY19 FY20 FY21
0
5
10
15
20
FY16 FY17 FY18 FY19 FY20 FY21
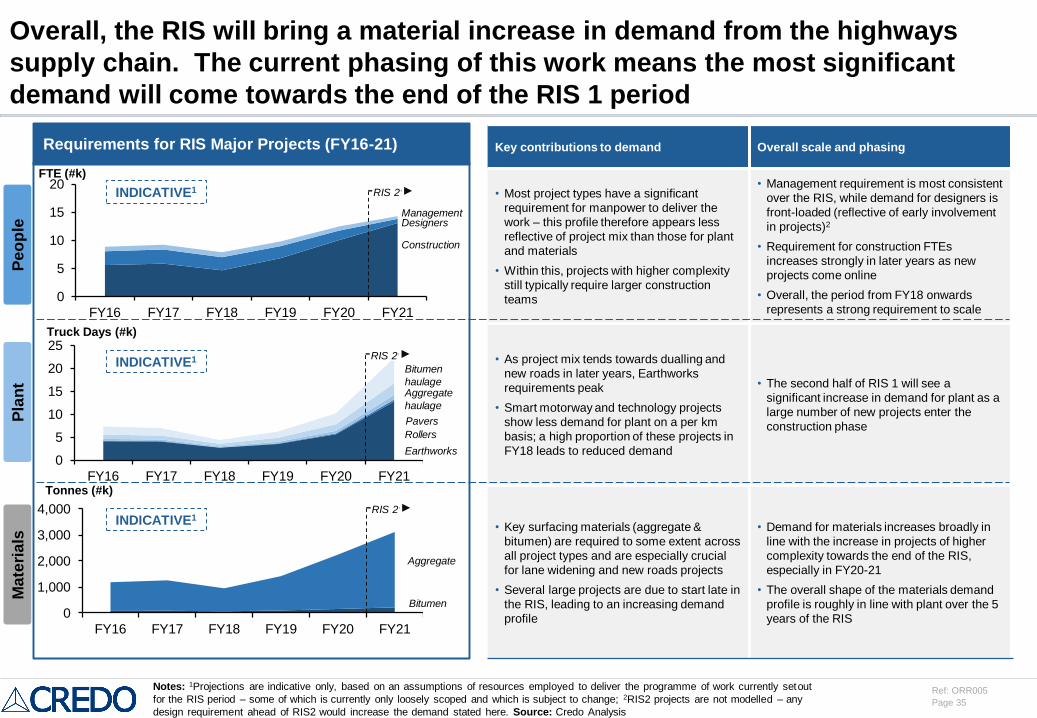
Key contributions to demand Overall scale and phasing
• Most project types have a significant
requirement for manpower to deliver the
work – this profile therefore appears less
reflective of project mix than those for plant
and materials
• Within this, projects with higher complexity
still typically require larger construction
teams
• Management requirement is most consistent
over the RIS, while demand for designers is
front-loaded (reflective of early involvement
in projects)2
• Requirement for construction FTEs
increases strongly in later years as new
projects come online
• Overall, the period from FY18 onwards
represents a strong requirement to scale
• As project mix tends towards dualling and
new roads in later years, Earthworks
requirements peak
• Smart motorway and technology projects
show less demand for plant on a per km
basis; a high proportion of these projects in
FY18 leads to reduced demand
• The second half of RIS 1 will see a
significant increase in demand for plant as a
large number of new projects enter the
construction phase
• Key surfacing materials (aggregate &
bitumen) are required to some extent across
all project types and are especially crucial
for lane widening and new roads projects
• Several large projects are due to start late in
the RIS, leading to an increasing demand
profile
• Demand for materials increases broadly in
line with the increase in projects of higher
complexity towards the end of the RIS,
especially in FY20-21
• The overall shape of the materials demand
profile is roughly in line with plant over the 5
years of the RIS
Overall, the RIS will bring a material increase in demand from the highways
supply chain. The current phasing of this work means the most significant
demand will come towards the end of the RIS 1 period
Requirements for RIS Major Projects (FY16-21)
Notes: 1Projections are indicative only, based on an assumptions of resources employed to deliver the programme of work currently setout
for the RIS period – some of which is currently only loosely scoped and which is subject to change; 2RIS2 projects are not modelled – any
design requirement ahead of RIS2 would increase the demand stated here. Source: Credo Analysis
ManagementDesigners
Construction
Rollers
Bitumen
Aggregate
Pe
op
leP
lan
tM
ate
ria
ls
Bitumen
haulage
Pavers
Earthworks
Aggregate
haulage
Truck Days (#k)
Tonnes (#k)
FTE (#k)
RIS 2
RIS 2
RIS 2
INDICATIVE1
INDICATIVE1
INDICATIVE1
Page 36
Ref: ORR005
Agenda
Executive summary
Market situation and background
Supply chain capacity assessment
– Core HE demand
– Other UK infrastructure demand
– Assessment of deliverability and identified risks
HE approach to procurement and project management
Key Performance Indicators and recommendations for ORR
Appendix
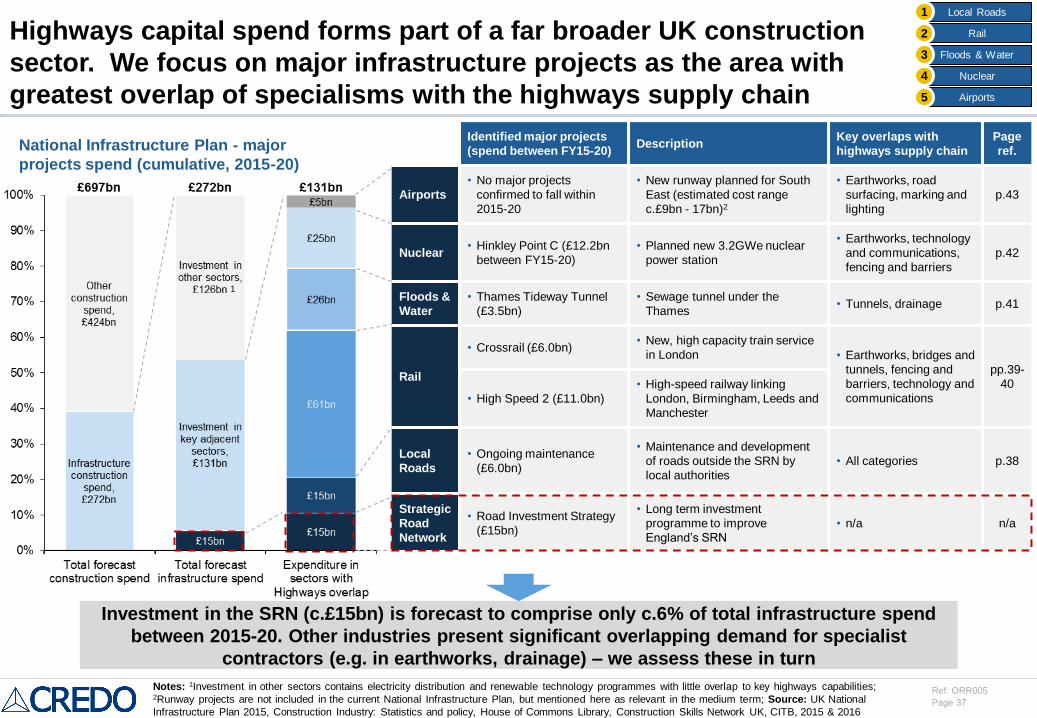
Page 37
Ref: ORR005
Highways capital spend forms part of a far broader UK construction
sector. We focus on major infrastructure projects as the area with
greatest overlap of specialisms with the highways supply chain
National Infrastructure Plan - major
projects spend (cumulative, 2015-20)
Investment in the SRN (c.£15bn) is forecast to comprise only c.6% of total infrastructure spend
between 2015-20. Other industries present significant overlapping demand for specialist
contractors (e.g. in earthworks, drainage) – we assess these in turn
Identified major projects
(spend between FY15-20)Description
Key overlaps with
highways supply chain
Page
ref.
Airports
• No major projects
confirmed to fall within
2015-20
• New runway planned for South
East (estimated cost range
c.£9bn - 17bn)2
• Earthworks, road
surfacing, marking and
lighting
p.43
Nuclear• Hinkley Point C (£12.2bn
between FY15-20)
• Planned new 3.2GWe nuclear
power station
• Earthworks, technology
and communications,
fencing and barriers
p.42
Floods &
Water
• Thames Tideway Tunnel
(£3.5bn)
• Sewage tunnel under the
Thames• Tunnels, drainage p.41
Rail
• Crossrail (£6.0bn)• New, high capacity train service
in London • Earthworks, bridges and
tunnels, fencing and
barriers, technology and
communications
pp.39-
40
• High Speed 2 (£11.0bn)
• High-speed railway linking
London, Birmingham, Leeds and
Manchester
Local
Roads
• Ongoing maintenance
(£6.0bn)
• Maintenance and development
of roads outside the SRN by
local authorities
• All categories p.38
Strategic
Road
Network
• Road Investment Strategy
(£15bn)
• Long term investment
programme to improve
England’s SRN
• n/a n/a
Notes: 1Investment in other sectors contains electricity distribution and renewable technology programmes with little overlap to key highways capabilities; 2Runway projects are not included in the current National Infrastructure Plan, but mentioned here as relevant in the medium term; Source: UK National
Infrastructure Plan 2015, Construction Industry: Statistics and policy, House of Commons Library, Construction Skills Network UK, CITB, 2015 & 2016
Local Roads1
Rail2
Floods & Water3
Nuclear4
Airports5
1
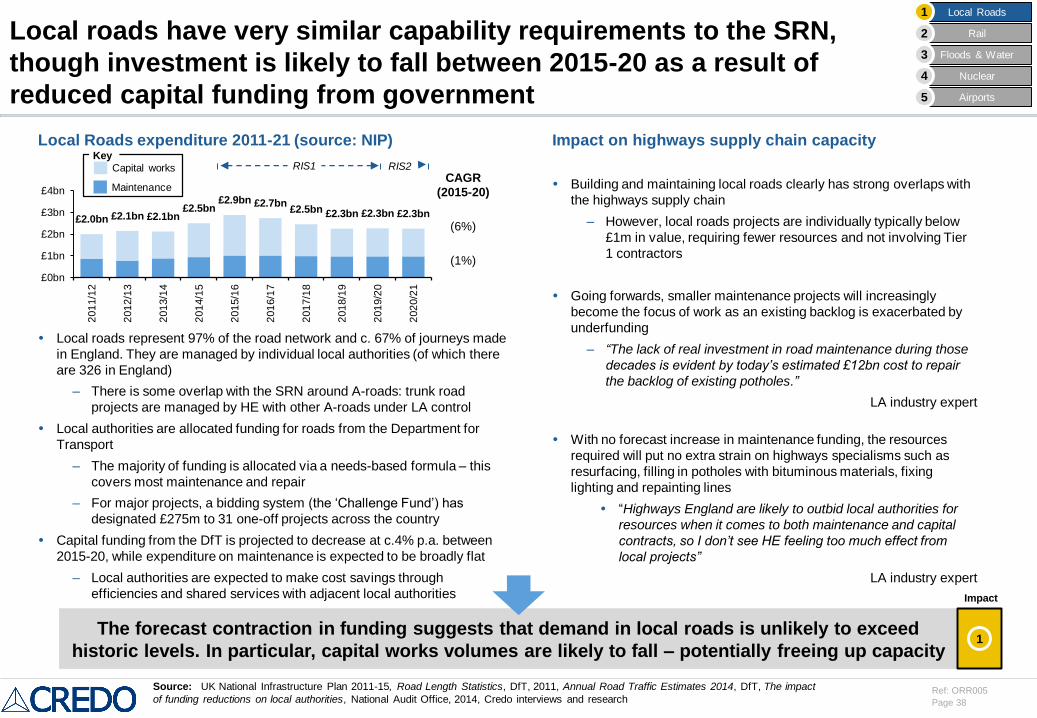
Page 38
Ref: ORR005
Local roads represent 97% of the road network and c. 67% of journeys made
in England. They are managed by individual local authorities (of which there
are 326 in England)
– There is some overlap with the SRN around A-roads: trunk road
projects are managed by HE with other A-roads under LA control
Local authorities are allocated funding for roads from the Department for
Transport
– The majority of funding is allocated via a needs-based formula – this
covers most maintenance and repair
– For major projects, a bidding system (the ‘Challenge Fund’) has
designated £275m to 31 one-off projects across the country
Capital funding from the DfT is projected to decrease at c.4% p.a. between
2015-20, while expenditure on maintenance is expected to be broadly flat
– Local authorities are expected to make cost savings through
efficiencies and shared services with adjacent local authorities
£2.0bn £2.1bn £2.1bn£2.5bn
£2.9bn £2.7bn£2.5bn £2.3bn £2.3bn £2.3bn
£0bn
£1bn
£2bn
£3bn
£4bn
201
1/1
2
201
2/1
3
201
3/1
4
201
4/1
5
201
5/1
6
201
6/1
7
201
7/1
8
201
8/1
9
201
9/2
0
202
0/2
1
Local roads have very similar capability requirements to the SRN,
though investment is likely to fall between 2015-20 as a result of
reduced capital funding from government
The forecast contraction in funding suggests that demand in local roads is unlikely to exceed
historic levels. In particular, capital works volumes are likely to fall – potentially freeing up capacity
Source: UK National Infrastructure Plan 2011-15, Road Length Statistics, DfT, 2011, Annual Road Traffic Estimates 2014, DfT, The impact
of funding reductions on local authorities, National Audit Office, 2014, Credo interviews and research
Impact on highways supply chain capacity
Building and maintaining local roads clearly has strong overlaps with
the highways supply chain
– However, local roads projects are individually typically below
£1m in value, requiring fewer resources and not involving Tier
1 contractors
Going forwards, smaller maintenance projects will increasingly
become the focus of work as an existing backlog is exacerbated by
underfunding
– “The lack of real investment in road maintenance during those
decades is evident by today’s estimated £12bn cost to repair
the backlog of existing potholes.”
LA industry expert
With no forecast increase in maintenance funding, the resources
required will put no extra strain on highways specialisms such as
resurfacing, filling in potholes with bituminous materials, fixing
lighting and repainting lines
“Highways England are likely to outbid local authorities for
resources when it comes to both maintenance and capital
contracts, so I don’t see HE feeling too much effect from
local projects”
LA industry expert
CAGR
(2015-20)
(6%)
(1%)
Maintenance
Capital works
Key
Local Roads1
Rail2
Floods & Water3
Nuclear4
Airports5
RIS1 RIS2
Local Roads expenditure 2011-21 (source: NIP)
1
Impact
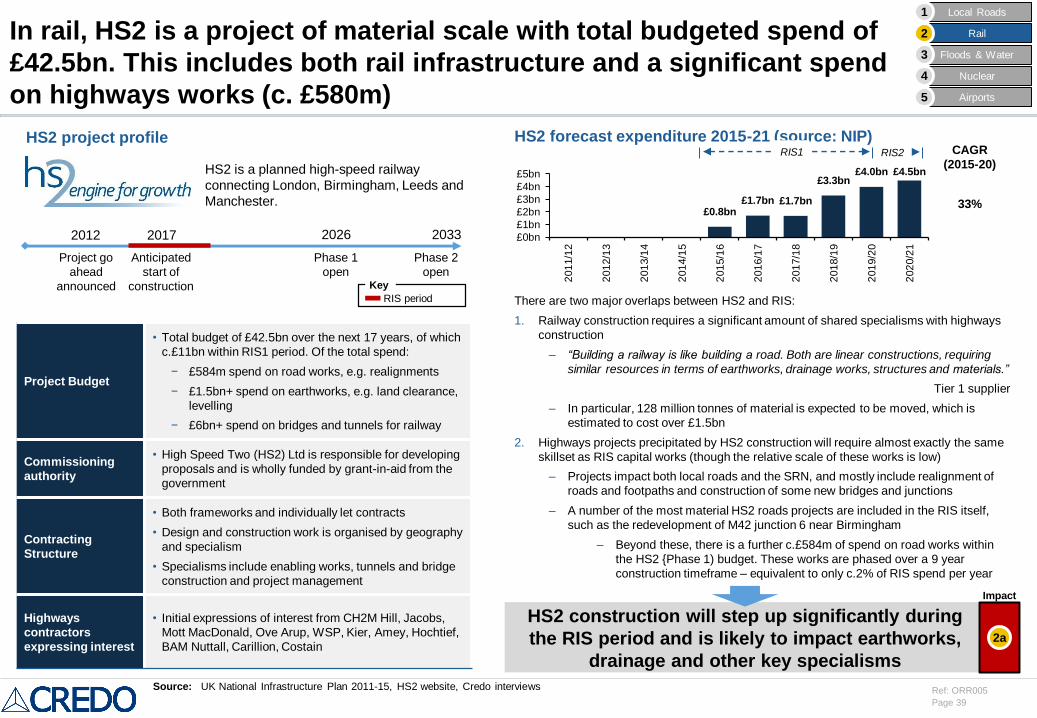
Page 39
Ref: ORR005
There are two major overlaps between HS2 and RIS:
1. Railway construction requires a significant amount of shared specialisms with highways
construction
– “Building a railway is like building a road. Both are linear constructions, requiring
similar resources in terms of earthworks, drainage works, structures and materials.”
Tier 1 supplier
– In particular, 128 million tonnes of material is expected to be moved, which is
estimated to cost over £1.5bn
2. Highways projects precipitated by HS2 construction will require almost exactly the same
skillset as RIS capital works (though the relative scale of these works is low)
– Projects impact both local roads and the SRN, and mostly include realignment of
roads and footpaths and construction of some new bridges and junctions
– A number of the most material HS2 roads projects are included in the RIS itself,
such as the redevelopment of M42 junction 6 near Birmingham
– Beyond these, there is a further c.£584m of spend on road works within
the HS2 {Phase 1) budget. These works are phased over a 9 year
construction timeframe – equivalent to only c.2% of RIS spend per year
In rail, HS2 is a project of material scale with total budgeted spend of
£42.5bn. This includes both rail infrastructure and a significant spend
on highways works (c. £580m)
Project Budget
• Total budget of £42.5bn over the next 17 years, of which
c.£11bn within RIS1 period. Of the total spend:
− £584m spend on road works, e.g. realignments
− £1.5bn+ spend on earthworks, e.g. land clearance,
levelling
− £6bn+ spend on bridges and tunnels for railway
Commissioning
authority
• High Speed Two (HS2) Ltd is responsible for developing
proposals and is wholly funded by grant-in-aid from the
government
Contracting
Structure
• Both frameworks and individually let contracts
• Design and construction work is organised by geography
and specialism
• Specialisms include enabling works, tunnels and bridge
construction and project management
Highways
contractors
expressing interest
• Initial expressions of interest from CH2M Hill, Jacobs,
Mott MacDonald, Ove Arup, WSP, Kier, Amey, Hochtief,
BAM Nuttall, Carillion, Costain
HS2 is a planned high-speed railway
connecting London, Birmingham, Leeds and
Manchester.
Project go
ahead
announced
2012 2017 2033
Anticipated
start of
construction
Phase 2
open
Phase 1
open
2026
HS2 construction will step up significantly during
the RIS period and is likely to impact earthworks,
drainage and other key specialisms
HS2 project profile
Source: UK National Infrastructure Plan 2011-15, HS2 website, Credo interviews
RIS period
Key
CAGR
(2015-20)
33%
2a
Local Roads1
Rail2
Floods & Water3
Nuclear4
Airports5
HS2 forecast expenditure 2015-21 (source: NIP)RIS1 RIS2
Impact
£0.8bn£1.7bn £1.7bn
£3.3bn£4.0bn £4.5bn
£0bn
£1bn
£2bn
£3bn
£4bn
£5bn
201
1/1
2
201
2/1
3
201
3/1
4
201
4/1
5
201
5/1
6
201
6/1
7
201
7/1
8
201
8/1
9
201
9/2
0
202
0/2
1
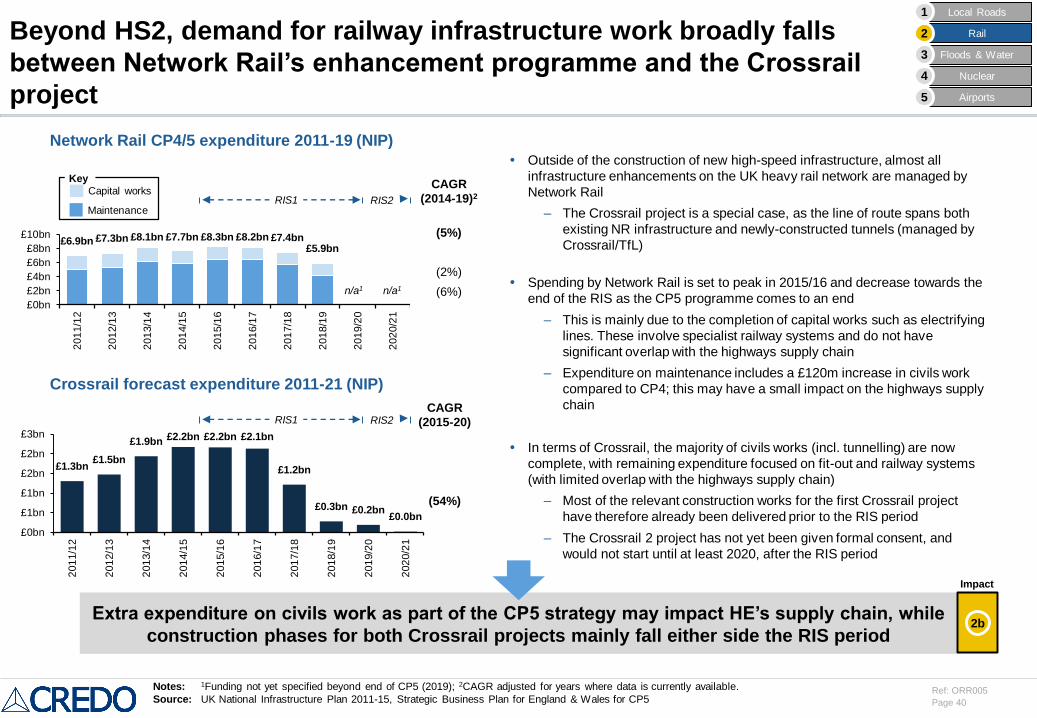
Page 40
Ref: ORR005
Network Rail CP4/5 expenditure 2011-19 (NIP)
Crossrail forecast expenditure 2011-21 (NIP)
Outside of the construction of new high-speed infrastructure, almost all
infrastructure enhancements on the UK heavy rail network are managed by
Network Rail
– The Crossrail project is a special case, as the line of route spans both
existing NR infrastructure and newly-constructed tunnels (managed by
Crossrail/TfL)
Spending by Network Rail is set to peak in 2015/16 and decrease towards the
end of the RIS as the CP5 programme comes to an end
– This is mainly due to the completion of capital works such as electrifying
lines. These involve specialist railway systems and do not have
significant overlap with the highways supply chain
– Expenditure on maintenance includes a £120m increase in civils work
compared to CP4; this may have a small impact on the highways supply
chain
In terms of Crossrail, the majority of civils works (incl. tunnelling) are now
complete, with remaining expenditure focused on fit-out and railway systems
(with limited overlap with the highways supply chain)
– Most of the relevant construction works for the first Crossrail project
have therefore already been delivered prior to the RIS period
– The Crossrail 2 project has not yet been given formal consent, and
would not start until at least 2020, after the RIS period
Beyond HS2, demand for railway infrastructure work broadly falls
between Network Rail’s enhancement programme and the Crossrail
project
Extra expenditure on civils work as part of the CP5 strategy may impact HE’s supply chain, while
construction phases for both Crossrail projects mainly fall either side the RIS period
Notes: 1Funding not yet specified beyond end of CP5 (2019); 2CAGR adjusted for years where data is currently available.
Source: UK National Infrastructure Plan 2011-15, Strategic Business Plan for England & Wales for CP5
CAGR
(2014-19)2
(5%)
(2%)
(6%)
CAGR
(2015-20)
(54%)
n/a1 n/a1
2b
Local Roads1
Rail2
Floods & Water3
Nuclear4
Airports5
RIS1 RIS2Maintenance
Capital works
Key
RIS1 RIS2
Impact
£1.3bn£1.5bn
£1.9bn £2.2bn £2.2bn £2.1bn
£1.2bn
£0.3bn £0.2bn£0.0bn
£0bn
£1bn
£1bn
£2bn
£2bn
£3bn
201
1/1
2
201
2/1
3
201
3/1
4
201
4/1
5
201
5/1
6
201
6/1
7
201
7/1
8
201
8/1
9
201
9/2
0
202
0/2
1
£6.9bn £7.3bn £8.1bn £7.7bn £8.3bn £8.2bn £7.4bn£5.9bn
£0bn
£2bn
£4bn
£6bn
£8bn
£10bn
201
1/1
2
201
2/1
3
201
3/1
4
201
4/1
5
201
5/1
6
201
6/1
7
201
7/1
8
201
8/1
9
201
9/2
0
202
0/2
1
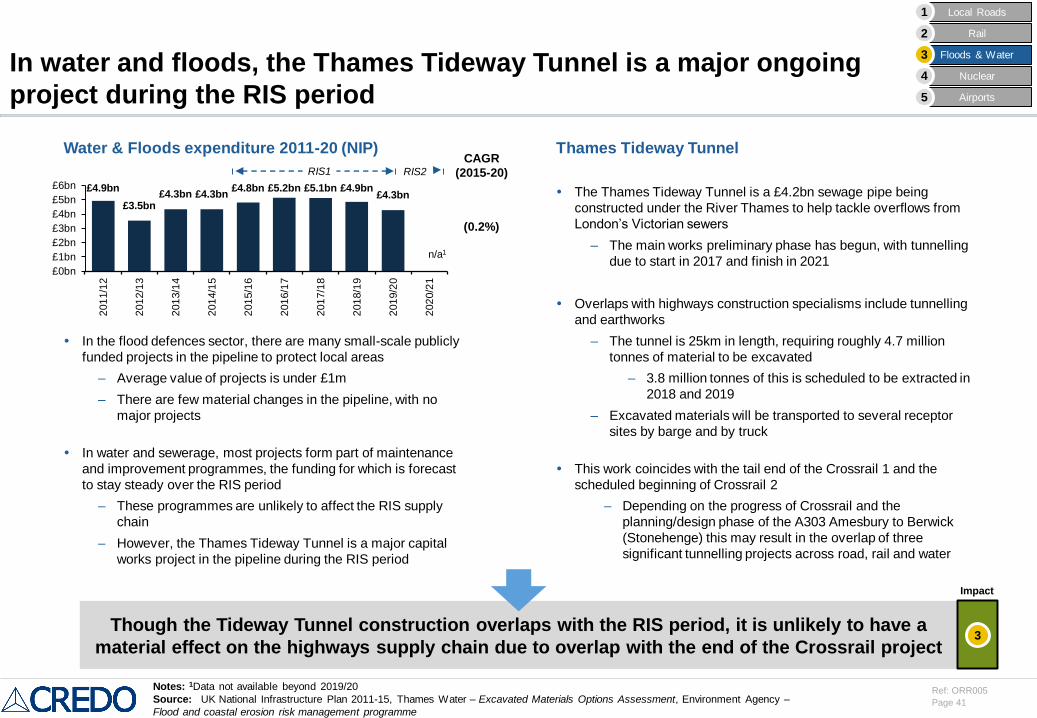
Page 41
Ref: ORR005
Water & Floods expenditure 2011-20 (NIP)
In the flood defences sector, there are many small-scale publicly
funded projects in the pipeline to protect local areas
– Average value of projects is under £1m
– There are few material changes in the pipeline, with no
major projects
In water and sewerage, most projects form part of maintenance
and improvement programmes, the funding for which is forecast
to stay steady over the RIS period
– These programmes are unlikely to affect the RIS supply
chain
– However, the Thames Tideway Tunnel is a major capital
works project in the pipeline during the RIS period
In water and floods, the Thames Tideway Tunnel is a major ongoing
project during the RIS period
Thames Tideway Tunnel
The Thames Tideway Tunnel is a £4.2bn sewage pipe being
constructed under the River Thames to help tackle overflows from
London’s Victorian sewers
– The main works preliminary phase has begun, with tunnelling
due to start in 2017 and finish in 2021
Overlaps with highways construction specialisms include tunnelling
and earthworks
– The tunnel is 25km in length, requiring roughly 4.7 million
tonnes of material to be excavated
– 3.8 million tonnes of this is scheduled to be extracted in
2018 and 2019
– Excavated materials will be transported to several receptor
sites by barge and by truck
This work coincides with the tail end of the Crossrail 1 and the
scheduled beginning of Crossrail 2
– Depending on the progress of Crossrail and the
planning/design phase of the A303 Amesbury to Berwick
(Stonehenge) this may result in the overlap of three
significant tunnelling projects across road, rail and water
Notes: 1Data not available beyond 2019/20
Source: UK National Infrastructure Plan 2011-15, Thames Water – Excavated Materials Options Assessment, Environment Agency –
Flood and coastal erosion risk management programme
Though the Tideway Tunnel construction overlaps with the RIS period, it is unlikely to have a
material effect on the highways supply chain due to overlap with the end of the Crossrail project
CAGR
(2015-20)
(0.2%)
n/a1
3
Local Roads1
Rail2
Floods & Water3
Nuclear4
Airports5
RIS1 RIS2
Impact
£4.9bn
£3.5bn£4.3bn £4.3bn
£4.8bn £5.2bn £5.1bn £4.9bn£4.3bn
£0bn
£1bn
£2bn
£3bn
£4bn
£5bn
£6bn
201
1/1
2
201
2/1
3
201
3/1
4
201
4/1
5
201
5/1
6
201
6/1
7
201
7/1
8
201
8/1
9
201
9/2
0
202
0/2
1
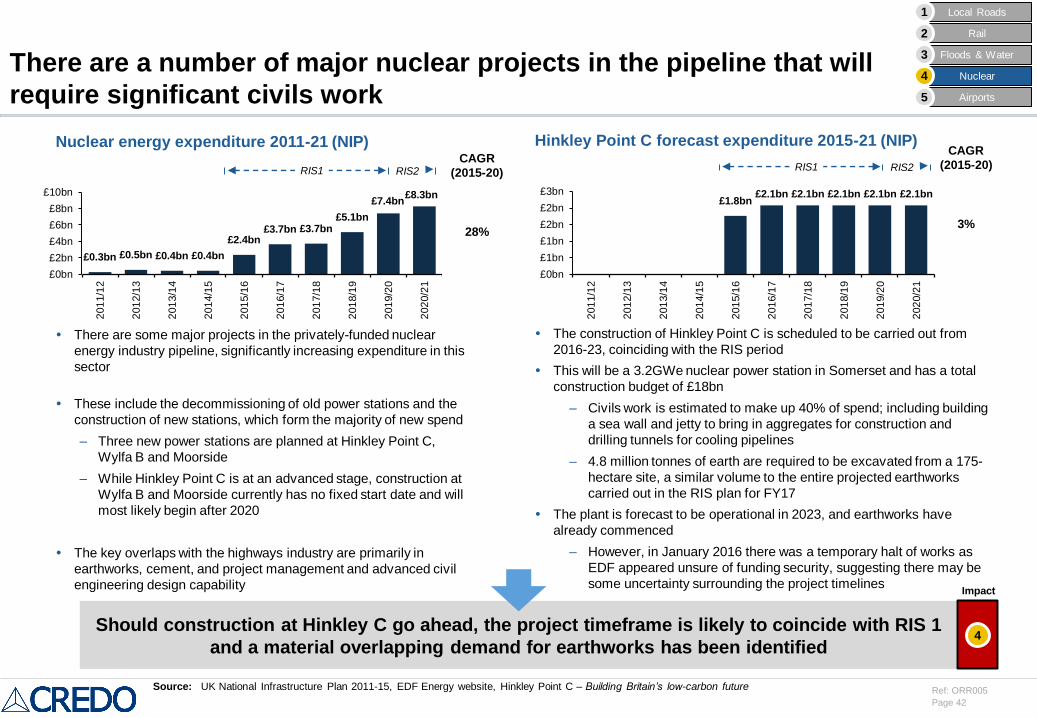
Page 42
Ref: ORR005
Hinkley Point C forecast expenditure 2015-21 (NIP)
The construction of Hinkley Point C is scheduled to be carried out from
2016-23, coinciding with the RIS period
This will be a 3.2GWe nuclear power station in Somerset and has a total
construction budget of £18bn
– Civils work is estimated to make up 40% of spend; including building
a sea wall and jetty to bring in aggregates for construction and
drilling tunnels for cooling pipelines
– 4.8 million tonnes of earth are required to be excavated from a 175-
hectare site, a similar volume to the entire projected earthworks
carried out in the RIS plan for FY17
The plant is forecast to be operational in 2023, and earthworks have
already commenced
– However, in January 2016 there was a temporary halt of works as
EDF appeared unsure of funding security, suggesting there may be
some uncertainty surrounding the project timelines
Nuclear energy expenditure 2011-21 (NIP)
There are some major projects in the privately-funded nuclear
energy industry pipeline, significantly increasing expenditure in this
sector
These include the decommissioning of old power stations and the
construction of new stations, which form the majority of new spend
– Three new power stations are planned at Hinkley Point C,
Wylfa B and Moorside
– While Hinkley Point C is at an advanced stage, construction at
Wylfa B and Moorside currently has no fixed start date and will
most likely begin after 2020
The key overlaps with the highways industry are primarily in
earthworks, cement, and project management and advanced civil
engineering design capability
There are a number of major nuclear projects in the pipeline that will
require significant civils work
Source: UK National Infrastructure Plan 2011-15, EDF Energy website, Hinkley Point C – Building Britain’s low-carbon future
Should construction at Hinkley C go ahead, the project timeframe is likely to coincide with RIS 1
and a material overlapping demand for earthworks has been identified
CAGR
(2015-20)
3%
CAGR
(2015-20)
28%
4
Local Roads1
Rail2
Floods & Water3
Nuclear4
Airports5
RIS1 RIS2 RIS1 RIS2
Impact
£0.3bn £0.5bn £0.4bn £0.4bn
£2.4bn£3.7bn £3.7bn
£5.1bn
£7.4bn£8.3bn
£0bn
£2bn
£4bn
£6bn
£8bn
£10bn
201
1/1
2
201
2/1
3
201
3/1
4
201
4/1
5
201
5/1
6
201
6/1
7
201
7/1
8
201
8/1
9
201
9/2
0
202
0/2
1
£1.8bn£2.1bn £2.1bn £2.1bn £2.1bn £2.1bn
£0bn
£1bn
£1bn
£2bn
£2bn
£3bn
201
1/1
2
201
2/1
3
201
3/1
4
201
4/1
5
201
5/1
6
201
6/1
7
201
7/1
8
201
8/1
9
201
9/2
0
202
0/2
1
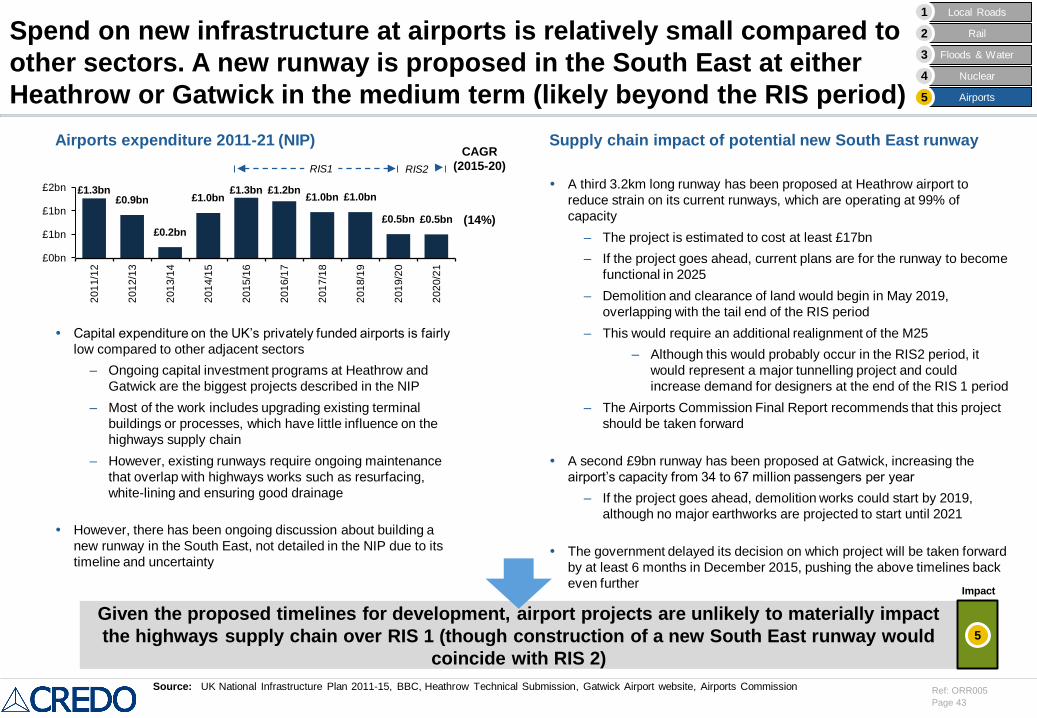
Page 43
Ref: ORR005
Airports expenditure 2011-21 (NIP)
Capital expenditure on the UK’s privately funded airports is fairly
low compared to other adjacent sectors
– Ongoing capital investment programs at Heathrow and
Gatwick are the biggest projects described in the NIP
– Most of the work includes upgrading existing terminal
buildings or processes, which have little influence on the
highways supply chain
– However, existing runways require ongoing maintenance
that overlap with highways works such as resurfacing,
white-lining and ensuring good drainage
However, there has been ongoing discussion about building a
new runway in the South East, not detailed in the NIP due to its
timeline and uncertainty
Spend on new infrastructure at airports is relatively small compared to
other sectors. A new runway is proposed in the South East at either
Heathrow or Gatwick in the medium term (likely beyond the RIS period)
Supply chain impact of potential new South East runway
A third 3.2km long runway has been proposed at Heathrow airport to
reduce strain on its current runways, which are operating at 99% of
capacity
– The project is estimated to cost at least £17bn
– If the project goes ahead, current plans are for the runway to become
functional in 2025
– Demolition and clearance of land would begin in May 2019,
overlapping with the tail end of the RIS period
– This would require an additional realignment of the M25
– Although this would probably occur in the RIS2 period, it
would represent a major tunnelling project and could
increase demand for designers at the end of the RIS 1 period
– The Airports Commission Final Report recommends that this project
should be taken forward
A second £9bn runway has been proposed at Gatwick, increasing the
airport’s capacity from 34 to 67 million passengers per year
– If the project goes ahead, demolition works could start by 2019,
although no major earthworks are projected to start until 2021
The government delayed its decision on which project will be taken forward
by at least 6 months in December 2015, pushing the above timelines back
even further
Source: UK National Infrastructure Plan 2011-15, BBC, Heathrow Technical Submission, Gatwick Airport website, Airports Commission
Given the proposed timelines for development, airport projects are unlikely to materially impact
the highways supply chain over RIS 1 (though construction of a new South East runway would
coincide with RIS 2)
CAGR
(2015-20)
(14%)
5
Local Roads1
Rail2
Floods & Water3
Nuclear4
Airports5
RIS1 RIS2
Impact
£1.3bn£0.9bn
£0.2bn
£1.0bn£1.3bn £1.2bn
£1.0bn £1.0bn
£0.5bn £0.5bn
£0bn
£1bn
£1bn
£2bn
201
1/1
2
201
2/1
3
201
3/1
4
201
4/1
5
201
5/1
6
201
6/1
7
201
7/1
8
201
8/1
9
201
9/2
0
202
0/2
1
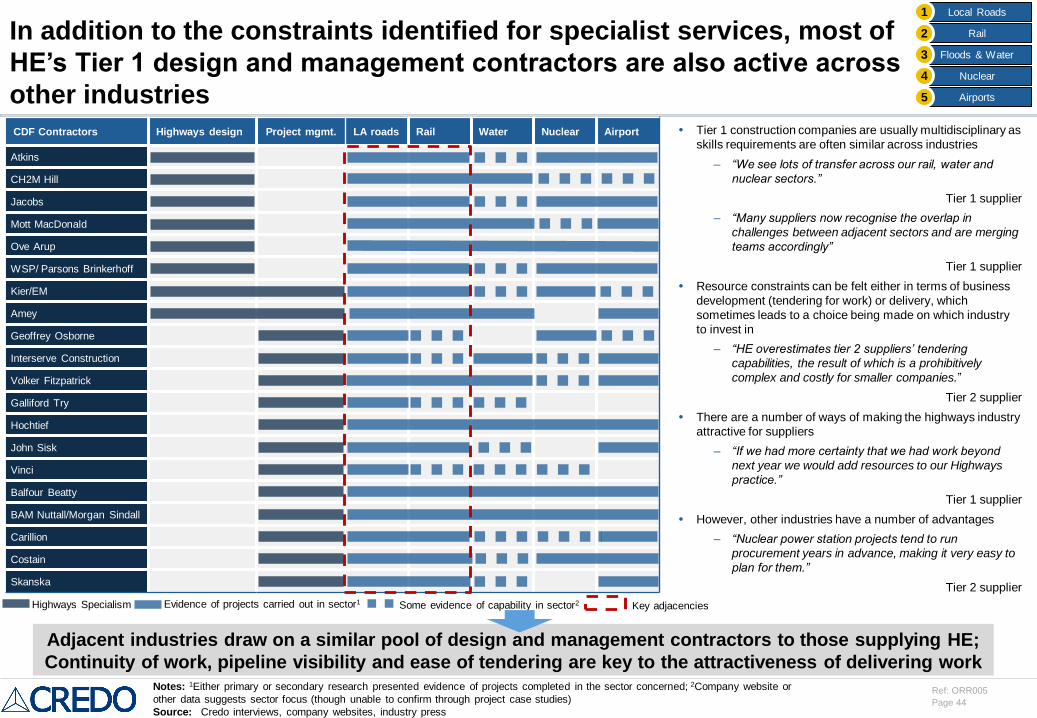
Page 44
Ref: ORR005
In addition to the constraints identified for specialist services, most of
HE’s Tier 1 design and management contractors are also active across
other industries
CDF Contractors Highways design Project mgmt. LA roads Rail Water Nuclear Airport
Atkins
CH2M Hill
Jacobs
Mott MacDonald
Ove Arup
WSP/ Parsons Brinkerhoff
Kier/EM
Amey
Geoffrey Osborne
Interserve Construction
Volker Fitzpatrick
Galliford Try
Hochtief
John Sisk
Vinci
Balfour Beatty
BAM Nuttall/Morgan Sindall
Carillion
Costain
Skanska
Tier 1 construction companies are usually multidisciplinary as
skills requirements are often similar across industries
– “We see lots of transfer across our rail, water and
nuclear sectors.”
Tier 1 supplier
– “Many suppliers now recognise the overlap in
challenges between adjacent sectors and are merging
teams accordingly”
Tier 1 supplier
Resource constraints can be felt either in terms of business
development (tendering for work) or delivery, which
sometimes leads to a choice being made on which industry
to invest in
– “HE overestimates tier 2 suppliers’ tendering
capabilities, the result of which is a prohibitively
complex and costly for smaller companies.”
Tier 2 supplier
There are a number of ways of making the highways industry
attractive for suppliers
– “If we had more certainty that we had work beyond
next year we would add resources to our Highways
practice.”
Tier 1 supplier
However, other industries have a number of advantages
– “Nuclear power station projects tend to run
procurement years in advance, making it very easy to
plan for them.”
Tier 2 supplier
Highways Specialism Evidence of projects carried out in sector1 Some evidence of capability in sector2
Adjacent industries draw on a similar pool of design and management contractors to those supplying HE;
Continuity of work, pipeline visibility and ease of tendering are key to the attractiveness of delivering work
Local Roads1
Rail2
Floods & Water3
Nuclear4
Airports5
Notes: 1Either primary or secondary research presented evidence of projects completed in the sector concerned; 2Company website or
other data suggests sector focus (though unable to confirm through project case studies)
Source: Credo interviews, company websites, industry press
Key adjacencies
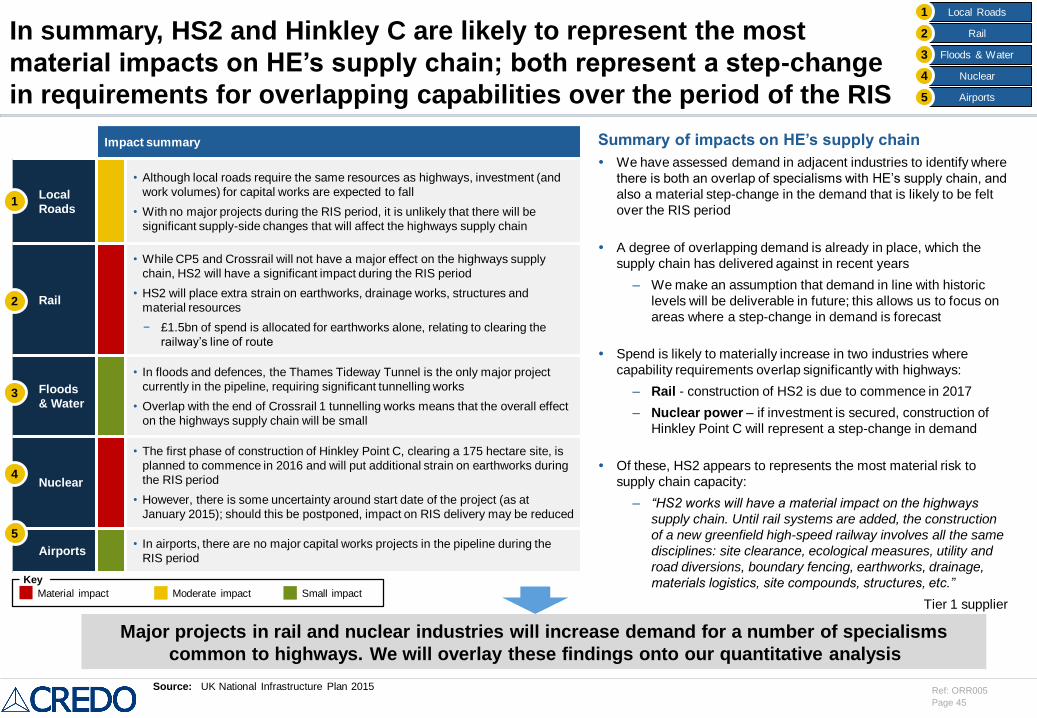
Page 45
Ref: ORR005
In summary, HS2 and Hinkley C are likely to represent the most
material impacts on HE’s supply chain; both represent a step-change
in requirements for overlapping capabilities over the period of the RIS
Summary of impacts on HE’s supply chain
We have assessed demand in adjacent industries to identify where
there is both an overlap of specialisms with HE’s supply chain, and
also a material step-change in the demand that is likely to be felt
over the RIS period
A degree of overlapping demand is already in place, which the
supply chain has delivered against in recent years
– We make an assumption that demand in line with historic
levels will be deliverable in future; this allows us to focus on
areas where a step-change in demand is forecast
Spend is likely to materially increase in two industries where
capability requirements overlap significantly with highways:
– Rail - construction of HS2 is due to commence in 2017
– Nuclear power – if investment is secured, construction of
Hinkley Point C will represent a step-change in demand
Of these, HS2 appears to represents the most material risk to
supply chain capacity:
– “HS2 works will have a material impact on the highways
supply chain. Until rail systems are added, the construction
of a new greenfield high-speed railway involves all the same
disciplines: site clearance, ecological measures, utility and
road diversions, boundary fencing, earthworks, drainage,
materials logistics, site compounds, structures, etc.”
Tier 1 supplier
Major projects in rail and nuclear industries will increase demand for a number of specialisms
common to highways. We will overlay these findings onto our quantitative analysis
Source: UK National Infrastructure Plan 2015
Impact summary
Local
Roads
• Although local roads require the same resources as highways, investment (and
work volumes) for capital works are expected to fall
• With no major projects during the RIS period, it is unlikely that there will be
significant supply-side changes that will affect the highways supply chain
Rail
• While CP5 and Crossrail will not have a major effect on the highways supply
chain, HS2 will have a significant impact during the RIS period
• HS2 will place extra strain on earthworks, drainage works, structures and
material resources
− £1.5bn of spend is allocated for earthworks alone, relating to clearing the
railway’s line of route
Floods
& Water
• In floods and defences, the Thames Tideway Tunnel is the only major project
currently in the pipeline, requiring significant tunnelling works
• Overlap with the end of Crossrail 1 tunnelling works means that the overall effect
on the highways supply chain will be small
Nuclear
• The first phase of construction of Hinkley Point C, clearing a 175 hectare site, is
planned to commence in 2016 and will put additional strain on earthworks during
the RIS period
• However, there is some uncertainty around start date of the project (as at
January 2015); should this be postponed, impact on RIS delivery may be reduced
Airports• In airports, there are no major capital works projects in the pipeline during the
RIS period
Material impact Moderate impact Small impact
Key
Local Roads1
Rail2
Floods & Water3
Nuclear4
Airports5
5
4
3
2
1
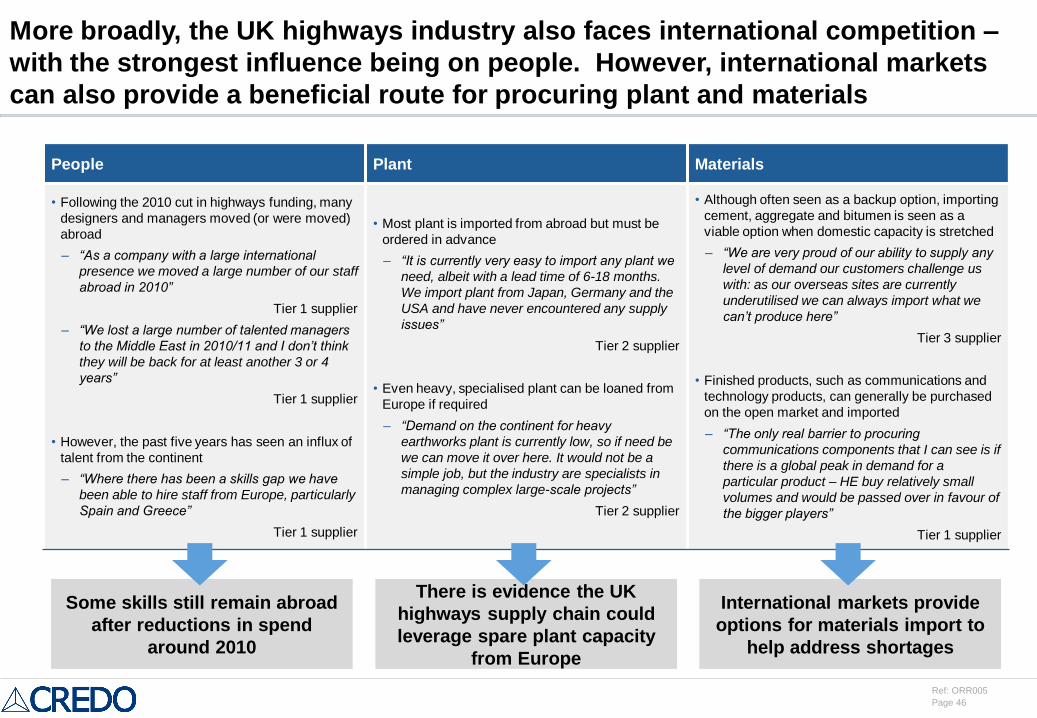
Page 46
Ref: ORR005
More broadly, the UK highways industry also faces international competition –
with the strongest influence being on people. However, international markets
can also provide a beneficial route for procuring plant and materials
People Plant Materials
• Following the 2010 cut in highways funding, many
designers and managers moved (or were moved)
abroad
– “As a company with a large international
presence we moved a large number of our staff
abroad in 2010”
Tier 1 supplier
– “We lost a large number of talented managers
to the Middle East in 2010/11 and I don’t think
they will be back for at least another 3 or 4
years”
Tier 1 supplier
• However, the past five years has seen an influx of
talent from the continent
– “Where there has been a skills gap we have
been able to hire staff from Europe, particularly
Spain and Greece”
Tier 1 supplier
• Most plant is imported from abroad but must be
ordered in advance
– “It is currently very easy to import any plant we
need, albeit with a lead time of 6-18 months.
We import plant from Japan, Germany and the
USA and have never encountered any supply
issues”
Tier 2 supplier
• Even heavy, specialised plant can be loaned from
Europe if required
– “Demand on the continent for heavy
earthworks plant is currently low, so if need be
we can move it over here. It would not be a
simple job, but the industry are specialists in
managing complex large-scale projects”
Tier 2 supplier
• Although often seen as a backup option, importing
cement, aggregate and bitumen is seen as a
viable option when domestic capacity is stretched
– “We are very proud of our ability to supply any
level of demand our customers challenge us
with: as our overseas sites are currently
underutilised we can always import what we
can’t produce here”
Tier 3 supplier
• Finished products, such as communications and
technology products, can generally be purchased
on the open market and imported
– “The only real barrier to procuring
communications components that I can see is if
there is a global peak in demand for a
particular product – HE buy relatively small
volumes and would be passed over in favour of
the bigger players”
Tier 1 supplier
International markets provide
options for materials import to
help address shortages
There is evidence the UK
highways supply chain could
leverage spare plant capacity
from Europe
Some skills still remain abroad
after reductions in spend
around 2010
Page 47
Ref: ORR005
Agenda
Executive summary
Market situation and background
Supply chain capacity assessment
– Core HE demand
– Other UK infrastructure demand
– Assessment of deliverability and identified risks
HE approach to procurement and project management
Key Performance Indicators and recommendations for ORR
Appendix
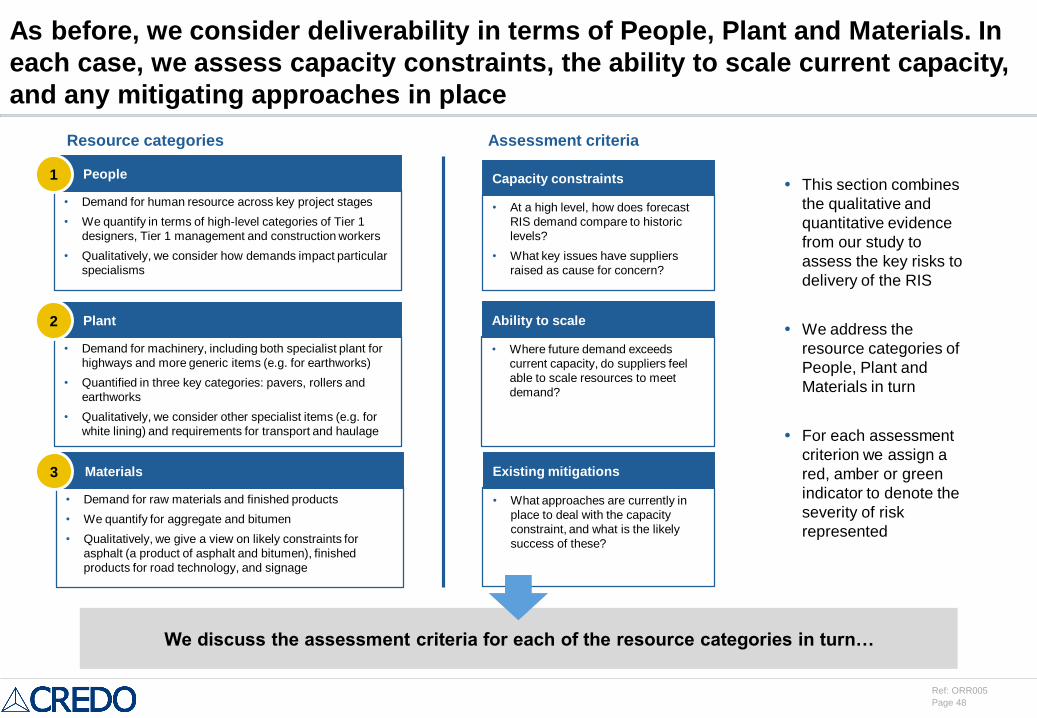
Page 48
Ref: ORR005
• Demand for human resource across key project stages
• We quantify in terms of high-level categories of Tier 1
designers, Tier 1 management and construction workers
• Qualitatively, we consider how demands impact particular
specialisms
As before, we consider deliverability in terms of People, Plant and Materials. In
each case, we assess capacity constraints, the ability to scale current capacity,
and any mitigating approaches in place
Resource categories Assessment criteria
People1
• Demand for machinery, including both specialist plant for
highways and more generic items (e.g. for earthworks)
• Quantified in three key categories: pavers, rollers and
earthworks
• Qualitatively, we consider other specialist items (e.g. for
white lining) and requirements for transport and haulage
Plant2
• Demand for raw materials and finished products
• We quantify for aggregate and bitumen
• Qualitatively, we give a view on likely constraints for
asphalt (a product of asphalt and bitumen), finished
products for road technology, and signage
Materials3
Capacity constraints
• At a high level, how does forecast
RIS demand compare to historic
levels?
• What key issues have suppliers
raised as cause for concern?
Ability to scale
• Where future demand exceeds
current capacity, do suppliers feel
able to scale resources to meet
demand?
Existing mitigations
• What approaches are currently in
place to deal with the capacity
constraint, and what is the likely
success of these?
This section combines
the qualitative and
quantitative evidence
from our study to
assess the key risks to
delivery of the RIS
We address the
resource categories of
People, Plant and
Materials in turn
For each assessment
criterion we assign a
red, amber or green
indicator to denote the
severity of risk
represented
We discuss the assessment criteria for each of the resource categories in turn…
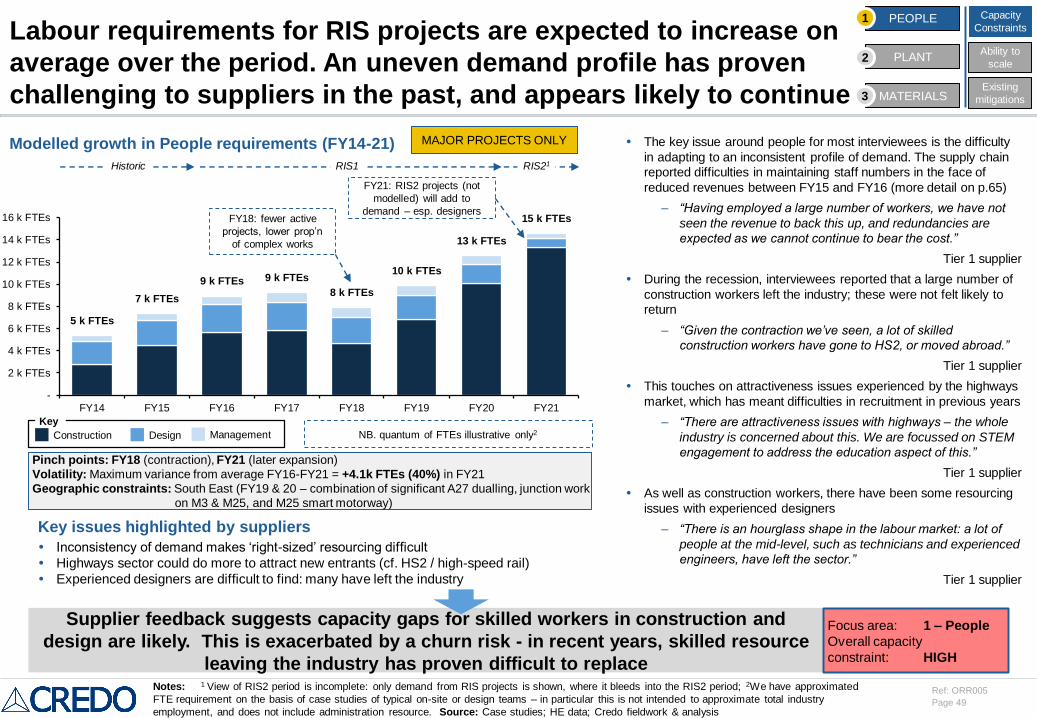
Page 49
Ref: ORR005
5 k FTEs
7 k FTEs
9 k FTEs 9 k FTEs
8 k FTEs
10 k FTEs
13 k FTEs
15 k FTEs
-
2 k FTEs
4 k FTEs
6 k FTEs
8 k FTEs
10 k FTEs
12 k FTEs
14 k FTEs
16 k FTEs
FY14 FY15 FY16 FY17 FY18 FY19 FY20 FY21
The key issue around people for most interviewees is the difficulty
in adapting to an inconsistent profile of demand. The supply chain
reported difficulties in maintaining staff numbers in the face of
reduced revenues between FY15 and FY16 (more detail on p.65)
– “Having employed a large number of workers, we have not
seen the revenue to back this up, and redundancies are
expected as we cannot continue to bear the cost.”
Tier 1 supplier
During the recession, interviewees reported that a large number of
construction workers left the industry; these were not felt likely to
return
– “Given the contraction we’ve seen, a lot of skilled
construction workers have gone to HS2, or moved abroad.”
Tier 1 supplier
This touches on attractiveness issues experienced by the highways
market, which has meant difficulties in recruitment in previous years
– “There are attractiveness issues with highways – the whole
industry is concerned about this. We are focussed on STEM
engagement to address the education aspect of this.”
Tier 1 supplier
As well as construction workers, there have been some resourcing
issues with experienced designers
– “There is an hourglass shape in the labour market: a lot of
people at the mid-level, such as technicians and experienced
engineers, have left the sector.”
Tier 1 supplier
Labour requirements for RIS projects are expected to increase on
average over the period. An uneven demand profile has proven
challenging to suppliers in the past, and appears likely to continue
Inconsistency of demand makes ‘right-sized’ resourcing difficult
Highways sector could do more to attract new entrants (cf. HS2 / high-speed rail)
Experienced designers are difficult to find: many have left the industry
Modelled growth in People requirements (FY14-21)
Key issues highlighted by suppliers
Supplier feedback suggests capacity gaps for skilled workers in construction and
design are likely. This is exacerbated by a churn risk - in recent years, skilled resource
leaving the industry has proven difficult to replace
Pinch points: FY18 (contraction), FY21 (later expansion)
Volatility: Maximum variance from average FY16-FY21 = +4.1k FTEs (40%) in FY21
Geographic constraints: South East (FY19 & 20 – combination of significant A27 dualling, junction work
on M3 & M25, and M25 smart motorway)
Focus area: 1 – People
Overall capacity
constraint: HIGH
RIS1 RIS21Historic
Notes: 1 View of RIS2 period is incomplete: only demand from RIS projects is shown, where it bleeds into the RIS2 period; 2We have approximated
FTE requirement on the basis of case studies of typical on-site or design teams – in particular this is not intended to approximate total industry
employment, and does not include administration resource. Source: Case studies; HE data; Credo fieldwork & analysis
PEOPLE
PLANT
MATERIALS
Capacity
Constraints1
2
3
Ability to
scale
Existing
mitigations
Construction Design Management
Key
MAJOR PROJECTS ONLY
FY18: fewer active
projects, lower prop’n
of complex works
FY21: RIS2 projects (not
modelled) will add to
demand – esp. designers
NB. quantum of FTEs illustrative only2
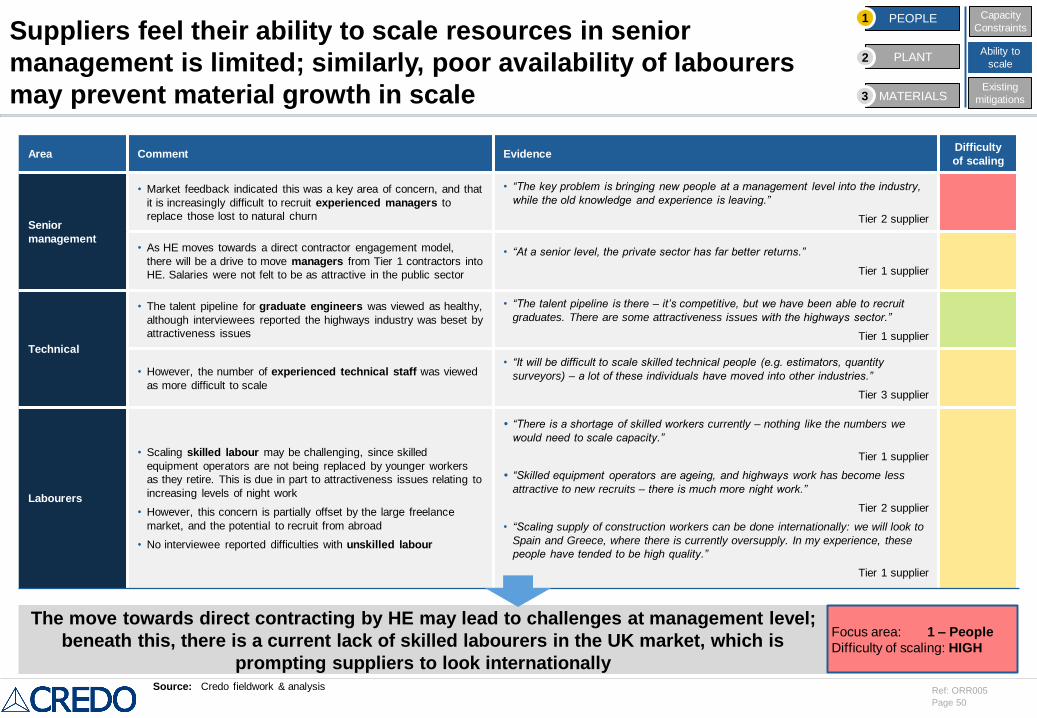
Page 50
Ref: ORR005
Suppliers feel their ability to scale resources in senior
management is limited; similarly, poor availability of labourers
may prevent material growth in scale
Area Comment EvidenceDifficulty
of scaling
Senior
management
• Market feedback indicated this was a key area of concern, and that
it is increasingly difficult to recruit experienced managers to
replace those lost to natural churn
• “The key problem is bringing new people at a management level into the industry,
while the old knowledge and experience is leaving.”
Tier 2 supplier
• As HE moves towards a direct contractor engagement model,
there will be a drive to move managers from Tier 1 contractors into
HE. Salaries were not felt to be as attractive in the public sector
• “At a senior level, the private sector has far better returns.”
Tier 1 supplier
Technical
• The talent pipeline for graduate engineers was viewed as healthy,
although interviewees reported the highways industry was beset by
attractiveness issues
• “The talent pipeline is there – it’s competitive, but we have been able to recruit
graduates. There are some attractiveness issues with the highways sector.”
Tier 1 supplier
• However, the number of experienced technical staff was viewed
as more difficult to scale
• “It will be difficult to scale skilled technical people (e.g. estimators, quantity
surveyors) – a lot of these individuals have moved into other industries.”
Tier 3 supplier
Labourers
• Scaling skilled labour may be challenging, since skilled
equipment operators are not being replaced by younger workers
as they retire. This is due in part to attractiveness issues relating to
increasing levels of night work
• However, this concern is partially offset by the large freelance
market, and the potential to recruit from abroad
• No interviewee reported difficulties with unskilled labour
“There is a shortage of skilled workers currently – nothing like the numbers we
would need to scale capacity.”
Tier 1 supplier
“Skilled equipment operators are ageing, and highways work has become less
attractive to new recruits – there is much more night work.”
Tier 2 supplier
• “Scaling supply of construction workers can be done internationally: we will look to
Spain and Greece, where there is currently oversupply. In my experience, these
people have tended to be high quality.”
Tier 1 supplier
The move towards direct contracting by HE may lead to challenges at management level;
beneath this, there is a current lack of skilled labourers in the UK market, which is
prompting suppliers to look internationallySource: Credo fieldwork & analysis
Focus area: 1 – People
Difficulty of scaling: HIGH
PEOPLE
PLANT
MATERIALS
Capacity
Constraints1
2
3
Ability to
scale
Existing
mitigations
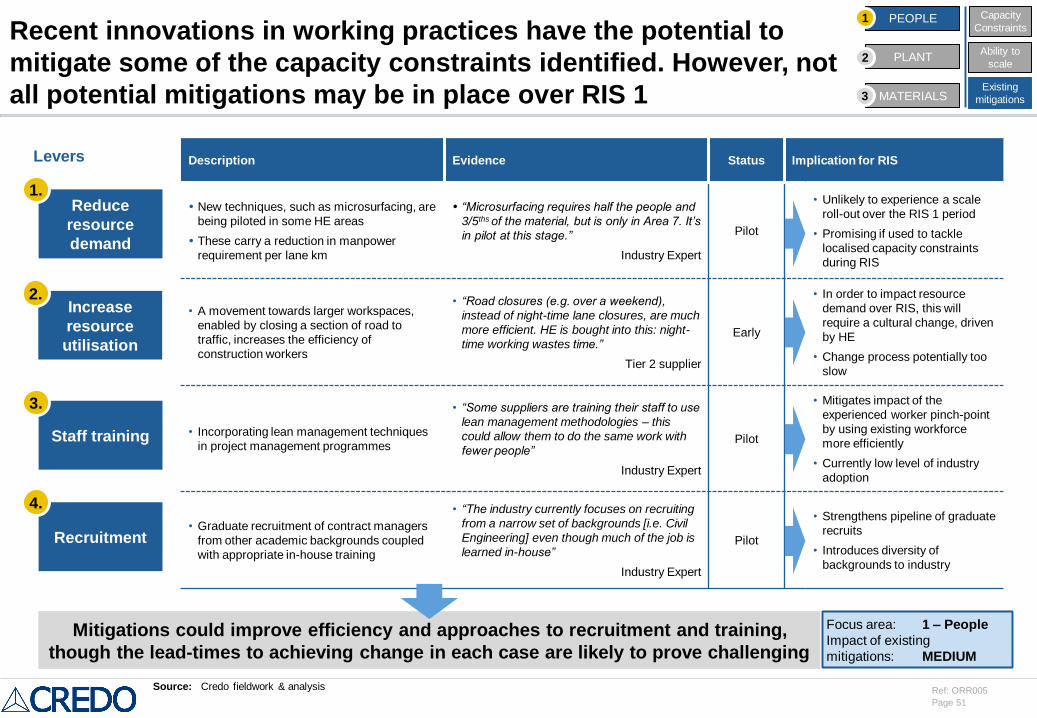
Page 51
Ref: ORR005
Description Evidence Status Implication for RIS
New techniques, such as microsurfacing, are
being piloted in some HE areas
These carry a reduction in manpower
requirement per lane km
“Microsurfacing requires half the people and
3/5ths of the material, but is only in Area 7. It’s
in pilot at this stage.”
Industry Expert
Pilot
• Unlikely to experience a scale
roll-out over the RIS 1 period
• Promising if used to tackle
localised capacity constraints
during RIS
• A movement towards larger workspaces,
enabled by closing a section of road to
traffic, increases the efficiency of
construction workers
• “Road closures (e.g. over a weekend),
instead of night-time lane closures, are much
more efficient. HE is bought into this: night-
time working wastes time.”
Tier 2 supplier
Early
• In order to impact resource
demand over RIS, this will
require a cultural change, driven
by HE
• Change process potentially too
slow
• Incorporating lean management techniques
in project management programmes
• “Some suppliers are training their staff to use
lean management methodologies – this
could allow them to do the same work with
fewer people”
Industry Expert
Pilot
• Mitigates impact of the
experienced worker pinch-point
by using existing workforce
more efficiently
• Currently low level of industry
adoption
• Graduate recruitment of contract managers
from other academic backgrounds coupled
with appropriate in-house training
• “The industry currently focuses on recruiting
from a narrow set of backgrounds [i.e. Civil
Engineering] even though much of the job is
learned in-house”
Industry Expert
Pilot
• Strengthens pipeline of graduate
recruits
• Introduces diversity of
backgrounds to industry
Recent innovations in working practices have the potential to
mitigate some of the capacity constraints identified. However, not
all potential mitigations may be in place over RIS 1
Mitigations could improve efficiency and approaches to recruitment and training,
though the lead-times to achieving change in each case are likely to prove challenging
Focus area: 1 – People
Impact of existing
mitigations: MEDIUM
Reduce
resource
demand
1.
Increase
resource
utilisation
2.
Staff training
3.
Recruitment
4.
Levers
Source: Credo fieldwork & analysis
PEOPLE
PLANT
MATERIALS
Capacity
Constraints1
2
3
Ability to
scale
Existing
mitigations
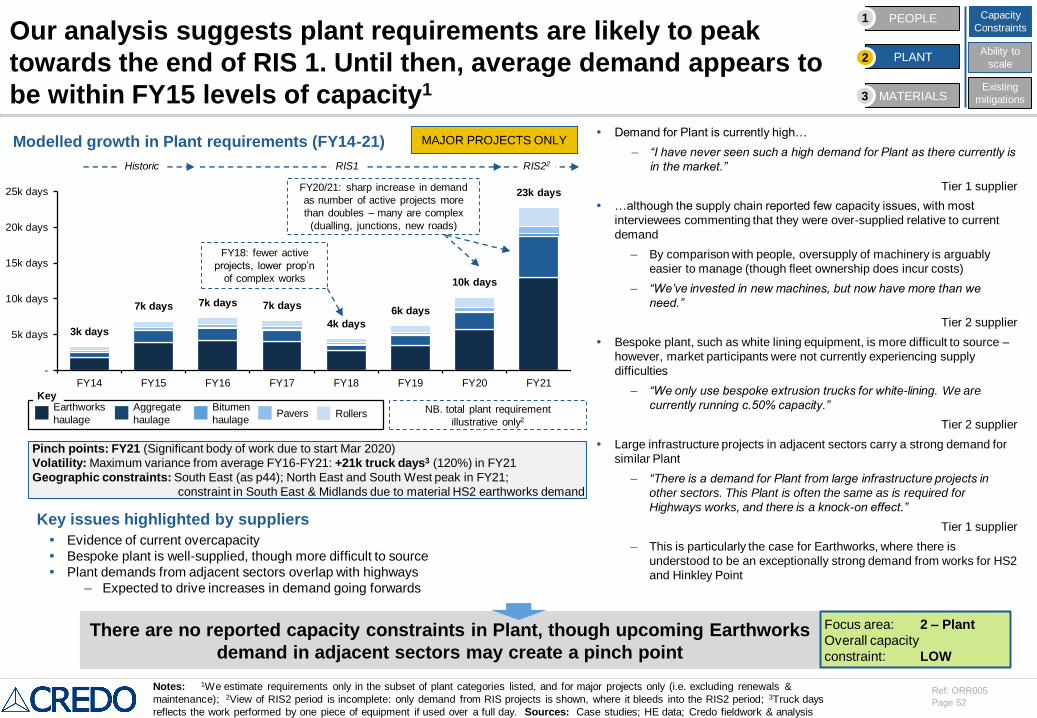
Page 52
Ref: ORR005
3k days
7k days 7k days 7k days
4k days
6k days
10k days
23k days
-
5k days
10k days
15k days
20k days
25k days
FY14 FY15 FY16 FY17 FY18 FY19 FY20 FY21
Our analysis suggests plant requirements are likely to peak
towards the end of RIS 1. Until then, average demand appears to
be within FY15 levels of capacity1
There are no reported capacity constraints in Plant, though upcoming Earthworks
demand in adjacent sectors may create a pinch point
Focus area: 2 – Plant
Overall capacity
constraint: LOW
Modelled growth in Plant requirements (FY14-21) Demand for Plant is currently high…
– “I have never seen such a high demand for Plant as there currently is
in the market.”
Tier 1 supplier
…although the supply chain reported few capacity issues, with most
interviewees commenting that they were over-supplied relative to current
demand
– By comparison with people, oversupply of machinery is arguably
easier to manage (though fleet ownership does incur costs)
– “We’ve invested in new machines, but now have more than we
need.”
Tier 2 supplier
Bespoke plant, such as white lining equipment, is more difficult to source –
however, market participants were not currently experiencing supply
difficulties
– “We only use bespoke extrusion trucks for white-lining. We are
currently running c.50% capacity.”
Tier 2 supplier
Large infrastructure projects in adjacent sectors carry a strong demand for
similar Plant
– “There is a demand for Plant from large infrastructure projects in
other sectors. This Plant is often the same as is required for
Highways works, and there is a knock-on effect.”
Tier 1 supplier
– This is particularly the case for Earthworks, where there is
understood to be an exceptionally strong demand from works for HS2
and Hinkley Point
Evidence of current overcapacity
Bespoke plant is well-supplied, though more difficult to source
Plant demands from adjacent sectors overlap with highways
– Expected to drive increases in demand going forwards
Key issues highlighted by suppliers
RIS1 RIS22Historic
Notes: 1We estimate requirements only in the subset of plant categories listed, and for major projects only (i.e. excluding renewals &
maintenance); 2View of RIS2 period is incomplete: only demand from RIS projects is shown, where it bleeds into the RIS2 period; 3Truck days
reflects the work performed by one piece of equipment if used over a full day. Sources: Case studies; HE data; Credo fieldwork & analysis
PEOPLE
PLANT
MATERIALS
Capacity
Constraints1
2
3
Ability to
scale
Existing
mitigations
Pinch points: FY21 (Significant body of work due to start Mar 2020)
Volatility: Maximum variance from average FY16-FY21: +21k truck days3 (120%) in FY21
Geographic constraints: South East (as p44); North East and South West peak in FY21;
constraint in South East & Midlands due to material HS2 earthworks demand
Earthworks
haulage
Aggregate
haulage
Bitumen
haulage
Key
Pavers Rollers
FY20/21: sharp increase in demand
as number of active projects more
than doubles – many are complex
(dualling, junctions, new roads)
MAJOR PROJECTS ONLY
NB. total plant requirement
illustrative only2
FY18: fewer active
projects, lower prop’n
of complex works
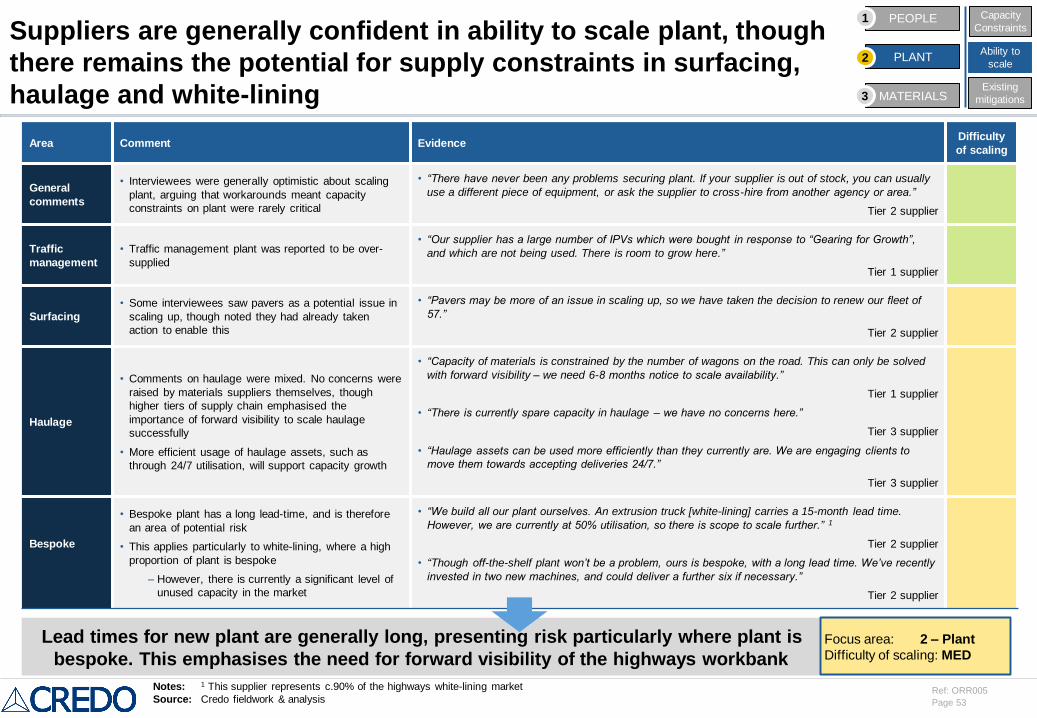
Page 53
Ref: ORR005
Suppliers are generally confident in ability to scale plant, though
there remains the potential for supply constraints in surfacing,
haulage and white-lining
Lead times for new plant are generally long, presenting risk particularly where plant is
bespoke. This emphasises the need for forward visibility of the highways workbankFocus area: 2 – Plant
Difficulty of scaling: MED
Area Comment EvidenceDifficulty
of scaling
General
comments
• Interviewees were generally optimistic about scaling
plant, arguing that workarounds meant capacity
constraints on plant were rarely critical
• “There have never been any problems securing plant. If your supplier is out of stock, you can usually
use a different piece of equipment, or ask the supplier to cross-hire from another agency or area.”
Tier 2 supplier
Traffic
management
• Traffic management plant was reported to be over-
supplied
• “Our supplier has a large number of IPVs which were bought in response to “Gearing for Growth”,
and which are not being used. There is room to grow here.”
Tier 1 supplier
Surfacing
• Some interviewees saw pavers as a potential issue in
scaling up, though noted they had already taken
action to enable this
• “Pavers may be more of an issue in scaling up, so we have taken the decision to renew our fleet of
57.”
Tier 2 supplier
Haulage
• Comments on haulage were mixed. No concerns were
raised by materials suppliers themselves, though
higher tiers of supply chain emphasised the
importance of forward visibility to scale haulage
successfully
• More efficient usage of haulage assets, such as
through 24/7 utilisation, will support capacity growth
• “Capacity of materials is constrained by the number of wagons on the road. This can only be solved
with forward visibility – we need 6-8 months notice to scale availability.”
Tier 1 supplier
• “There is currently spare capacity in haulage – we have no concerns here.”
Tier 3 supplier
• “Haulage assets can be used more efficiently than they currently are. We are engaging clients to
move them towards accepting deliveries 24/7.”
Tier 3 supplier
Bespoke
• Bespoke plant has a long lead-time, and is therefore
an area of potential risk
• This applies particularly to white-lining, where a high
proportion of plant is bespoke
– However, there is currently a significant level of
unused capacity in the market
• “We build all our plant ourselves. An extrusion truck [white-lining] carries a 15-month lead time.
However, we are currently at 50% utilisation, so there is scope to scale further.” 1
Tier 2 supplier
• “Though off-the-shelf plant won’t be a problem, ours is bespoke, with a long lead time. We’ve recently
invested in two new machines, and could deliver a further six if necessary.”
Tier 2 supplier
Notes: 1 This supplier represents c.90% of the highways white-lining market
Source: Credo fieldwork & analysis
PEOPLE
PLANT
MATERIALS
Capacity
Constraints1
2
3
Ability to
scale
Existing
mitigations
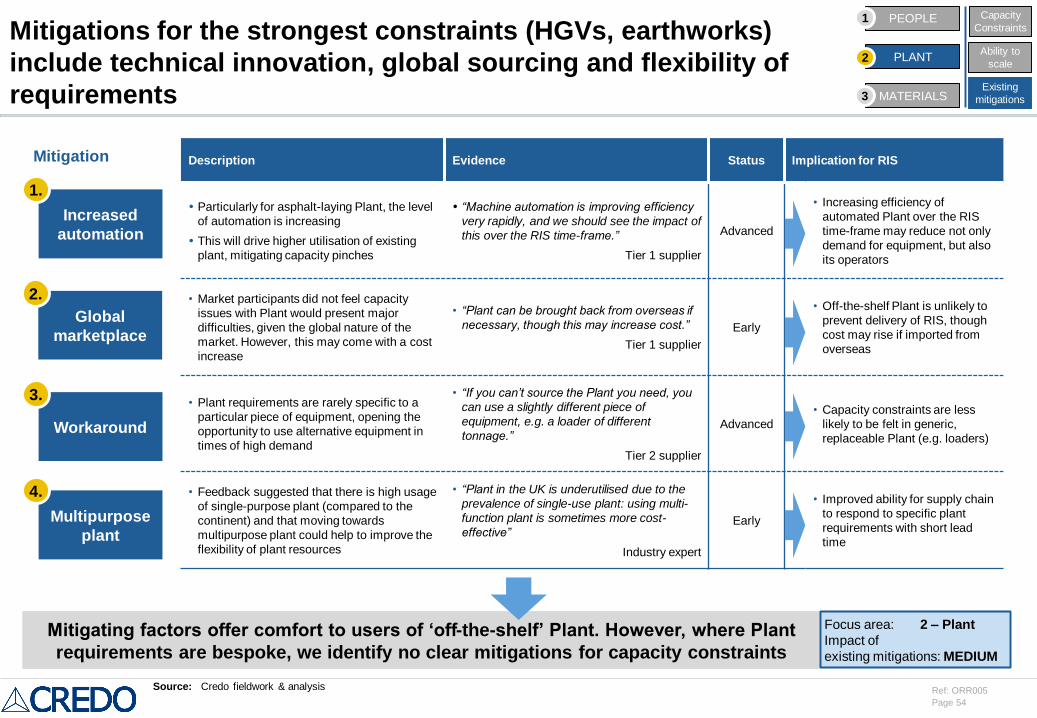
Page 54
Ref: ORR005
Mitigations for the strongest constraints (HGVs, earthworks)
include technical innovation, global sourcing and flexibility of
requirements
Mitigating factors offer comfort to users of ‘off-the-shelf’ Plant. However, where Plant
requirements are bespoke, we identify no clear mitigations for capacity constraints
Focus area: 2 – Plant
Impact of
existing mitigations: MEDIUM
Increased
automation
Description Evidence Status Implication for RIS
Particularly for asphalt-laying Plant, the level
of automation is increasing
This will drive higher utilisation of existing
plant, mitigating capacity pinches
“Machine automation is improving efficiency
very rapidly, and we should see the impact of
this over the RIS time-frame.”
Tier 1 supplier
Advanced
• Increasing efficiency of
automated Plant over the RIS
time-frame may reduce not only
demand for equipment, but also
its operators
• Market participants did not feel capacity
issues with Plant would present major
difficulties, given the global nature of the
market. However, this may come with a cost
increase
• “Plant can be brought back from overseas if
necessary, though this may increase cost.”
Tier 1 supplier
Early
• Off-the-shelf Plant is unlikely to
prevent delivery of RIS, though
cost may rise if imported from
overseas
• Plant requirements are rarely specific to a
particular piece of equipment, opening the
opportunity to use alternative equipment in
times of high demand
• “If you can’t source the Plant you need, you
can use a slightly different piece of
equipment, e.g. a loader of different
tonnage.”
Tier 2 supplier
Advanced
• Capacity constraints are less
likely to be felt in generic,
replaceable Plant (e.g. loaders)
• Feedback suggested that there is high usage
of single-purpose plant (compared to the
continent) and that moving towards
multipurpose plant could help to improve the
flexibility of plant resources
• “Plant in the UK is underutilised due to the
prevalence of single-use plant: using multi-
function plant is sometimes more cost-
effective”
Industry expert
Early
• Improved ability for supply chain
to respond to specific plant
requirements with short lead
time
1.
Global
marketplace
2.
Workaround
3.
Multipurpose
plant
4.
Mitigation
Source: Credo fieldwork & analysis
PEOPLE
PLANT
MATERIALS
Capacity
Constraints1
2
3
Ability to
scale
Existing
mitigations
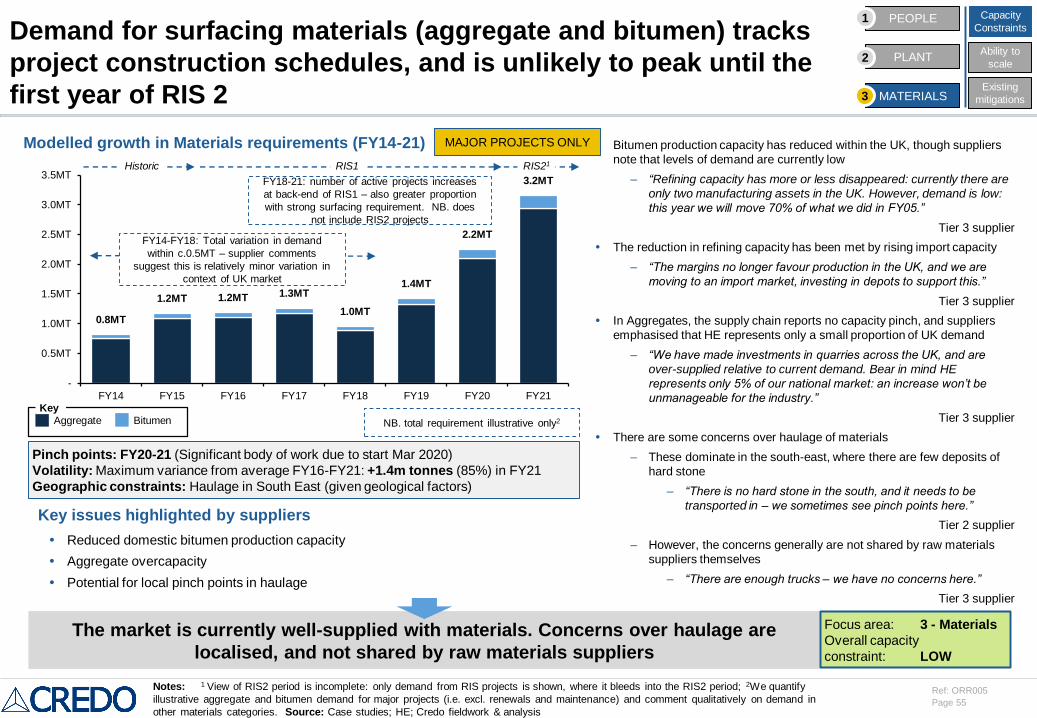
Page 55
Ref: ORR005
0.8MT
1.2MT 1.2MT 1.3MT
1.0MT
1.4MT
2.2MT
3.2MT
-
0.5MT
1.0MT
1.5MT
2.0MT
2.5MT
3.0MT
3.5MT
FY14 FY15 FY16 FY17 FY18 FY19 FY20 FY21
Pinch points: FY20-21 (Significant body of work due to start Mar 2020)
Volatility: Maximum variance from average FY16-FY21: +1.4m tonnes (85%) in FY21
Geographic constraints: Haulage in South East (given geological factors)
Demand for surfacing materials (aggregate and bitumen) tracks
project construction schedules, and is unlikely to peak until the
first year of RIS 2
The market is currently well-supplied with materials. Concerns over haulage are
localised, and not shared by raw materials suppliers
Focus area: 3 - Materials
Overall capacity
constraint: LOW
Modelled growth in Materials requirements (FY14-21) Bitumen production capacity has reduced within the UK, though suppliers
note that levels of demand are currently low
– “Refining capacity has more or less disappeared: currently there are
only two manufacturing assets in the UK. However, demand is low:
this year we will move 70% of what we did in FY05.”
Tier 3 supplier
The reduction in refining capacity has been met by rising import capacity
– “The margins no longer favour production in the UK, and we are
moving to an import market, investing in depots to support this.”
Tier 3 supplier
In Aggregates, the supply chain reports no capacity pinch, and suppliers
emphasised that HE represents only a small proportion of UK demand
– “We have made investments in quarries across the UK, and are
over-supplied relative to current demand. Bear in mind HE
represents only 5% of our national market: an increase won’t be
unmanageable for the industry.”
Tier 3 supplier
There are some concerns over haulage of materials
– These dominate in the south-east, where there are few deposits of
hard stone
– “There is no hard stone in the south, and it needs to be
transported in – we sometimes see pinch points here.”
Tier 2 supplier
– However, the concerns generally are not shared by raw materials
suppliers themselves
– “There are enough trucks – we have no concerns here.”
Tier 3 supplier
Reduced domestic bitumen production capacity
Aggregate overcapacity
Potential for local pinch points in haulage
Key issues highlighted by suppliers
RIS1 RIS21Historic
Notes: 1 View of RIS2 period is incomplete: only demand from RIS projects is shown, where it bleeds into the RIS2 period; 2We quantify
illustrative aggregate and bitumen demand for major projects (i.e. excl. renewals and maintenance) and comment qualitatively on demand in
other materials categories. Source: Case studies; HE; Credo fieldwork & analysis
PEOPLE
PLANT
MATERIALS
Capacity
Constraints1
2
3
Ability to
scale
Existing
mitigations
Aggregate Bitumen
Key
MAJOR PROJECTS ONLY
NB. total requirement illustrative only2
FY18-21: number of active projects increases
at back-end of RIS1 – also greater proportion
with strong surfacing requirement. NB. does
not include RIS2 projects
FY14-FY18: Total variation in demand
within c.0.5MT – supplier comments
suggest this is relatively minor variation in
context of UK market
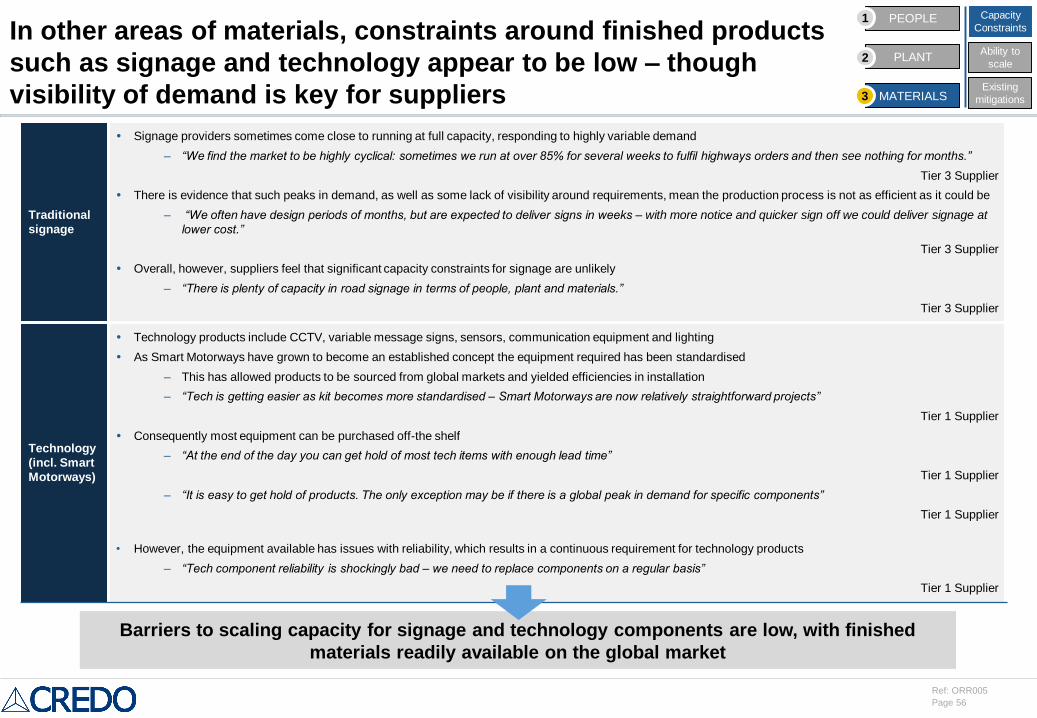
Page 56
Ref: ORR005
Traditional
signage
Signage providers sometimes come close to running at full capacity, responding to highly variable demand
– “We find the market to be highly cyclical: sometimes we run at over 85% for several weeks to fulfil highways orders and then see nothing for months.”
Tier 3 Supplier
There is evidence that such peaks in demand, as well as some lack of visibility around requirements, mean the production process is not as efficient as it could be
– “We often have design periods of months, but are expected to deliver signs in weeks – with more notice and quicker sign off we could deliver signage at
lower cost.”
Tier 3 Supplier
Overall, however, suppliers feel that significant capacity constraints for signage are unlikely
– “There is plenty of capacity in road signage in terms of people, plant and materials.”
Tier 3 Supplier
Technology
(incl. Smart
Motorways)
Technology products include CCTV, variable message signs, sensors, communication equipment and lighting
As Smart Motorways have grown to become an established concept the equipment required has been standardised
– This has allowed products to be sourced from global markets and yielded efficiencies in installation
– “Tech is getting easier as kit becomes more standardised – Smart Motorways are now relatively straightforward projects”
Tier 1 Supplier
Consequently most equipment can be purchased off-the shelf
– “At the end of the day you can get hold of most tech items with enough lead time”
Tier 1 Supplier
– “It is easy to get hold of products. The only exception may be if there is a global peak in demand for specific components”
Tier 1 Supplier
• However, the equipment available has issues with reliability, which results in a continuous requirement for technology products
– “Tech component reliability is shockingly bad – we need to replace components on a regular basis”
Tier 1 Supplier
In other areas of materials, constraints around finished products
such as signage and technology appear to be low – though
visibility of demand is key for suppliers
Barriers to scaling capacity for signage and technology components are low, with finished
materials readily available on the global market
PEOPLE
PLANT
MATERIALS
Capacity
Constraints1
2
3
Ability to
scale
Existing
mitigations
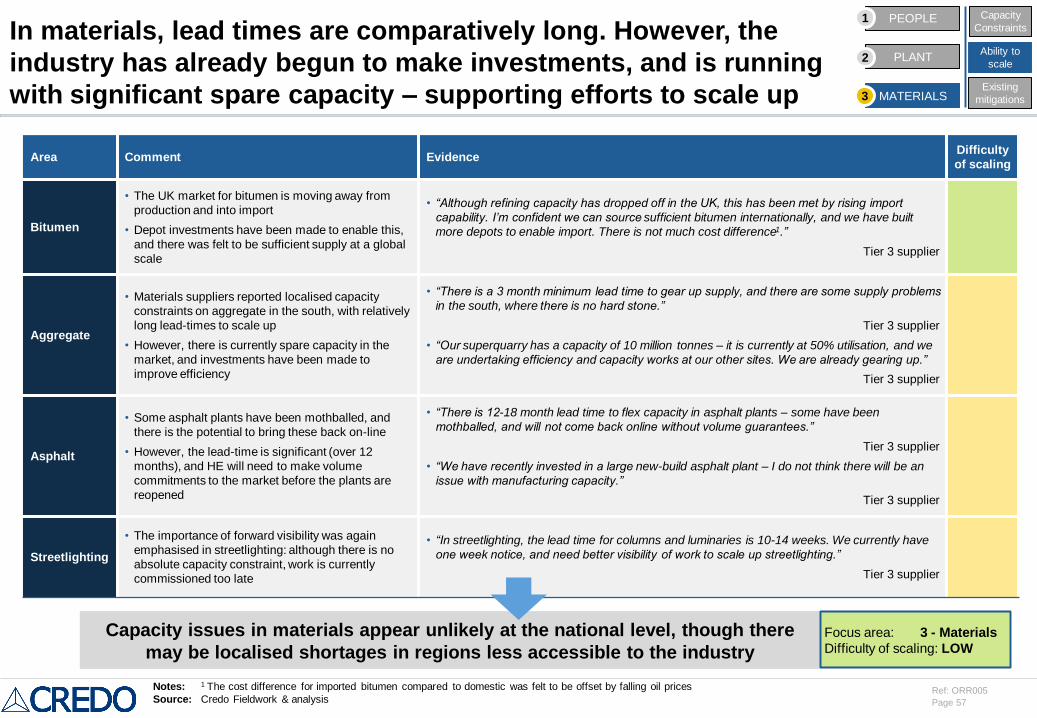
Page 57
Ref: ORR005
In materials, lead times are comparatively long. However, the
industry has already begun to make investments, and is running
with significant spare capacity – supporting efforts to scale up
Capacity issues in materials appear unlikely at the national level, though there
may be localised shortages in regions less accessible to the industryFocus area: 3 - Materials
Difficulty of scaling: LOW
Area Comment EvidenceDifficulty
of scaling
Bitumen
• The UK market for bitumen is moving away from
production and into import
• Depot investments have been made to enable this,
and there was felt to be sufficient supply at a global
scale
• “Although refining capacity has dropped off in the UK, this has been met by rising import
capability. I’m confident we can source sufficient bitumen internationally, and we have built
more depots to enable import. There is not much cost difference1.”
Tier 3 supplier
Aggregate
• Materials suppliers reported localised capacity
constraints on aggregate in the south, with relatively
long lead-times to scale up
• However, there is currently spare capacity in the
market, and investments have been made to
improve efficiency
• “There is a 3 month minimum lead time to gear up supply, and there are some supply problems
in the south, where there is no hard stone.”
Tier 3 supplier
• “Our superquarry has a capacity of 10 million tonnes – it is currently at 50% utilisation, and we
are undertaking efficiency and capacity works at our other sites. We are already gearing up.”
Tier 3 supplier
Asphalt
• Some asphalt plants have been mothballed, and
there is the potential to bring these back on-line
• However, the lead-time is significant (over 12
months), and HE will need to make volume
commitments to the market before the plants are
reopened
• “There is 12-18 month lead time to flex capacity in asphalt plants – some have been
mothballed, and will not come back online without volume guarantees.”
Tier 3 supplier
• “We have recently invested in a large new-build asphalt plant – I do not think there will be an
issue with manufacturing capacity.”
Tier 3 supplier
Streetlighting
• The importance of forward visibility was again
emphasised in streetlighting: although there is no
absolute capacity constraint, work is currently
commissioned too late
• “In streetlighting, the lead time for columns and luminaries is 10-14 weeks. We currently have
one week notice, and need better visibility of work to scale up streetlighting.”
Tier 3 supplier
Notes: 1 The cost difference for imported bitumen compared to domestic was felt to be offset by falling oil prices
Source: Credo Fieldwork & analysis
PEOPLE
PLANT
MATERIALS
Capacity
Constraints1
2
3
Ability to
scale
Existing
mitigations
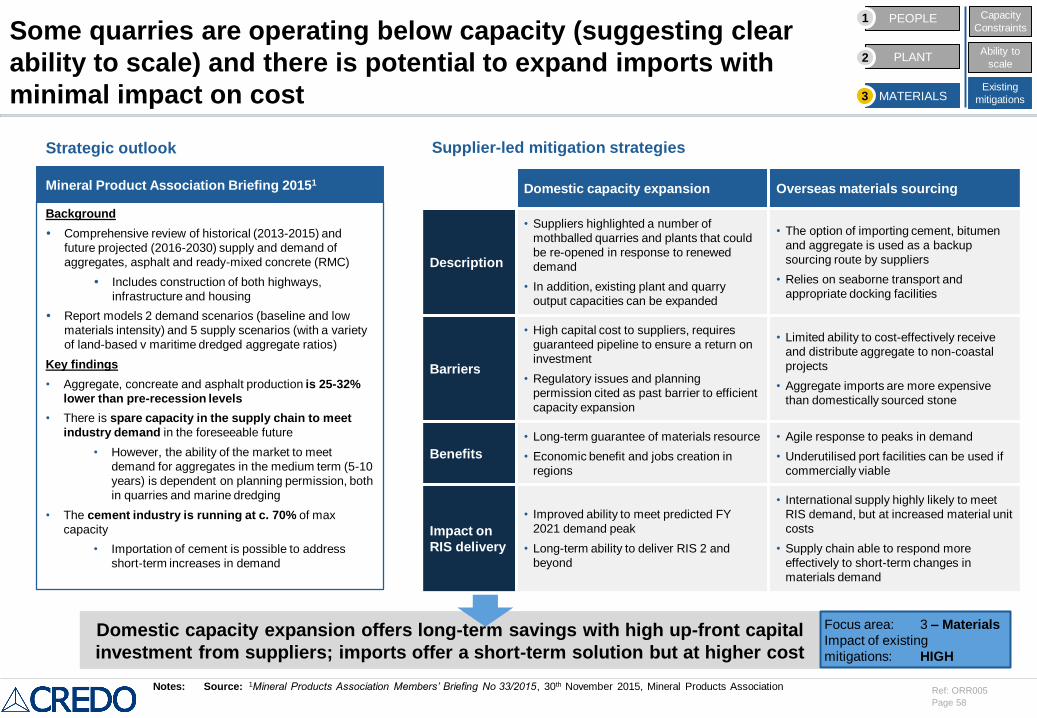
Page 58
Ref: ORR005
Some quarries are operating below capacity (suggesting clear
ability to scale) and there is potential to expand imports with
minimal impact on cost
Domestic capacity expansion offers long-term savings with high up-front capital
investment from suppliers; imports offer a short-term solution but at higher cost
Domestic capacity expansion Overseas materials sourcing
Description
• Suppliers highlighted a number of
mothballed quarries and plants that could
be re-opened in response to renewed
demand
• In addition, existing plant and quarry
output capacities can be expanded
• The option of importing cement, bitumen
and aggregate is used as a backup
sourcing route by suppliers
• Relies on seaborne transport and
appropriate docking facilities
Barriers
• High capital cost to suppliers, requires
guaranteed pipeline to ensure a return on
investment
• Regulatory issues and planning
permission cited as past barrier to efficient
capacity expansion
• Limited ability to cost-effectively receive
and distribute aggregate to non-coastal
projects
• Aggregate imports are more expensive
than domestically sourced stone
Benefits
• Long-term guarantee of materials resource
• Economic benefit and jobs creation in
regions
• Agile response to peaks in demand
• Underutilised port facilities can be used if
commercially viable
Impact on
RIS delivery
• Improved ability to meet predicted FY
2021 demand peak
• Long-term ability to deliver RIS 2 and
beyond
• International supply highly likely to meet
RIS demand, but at increased material unit
costs
• Supply chain able to respond more
effectively to short-term changes in
materials demand
Focus area: 3 – Materials
Impact of existing
mitigations: HIGH
Notes: Source: 1Mineral Products Association Members’ Briefing No 33/2015, 30th November 2015, Mineral Products Association
Background
Comprehensive review of historical (2013-2015) and
future projected (2016-2030) supply and demand of
aggregates, asphalt and ready-mixed concrete (RMC)
Includes construction of both highways,
infrastructure and housing
Report models 2 demand scenarios (baseline and low
materials intensity) and 5 supply scenarios (with a variety
of land-based v maritime dredged aggregate ratios)
Key findings
• Aggregate, concreate and asphalt production is 25-32%
lower than pre-recession levels
• There is spare capacity in the supply chain to meet
industry demand in the foreseeable future
• However, the ability of the market to meet
demand for aggregates in the medium term (5-10
years) is dependent on planning permission, both
in quarries and marine dredging
• The cement industry is running at c. 70% of max
capacity
• Importation of cement is possible to address
short-term increases in demand
Mineral Product Association Briefing 20151
Strategic outlook Supplier-led mitigation strategies
PEOPLE
PLANT
MATERIALS
Capacity
Constraints1
2
3
Ability to
scale
Existing
mitigations
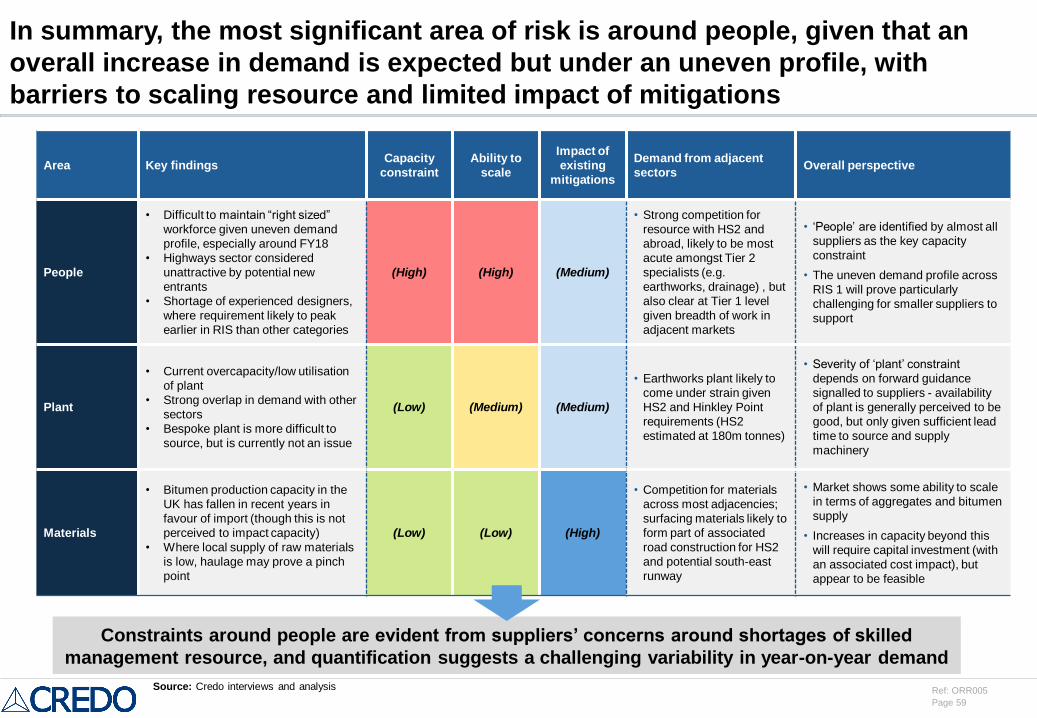
Page 59
Ref: ORR005
In summary, the most significant area of risk is around people, given that an
overall increase in demand is expected but under an uneven profile, with
barriers to scaling resource and limited impact of mitigations
Area Key findingsCapacity
constraint
Ability to
scale
Impact of
existing
mitigations
Demand from adjacent
sectorsOverall perspective
People
• Difficult to maintain “right sized”
workforce given uneven demand
profile, especially around FY18
• Highways sector considered
unattractive by potential new
entrants
• Shortage of experienced designers,
where requirement likely to peak
earlier in RIS than other categories
(High) (High) (Medium)
• Strong competition for
resource with HS2 and
abroad, likely to be most
acute amongst Tier 2
specialists (e.g.
earthworks, drainage) , but
also clear at Tier 1 level
given breadth of work in
adjacent markets
• ‘People’ are identified by almost all
suppliers as the key capacity
constraint
• The uneven demand profile across
RIS 1 will prove particularly
challenging for smaller suppliers to
support
Plant
• Current overcapacity/low utilisation
of plant
• Strong overlap in demand with other
sectors
• Bespoke plant is more difficult to
source, but is currently not an issue
(Low) (Medium) (Medium)
• Earthworks plant likely to
come under strain given
HS2 and Hinkley Point
requirements (HS2
estimated at 180m tonnes)
• Severity of ‘plant’ constraint
depends on forward guidance
signalled to suppliers - availability
of plant is generally perceived to be
good, but only given sufficient lead
time to source and supply
machinery
Materials
• Bitumen production capacity in the
UK has fallen in recent years in
favour of import (though this is not
perceived to impact capacity)
• Where local supply of raw materials
is low, haulage may prove a pinch
point
(Low) (Low) (High)
• Competition for materials
across most adjacencies;
surfacing materials likely to
form part of associated
road construction for HS2
and potential south-east
runway
• Market shows some ability to scale
in terms of aggregates and bitumen
supply
• Increases in capacity beyond this
will require capital investment (with
an associated cost impact), but
appear to be feasible
Constraints around people are evident from suppliers’ concerns around shortages of skilled
management resource, and quantification suggests a challenging variability in year-on-year demand
Source: Credo interviews and analysis
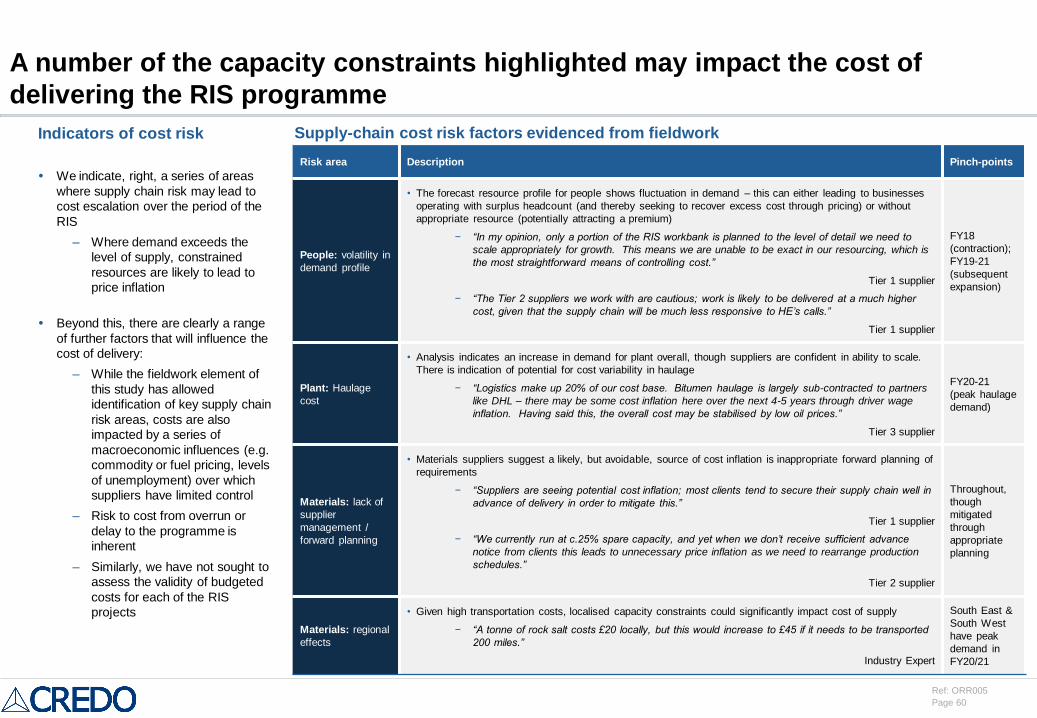
Page 60
Ref: ORR005
A number of the capacity constraints highlighted may impact the cost of
delivering the RIS programme
Indicators of cost risk
We indicate, right, a series of areas
where supply chain risk may lead to
cost escalation over the period of the
RIS
– Where demand exceeds the
level of supply, constrained
resources are likely to lead to
price inflation
Beyond this, there are clearly a range
of further factors that will influence the
cost of delivery:
– While the fieldwork element of
this study has allowed
identification of key supply chain
risk areas, costs are also
impacted by a series of
macroeconomic influences (e.g.
commodity or fuel pricing, levels
of unemployment) over which
suppliers have limited control
– Risk to cost from overrun or
delay to the programme is
inherent
– Similarly, we have not sought to
assess the validity of budgeted
costs for each of the RIS
projects
Risk area Description Pinch-points
People: volatility in
demand profile
• The forecast resource profile for people shows fluctuation in demand – this can either leading to businesses
operating with surplus headcount (and thereby seeking to recover excess cost through pricing) or without
appropriate resource (potentially attracting a premium)
− “In my opinion, only a portion of the RIS workbank is planned to the level of detail we need to
scale appropriately for growth. This means we are unable to be exact in our resourcing, which is
the most straightforward means of controlling cost.”
Tier 1 supplier
− “The Tier 2 suppliers we work with are cautious; work is likely to be delivered at a much higher
cost, given that the supply chain will be much less responsive to HE’s calls.”
Tier 1 supplier
FY18
(contraction);
FY19-21
(subsequent
expansion)
Plant: Haulage
cost
• Analysis indicates an increase in demand for plant overall, though suppliers are confident in ability to scale.
There is indication of potential for cost variability in haulage
− “Logistics make up 20% of our cost base. Bitumen haulage is largely sub-contracted to partners
like DHL – there may be some cost inflation here over the next 4-5 years through driver wage
inflation. Having said this, the overall cost may be stabilised by low oil prices.”
Tier 3 supplier
FY20-21
(peak haulage
demand)
Materials: lack of
supplier
management /
forward planning
• Materials suppliers suggest a likely, but avoidable, source of cost inflation is inappropriate forward planning of
requirements
− “Suppliers are seeing potential cost inflation; most clients tend to secure their supply chain well in
advance of delivery in order to mitigate this.”
Tier 1 supplier
− “We currently run at c.25% spare capacity, and yet when we don’t receive sufficient advance
notice from clients this leads to unnecessary price inflation as we need to rearrange production
schedules.”
Tier 2 supplier
Throughout,
though
mitigated
through
appropriate
planning
Materials: regional
effects
• Given high transportation costs, localised capacity constraints could significantly impact cost of supply
− “A tonne of rock salt costs £20 locally, but this would increase to £45 if it needs to be transported
200 miles.”
Industry Expert
South East &
South West
have peak
demand in
FY20/21
Supply-chain cost risk factors evidenced from fieldwork
Page 61
Ref: ORR005
Agenda
Executive summary
Market situation and background
Supply chain capacity assessment
HE approach to procurement and project management
Key Performance Indicators and recommendations for ORR
Appendix
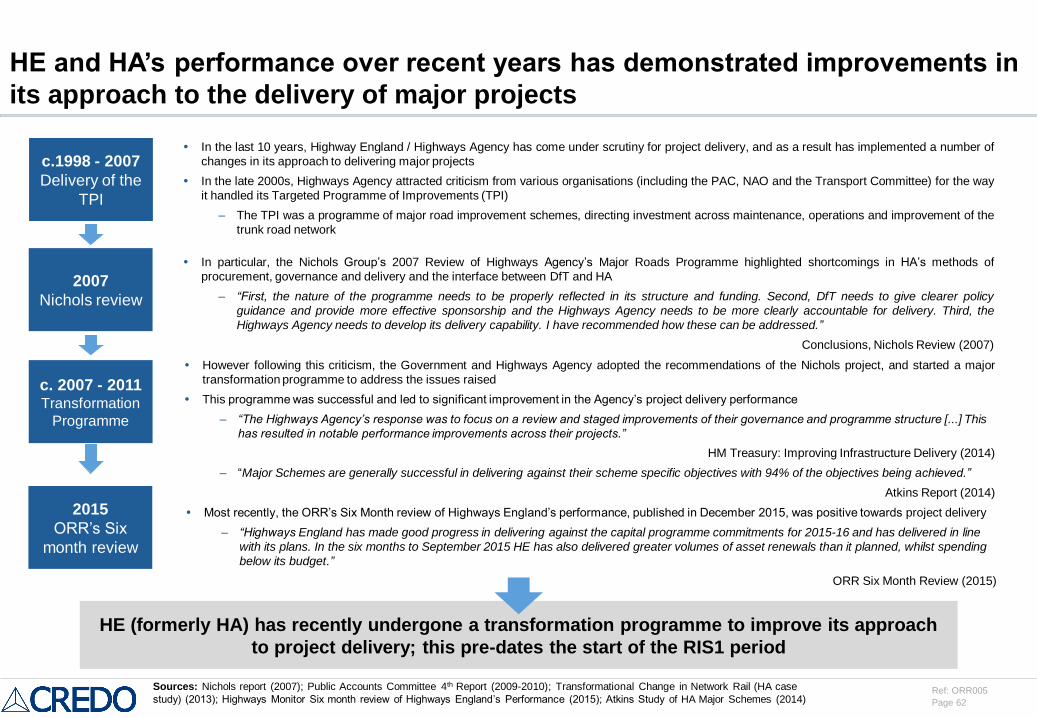
Page 62
Ref: ORR005
HE and HA’s performance over recent years has demonstrated improvements in
its approach to the delivery of major projects
Most recently, the ORR’s Six Month review of Highways England’s performance, published in December 2015, was positive towards project delivery
– “Highways England has made good progress in delivering against the capital programme commitments for 2015-16 and has delivered in line
with its plans. In the six months to September 2015 HE has also delivered greater volumes of asset renewals than it planned, whilst spending
below its budget.”
ORR Six Month Review (2015)
Sources: Nichols report (2007); Public Accounts Committee 4th Report (2009-2010); Transformational Change in Network Rail (HA case
study) (2013); Highways Monitor Six month review of Highways England’s Performance (2015); Atkins Study of HA Major Schemes (2014)
c.1998 - 2007
Delivery of the
TPI
2007
Nichols review
2015
ORR’s Six
month review
In the last 10 years, Highway England / Highways Agency has come under scrutiny for project delivery, and as a result has implemented a number of
changes in its approach to delivering major projects
In the late 2000s, Highways Agency attracted criticism from various organisations (including the PAC, NAO and the Transport Committee) for the way
it handled its Targeted Programme of Improvements (TPI)
– The TPI was a programme of major road improvement schemes, directing investment across maintenance, operations and improvement of the
trunk road network
In particular, the Nichols Group’s 2007 Review of Highways Agency’s Major Roads Programme highlighted shortcomings in HA’s methods of
procurement, governance and delivery and the interface between DfT and HA
– “First, the nature of the programme needs to be properly reflected in its structure and funding. Second, DfT needs to give clearer policy
guidance and provide more effective sponsorship and the Highways Agency needs to be more clearly accountable for delivery. Third, the
Highways Agency needs to develop its delivery capability. I have recommended how these can be addressed.”
Conclusions, Nichols Review (2007)
However following this criticism, the Government and Highways Agency adopted the recommendations of the Nichols project, and started a major
transformation programme to address the issues raised
This programme was successful and led to significant improvement in the Agency’s project delivery performance
– “The Highways Agency’s response was to focus on a review and staged improvements of their governance and programme structure [...] This
has resulted in notable performance improvements across their projects.”
HM Treasury: Improving Infrastructure Delivery (2014)
– “Major Schemes are generally successful in delivering against their scheme specific objectives with 94% of the objectives being achieved.”
Atkins Report (2014)
HE (formerly HA) has recently undergone a transformation programme to improve its approach
to project delivery; this pre-dates the start of the RIS1 period
c. 2007 - 2011Transformation
Programme
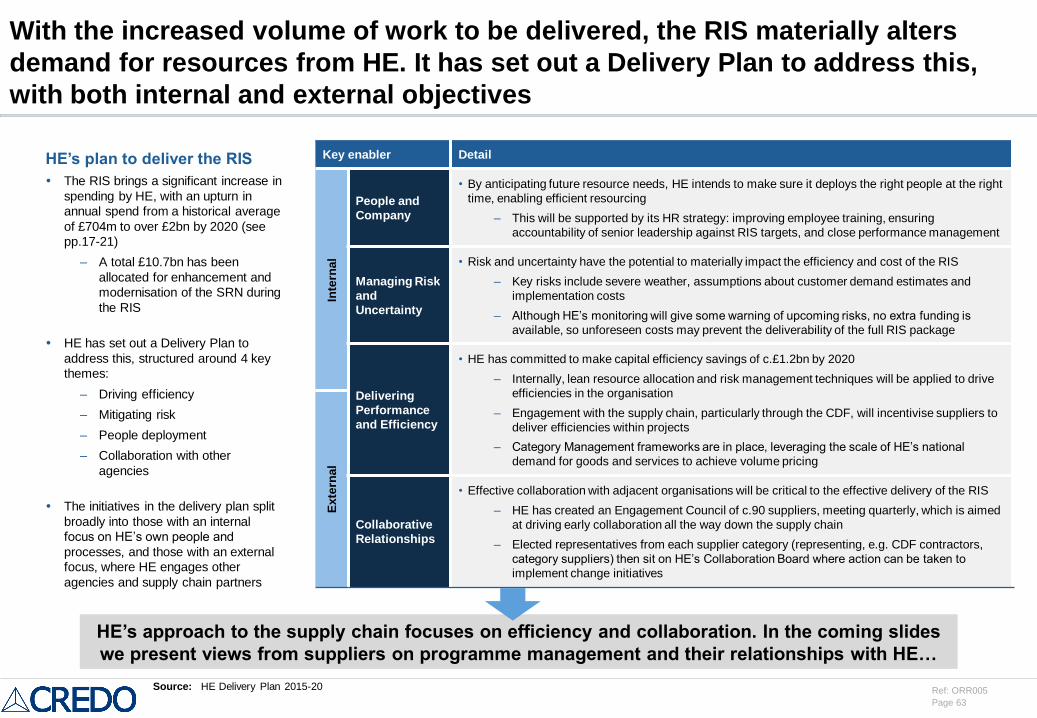
Page 63
Ref: ORR005
With the increased volume of work to be delivered, the RIS materially alters
demand for resources from HE. It has set out a Delivery Plan to address this,
with both internal and external objectives
HE’s plan to deliver the RIS
The RIS brings a significant increase in
spending by HE, with an upturn in
annual spend from a historical average
of £704m to over £2bn by 2020 (see
pp.17-21)
– A total £10.7bn has been
allocated for enhancement and
modernisation of the SRN during
the RIS
HE has set out a Delivery Plan to
address this, structured around 4 key
themes:
– Driving efficiency
– Mitigating risk
– People deployment
– Collaboration with other
agencies
The initiatives in the delivery plan split
broadly into those with an internal
focus on HE’s own people and
processes, and those with an external
focus, where HE engages other
agencies and supply chain partners
Key enabler Detail
Inte
rnal
People and
Company
• By anticipating future resource needs, HE intends to make sure it deploys the right people at the right
time, enabling efficient resourcing
– This will be supported by its HR strategy: improving employee training, ensuring
accountability of senior leadership against RIS targets, and close performance management
Managing Risk
and
Uncertainty
• Risk and uncertainty have the potential to materially impact the efficiency and cost of the RIS
– Key risks include severe weather, assumptions about customer demand estimates and
implementation costs
– Although HE’s monitoring will give some warning of upcoming risks, no extra funding is
available, so unforeseen costs may prevent the deliverability of the full RIS package
Delivering
Performance
and Efficiency
• HE has committed to make capital efficiency savings of c.£1.2bn by 2020
– Internally, lean resource allocation and risk management techniques will be applied to drive
efficiencies in the organisation
– Engagement with the supply chain, particularly through the CDF, will incentivise suppliers to
deliver efficiencies within projects
– Category Management frameworks are in place, leveraging the scale of HE’s national
demand for goods and services to achieve volume pricing
Exte
rnal
Collaborative
Relationships
• Effective collaboration with adjacent organisations will be critical to the effective delivery of the RIS
– HE has created an Engagement Council of c.90 suppliers, meeting quarterly, which is aimed
at driving early collaboration all the way down the supply chain
– Elected representatives from each supplier category (representing, e.g. CDF contractors,
category suppliers) then sit on HE’s Collaboration Board where action can be taken to
implement change initiatives
Source: HE Delivery Plan 2015-20
HE’s approach to the supply chain focuses on efficiency and collaboration. In the coming slides
we present views from suppliers on programme management and their relationships with HE…
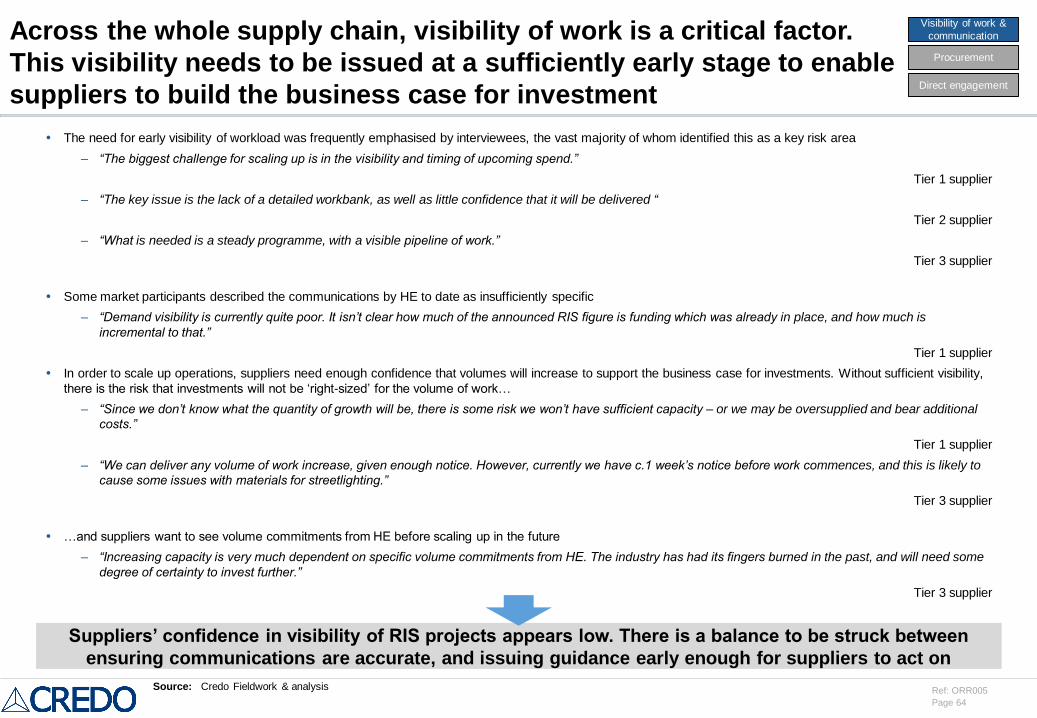
Page 64
Ref: ORR005
Visibility of work &
communication
Procurement
Direct engagement
Across the whole supply chain, visibility of work is a critical factor.
This visibility needs to be issued at a sufficiently early stage to enable
suppliers to build the business case for investment
The need for early visibility of workload was frequently emphasised by interviewees, the vast majority of whom identified this as a key risk area
– “The biggest challenge for scaling up is in the visibility and timing of upcoming spend.”
Tier 1 supplier
– “The key issue is the lack of a detailed workbank, as well as little confidence that it will be delivered “
Tier 2 supplier
– “What is needed is a steady programme, with a visible pipeline of work.”
Tier 3 supplier
Some market participants described the communications by HE to date as insufficiently specific
– “Demand visibility is currently quite poor. It isn’t clear how much of the announced RIS figure is funding which was already in place, and how much is
incremental to that.”
Tier 1 supplier
In order to scale up operations, suppliers need enough confidence that volumes will increase to support the business case for investments. Without sufficient visibility,
there is the risk that investments will not be ‘right-sized’ for the volume of work…
– “Since we don’t know what the quantity of growth will be, there is some risk we won’t have sufficient capacity – or we may be oversupplied and bear additional
costs.”
Tier 1 supplier
– “We can deliver any volume of work increase, given enough notice. However, currently we have c.1 week’s notice before work commences, and this is likely to
cause some issues with materials for streetlighting.”
Tier 3 supplier
…and suppliers want to see volume commitments from HE before scaling up in the future
– “Increasing capacity is very much dependent on specific volume commitments from HE. The industry has had its fingers burned in the past, and will need some
degree of certainty to invest further.”
Tier 3 supplier
Suppliers’ confidence in visibility of RIS projects appears low. There is a balance to be struck between
ensuring communications are accurate, and issuing guidance early enough for suppliers to act on
Source: Credo Fieldwork & analysis
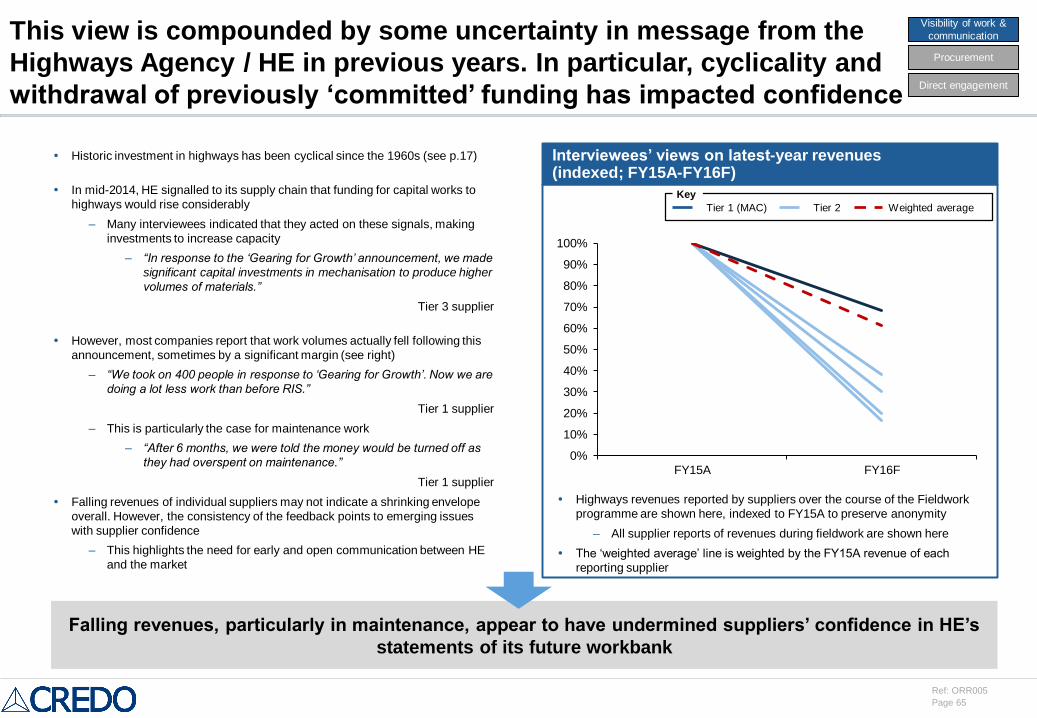
Page 65
Ref: ORR005
This view is compounded by some uncertainty in message from the
Highways Agency / HE in previous years. In particular, cyclicality and
withdrawal of previously ‘committed’ funding has impacted confidence
Historic investment in highways has been cyclical since the 1960s (see p.17)
In mid-2014, HE signalled to its supply chain that funding for capital works to
highways would rise considerably
– Many interviewees indicated that they acted on these signals, making
investments to increase capacity
– “In response to the ‘Gearing for Growth’ announcement, we made
significant capital investments in mechanisation to produce higher
volumes of materials.”
Tier 3 supplier
However, most companies report that work volumes actually fell following this
announcement, sometimes by a significant margin (see right)
– “We took on 400 people in response to ‘Gearing for Growth’. Now we are
doing a lot less work than before RIS.”
Tier 1 supplier
– This is particularly the case for maintenance work
– “After 6 months, we were told the money would be turned off as
they had overspent on maintenance.”
Tier 1 supplier
Falling revenues of individual suppliers may not indicate a shrinking envelope
overall. However, the consistency of the feedback points to emerging issues
with supplier confidence
– This highlights the need for early and open communication between HE
and the market
Interviewees’ views on latest-year revenues(indexed; FY15A-FY16F)
Falling revenues, particularly in maintenance, appear to have undermined suppliers’ confidence in HE’s
statements of its future workbank
Highways revenues reported by suppliers over the course of the Fieldwork
programme are shown here, indexed to FY15A to preserve anonymity
– All supplier reports of revenues during fieldwork are shown here
The ‘weighted average’ line is weighted by the FY15A revenue of each
reporting supplier
0%
10%
20%
30%
40%
50%
60%
70%
80%
90%
100%
FY15A FY16F
Tier 1 (MAC) Tier 2 Weighted average
Key
Visibility of work &
communication
Procurement
Direct engagement
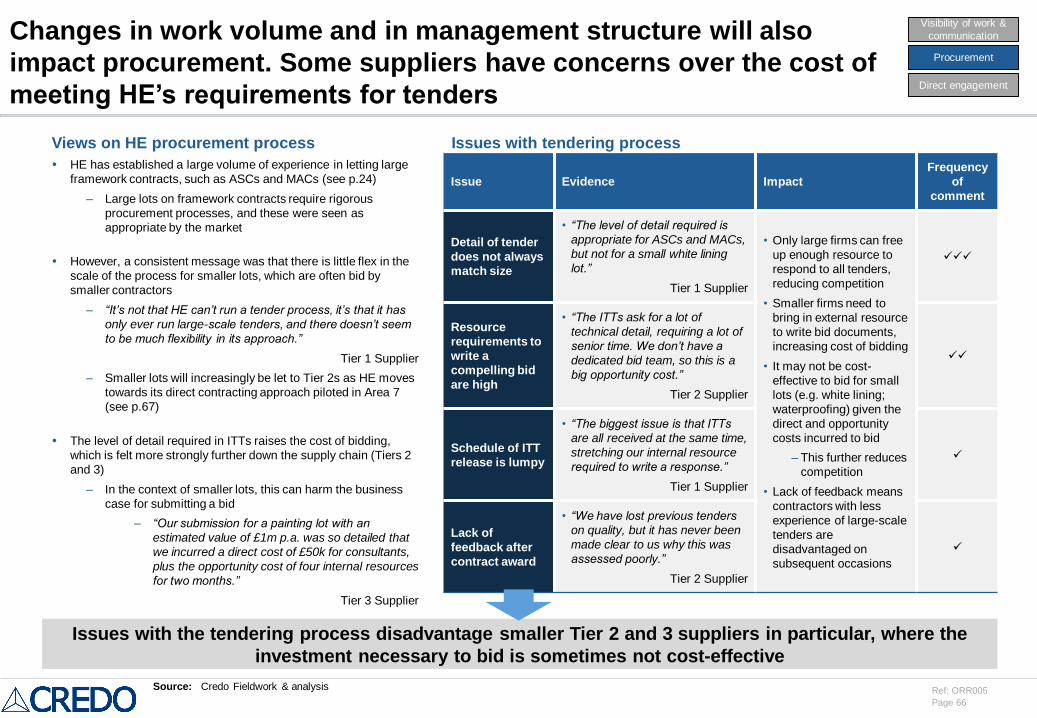
Page 66
Ref: ORR005
Visibility of work &
communication
Procurement
Direct engagement
Changes in work volume and in management structure will also
impact procurement. Some suppliers have concerns over the cost of
meeting HE’s requirements for tenders
Views on HE procurement process
HE has established a large volume of experience in letting large
framework contracts, such as ASCs and MACs (see p.24)
– Large lots on framework contracts require rigorous
procurement processes, and these were seen as
appropriate by the market
However, a consistent message was that there is little flex in the
scale of the process for smaller lots, which are often bid by
smaller contractors
– “It’s not that HE can’t run a tender process, it’s that it has
only ever run large-scale tenders, and there doesn’t seem
to be much flexibility in its approach.”
Tier 1 Supplier
– Smaller lots will increasingly be let to Tier 2s as HE moves
towards its direct contracting approach piloted in Area 7
(see p.67)
The level of detail required in ITTs raises the cost of bidding,
which is felt more strongly further down the supply chain (Tiers 2
and 3)
– In the context of smaller lots, this can harm the business
case for submitting a bid
– “Our submission for a painting lot with an
estimated value of £1m p.a. was so detailed that
we incurred a direct cost of £50k for consultants,
plus the opportunity cost of four internal resources
for two months.”
Tier 3 Supplier
Issue Evidence Impact
Frequency
of
comment
Detail of tender
does not always
match size
• “The level of detail required is
appropriate for ASCs and MACs,
but not for a small white lining
lot.”
Tier 1 Supplier
• Only large firms can free
up enough resource to
respond to all tenders,
reducing competition
• Smaller firms need to
bring in external resource
to write bid documents,
increasing cost of bidding
• It may not be cost-
effective to bid for small
lots (e.g. white lining;
waterproofing) given the
direct and opportunity
costs incurred to bid
– This further reduces
competition
• Lack of feedback means
contractors with less
experience of large-scale
tenders are
disadvantaged on
subsequent occasions
Resource
requirements to
write a
compelling bid
are high
• “The ITTs ask for a lot of
technical detail, requiring a lot of
senior time. We don’t have a
dedicated bid team, so this is a
big opportunity cost.”
Tier 2 Supplier
Schedule of ITT
release is lumpy
• “The biggest issue is that ITTs
are all received at the same time,
stretching our internal resource
required to write a response.”
Tier 1 Supplier
Lack of
feedback after
contract award
• “We have lost previous tenders
on quality, but it has never been
made clear to us why this was
assessed poorly.”
Tier 2 Supplier
Issues with the tendering process disadvantage smaller Tier 2 and 3 suppliers in particular, where the
investment necessary to bid is sometimes not cost-effective
Issues with tendering process
Source: Credo Fieldwork & analysis
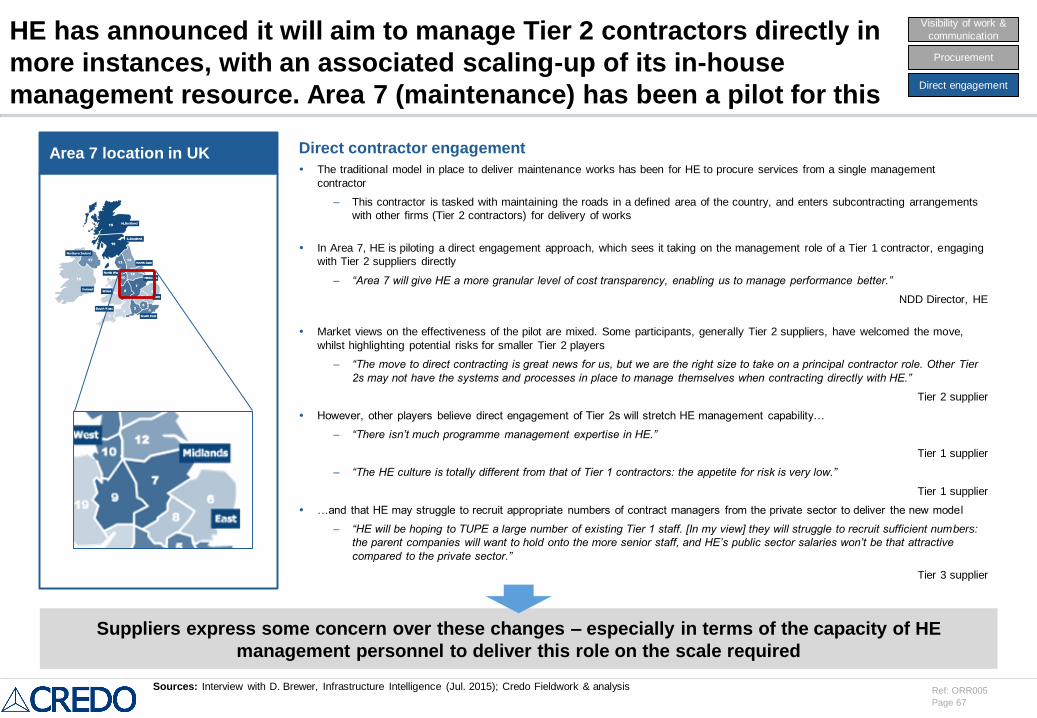
Page 67
Ref: ORR005
HE has announced it will aim to manage Tier 2 contractors directly in
more instances, with an associated scaling-up of its in-house
management resource. Area 7 (maintenance) has been a pilot for this
Area 7 location in UK Direct contractor engagement
The traditional model in place to deliver maintenance works has been for HE to procure services from a single management
contractor
– This contractor is tasked with maintaining the roads in a defined area of the country, and enters subcontracting arrangements
with other firms (Tier 2 contractors) for delivery of works
In Area 7, HE is piloting a direct engagement approach, which sees it taking on the management role of a Tier 1 contractor, engaging
with Tier 2 suppliers directly
– “Area 7 will give HE a more granular level of cost transparency, enabling us to manage performance better.”
NDD Director, HE
Market views on the effectiveness of the pilot are mixed. Some participants, generally Tier 2 suppliers, have welcomed the move,
whilst highlighting potential risks for smaller Tier 2 players
– “The move to direct contracting is great news for us, but we are the right size to take on a principal contractor role. Other Tier
2s may not have the systems and processes in place to manage themselves when contracting directly with HE.”
Tier 2 supplier
However, other players believe direct engagement of Tier 2s will stretch HE management capability…
– “There isn’t much programme management expertise in HE.”
Tier 1 supplier
– “The HE culture is totally different from that of Tier 1 contractors: the appetite for risk is very low.”
Tier 1 supplier
…and that HE may struggle to recruit appropriate numbers of contract managers from the private sector to deliver the new model
– “HE will be hoping to TUPE a large number of existing Tier 1 staff. [In my view] they will struggle to recruit sufficient numbers:
the parent companies will want to hold onto the more senior staff, and HE’s public sector salaries won’t be that attractive
compared to the private sector.”
Tier 3 supplier
Suppliers express some concern over these changes – especially in terms of the capacity of HE
management personnel to deliver this role on the scale required
Sources: Interview with D. Brewer, Infrastructure Intelligence (Jul. 2015); Credo Fieldwork & analysis
Visibility of work &
communication
Procurement
Direct engagement
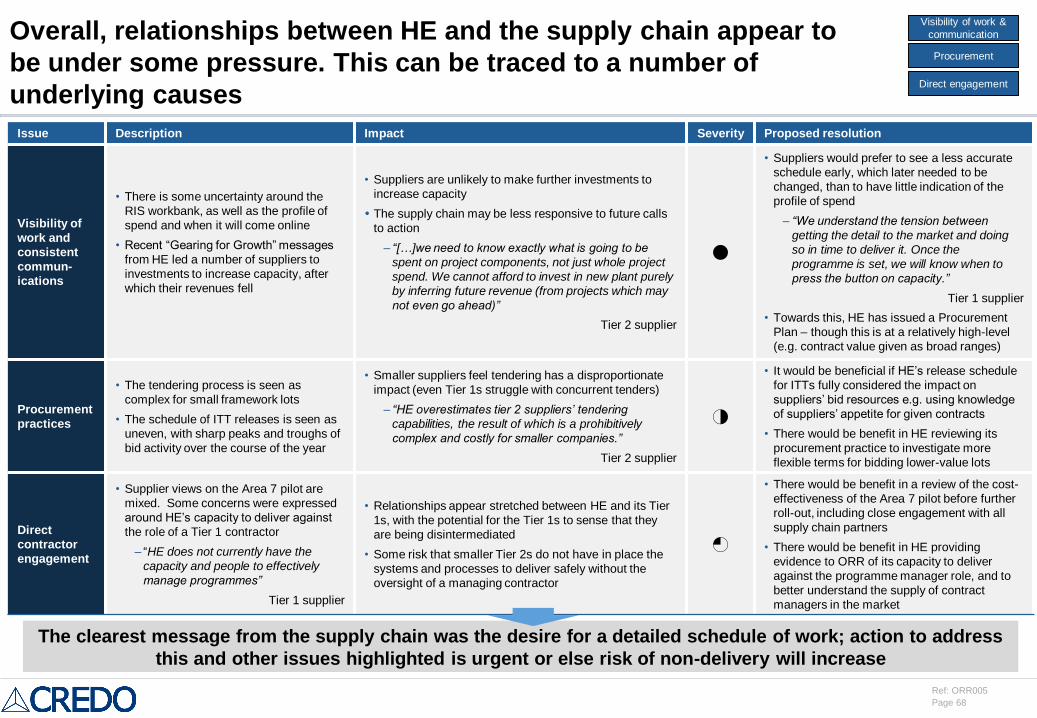
Page 68
Ref: ORR005
Overall, relationships between HE and the supply chain appear to
be under some pressure. This can be traced to a number of
underlying causes
Visibility of work &
communication
Procurement
Direct engagement
The clearest message from the supply chain was the desire for a detailed schedule of work; action to address
this and other issues highlighted is urgent or else risk of non-delivery will increase
Issue Description Impact Severity Proposed resolution
Visibility of
work and
consistent
commun-
ications
• There is some uncertainty around the
RIS workbank, as well as the profile of
spend and when it will come online
• Recent “Gearing for Growth” messages
from HE led a number of suppliers to
investments to increase capacity, after
which their revenues fell
• Suppliers are unlikely to make further investments to
increase capacity
The supply chain may be less responsive to future calls
to action
– “[…]we need to know exactly what is going to be
spent on project components, not just whole project
spend. We cannot afford to invest in new plant purely
by inferring future revenue (from projects which may
not even go ahead)”
Tier 2 supplier
4
• Suppliers would prefer to see a less accurate
schedule early, which later needed to be
changed, than to have little indication of the
profile of spend
– “We understand the tension between
getting the detail to the market and doing
so in time to deliver it. Once the
programme is set, we will know when to
press the button on capacity.”
Tier 1 supplier
• Towards this, HE has issued a Procurement
Plan – though this is at a relatively high-level
(e.g. contract value given as broad ranges)
Procurement
practices
• The tendering process is seen as
complex for small framework lots
• The schedule of ITT releases is seen as
uneven, with sharp peaks and troughs of
bid activity over the course of the year
• Smaller suppliers feel tendering has a disproportionate
impact (even Tier 1s struggle with concurrent tenders)
– “HE overestimates tier 2 suppliers’ tendering
capabilities, the result of which is a prohibitively
complex and costly for smaller companies.”
Tier 2 supplier
2
• It would be beneficial if HE’s release schedule
for ITTs fully considered the impact on
suppliers’ bid resources e.g. using knowledge
of suppliers’ appetite for given contracts
• There would be benefit in HE reviewing its
procurement practice to investigate more
flexible terms for bidding lower-value lots
Direct
contractor
engagement
• Supplier views on the Area 7 pilot are
mixed. Some concerns were expressed
around HE’s capacity to deliver against
the role of a Tier 1 contractor
– “HE does not currently have the
capacity and people to effectively
manage programmes”
Tier 1 supplier
• Relationships appear stretched between HE and its Tier
1s, with the potential for the Tier 1s to sense that they
are being disintermediated
• Some risk that smaller Tier 2s do not have in place the
systems and processes to deliver safely without the
oversight of a managing contractor
7
• There would be benefit in a review of the cost-
effectiveness of the Area 7 pilot before further
roll-out, including close engagement with all
supply chain partners
• There would be benefit in HE providing
evidence to ORR of its capacity to deliver
against the programme manager role, and to
better understand the supply of contract
managers in the market
Page 69
Ref: ORR005
Agenda
Executive summary
Market situation and background
Supply chain capacity assessment
HE approach to procurement and project management
Key Performance Indicators and recommendations for ORR
Appendix
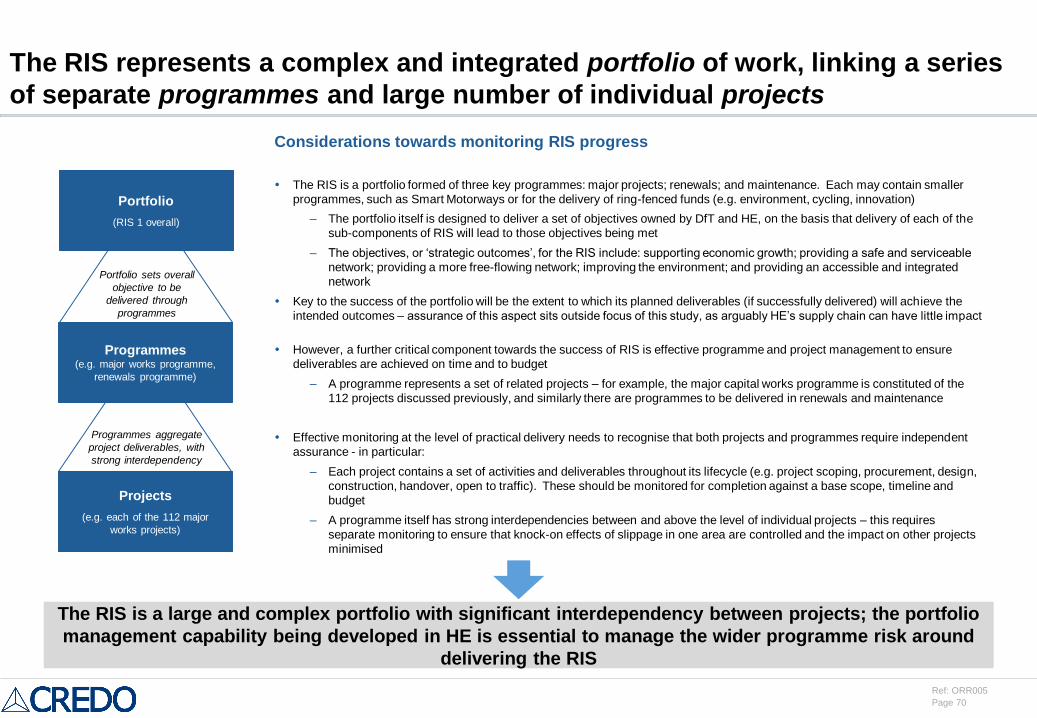
Page 70
Ref: ORR005
The RIS represents a complex and integrated portfolio of work, linking a series
of separate programmes and large number of individual projects
Considerations towards monitoring RIS progress
The RIS is a portfolio formed of three key programmes: major projects; renewals; and maintenance. Each may contain smaller
programmes, such as Smart Motorways or for the delivery of ring-fenced funds (e.g. environment, cycling, innovation)
– The portfolio itself is designed to deliver a set of objectives owned by DfT and HE, on the basis that delivery of each of the
sub-components of RIS will lead to those objectives being met
– The objectives, or ‘strategic outcomes’, for the RIS include: supporting economic growth; providing a safe and serviceable
network; providing a more free-flowing network; improving the environment; and providing an accessible and integrated
network
Key to the success of the portfolio will be the extent to which its planned deliverables (if successfully delivered) will achieve the
intended outcomes – assurance of this aspect sits outside focus of this study, as arguably HE’s supply chain can have little impact
However, a further critical component towards the success of RIS is effective programme and project management to ensure
deliverables are achieved on time and to budget
– A programme represents a set of related projects – for example, the major capital works programme is constituted of the
112 projects discussed previously, and similarly there are programmes to be delivered in renewals and maintenance
Effective monitoring at the level of practical delivery needs to recognise that both projects and programmes require independent
assurance - in particular:
– Each project contains a set of activities and deliverables throughout its lifecycle (e.g. project scoping, procurement, design,
construction, handover, open to traffic). These should be monitored for completion against a base scope, timeline and
budget
– A programme itself has strong interdependencies between and above the level of individual projects – this requires
separate monitoring to ensure that knock-on effects of slippage in one area are controlled and the impact on other projects
minimised
The RIS is a large and complex portfolio with significant interdependency between projects; the portfolio
management capability being developed in HE is essential to manage the wider programme risk around
delivering the RIS
Portfolio
(RIS 1 overall)
Programmes(e.g. major works programme,
renewals programme)
Projects
(e.g. each of the 112 major
works projects)
Portfolio sets overall
objective to be
delivered through
programmes
Programmes aggregate
project deliverables, with
strong interdependency
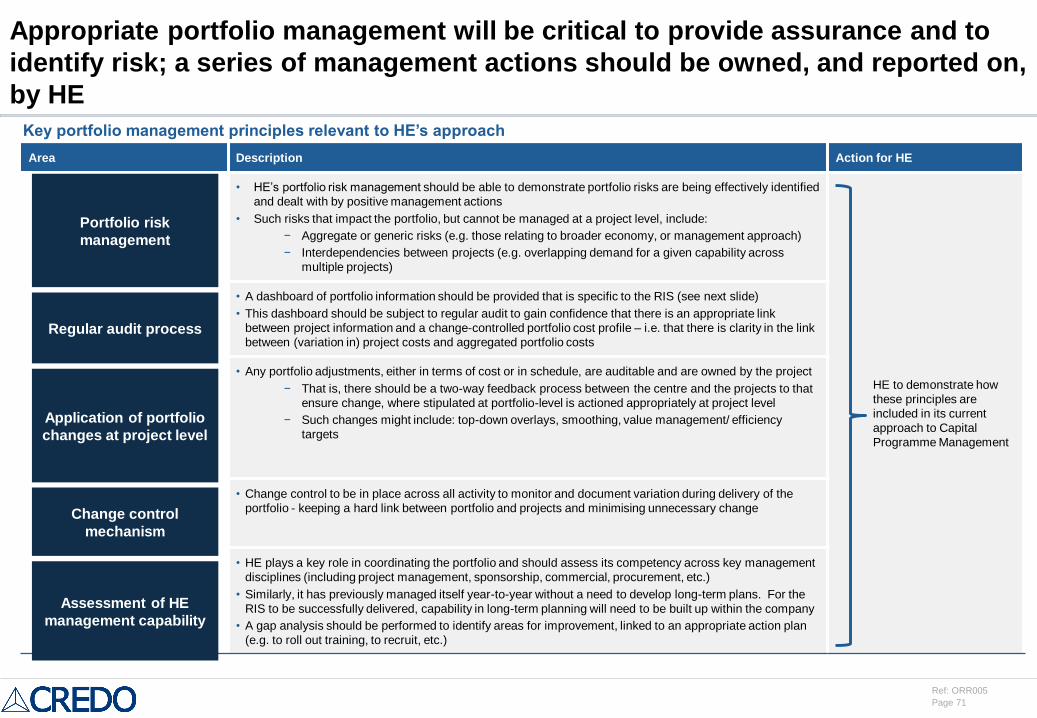
Page 71
Ref: ORR005
Area Description Action for HE
• HE’s portfolio risk management should be able to demonstrate portfolio risks are being effectively identified
and dealt with by positive management actions
• Such risks that impact the portfolio, but cannot be managed at a project level, include:
− Aggregate or generic risks (e.g. those relating to broader economy, or management approach)
− Interdependencies between projects (e.g. overlapping demand for a given capability across
multiple projects)
HE to demonstrate how
these principles are
included in its current
approach to Capital
Programme Management
• A dashboard of portfolio information should be provided that is specific to the RIS (see next slide)
• This dashboard should be subject to regular audit to gain confidence that there is an appropriate link
between project information and a change-controlled portfolio cost profile – i.e. that there is clarity in the link
between (variation in) project costs and aggregated portfolio costs
• Any portfolio adjustments, either in terms of cost or in schedule, are auditable and are owned by the project
− That is, there should be a two-way feedback process between the centre and the projects to that
ensure change, where stipulated at portfolio-level is actioned appropriately at project level
− Such changes might include: top-down overlays, smoothing, value management/ efficiency
targets
• Change control to be in place across all activity to monitor and document variation during delivery of the
portfolio - keeping a hard link between portfolio and projects and minimising unnecessary change
• HE plays a key role in coordinating the portfolio and should assess its competency across key management
disciplines (including project management, sponsorship, commercial, procurement, etc.)
• Similarly, it has previously managed itself year-to-year without a need to develop long-term plans. For the
RIS to be successfully delivered, capability in long-term planning will need to be built up within the company
• A gap analysis should be performed to identify areas for improvement, linked to an appropriate action plan
(e.g. to roll out training, to recruit, etc.)
Appropriate portfolio management will be critical to provide assurance and to
identify risk; a series of management actions should be owned, and reported on,
by HE
Key portfolio management principles relevant to HE’s approach
Portfolio risk
management
Regular audit process
Application of portfolio
changes at project level
Change control
mechanism
Assessment of HE
management capability
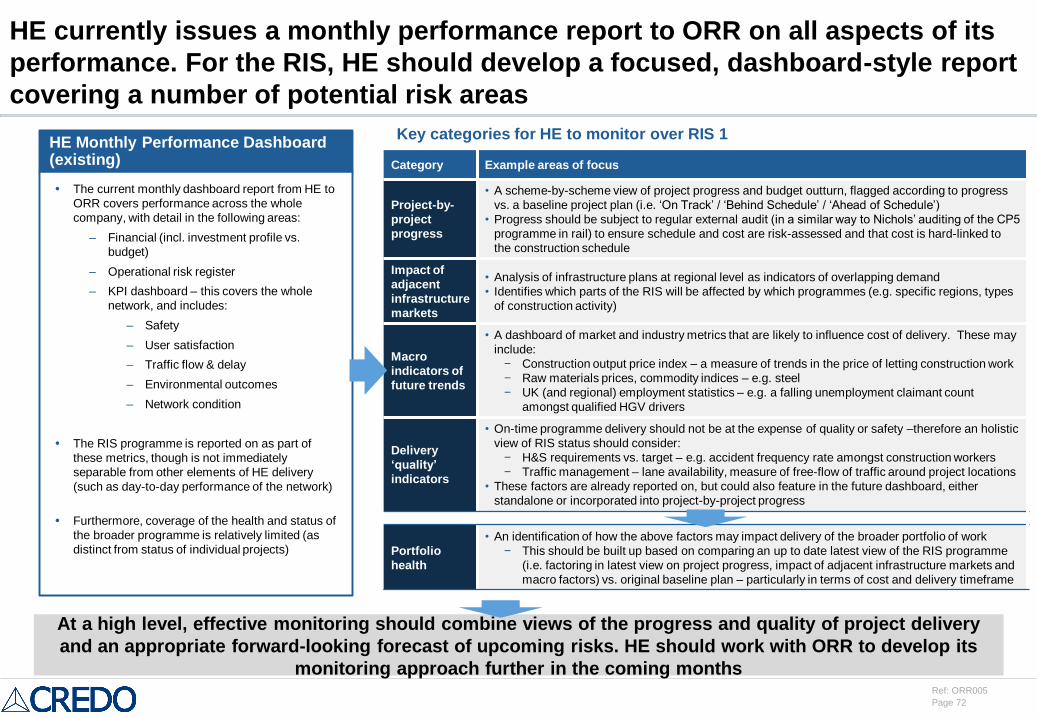
Page 72
Ref: ORR005
HE currently issues a monthly performance report to ORR on all aspects of its
performance. For the RIS, HE should develop a focused, dashboard-style report
covering a number of potential risk areas
HE Monthly Performance Dashboard (existing)
Key categories for HE to monitor over RIS 1
Category Example areas of focus
Project-by-
project
progress
• A scheme-by-scheme view of project progress and budget outturn, flagged according to progress
vs. a baseline project plan (i.e. ‘On Track’ / ‘Behind Schedule’ / ‘Ahead of Schedule’)
• Progress should be subject to regular external audit (in a similar way to Nichols’ auditing of the CP5
programme in rail) to ensure schedule and cost are risk-assessed and that cost is hard-linked to
the construction schedule
Impact of
adjacent
infrastructure
markets
• Analysis of infrastructure plans at regional level as indicators of overlapping demand
• Identifies which parts of the RIS will be affected by which programmes (e.g. specific regions, types
of construction activity)
Macro
indicators of
future trends
• A dashboard of market and industry metrics that are likely to influence cost of delivery. These may
include:
− Construction output price index – a measure of trends in the price of letting construction work
− Raw materials prices, commodity indices – e.g. steel
− UK (and regional) employment statistics – e.g. a falling unemployment claimant count
amongst qualified HGV drivers
Delivery
‘quality’
indicators
• On-time programme delivery should not be at the expense of quality or safety –therefore an holistic
view of RIS status should consider:
− H&S requirements vs. target – e.g. accident frequency rate amongst construction workers
− Traffic management – lane availability, measure of free-flow of traffic around project locations
• These factors are already reported on, but could also feature in the future dashboard, either
standalone or incorporated into project-by-project progress
Portfolio
health
• An identification of how the above factors may impact delivery of the broader portfolio of work
− This should be built up based on comparing an up to date latest view of the RIS programme
(i.e. factoring in latest view on project progress, impact of adjacent infrastructure markets and
macro factors) vs. original baseline plan – particularly in terms of cost and delivery timeframe
At a high level, effective monitoring should combine views of the progress and quality of project delivery
and an appropriate forward-looking forecast of upcoming risks. HE should work with ORR to develop its
monitoring approach further in the coming months
The current monthly dashboard report from HE to
ORR covers performance across the whole
company, with detail in the following areas:
– Financial (incl. investment profile vs.
budget)
– Operational risk register
– KPI dashboard – this covers the whole
network, and includes:
– Safety
– User satisfaction
– Traffic flow & delay
– Environmental outcomes
– Network condition
The RIS programme is reported on as part of
these metrics, though is not immediately
separable from other elements of HE delivery
(such as day-to-day performance of the network)
Furthermore, coverage of the health and status of
the broader programme is relatively limited (as
distinct from status of individual projects)
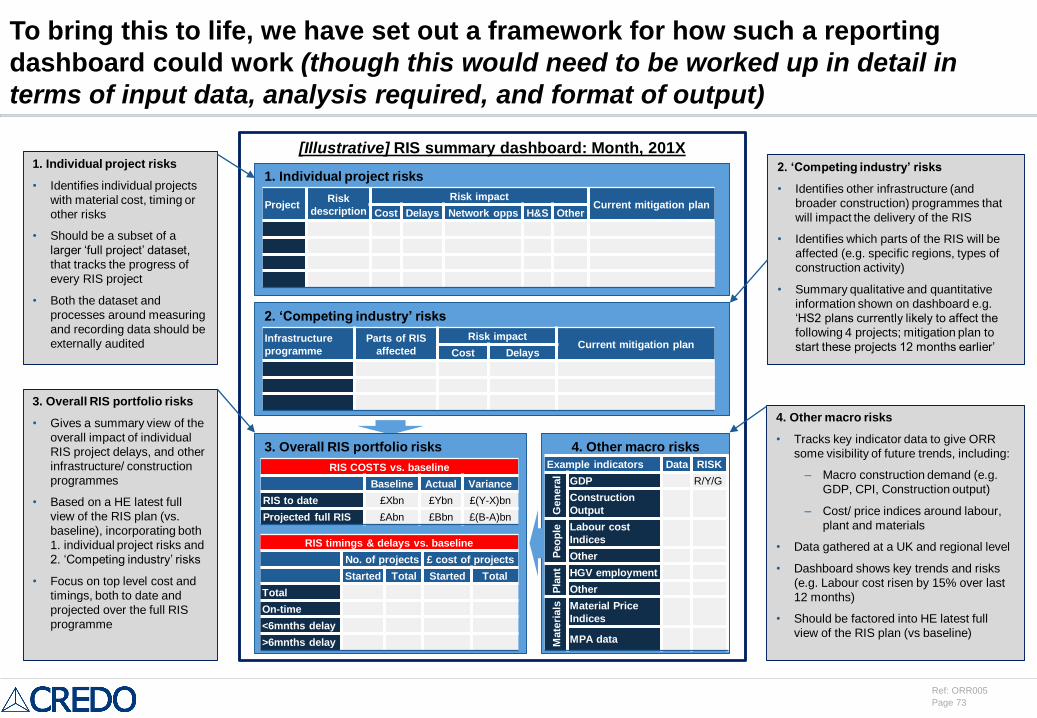
Page 73
Ref: ORR005
To bring this to life, we have set out a framework for how such a reporting
dashboard could work (though this would need to be worked up in detail in
terms of input data, analysis required, and format of output)
[Illustrative] RIS summary dashboard: Month, 201X
1. Individual project risks
ProjectRisk
description
Risk impactCurrent mitigation plan
Cost Delays Network opps H&S Other
2. ‘Competing industry’ risks
Infrastructure
programme
Parts of RIS
affected
Risk impactCurrent mitigation plan
Cost Delays
3. Overall RIS portfolio risks
RIS COSTS vs. baseline
Baseline Actual Variance
RIS to date £Xbn £Ybn £(Y-X)bn
Projected full RIS £Abn £Bbn £(B-A)bn
RIS timings & delays vs. baseline
No. of projects £ cost of projects
Started Total Started Total
Total
On-time
<6mnths delay
>6mnths delay
4. Other macro risks
Example indicators Data RISK
Gen
era
l
GDP R/Y/G
Construction
Output
Peo
ple Labour cost
Indices
OtherP
lan
t HGV employment
Other
Mate
rials Material Price
Indices
MPA data
1. Individual project risks
• Identifies individual projects
with material cost, timing or
other risks
• Should be a subset of a
larger ‘full project’ dataset,
that tracks the progress of
every RIS project
• Both the dataset and
processes around measuring
and recording data should be
externally audited
2. ‘Competing industry’ risks
• Identifies other infrastructure (and
broader construction) programmes that
will impact the delivery of the RIS
• Identifies which parts of the RIS will be
affected (e.g. specific regions, types of
construction activity)
• Summary qualitative and quantitative
information shown on dashboard e.g.
‘HS2 plans currently likely to affect the
following 4 projects; mitigation plan to
start these projects 12 months earlier’
3. Overall RIS portfolio risks
• Gives a summary view of the
overall impact of individual
RIS project delays, and other
infrastructure/ construction
programmes
• Based on a HE latest full
view of the RIS plan (vs.
baseline), incorporating both
1. individual project risks and
2. ‘Competing industry’ risks
• Focus on top level cost and
timings, both to date and
projected over the full RIS
programme
4. Other macro risks
• Tracks key indicator data to give ORR
some visibility of future trends, including:
‒ Macro construction demand (e.g.
GDP, CPI, Construction output)
‒ Cost/ price indices around labour,
plant and materials
• Data gathered at a UK and regional level
• Dashboard shows key trends and risks
(e.g. Labour cost risen by 15% over last
12 months)
• Should be factored into HE latest full
view of the RIS plan (vs baseline)
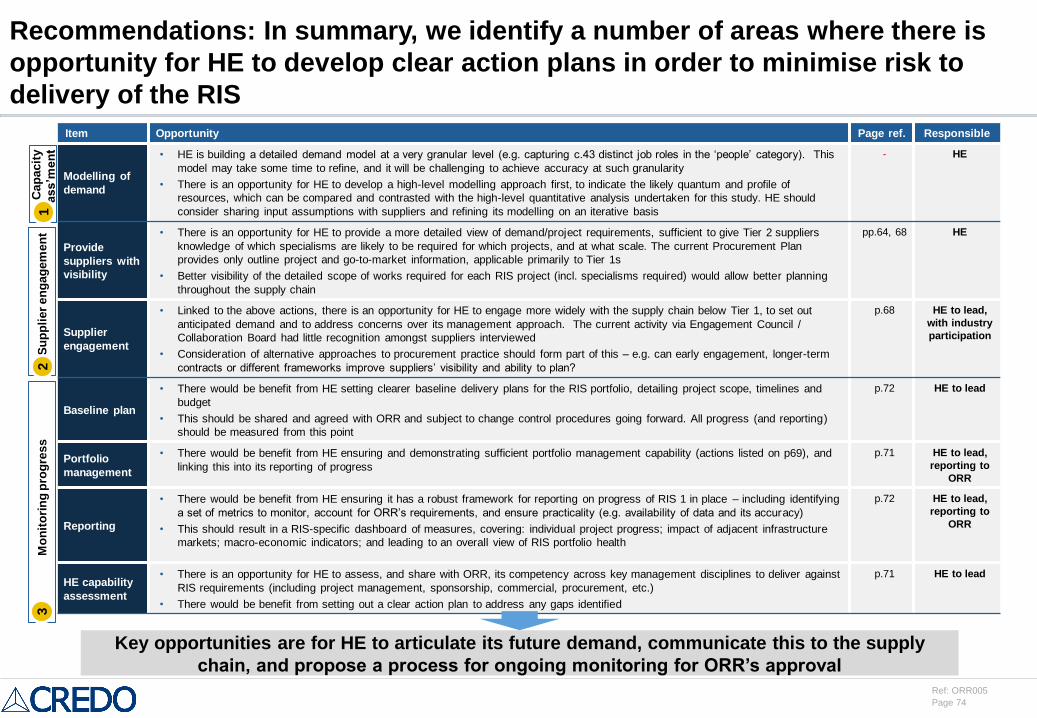
Page 74
Ref: ORR005
Recommendations: In summary, we identify a number of areas where there is
opportunity for HE to develop clear action plans in order to minimise risk to
delivery of the RIS
Cap
acit
y
ass’m
en
tM
on
ito
rin
g p
rog
ress
Su
pp
lier
en
gag
em
en
t2
13
Item Opportunity Page ref. Responsible
Modelling of
demand
• HE is building a detailed demand model at a very granular level (e.g. capturing c.43 distinct job roles in the ‘people’ category). This
model may take some time to refine, and it will be challenging to achieve accuracy at such granularity
• There is an opportunity for HE to develop a high-level modelling approach first, to indicate the likely quantum and profile of
resources, which can be compared and contrasted with the high-level quantitative analysis undertaken for this study. HE should
consider sharing input assumptions with suppliers and refining its modelling on an iterative basis
- HE
Provide
suppliers with
visibility
• There is an opportunity for HE to provide a more detailed view of demand/project requirements, sufficient to give Tier 2 suppliers
knowledge of which specialisms are likely to be required for which projects, and at what scale. The current Procurement Plan
provides only outline project and go-to-market information, applicable primarily to Tier 1s
• Better visibility of the detailed scope of works required for each RIS project (incl. specialisms required) would allow better planning
throughout the supply chain
pp.64, 68 HE
Supplier
engagement
• Linked to the above actions, there is an opportunity for HE to engage more widely with the supply chain below Tier 1, to set out
anticipated demand and to address concerns over its management approach. The current activity via Engagement Council /
Collaboration Board had little recognition amongst suppliers interviewed
• Consideration of alternative approaches to procurement practice should form part of this – e.g. can early engagement, longer-term
contracts or different frameworks improve suppliers’ visibility and ability to plan?
p.68 HE to lead,
with industry
participation
Baseline plan
• There would be benefit from HE setting clearer baseline delivery plans for the RIS portfolio, detailing project scope, timelines and
budget
• This should be shared and agreed with ORR and subject to change control procedures going forward. All progress (and reporting)
should be measured from this point
p.72 HE to lead
Portfolio
management
• There would be benefit from HE ensuring and demonstrating sufficient portfolio management capability (actions listed on p69), and
linking this into its reporting of progress
p.71 HE to lead,
reporting to
ORR
Reporting
• There would be benefit from HE ensuring it has a robust framework for reporting on progress of RIS 1 in place – including identifying
a set of metrics to monitor, account for ORR’s requirements, and ensure practicality (e.g. availability of data and its accuracy)
• This should result in a RIS-specific dashboard of measures, covering: individual project progress; impact of adjacent infrastructure
markets; macro-economic indicators; and leading to an overall view of RIS portfolio health
p.72 HE to lead,
reporting to
ORR
HE capability
assessment
• There is an opportunity for HE to assess, and share with ORR, its competency across key management disciplines to deliver against
RIS requirements (including project management, sponsorship, commercial, procurement, etc.)
• There would be benefit from setting out a clear action plan to address any gaps identified
p.71 HE to lead
Key opportunities are for HE to articulate its future demand, communicate this to the supply
chain, and propose a process for ongoing monitoring for ORR’s approval
Page 75
Ref: ORR005
Agenda
Executive summary
Market situation and background
Supply chain capacity assessment
HE approach to procurement and project management
Key Performance Indicators and recommendations for ORR
Appendix
– List of interviewees
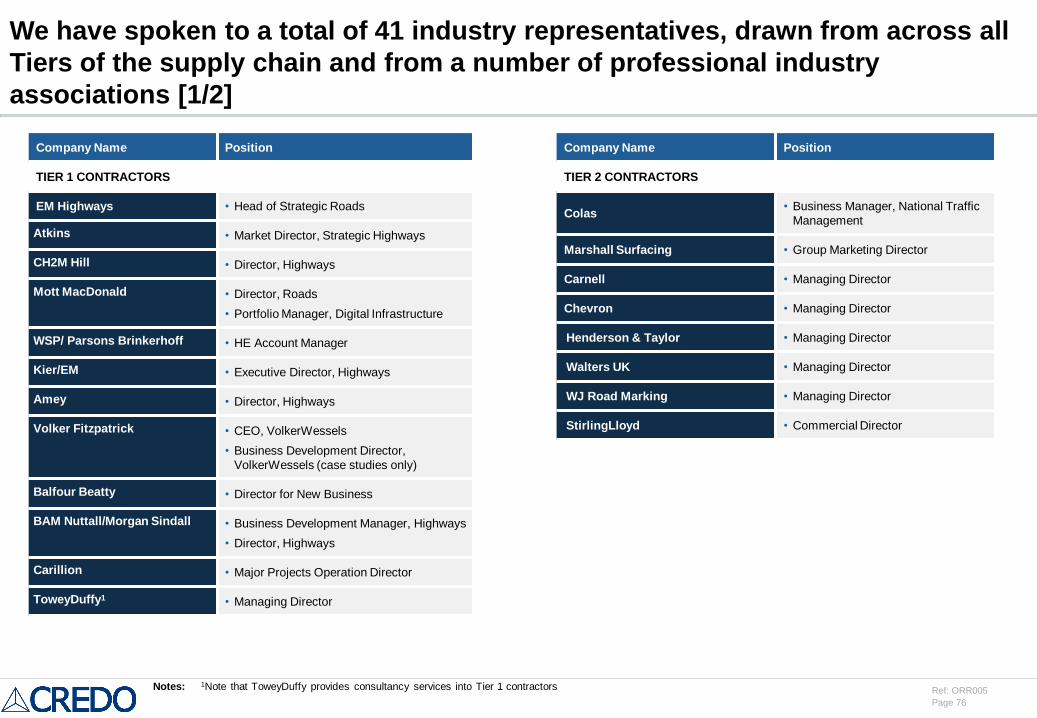
Page 76
Ref: ORR005
We have spoken to a total of 41 industry representatives, drawn from across all
Tiers of the supply chain and from a number of professional industry
associations [1/2]
Company Name Position
TIER 1 CONTRACTORS
EM Highways • Head of Strategic Roads
Atkins • Market Director, Strategic Highways
CH2M Hill • Director, Highways
Mott MacDonald • Director, Roads
• Portfolio Manager, Digital Infrastructure
WSP/ Parsons Brinkerhoff • HE Account Manager
Kier/EM • Executive Director, Highways
Amey • Director, Highways
Volker Fitzpatrick • CEO, VolkerWessels
• Business Development Director,
VolkerWessels (case studies only)
Balfour Beatty • Director for New Business
BAM Nuttall/Morgan Sindall • Business Development Manager, Highways
• Director, Highways
Carillion • Major Projects Operation Director
ToweyDuffy1 • Managing Director
Company Name Position
TIER 2 CONTRACTORS
Colas• Business Manager, National Traffic
Management
Marshall Surfacing • Group Marketing Director
Carnell • Managing Director
Chevron • Managing Director
Henderson & Taylor • Managing Director
Walters UK • Managing Director
WJ Road Marking • Managing Director
StirlingLloyd • Commercial Director
Notes: 1Note that ToweyDuffy provides consultancy services into Tier 1 contractors
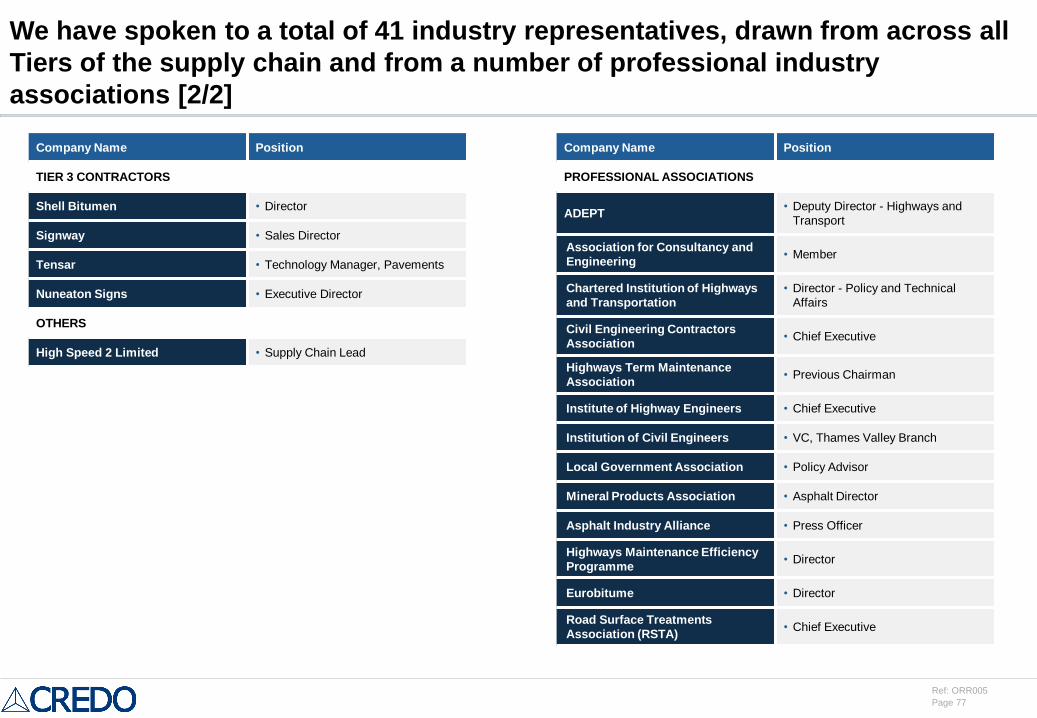
Page 77
Ref: ORR005
We have spoken to a total of 41 industry representatives, drawn from across all
Tiers of the supply chain and from a number of professional industry
associations [2/2]
Company Name Position
TIER 3 CONTRACTORS
Shell Bitumen • Director
Signway • Sales Director
Tensar • Technology Manager, Pavements
Nuneaton Signs • Executive Director
OTHERS
High Speed 2 Limited • Supply Chain Lead
Company Name Position
PROFESSIONAL ASSOCIATIONS
ADEPT• Deputy Director - Highways and
Transport
Association for Consultancy and
Engineering• Member
Chartered Institution of Highways
and Transportation
• Director - Policy and Technical
Affairs
Civil Engineering Contractors
Association• Chief Executive
Highways Term Maintenance
Association• Previous Chairman
Institute of Highway Engineers • Chief Executive
Institution of Civil Engineers • VC, Thames Valley Branch
Local Government Association • Policy Advisor
Mineral Products Association • Asphalt Director
Asphalt Industry Alliance • Press Officer
Highways Maintenance Efficiency
Programme• Director
Eurobitume • Director
Road Surface Treatments
Association (RSTA)• Chief Executive
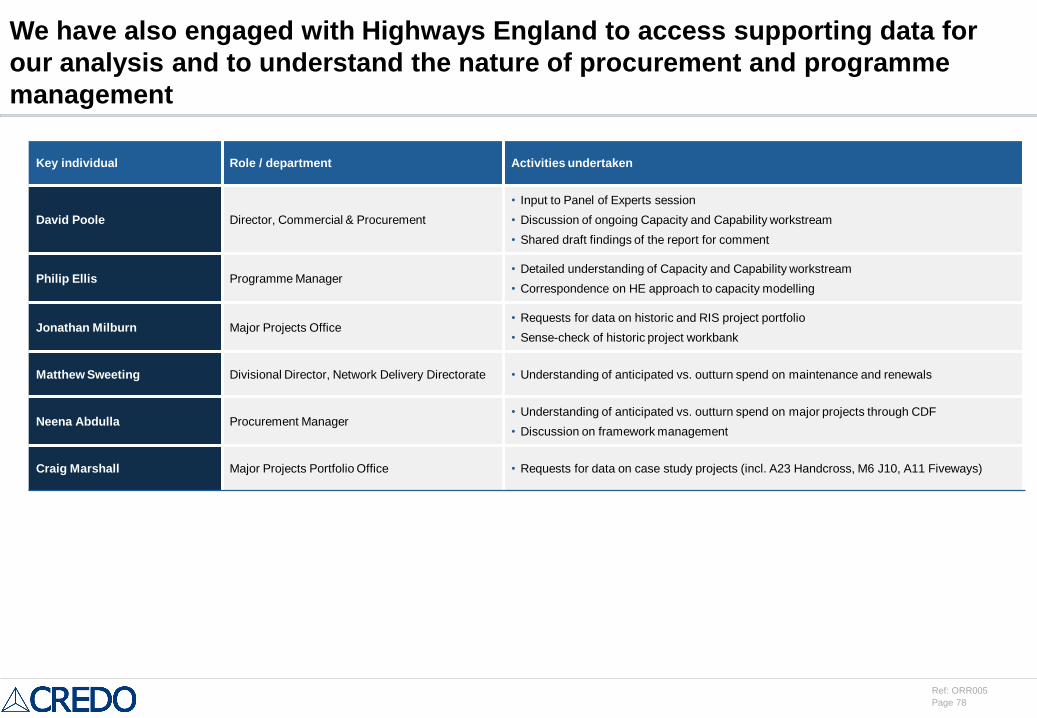
Page 78
Ref: ORR005
We have also engaged with Highways England to access supporting data for
our analysis and to understand the nature of procurement and programme
management
Key individual Role / department Activities undertaken
David Poole Director, Commercial & Procurement
• Input to Panel of Experts session
• Discussion of ongoing Capacity and Capability workstream
• Shared draft findings of the report for comment
Philip Ellis Programme Manager• Detailed understanding of Capacity and Capability workstream
• Correspondence on HE approach to capacity modelling
Jonathan Milburn Major Projects Office• Requests for data on historic and RIS project portfolio
• Sense-check of historic project workbank
Matthew Sweeting Divisional Director, Network Delivery Directorate • Understanding of anticipated vs. outturn spend on maintenance and renewals
Neena Abdulla Procurement Manager• Understanding of anticipated vs. outturn spend on major projects through CDF
• Discussion on framework management
Craig Marshall Major Projects Portfolio Office • Requests for data on case study projects (incl. A23 Handcross, M6 J10, A11 Fiveways)
Page 79
Ref: ORR005
Questions or comments on this report to:
Mahier Al-Ani
Senior Highways Engineer – Highways Monitor
Office of Rail and Road
One Kemble Street
LONDON
WC2B 4AN
Telephone: (020) 7282 3912
Report authors:
Matt Lovering Nick Daley Chris Hinde
Partner Principal Senior Consultant
[email protected] [email protected] [email protected]
Credo Business Consulting LLP
12 Arthur Street
LONDON
EC4R 9AB
Telephone: (020) 3206 8800
Recommended