Higher Atmosphere
Earth’s Heat Budget
Global Insolation
Global Transfer Of Energy
Global Temperatures
Inter Tropical Convergence Zone Climate Graph
Earth’s Heat Budget Task 1
Use the Power Point to help you complete the diagram of the Earth’s Heat Budget.
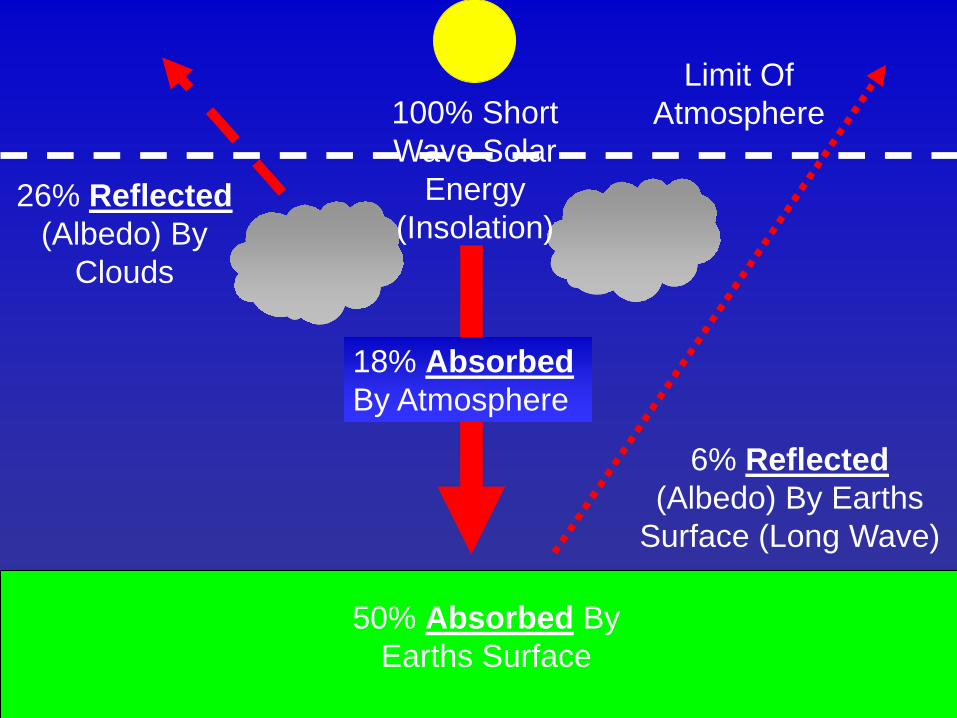
100% Short Wave Solar
Energy (Insolation)
Limit Of Atmosphere
18% Absorbed By Atmosphere
50% Absorbed By Earths Surface
26% Reflected (Albedo) By
Clouds
6% Reflected (Albedo) By Earths
Surface (Long Wave)
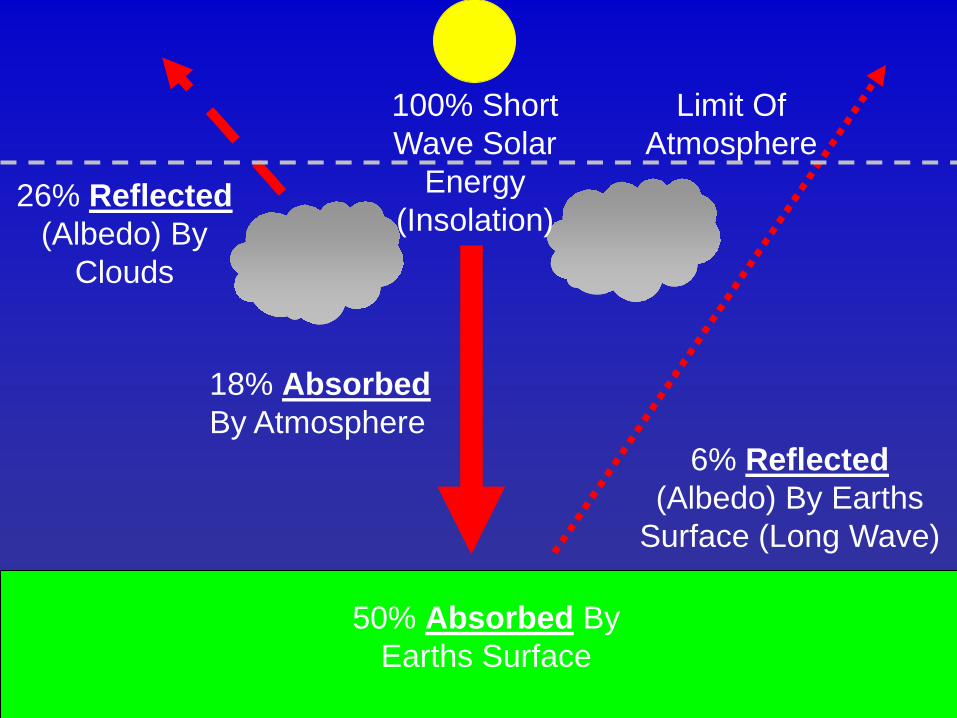
100% Short Wave Solar
Energy (Insolation)
Limit Of Atmosphere
18% Absorbed By Atmosphere
50% Absorbed By Earths Surface
26% Reflected (Albedo) By
Clouds
6% Reflected (Albedo) By Earths
Surface (Long Wave)
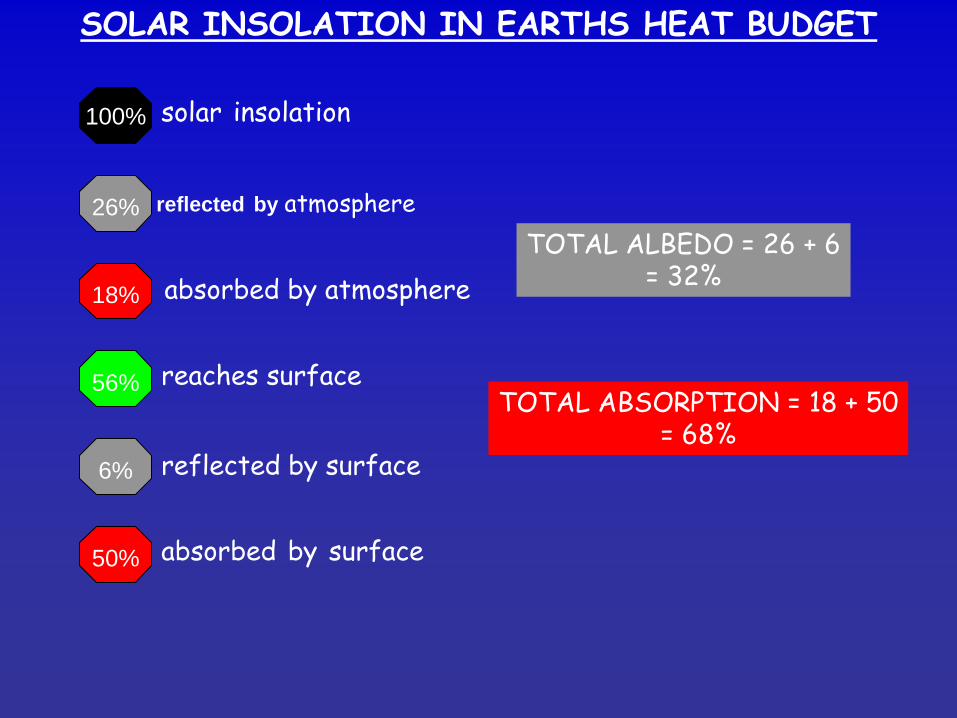
reflected by atmosphere 26%
reflected by surface 6%
absorbed by surface 50%
18% absorbed by atmosphere
100% solar insolation
56% reaches surface
TOTAL ALBEDO = 26 + 6 = 32%
TOTAL ABSORPTION = 18 + 50 = 68%
SOLAR INSOLATION IN EARTHS HEAT BUDGET
Earth’s Heat Budget
Task 2 In groups of four try and match the definitions on the strips of paper to the key words in your workbook. Report back to the class to check your answers before writing them in your workbook.
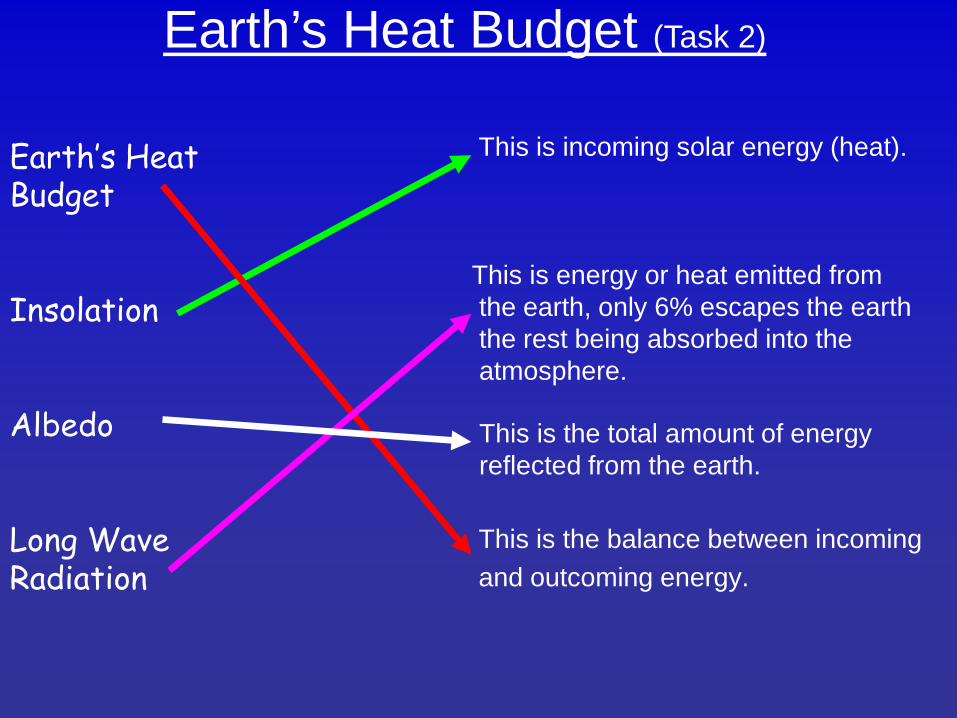
This is the balance between incoming and outcoming energy.
Earth’s Heat Budget (Task 2)
Earth’s Heat Budget
Insolation
Albedo
Long Wave Radiation
This is incoming solar energy (heat).
This is the total amount of energy reflected from the earth.
This is energy or heat emitted from the earth, only 6% escapes the earth the rest being absorbed into the atmosphere.
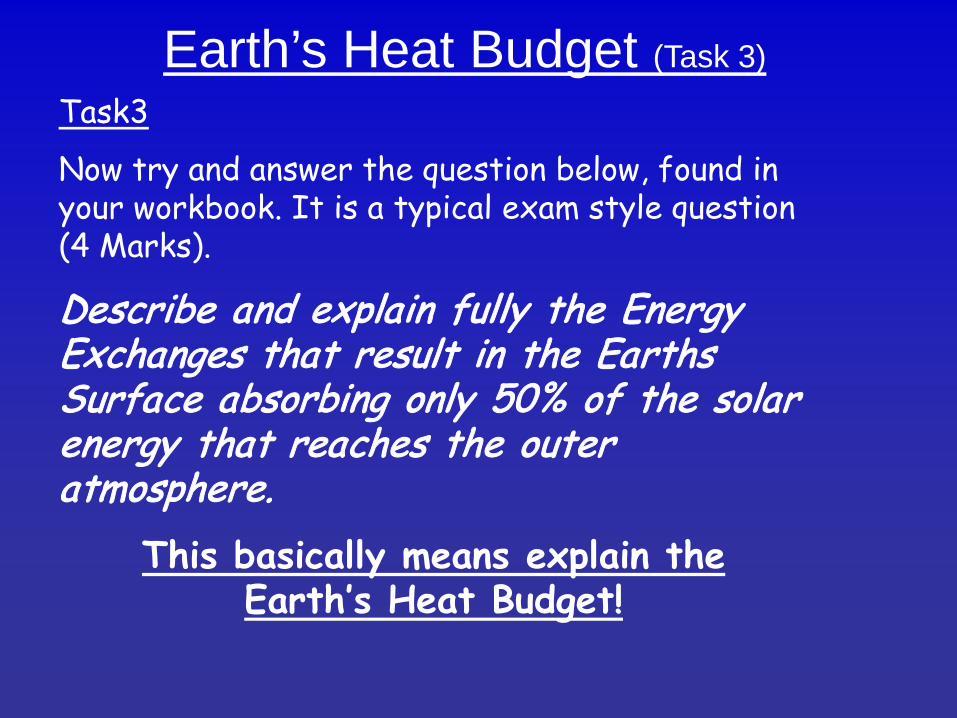
Earth’s Heat Budget (Task 3)
Task3
Now try and answer the question below, found in your workbook. It is a typical exam style question (4 Marks).
Describe and explain fully the Energy Exchanges that result in the Earths Surface absorbing only 50% of the solar energy that reaches the outer atmosphere.
This basically means explain the Earth’s Heat Budget!

The Earth’s Heat Budget To help you, use the following structure.
Say where the earths energy come from and name it.
Briefly explain what the earth’s heat budget is.
Describe what happens to the insolation giving values;
•Atmospheric absorption (clouds)
•Atmospheric reflection (albedo + clouds)
•Surface absorption (land)
•Surface reflection (albedo + ice/water)
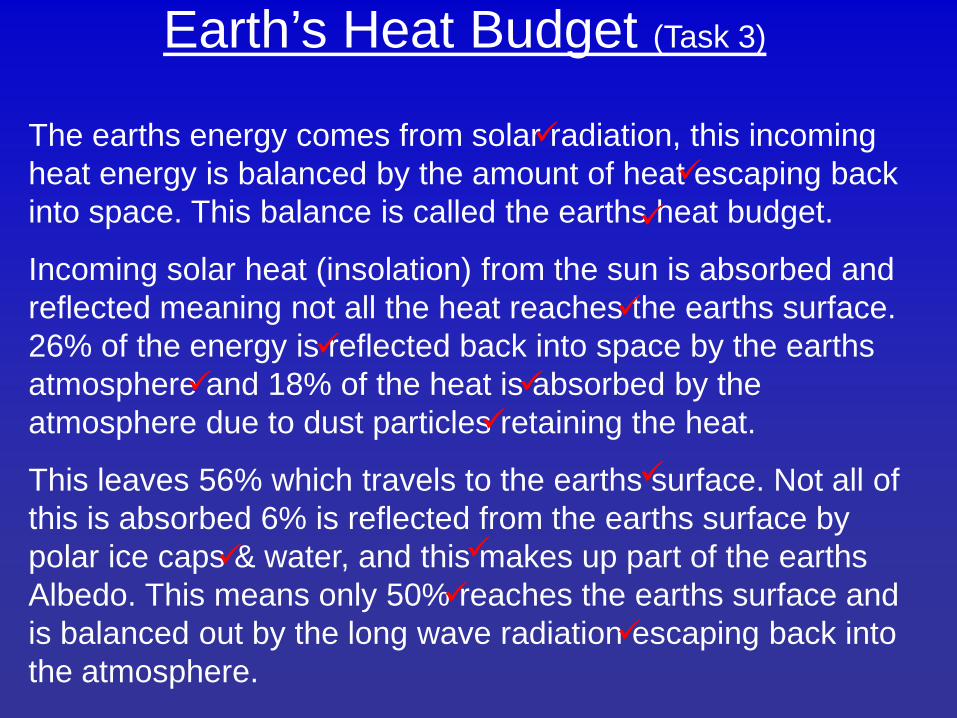
Earth’s Heat Budget (Task 3)
The earths energy comes from solar radiation, this incoming heat energy is balanced by the amount of heat escaping back into space. This balance is called the earths heat budget.
Incoming solar heat (insolation) from the sun is absorbed and reflected meaning not all the heat reaches the earths surface. 26% of the energy is reflected back into space by the earths atmosphere and 18% of the heat is absorbed by the atmosphere due to dust particles retaining the heat.
This leaves 56% which travels to the earths surface. Not all of this is absorbed 6% is reflected from the earths surface by polar ice caps & water, and this makes up part of the earths Albedo. This means only 50% reaches the earths surface and is balanced out by the long wave radiation escaping back into the atmosphere.
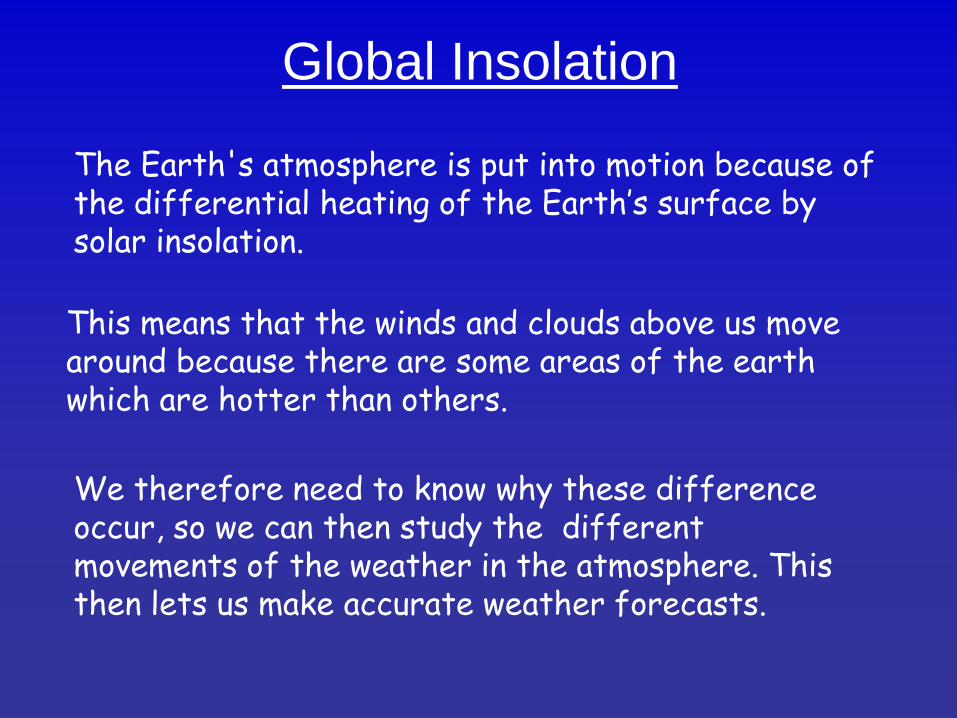
Global Insolation
The Earth's atmosphere is put into motion because of the differential heating of the Earth’s surface by solar insolation.
This means that the winds and clouds above us move around because there are some areas of the earth which are hotter than others.
We therefore need to know why these difference occur, so we can then study the different movements of the weather in the atmosphere. This then lets us make accurate weather forecasts.
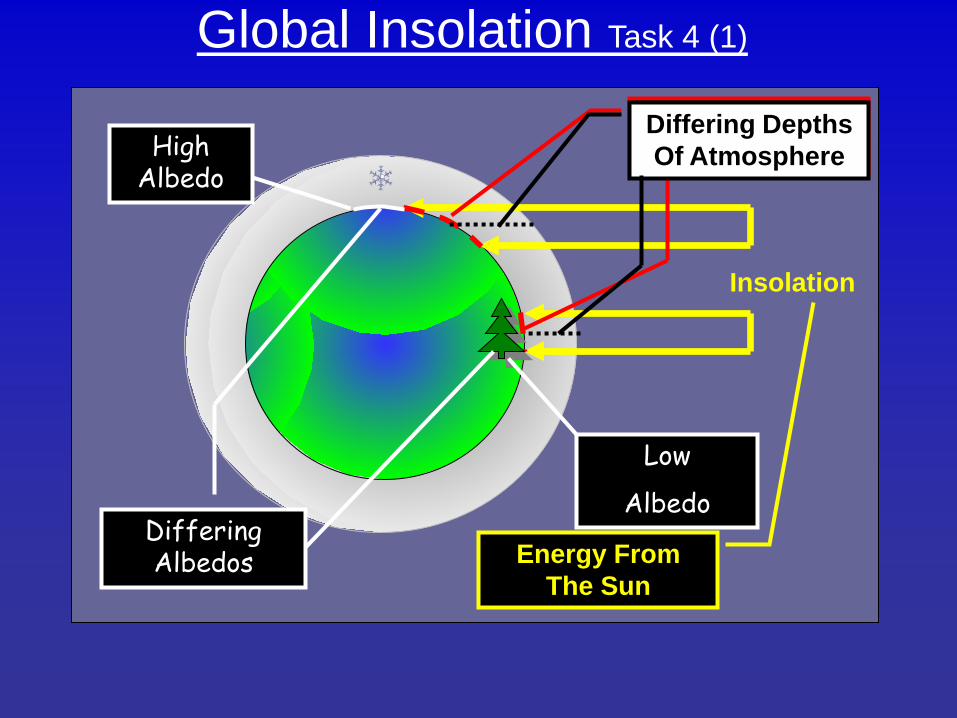
Global Insolation Task 4 (1)
Insolation
Energy From The Sun
Different Curvature
Differing Depths Of Atmosphere
Differing Albedos
High Albedo
Low
Albedo
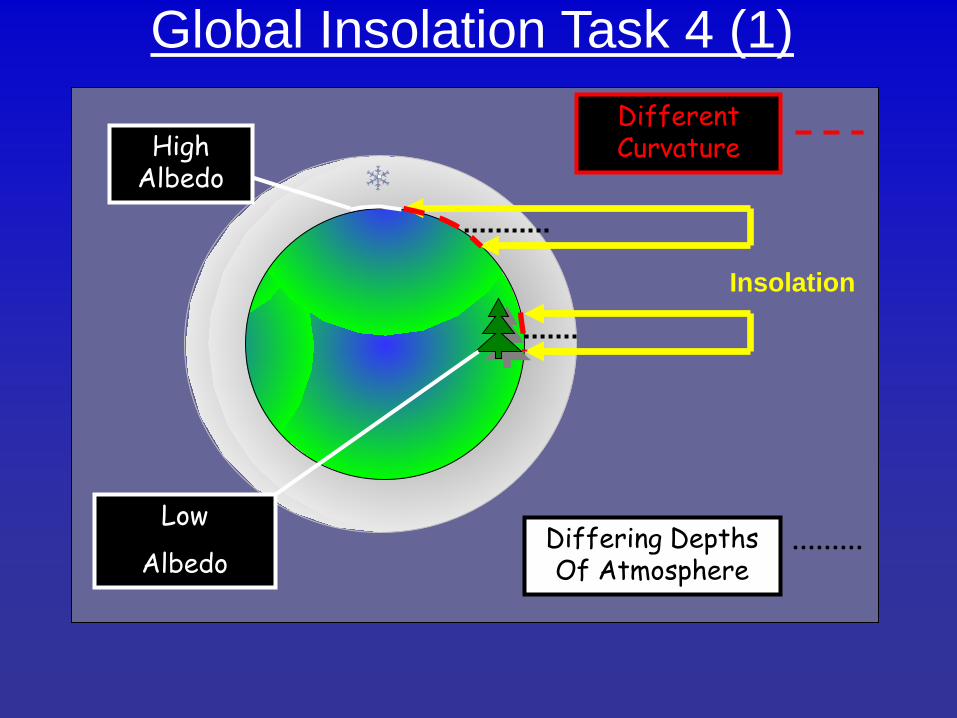
Global Insolation Task 4 (1)
Insolation
High Albedo
Low
Albedo Differing Depths Of Atmosphere
Different Curvature

Variations In Global Insolation Describe
Range of latitude
35° to 0° N or S of Equ.
State if in deficit or surplus
Give values in Joules 170 to 270
With the aid of an annotated diagram describe
and explain the energy balance shown on the
diagram below.
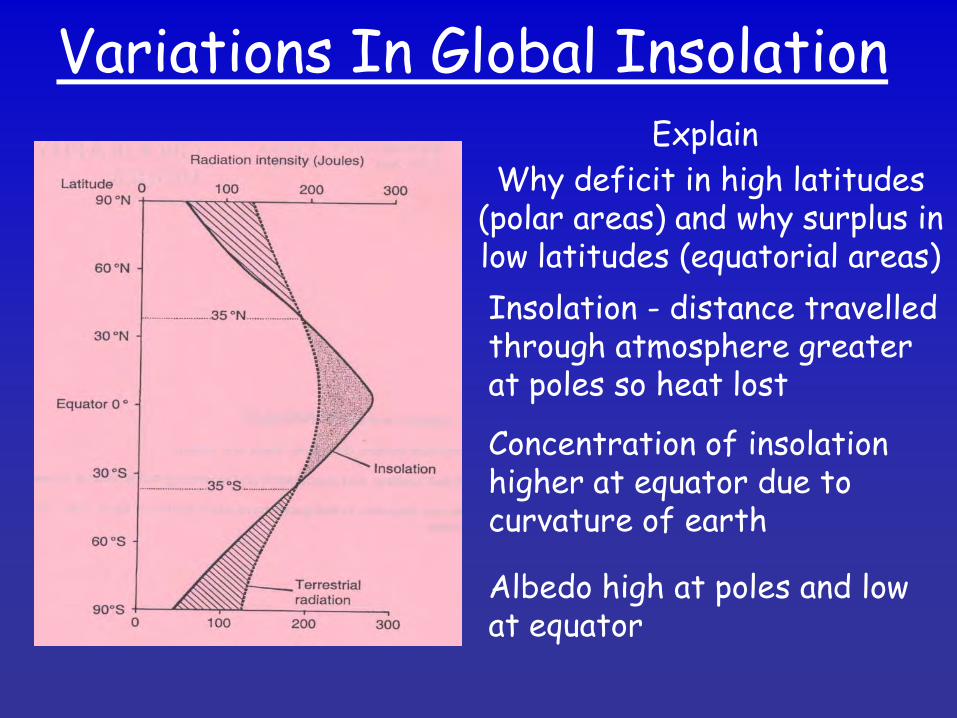
Variations In Global Insolation Explain
Why deficit in high latitudes (polar areas) and why surplus in low latitudes (equatorial areas) Insolation - distance travelled through atmosphere greater at poles so heat lost
Concentration of insolation higher at equator due to curvature of earth
Albedo high at poles and low at equator
Global Transfer Of Energy This is the movement of energy from the equator to the poles. Global Insolation differences should mean that the lower latitudes (equator) get hotter and hotter, whilst the higher latitudes (poles) get colder and colder.
Atmospheric Circulation & Ocean Currents
In reality this doesn’t quite happen as energy is transferred from surplus areas (equator) to deficit areas (poles) by two methods.
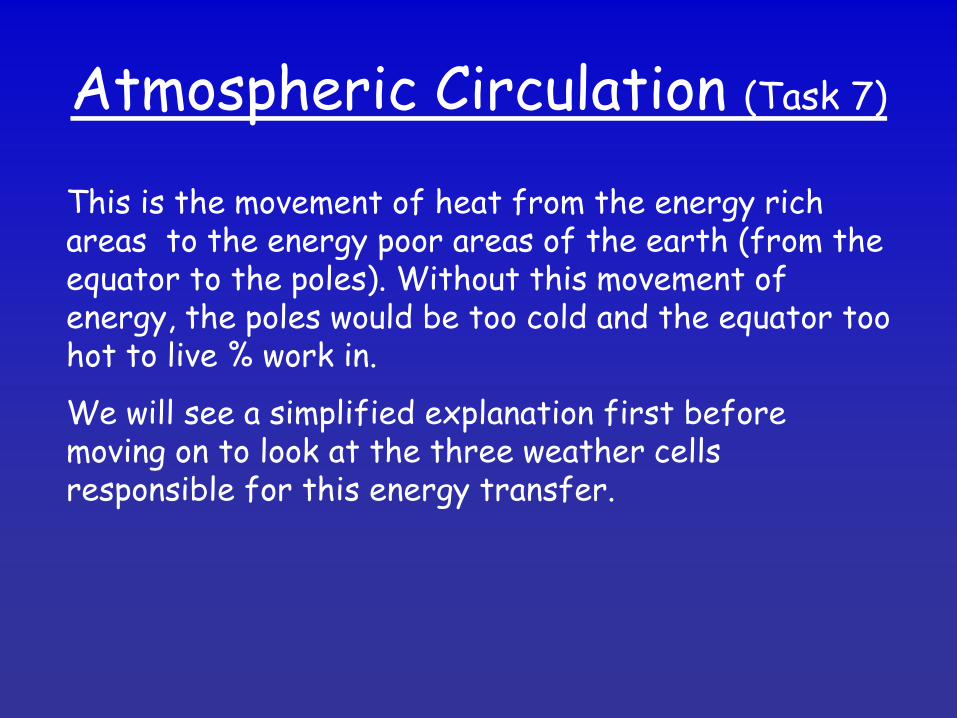
Atmospheric Circulation (Task 7)
This is the movement of heat from the energy rich areas to the energy poor areas of the earth (from the equator to the poles). Without this movement of energy, the poles would be too cold and the equator too hot to live % work in.
We will see a simplified explanation first before moving on to look at the three weather cells responsible for this energy transfer.
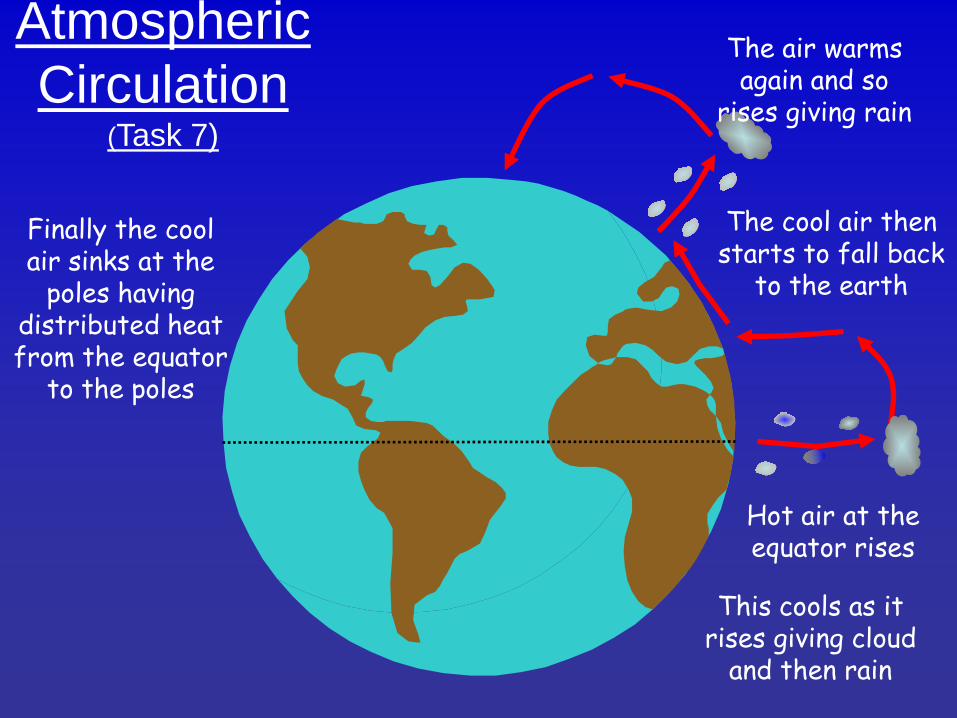
Atmospheric Circulation
(Task 7)
Hot air at the equator rises
This cools as it rises giving cloud
and then rain
The cool air then starts to fall back
to the earth
The air warms again and so
rises giving rain
Finally the cool air sinks at the
poles having distributed heat from the equator
to the poles
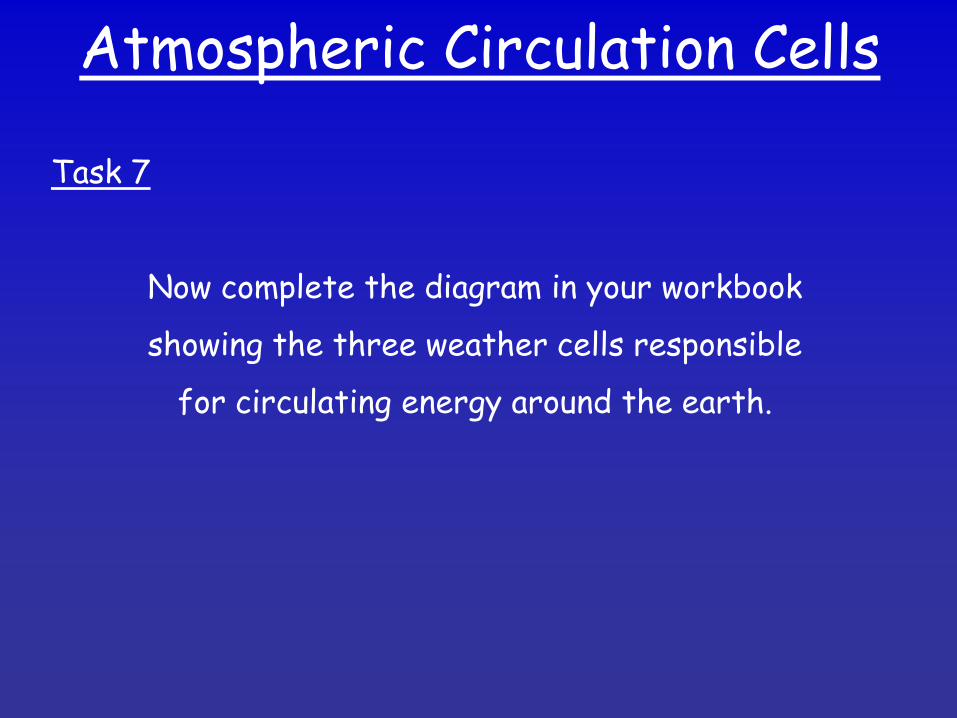
Atmospheric Circulation Cells
Task 7
Now complete the diagram in your workbook
showing the three weather cells responsible
for circulating energy around the earth.
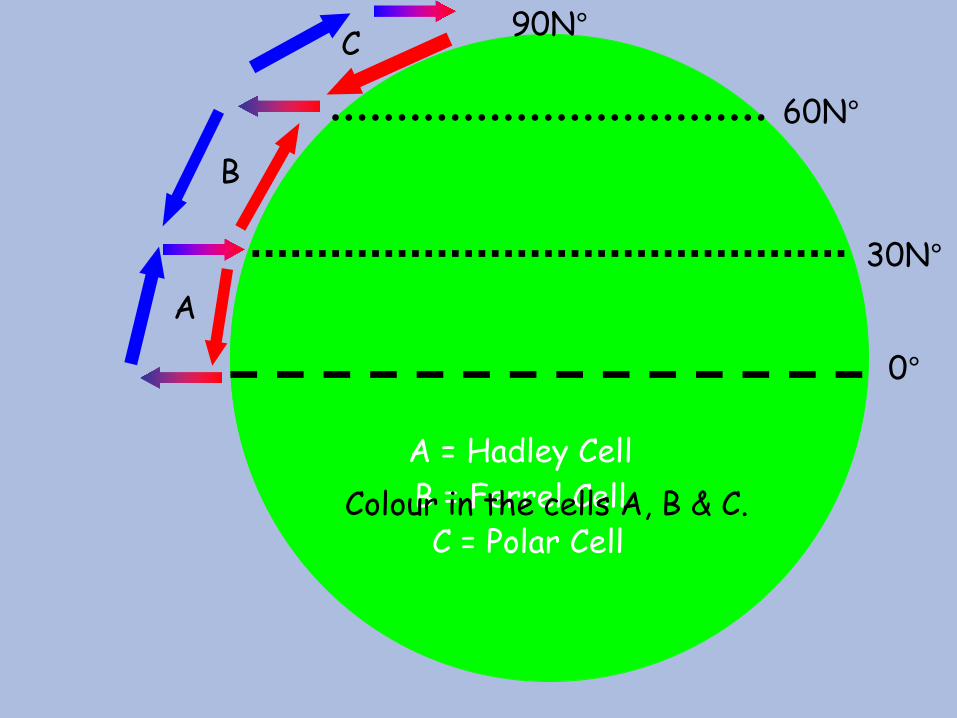
0°
30N°
60N°
90N°
A
B
C
A = Hadley Cell B = Ferrel Cell C = Polar Cell
Colour in the cells A, B & C.
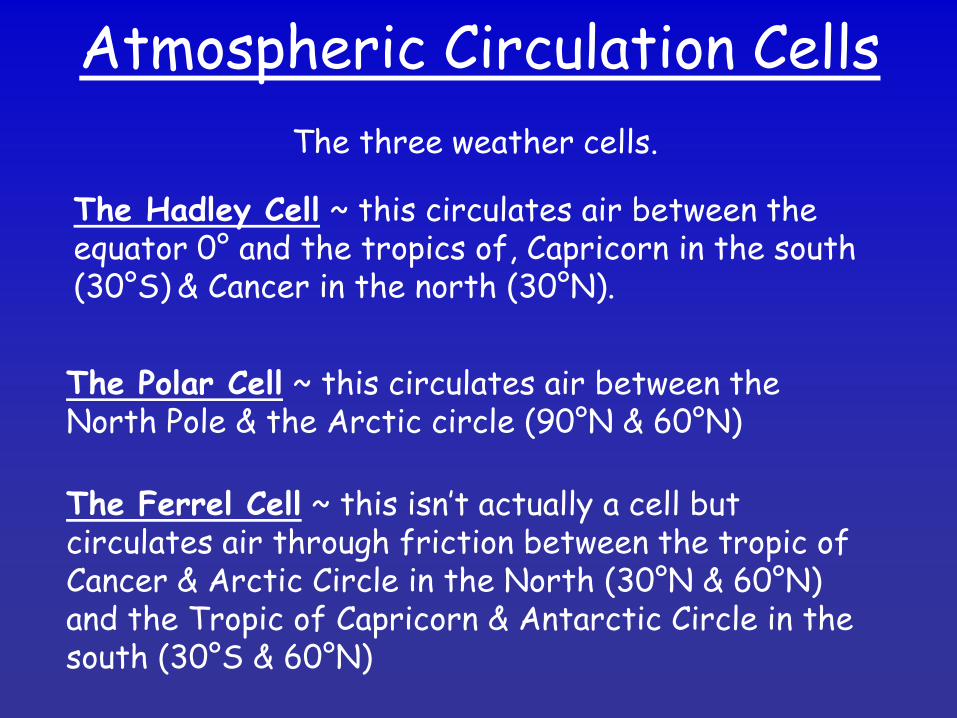
Atmospheric Circulation Cells The three weather cells.
The Hadley Cell ~ this circulates air between the equator 0° and the tropics of, Capricorn in the south (30°S) & Cancer in the north (30°N).
The Ferrel Cell ~ this isn’t actually a cell but circulates air through friction between the tropic of Cancer & Arctic Circle in the North (30°N & 60°N) and the Tropic of Capricorn & Antarctic Circle in the south (30°S & 60°N)
The Polar Cell ~ this circulates air between the North Pole & the Arctic circle (90°N & 60°N)
Task 8 & 9
Now watch the following slides explaining how the 3 Cells work and then complete Task 8.
Next complete the more complicated Task 9 in pairs.
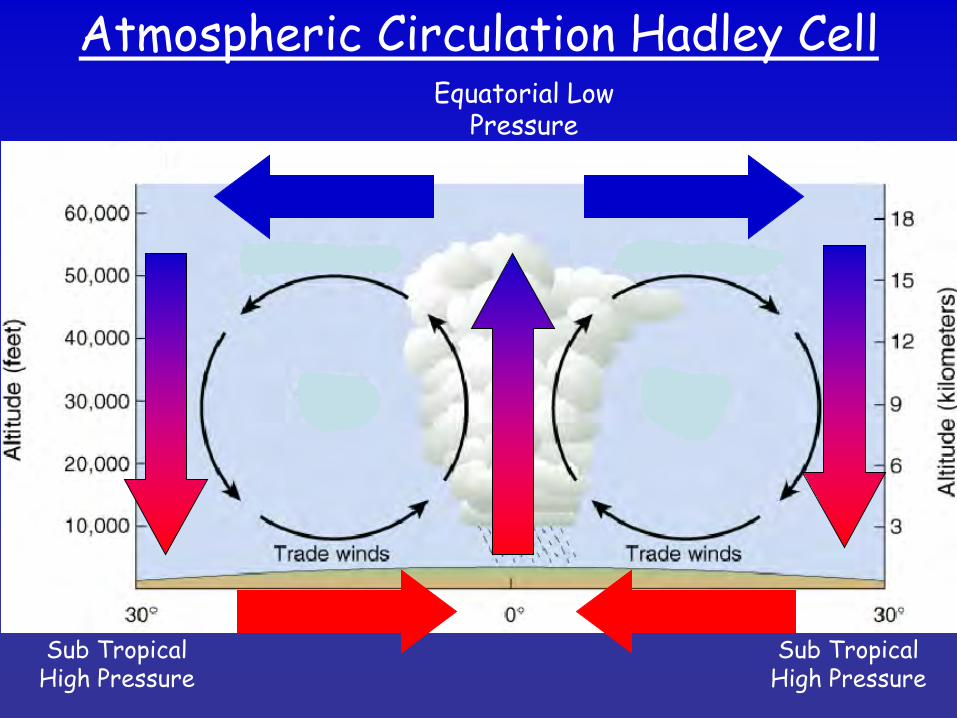
Atmospheric Circulation Hadley Cell Equatorial Low
Pressure
Sub Tropical High Pressure
Sub Tropical High Pressure
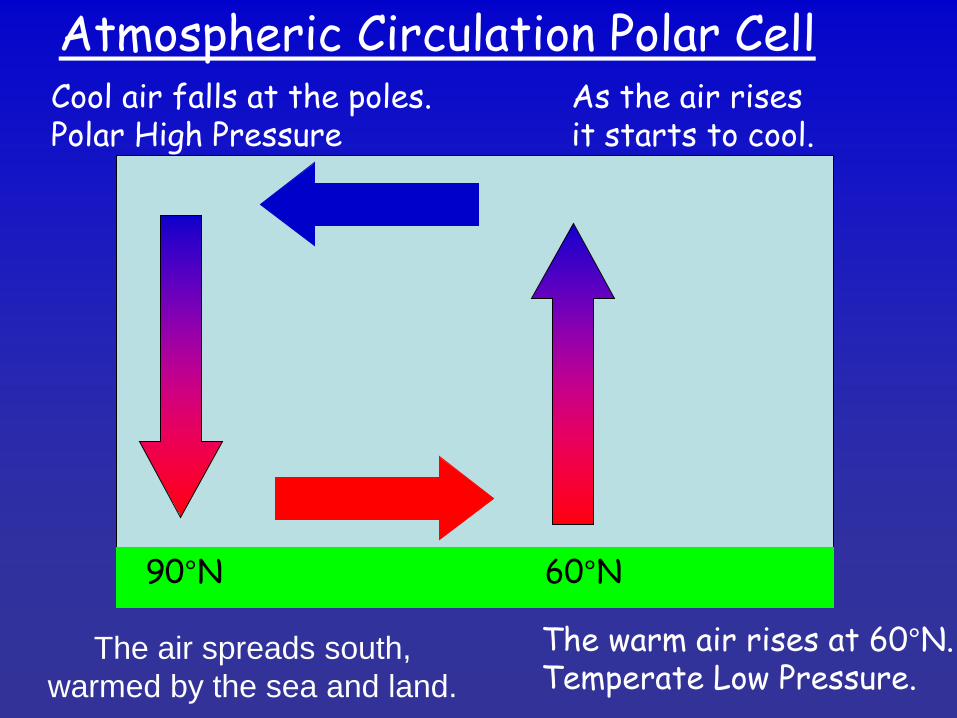
Atmospheric Circulation Polar Cell
90°N 60°N
Cool air falls at the poles. Polar High Pressure
The air spreads south, warmed by the sea and land.
The warm air rises at 60°N. Temperate Low Pressure.
As the air rises it starts to cool.
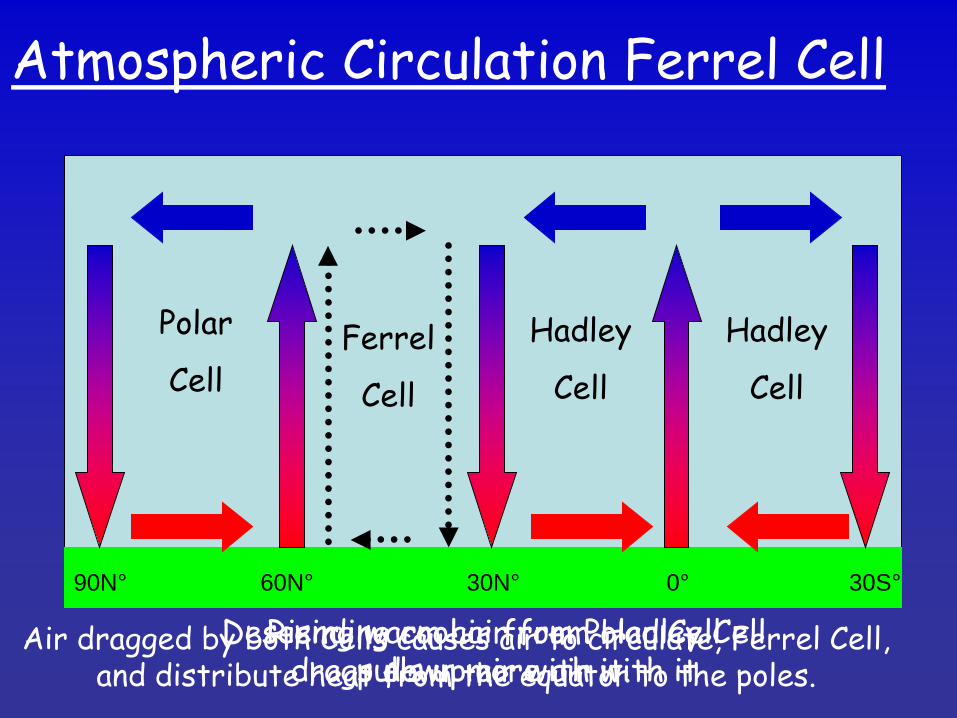
Atmospheric Circulation Ferrel Cell
90N° 60N° 30N° 0° 30S°
Descending cool air from Hadley Cell drags down more air with it
Rising warm air from Polar Cell pulls up air with it.
Air dragged by both Cells causes air to circulate, Ferrel Cell, and distribute heat from the equator to the poles.
Polar
Cell Hadley
Cell
Hadley
Cell Ferrel
Cell
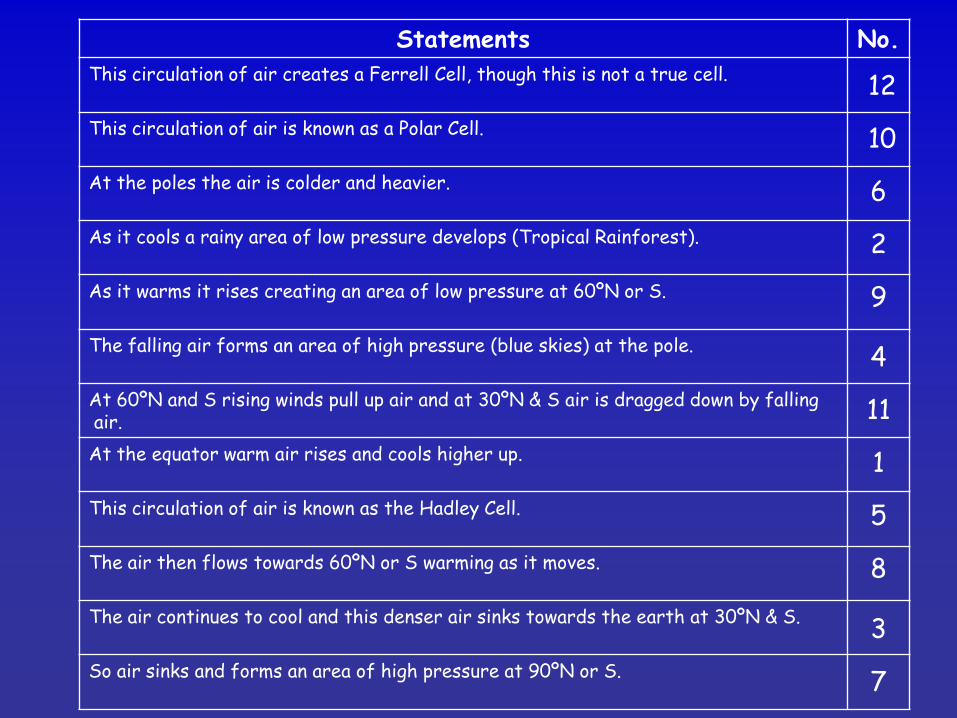
Statements No. This circulation of air creates a Ferrell Cell, though this is not a true cell.
This circulation of air is known as a Polar Cell.
At the poles the air is colder and heavier.
As it cools a rainy area of low pressure develops (Tropical Rainforest).
As it warms it rises creating an area of low pressure at 60ºN or S.
The falling air forms an area of high pressure (blue skies) at the pole.
At 60ºN and S rising winds pull up air and at 30ºN & S air is dragged down by falling air. At the equator warm air rises and cools higher up.
This circulation of air is known as the Hadley Cell.
The air then flows towards 60ºN or S warming as it moves.
The air continues to cool and this denser air sinks towards the earth at 30ºN & S.
So air sinks and forms an area of high pressure at 90ºN or S.
1
2
3
4
5
6
7
8
9
10
11
12
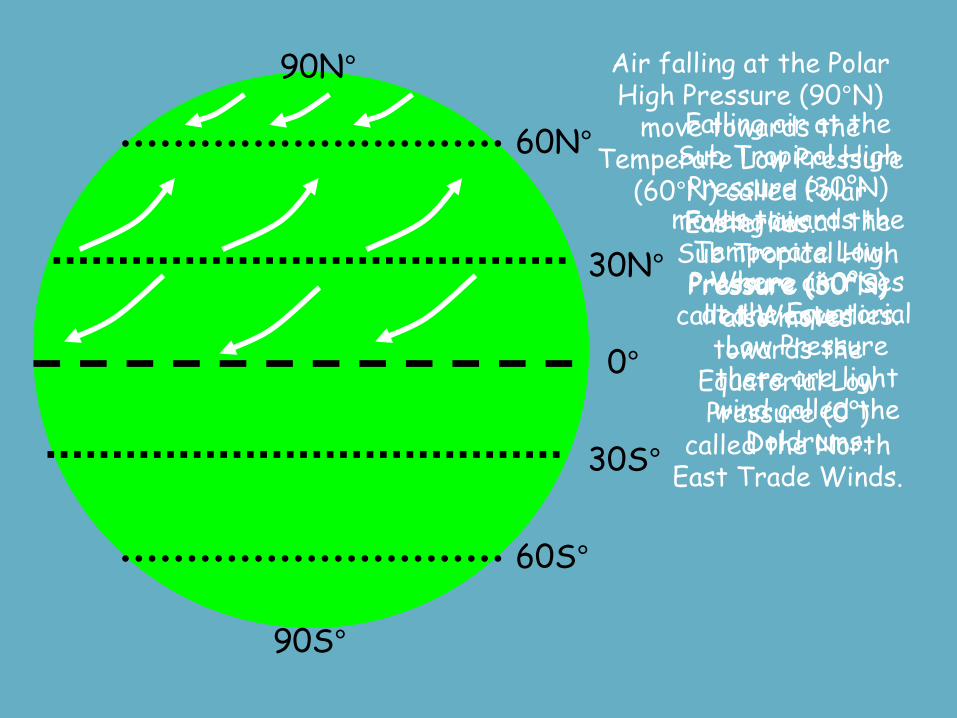
Atmospheric Circulation Winds
The next slide shows how winds move across the surface of the earth.
A Key Principle is that these winds move from areas of high pressure to low pressure.
Complete the diagram showing surface winds in your workbook.
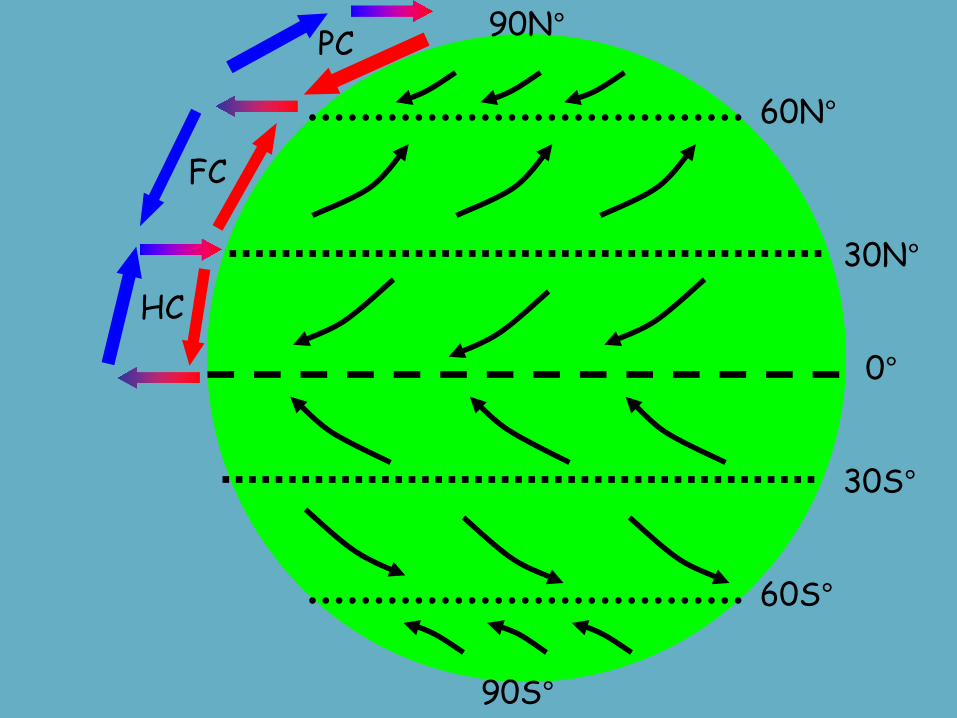
0°
30N°
60N°
90N°
HC
FC
PC
60S°
30S°
90S°
0°
30N°
60N°
90N°
60S°
30S°
90S°
Falling air at the Sub Tropical High Pressure (30°N)
also moves towards the
Equatorial Low Pressure (0°)
called the North East Trade Winds.
Falling air at the Sub Tropical High Pressure (30°N)
moves towards the Temperate Low Pressure (60°S)
called Westerlies.
Air falling at the Polar High Pressure (90°N)
move towards the Temperate Low Pressure
(60°N) called Polar Easterlies.
Where air rises at the Equatorial
Low Pressure there are light wind called the
Doldrums.
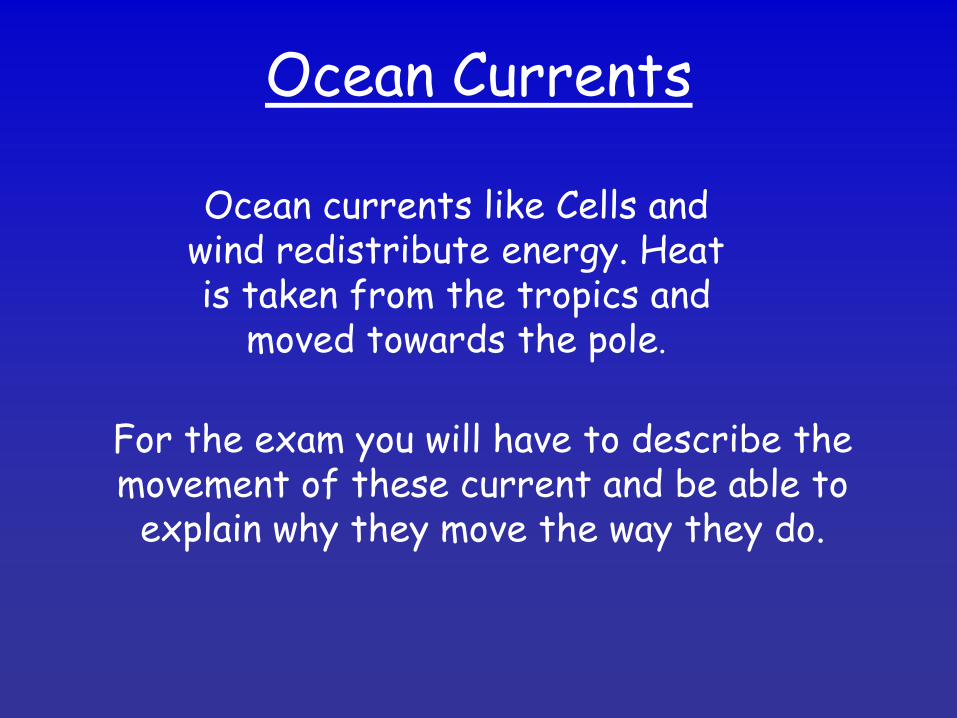
Ocean Currents
Ocean currents like Cells and wind redistribute energy. Heat is taken from the tropics and
moved towards the pole.
For the exam you will have to describe the movement of these current and be able to
explain why they move the way they do.
Ocean Currents
Now complete the diagram for Task 12 in your workbook using
the Power Point.
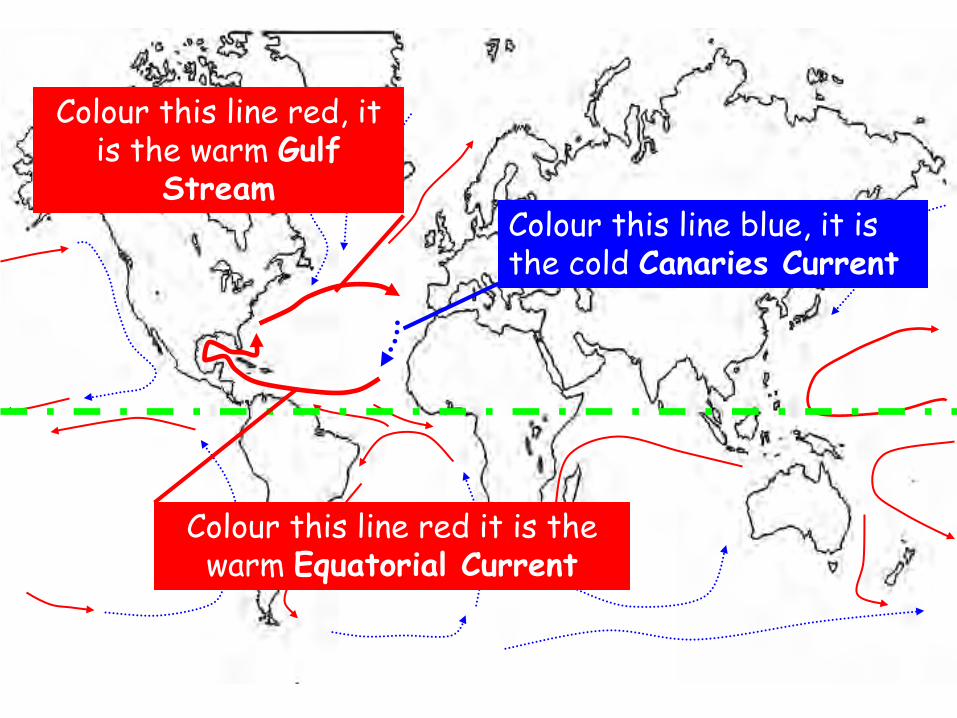
Colour this line blue, it is the cold Canaries Current
Colour this line red it is the warm Equatorial Current
Colour this line red, it is the warm Gulf
Stream
Ocean Currents Description Task 13
Answer questions 1 to 7 with the aid of the Power Point & your teacher.
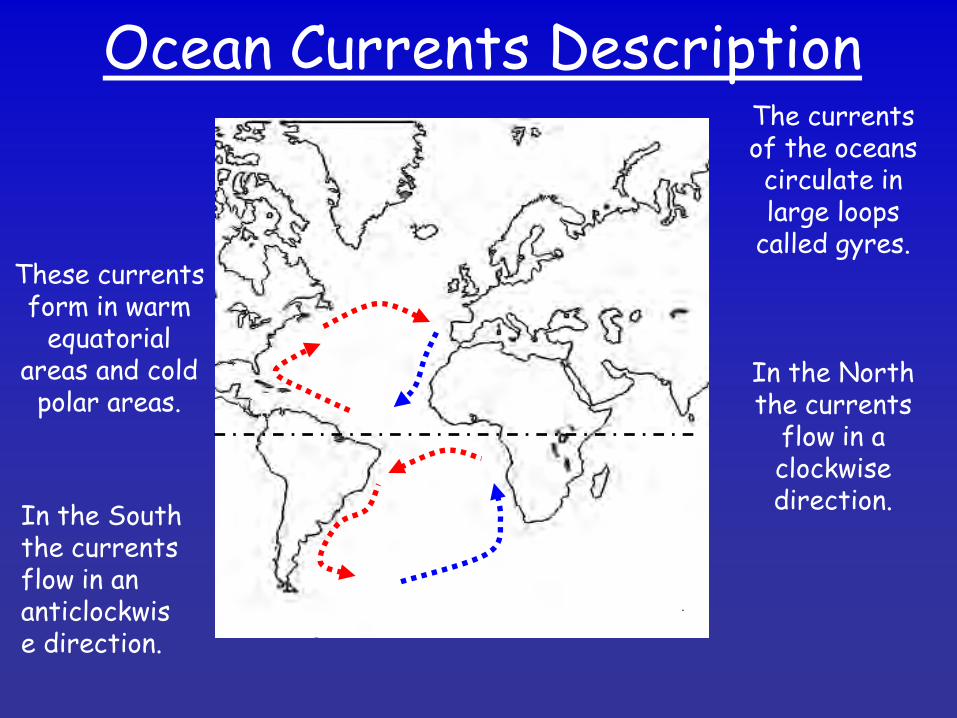
Ocean Currents Description The currents of the oceans circulate in large loops
called gyres. These currents form in warm
equatorial areas and cold
polar areas. In the North the currents
flow in a clockwise direction. In the South
the currents flow in an anticlockwise direction.
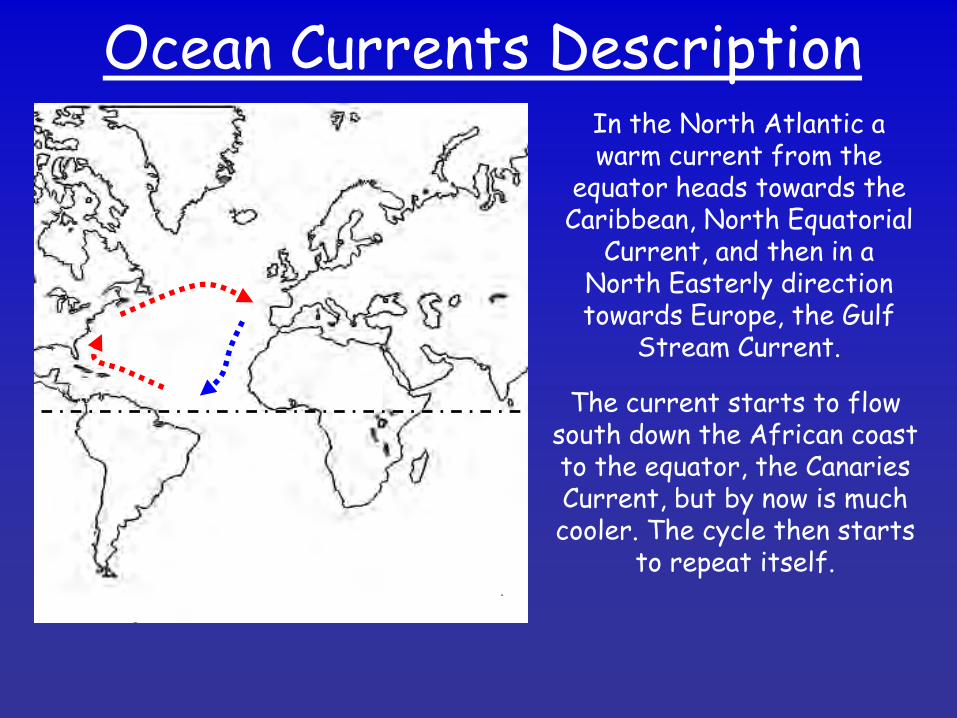
Ocean Currents Description In the North Atlantic a warm current from the
equator heads towards the Caribbean, North Equatorial
Current, and then in a North Easterly direction towards Europe, the Gulf
Stream Current.
The current starts to flow south down the African coast to the equator, the Canaries Current, but by now is much cooler. The cycle then starts
to repeat itself.
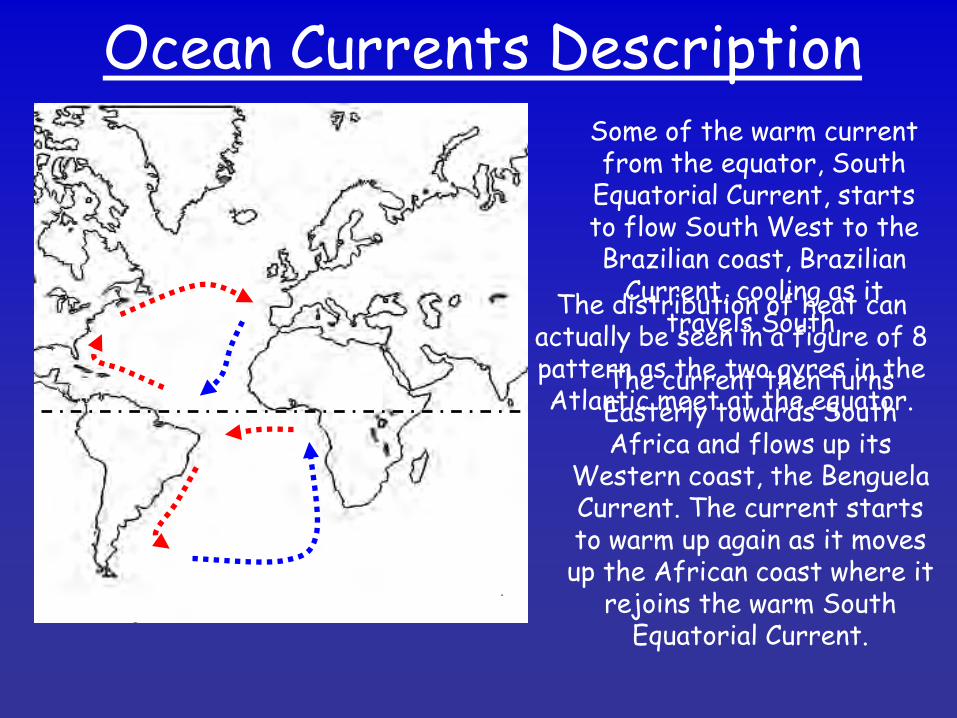
Ocean Currents Description Some of the warm current from the equator, South
Equatorial Current, starts to flow South West to the Brazilian coast, Brazilian
Current, cooling as it travels South.
The current then turns Easterly towards South Africa and flows up its
Western coast, the Benguela Current. The current starts to warm up again as it moves up the African coast where it
rejoins the warm South Equatorial Current.
The distribution of heat can actually be seen in a figure of 8 pattern as the two gyres in the Atlantic meet at the equator.
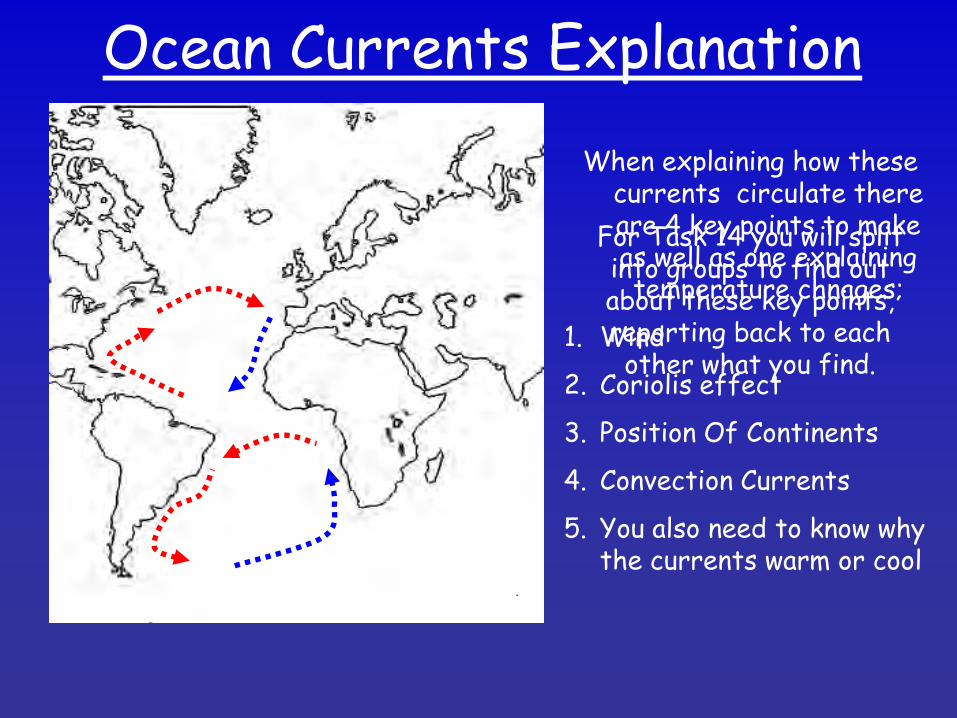
Ocean Currents Explanation When explaining how these
currents circulate there are 4 key points to make as well as one explaining temperature chnages;
1. Wind
2. Coriolis effect
3. Position Of Continents
4. Convection Currents
5. You also need to know why the currents warm or cool
For Task 14 you will split into groups to find out about these key points, reporting back to each other what you find.
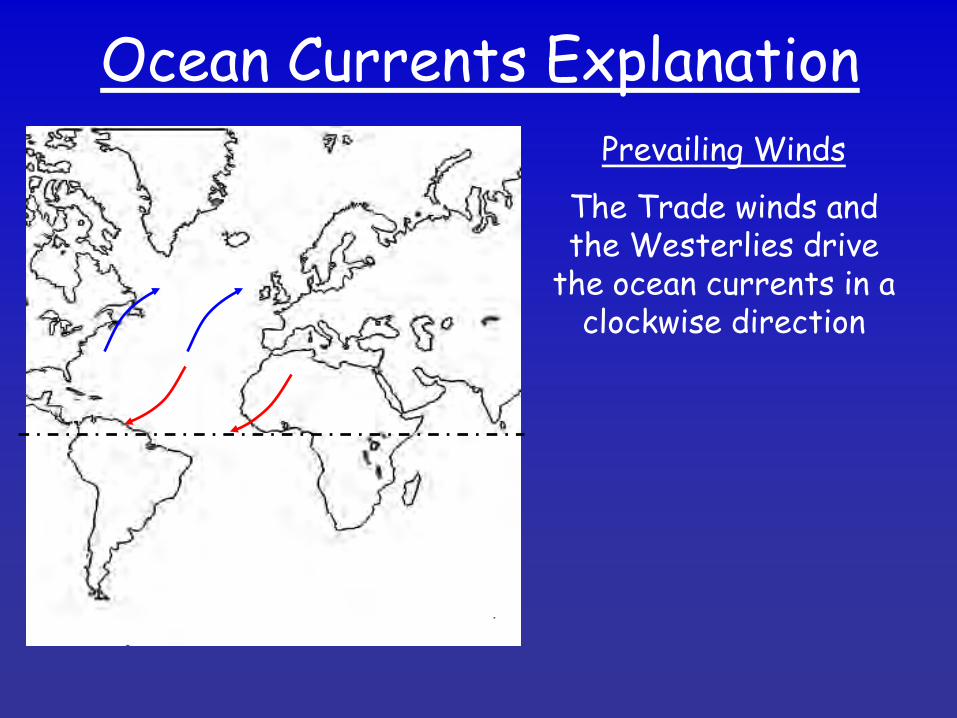
Ocean Currents Explanation Prevailing Winds
The Trade winds and the Westerlies drive
the ocean currents in a clockwise direction
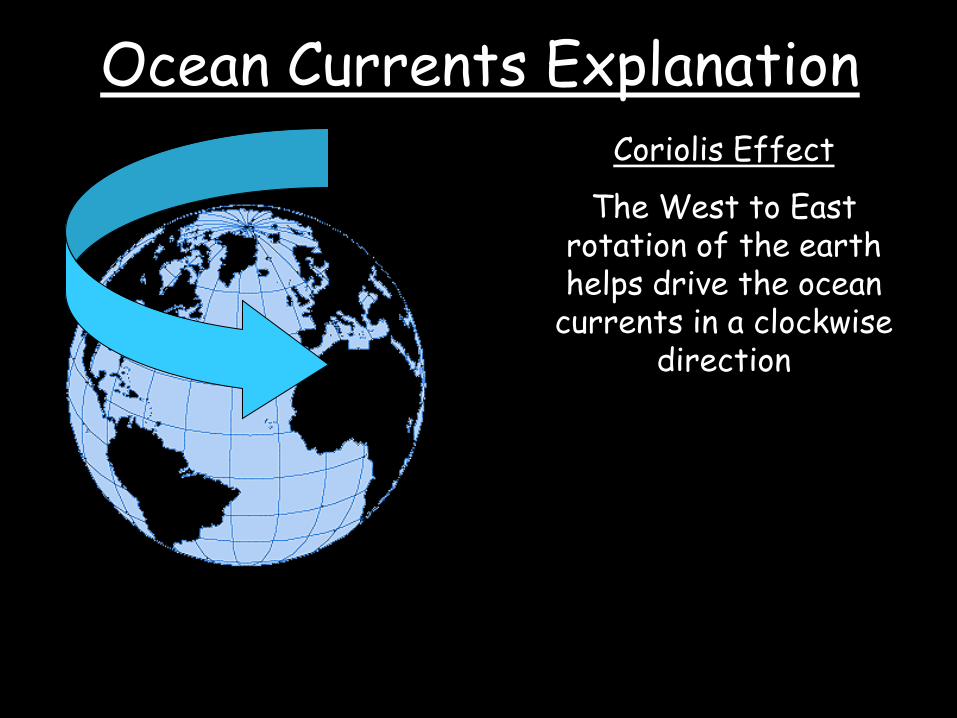
Ocean Currents Explanation Coriolis Effect
The West to East rotation of the earth helps drive the ocean
currents in a clockwise direction
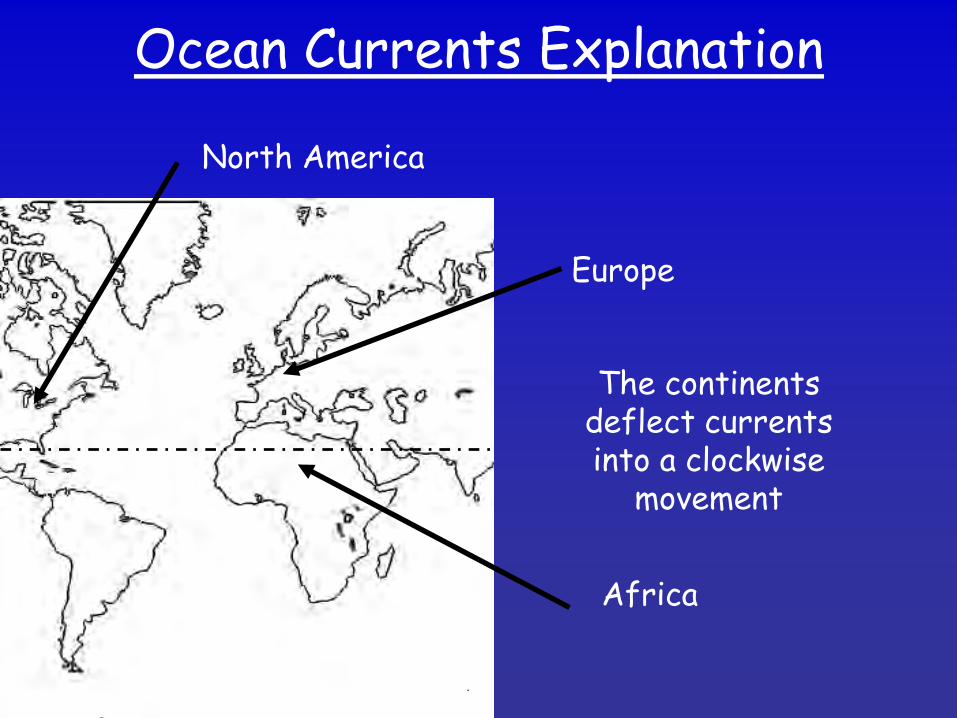
Ocean Currents Explanation
Africa
Europe
North America
The continents deflect currents into a clockwise
movement
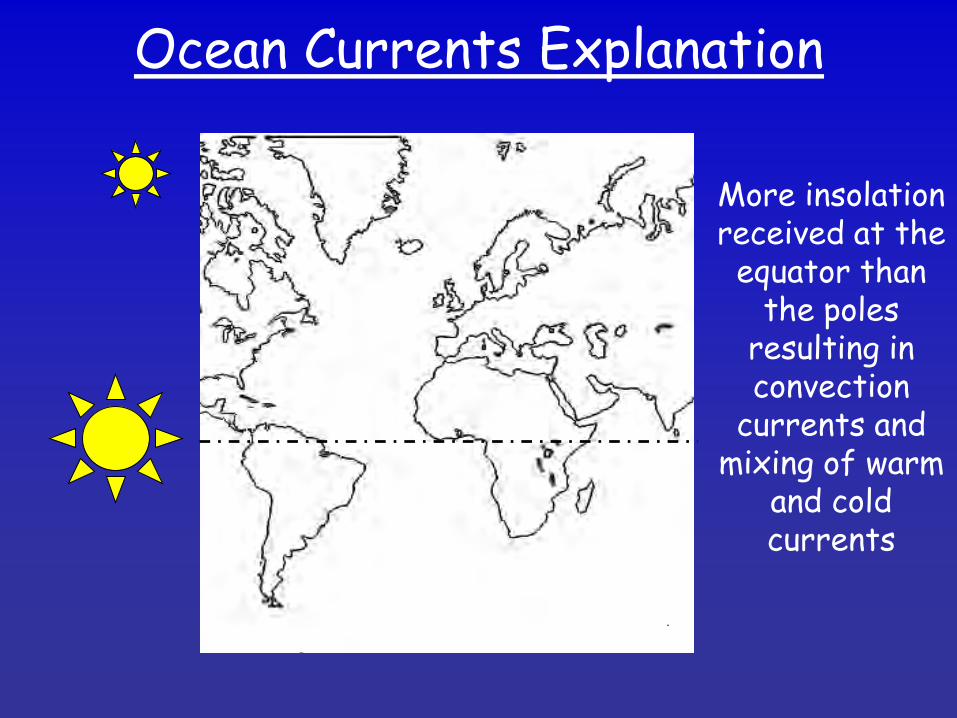
Ocean Currents Explanation
More insolation received at the
equator than the poles
resulting in convection
currents and mixing of warm
and cold currents
Changes In Global Temperatures
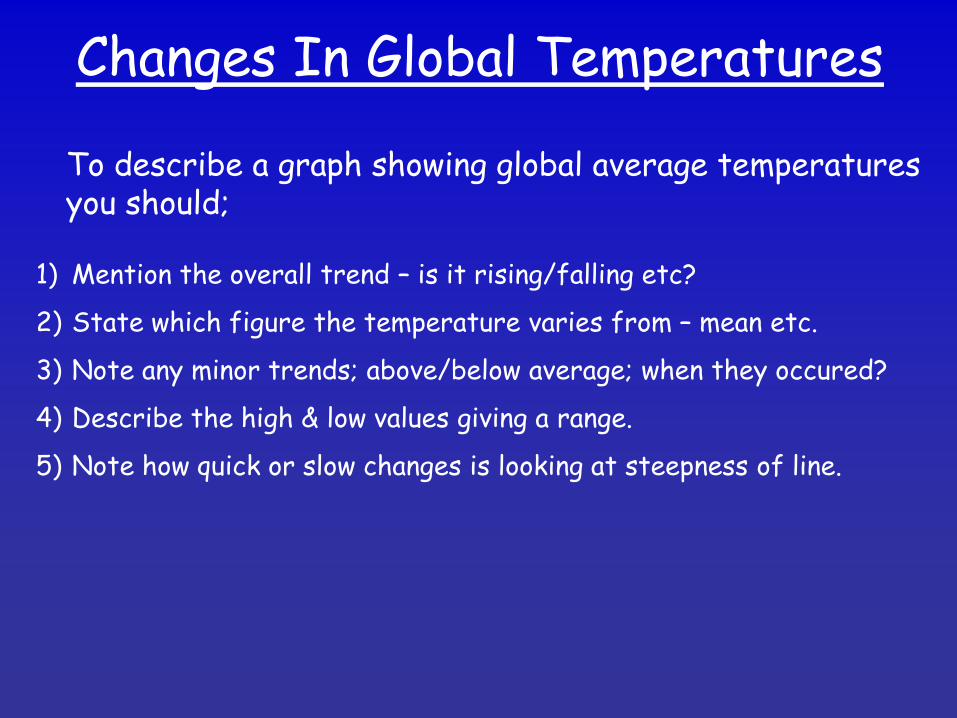
To describe a graph showing global average temperatures you should;
1) Mention the overall trend – is it rising/falling etc?
2) State which figure the temperature varies from – mean etc.
3) Note any minor trends; above/below average; when they occured?
4) Describe the high & low values giving a range.
5) Note how quick or slow changes is looking at steepness of line.
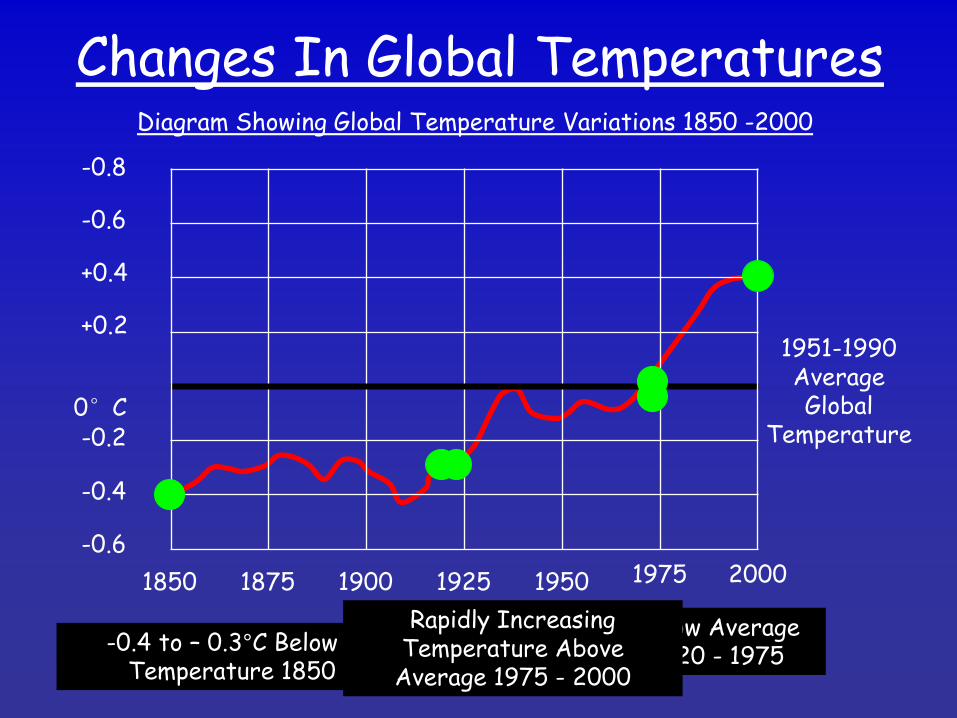
Changes In Global Temperatures
-0.6
+0.4
+0.2 1951-1990 Average Global
Temperature
0°C
-0.2
-0.4
-0.6
-0.8
2000 1975 1950 1925 1900 1875 1850
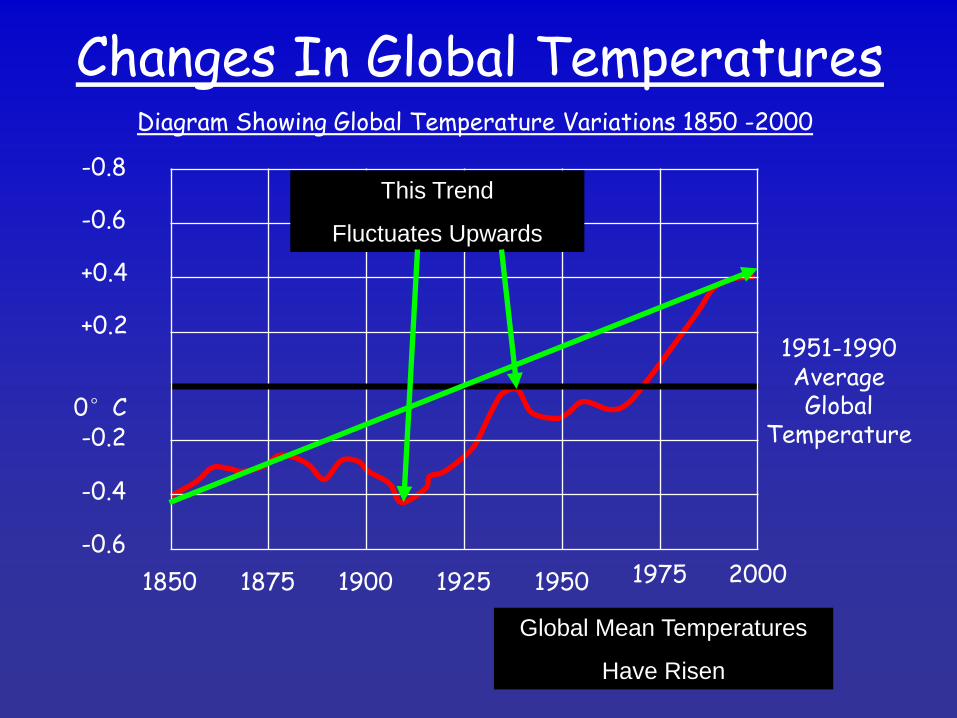
Diagram Showing Global Temperature Variations 1850 -2000
Global Mean Temperatures
Have Risen
This Trend
Fluctuates Upwards
Changes In Global Temperatures
-0.6
+0.4
+0.2 1951-1990 Average Global
Temperature
0°C
-0.2
-0.4
-0.6
-0.8
2000 1975 1950 1925 1900 1875 1850
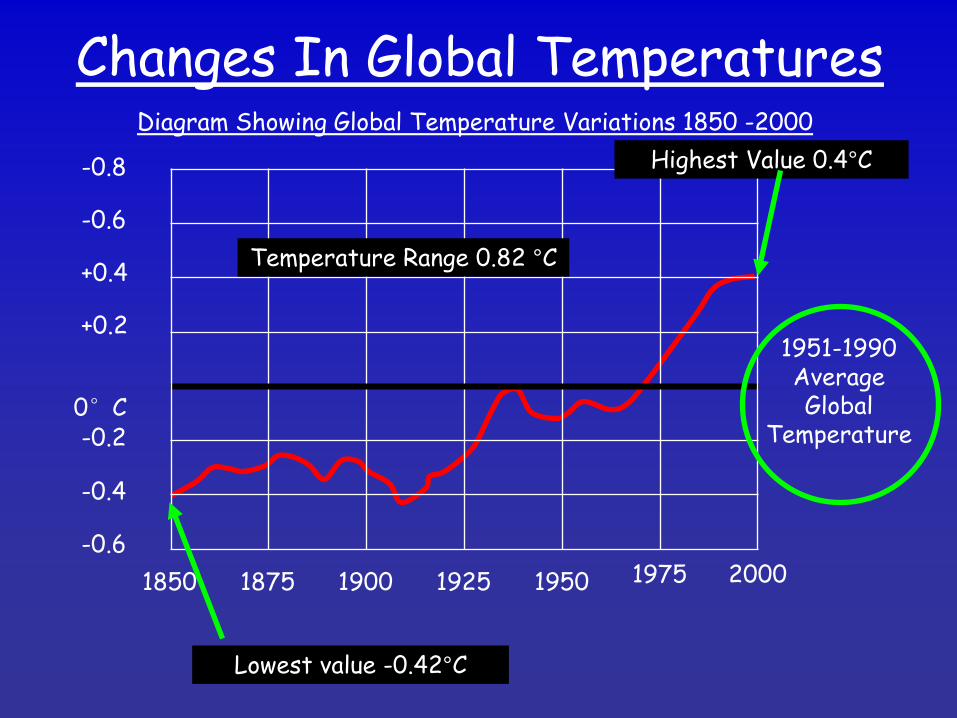
Diagram Showing Global Temperature Variations 1850 -2000
Lowest value -0.42°C
Highest Value 0.4°C
Temperature Range 0.82 °C
Changes In Global Temperatures
-0.6
+0.4
+0.2 1951-1990 Average Global
Temperature
0°C
-0.2
-0.4
-0.6
-0.8
2000 1975 1950 1925 1900 1875 1850
Diagram Showing Global Temperature Variations 1850 -2000
-0.4 to – 0.3°C Below Average Temperature 1850 - 1920
-0.2 to -0.1°C below Average Temperature 1920 - 1975
Rapidly Increasing Temperature Above
Average 1975 - 2000
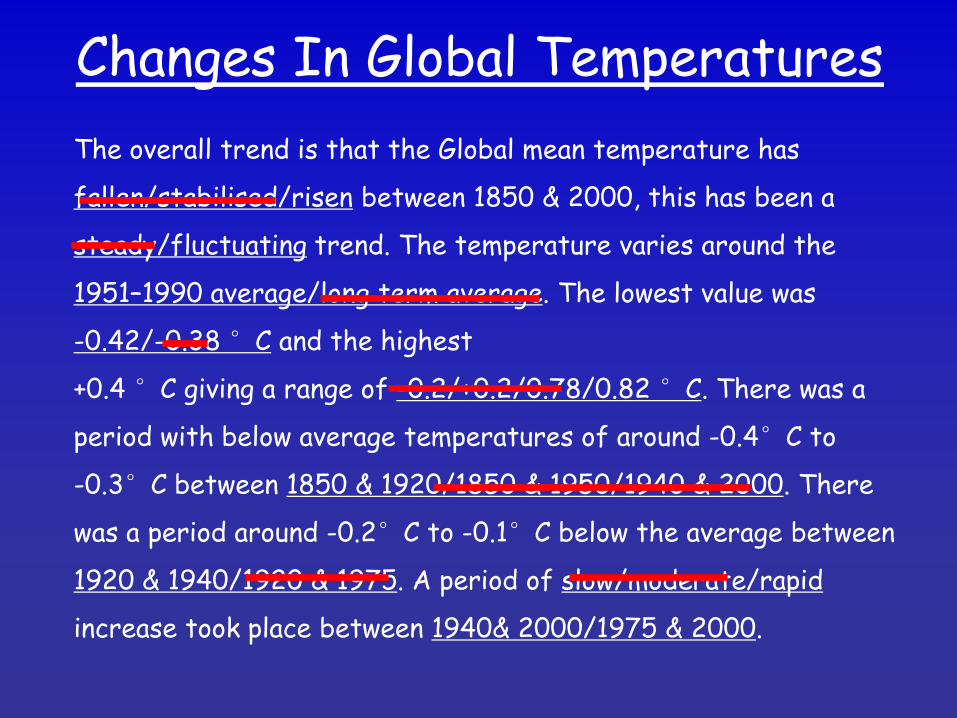
Changes In Global Temperatures The overall trend is that the Global mean temperature has
fallen/stabilised/risen between 1850 & 2000, this has been a
steady/fluctuating trend. The temperature varies around the
1951–1990 average/long term average. The lowest value was
-0.42/-0.38 °C and the highest
+0.4 °C giving a range of -0.2/+0.2/0.78/0.82 °C. There was a
period with below average temperatures of around -0.4°C to
-0.3°C between 1850 & 1920/1850 & 1950/1940 & 2000. There
was a period around -0.2°C to -0.1°C below the average between
1920 & 1940/1920 & 1975. A period of slow/moderate/rapid
increase took place between 1940& 2000/1975 & 2000.
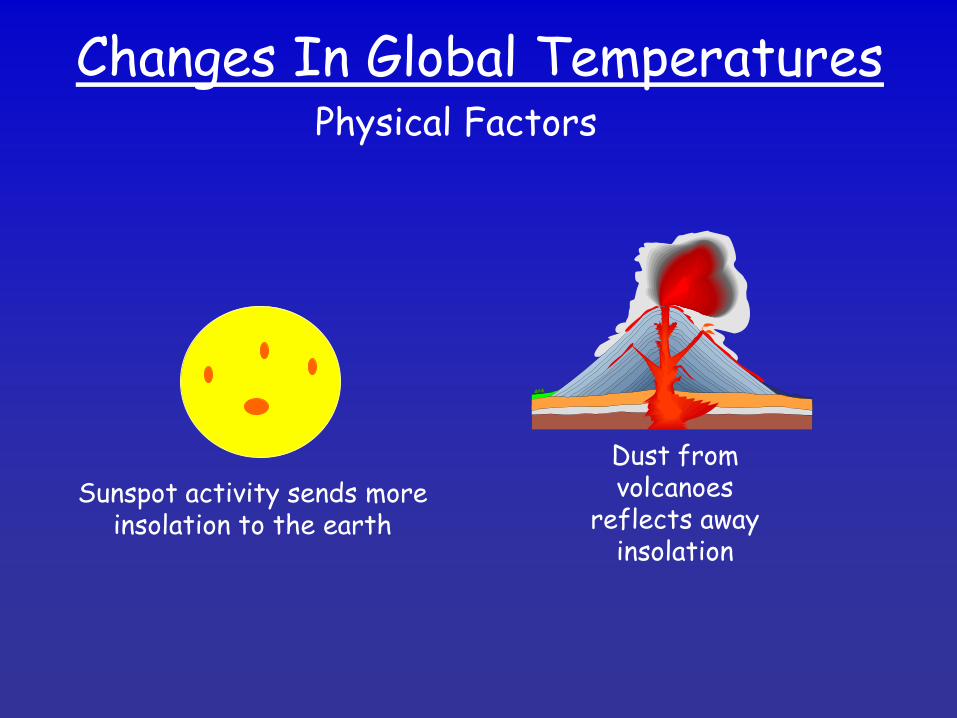
Changes In Global Temperatures Physical Factors
Sunspot activity sends more insolation to the earth
Dust from volcanoes
reflects away insolation
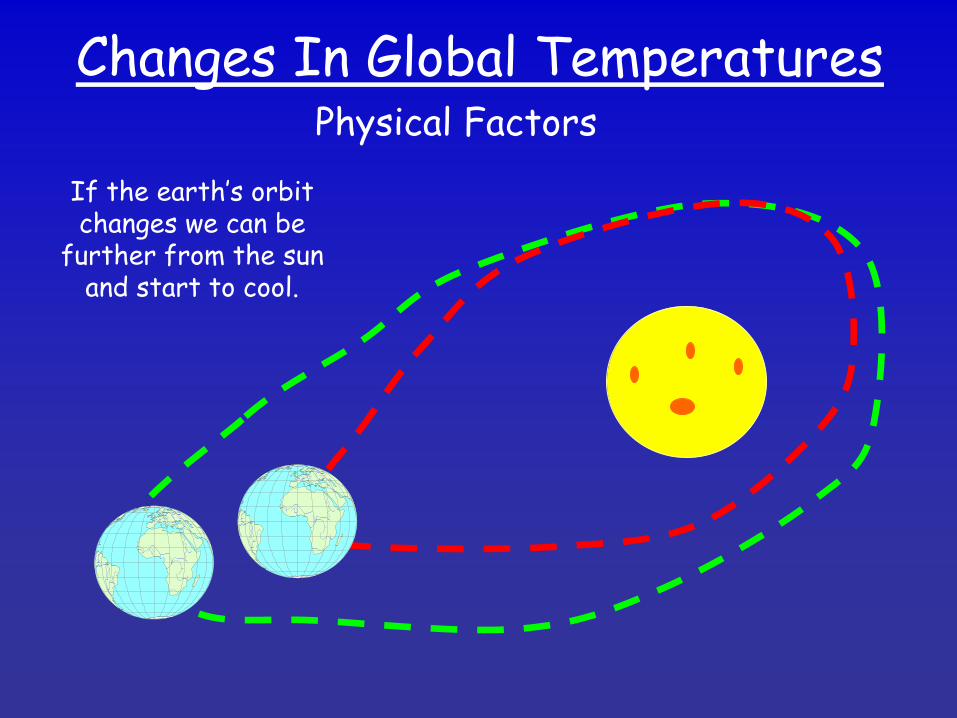
Changes In Global Temperatures
If the earth’s orbit changes we can be
further from the sun and start to cool.
Physical Factors
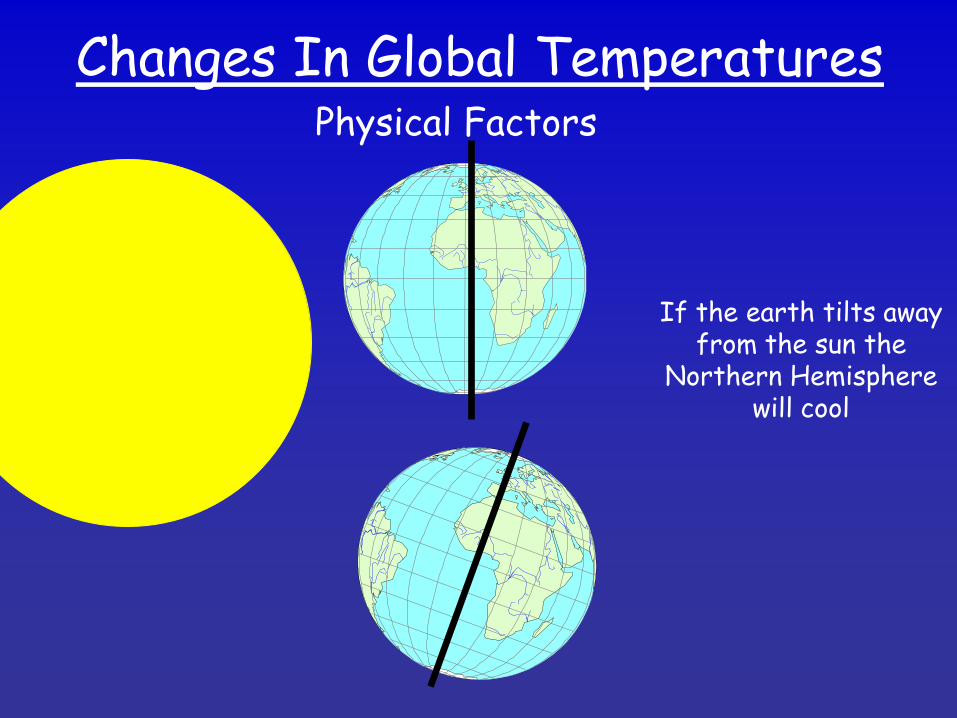
Physical Factors Changes In Global Temperatures
If the earth tilts away from the sun the
Northern Hemisphere will cool

Changes In Global Temperatures Human Factors
CO2 absorbs heat and reradiates heating up
the earth.
Methane, Nitrous Oxides & CFC
emissions do the same as CO2.
Deforestation adds CO2 when trees
burnt and less CO2 converted into water
by trees.
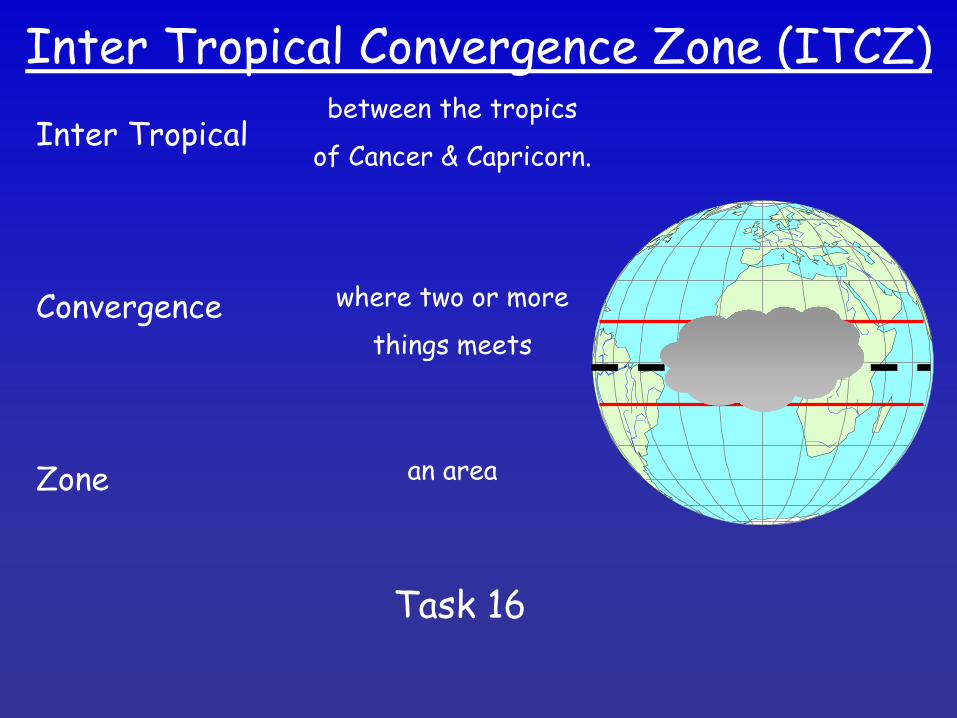
Inter Tropical Convergence Zone (ITCZ) between the tropics
of Cancer & Capricorn. Inter Tropical
Convergence
Zone
where two or more
things meets
an area
Task 16
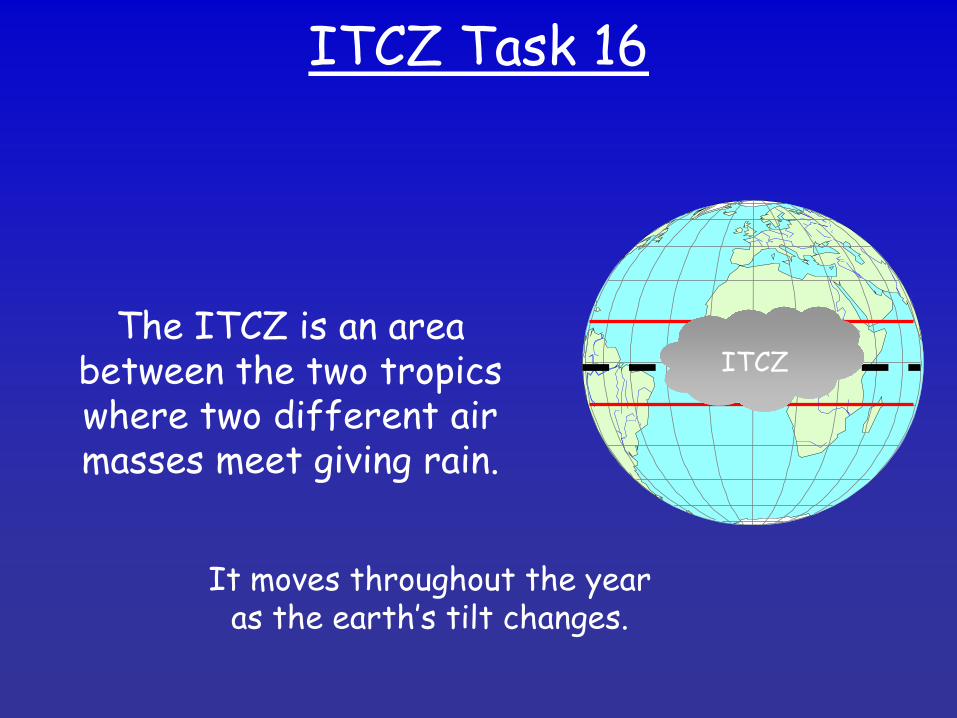
ITCZ Task 16
The ITCZ is an area between the two tropics where two different air masses meet giving rain.
ITCZ
It moves throughout the year as the earth’s tilt changes.
ITCZ Task 16
Low Pressure
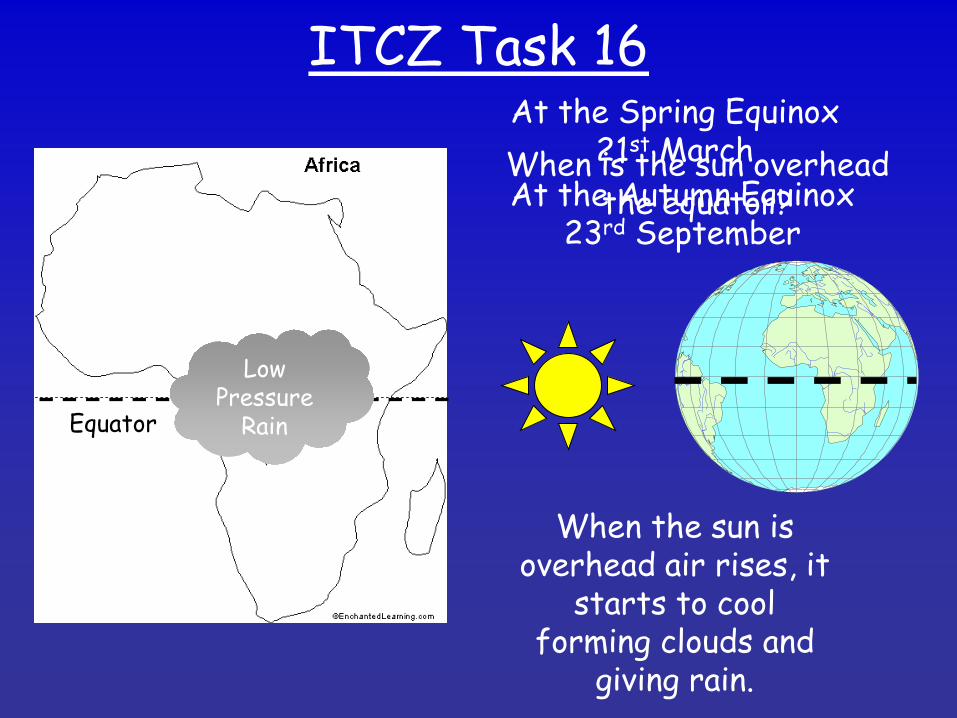
Rain
When is the sun overhead the equator?
At the Spring Equinox 21st March
At the Autumn Equinox 23rd September
When the sun is overhead air rises, it
starts to cool forming clouds and
giving rain.
Equator
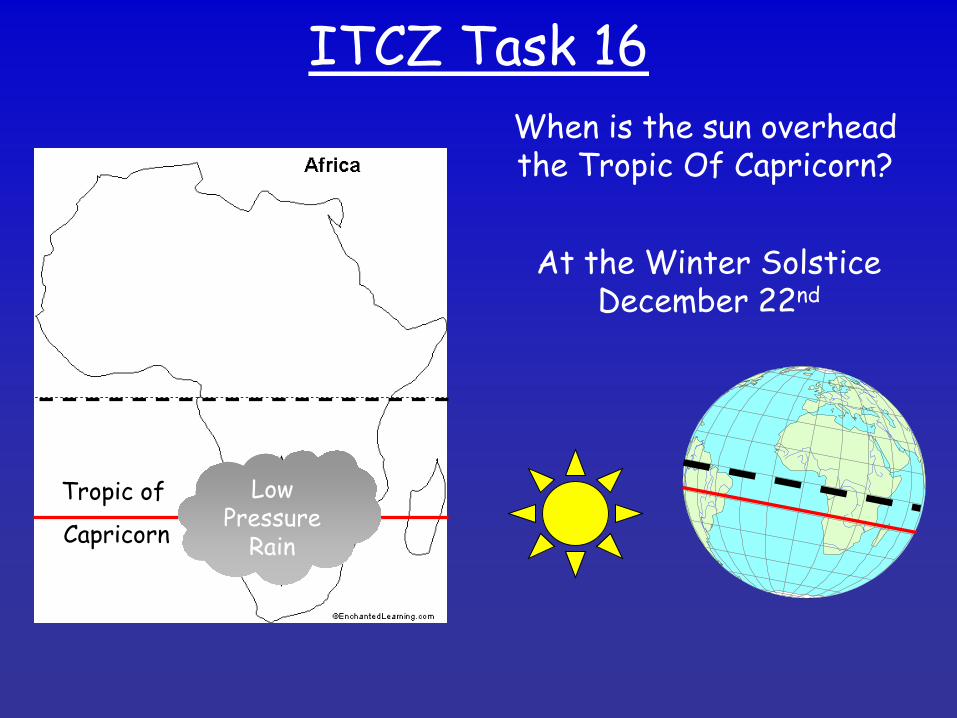
ITCZ Task 16
Low Pressure
Rain
When is the sun overhead the Tropic Of Capricorn?
At the Winter Solstice December 22nd
Tropic of
Capricorn
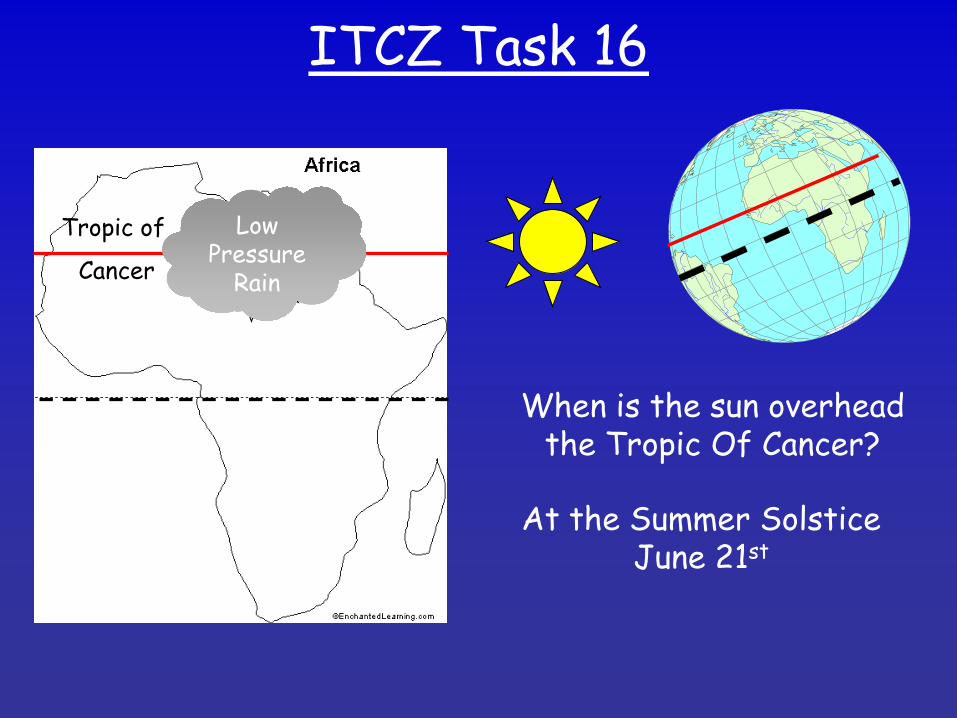
ITCZ Task 16
Low Pressure
Rain
When is the sun overhead the Tropic Of Cancer?
At the Summer Solstice June 21st
Tropic of
Cancer
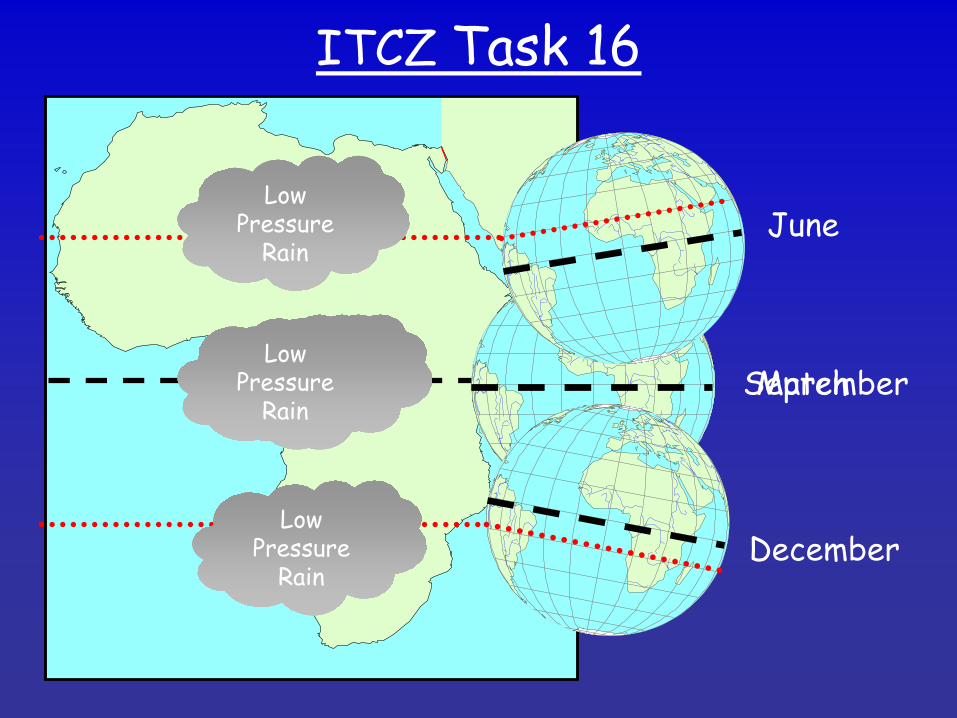
ITCZ Task 16
Low Pressure
Rain September
Low Pressure
Rain March
Low Pressure
Rain June
Low Pressure
Rain December
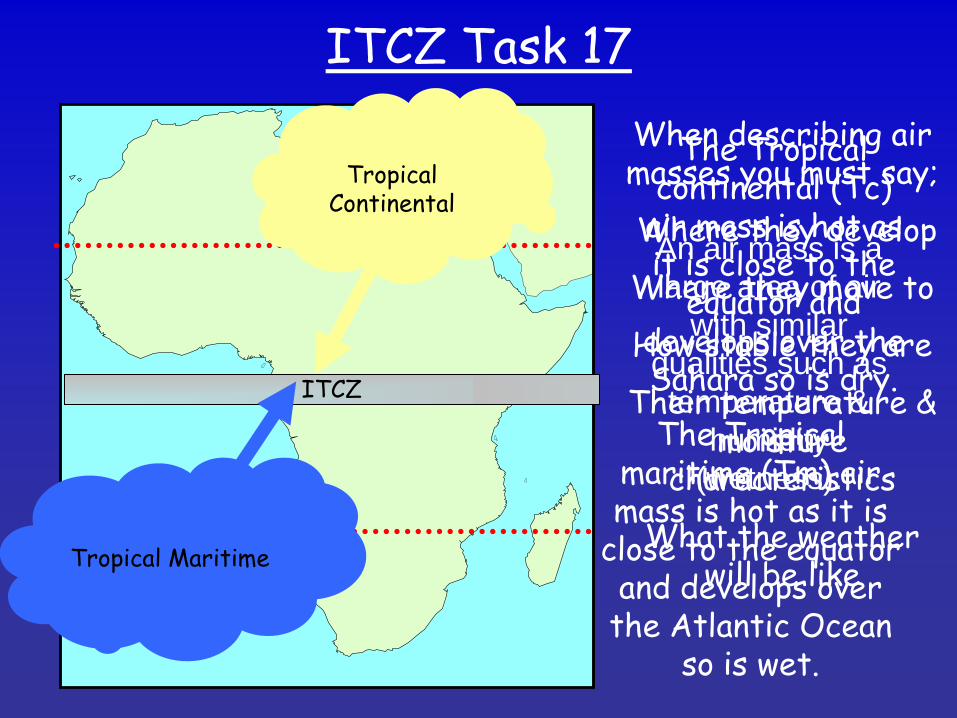
ITCZ Task 17
ITCZ
Tropical Continental
The Tropical continental (Tc)
air mass is hot as it is close to the
equator and develops over the Sahara so is dry.
Tropical Maritime
The Tropical maritime (Tm) air mass is hot as it is
close to the equator and develops over
the Atlantic Ocean so is wet.
An air mass is a large area of air
with similar qualities such as temperature &
humidity (wetness).
When describing air masses you must say;
Where they develop
Where they move to
How stable they are
Their temperature & moisture
characteristics
What the weather will be like
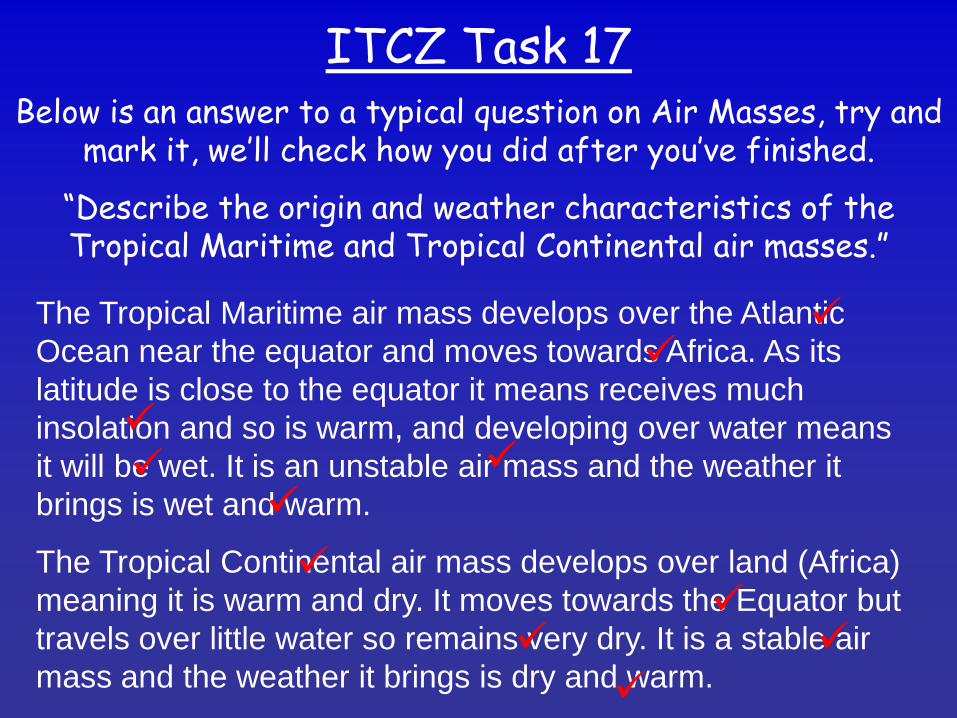
ITCZ Task 17
The Tropical Maritime air mass develops over the Atlantic Ocean near the equator and moves towards Africa. As its latitude is close to the equator it means receives much insolation and so is warm, and developing over water means it will be wet. It is an unstable air mass and the weather it brings is wet and warm.
The Tropical Continental air mass develops over land (Africa) meaning it is warm and dry. It moves towards the Equator but travels over little water so remains very dry. It is a stable air mass and the weather it brings is dry and warm.
Below is an answer to a typical question on Air Masses, try and mark it, we’ll check how you did after you’ve finished.
“Describe the origin and weather characteristics of the Tropical Maritime and Tropical Continental air masses.”
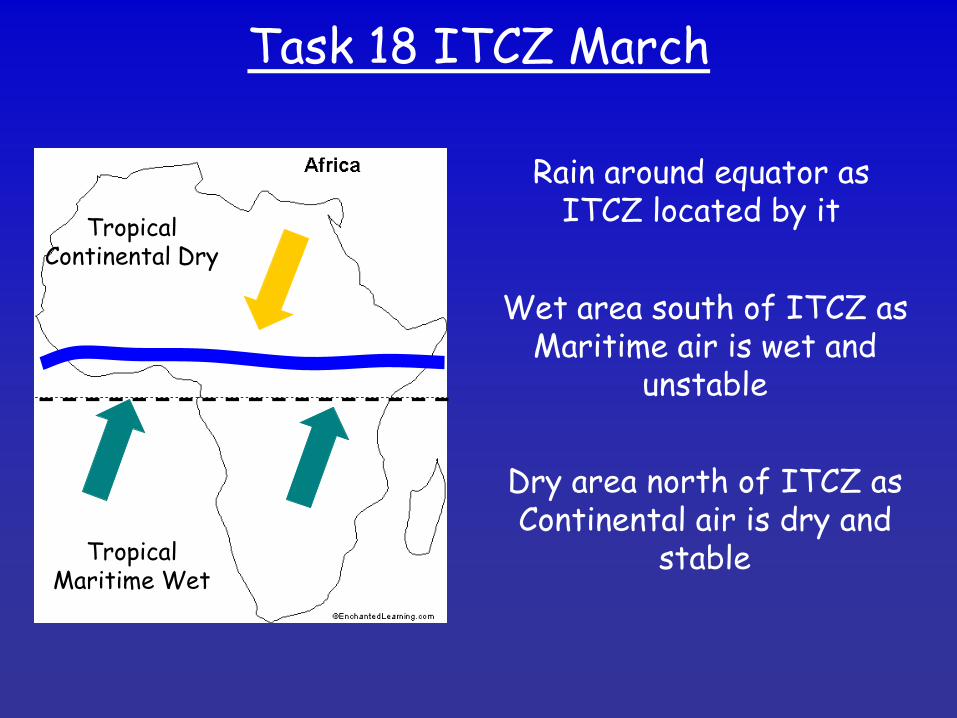
Task 18 ITCZ March
Tropical Continental Dry
Tropical Maritime Wet
Rain around equator as ITCZ located by it
Wet area south of ITCZ as Maritime air is wet and
unstable
Dry area north of ITCZ as Continental air is dry and
stable
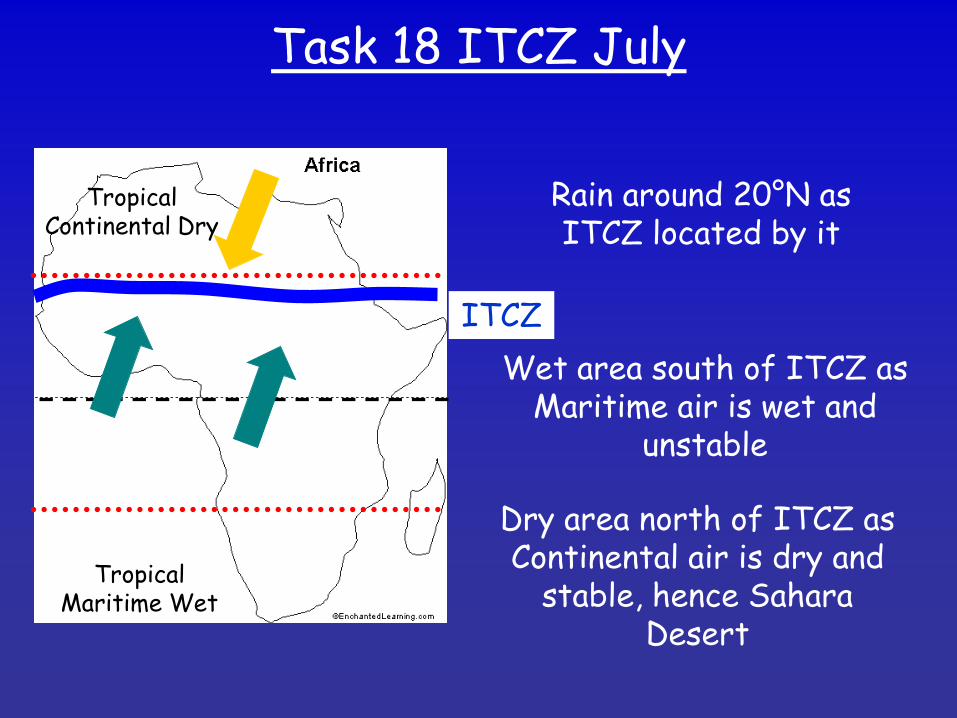
Task 18 ITCZ July
ITCZ
Tropical Continental Dry
Tropical Maritime Wet
Rain around 20°N as ITCZ located by it
Wet area south of ITCZ as Maritime air is wet and
unstable
Dry area north of ITCZ as Continental air is dry and
stable, hence Sahara Desert

Task 18 ITCZ September
Tropical Continental Dry
Tropical Maritime Wet
Rain around equator as ITCZ located by it
Wet area south of ITCZ as Maritime air is wet and
unstable
Dry area north of ITCZ as Continental air is dry and
stable
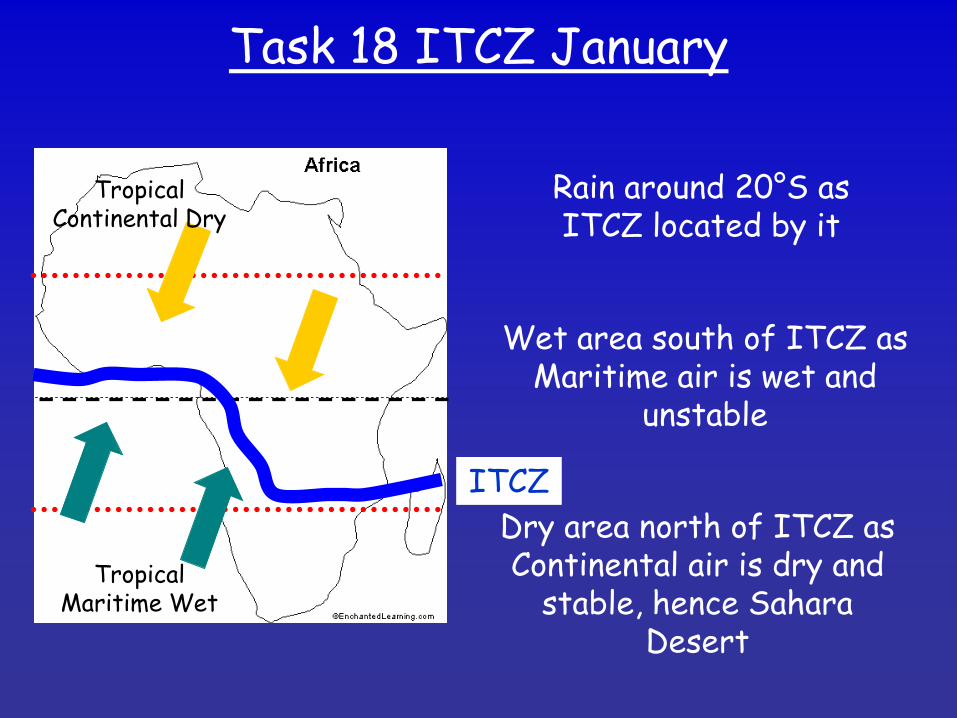
Task 18 ITCZ January
ITCZ
Tropical Continental Dry
Tropical Maritime Wet
Rain around 20°S as ITCZ located by it
Wet area south of ITCZ as Maritime air is wet and
unstable
Dry area north of ITCZ as Continental air is dry and
stable, hence Sahara Desert
ITCZ Task 18
You will each be given information on the ITCZ. You must then report back what you found out to the rest of your group. Now
answer these questions on what you found out.
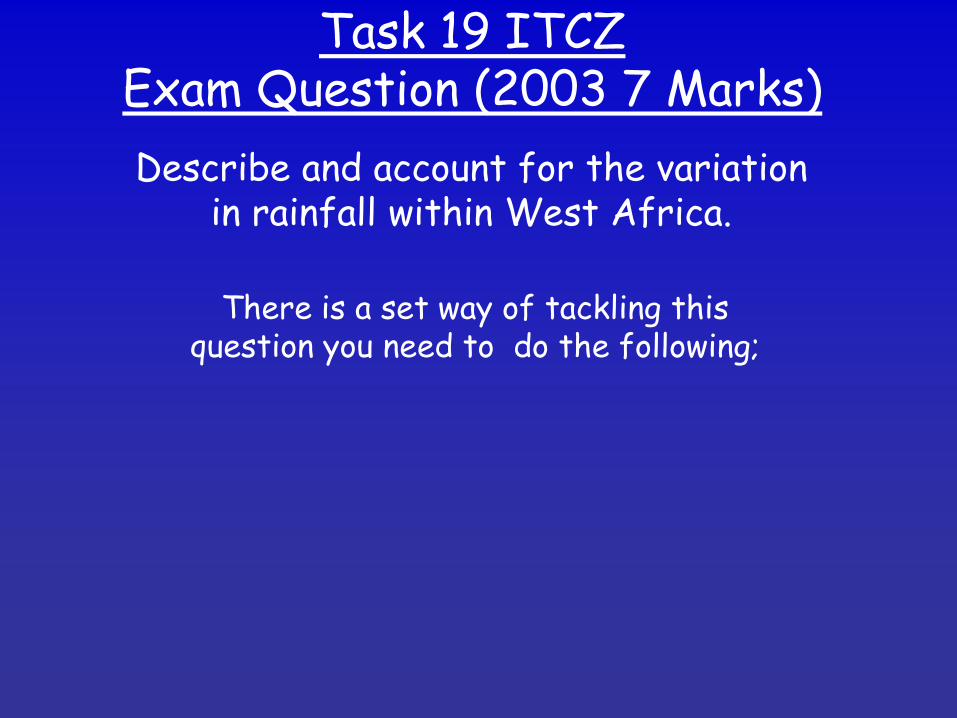
Task 19 ITCZ Exam Question (2003 7 Marks)
There is a set way of tackling this question you need to do the following;
Describe and account for the variation in rainfall within West Africa.
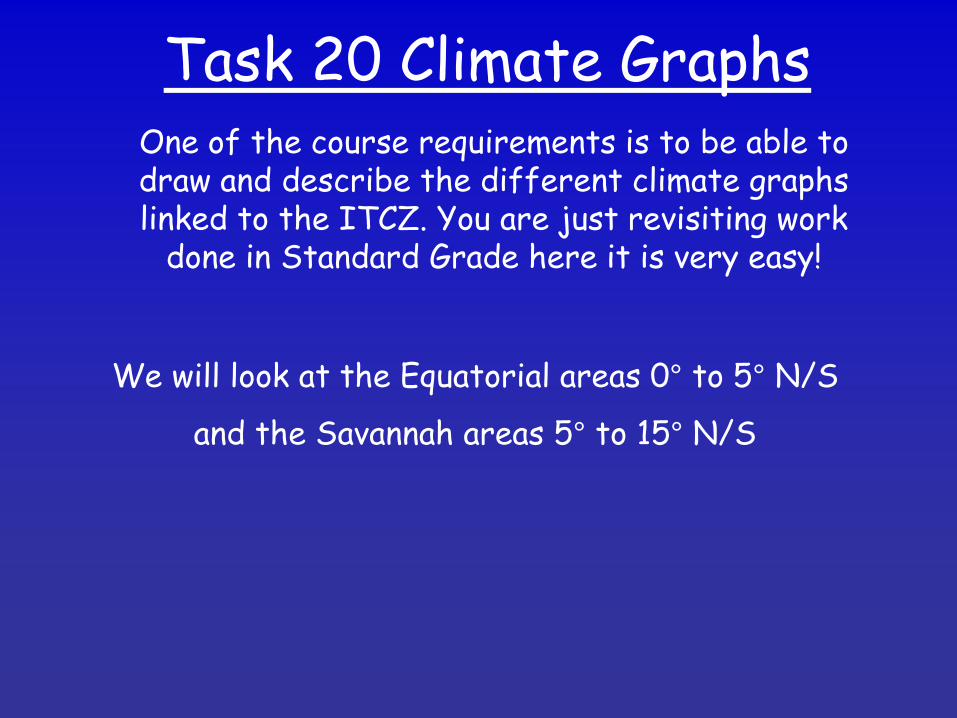
Task 20 Climate Graphs One of the course requirements is to be able to draw and describe the different climate graphs linked to the ITCZ. You are just revisiting work
done in Standard Grade here it is very easy!
We will look at the Equatorial areas 0° to 5° N/S
and the Savannah areas 5° to 15° N/S
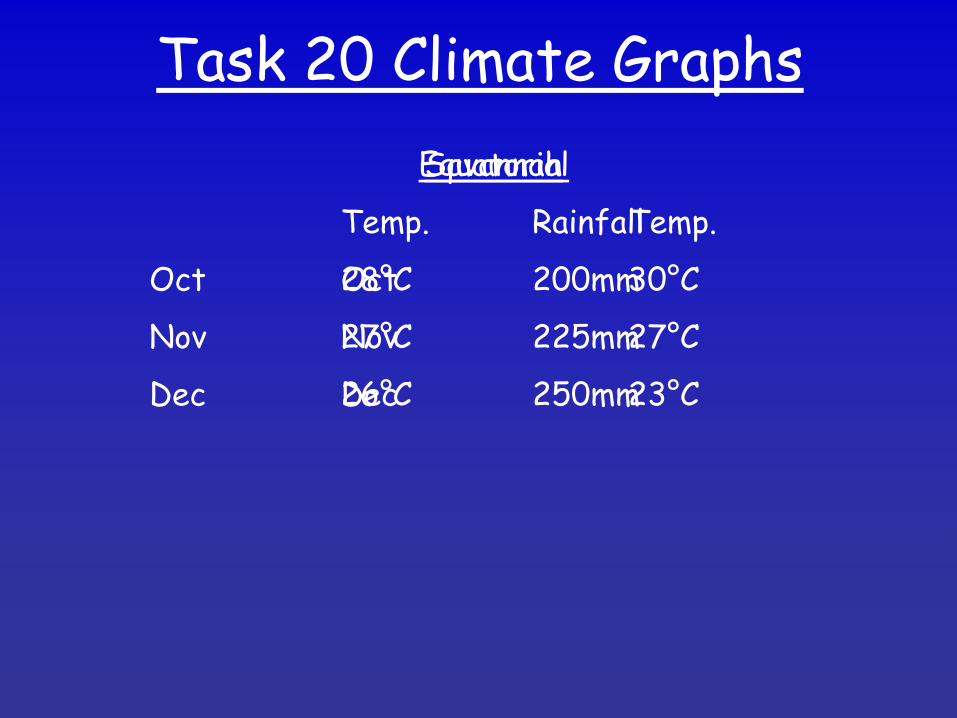
Task 20 Climate Graphs Equatorial
Temp. Rainfall
Oct 28°C 200mm
Nov 27°C 225mm
Dec 26°C 250mm
Savannah
Temp.
Oct 30°C
Nov 27°C
Dec 23°C
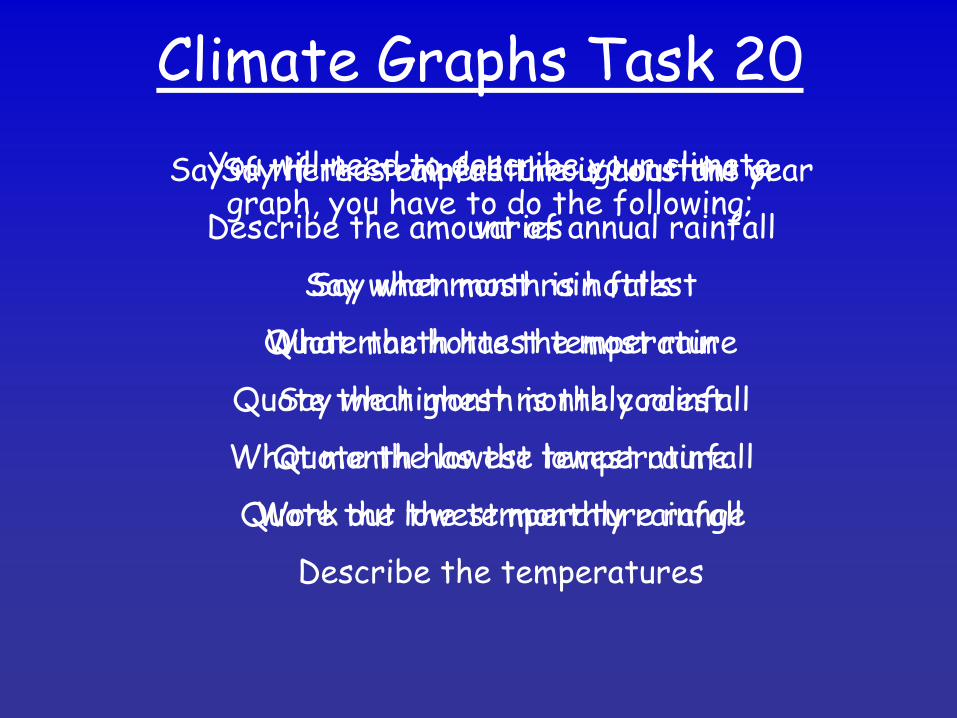
Climate Graphs Task 20 You will need to describe your climate graph, you have to do the following; Say if the temperature is constant or
varies
Say what month is hottest
Quote the hottest temperature
Say what month is the coolest
Quote the lowest temperature
Work out the temperature range
Describe the temperatures
Say if there is rainfall throughout the year
Describe the amount of annual rainfall
Say when most rain falls
What month has the most rain
Quote the highest monthly rainfall
What month has the lowest rainfall
Quote the lowest monthly rainfall

The End
Recommended