This is a repository copy of High strength/density ratio in a syntactic foam made from one-part mix geopolymer and cenospheres.
White Rose Research Online URL for this paper:http://eprints.whiterose.ac.uk/150097/
Version: Accepted Version
Article:
Hajimohammadi, A., Ngo, T., Provis, J.L. orcid.org/0000-0003-3372-8922 et al. (2 more authors) (2019) High strength/density ratio in a syntactic foam made from one-part mix geopolymer and cenospheres. Composites Part B: Engineering, 173. ISSN 1359-8368
https://doi.org/10.1016/j.compositesb.2019.106908
Article available under the terms of the CC-BY-NC-ND licence (https://creativecommons.org/licenses/by-nc-nd/4.0/).
[email protected]://eprints.whiterose.ac.uk/
Reuse
This article is distributed under the terms of the Creative Commons Attribution-NonCommercial-NoDerivs (CC BY-NC-ND) licence. This licence only allows you to download this work and share it with others as long as you credit the authors, but you can’t change the article in any way or use it commercially. More information and the full terms of the licence here: https://creativecommons.org/licenses/
Takedown
If you consider content in White Rose Research Online to be in breach of UK law, please notify us by emailing [email protected] including the URL of the record and the reason for the withdrawal request.
1
1 High Strength/Density Ratio in a Syntactic Foam Made
2 from One-Part Mix Geopolymer and Cenospheres
3
4 Ailar Hajimohammadia1, Tuan Ngob2 , John L Provisc, Taehwan Kima and Jitraporn Vongsvivutd
5 a Department of Civil and Environmental Engineering, University of New South Wales, New South Wales 2052, Australia
6 b Department of Infrastructure Engineering, University of Melbourne, Victoria 3010, Australia
7 c Department of Materials Science and Engineering, The University of Sheffield, Sheffield S1 3JD, United Kingdom
8 d ANSTO, Australian Synchrotron, 800 Blackburn Road, Clayton, Victoria 3168, Australia
9
10 1 Corresponding Author: Ailar Hajimohammadi ([email protected])
11 2 Corresponding Author: Tuan Ngo ([email protected])
12
13 Abstract
14 By designing a composite of one-part mix geopolymer and hollow cenospheres, a commercially viable
15 and environmentally-friendly foam was synthesized with a high strength/density ratio. The composite
16 is made of a dry mix powder of geopolymer source materials, sodium silicate alkali activator and
17 cenospheres, which starts to react when mixed with water. As the geopolymer reacts and gains
18 strength over time, the surface of the cenospheres takes part in the reaction and forms a strong bond
19 with the binding matrix. Synchrotron-based Fourier transform infrared microspectroscopy revealed,
20 for the first time, the chemical bonding interaction of the amorphous interfacial layer between the
21 geopolymer and cenospheres. The resulting foam composite gained a strength of 17.5 MPa at a
22 density of 978 kg/m3, which is noticeably higher than that of existing environmentally-friendly
23 lightweight foams made under ambient conditions. The thermal conductivity of the foam was
24 measured to be around 0.28 kW/mK, which is similar to that of foam concrete. This foam produced
25 in this study is found to be lightweight, strong and possess a desirable insulating capacity, while the
26 preparation process of the one-part mix composite is maintained simply by adding water and curing
27 the mixture at an ambient temperature.
28
29 Keywords: Lightweight composite; Foam; Geopolymer; High strength; One-part; Cenosphere
2
30 1. Introduction
31
32 Lightweight prefabricated panels have been widely used for construction and refurbishment [1]. The
33 application of these building elements in construction has many advantages. Their light weight
34 simplifies the handling of the panels and reduces the dead load of buildings. By specialising the design
35 of these panels for rapid assembly and insulation, they remarkably reduce the construction time, and
36 improve the acoustic and thermal performance of buildings [2]. Also, by reducing the quantity of
37 required materials and increasing the potential for recycled waste, lightweight building elements can
38 reduce the embodied energy and carbon footprint of buildings.
39
40 Many studies have been conducted on developing lightweight concrete and composites for non-
41 structural and structural building components [3, 4]. Polymeric foams have been explored as a core
42 of lightweight sandwich panels, and in fact expanded polystyrene (EPS) is widely used in Australia.
43 However, the problem with polymeric foams is their vulnerability to high temperatures and fire.
44 There is growing interest in improving the properties of these panels while maintaining their low cost
45 in order to develop environmentally friendly options [5]. Lightweight concrete has been researched
46 for decades as a potential fire-resistant building component; with many advantages such as high
47 durability, long service life and low cost, concrete seems to be an ideal material for modular
48 construction if it can be lighter [6]. Many techniques have been applied for manufacturing concretes
49 with a lower density, and the most popular technique is the application of lightweight aggregates [7].
50 The low fire resistance of polymeric foams can be compensated by embedding them in a fire-resistant
51 cementitious matrix, and the resulting composite would thereby have the advantages of both
52 components to some extent.
53
54 In addition to using the lightweight aggregates, the other popular technique available for reducing
55 the weight of concrete is by inserting air voids into the cement matrix. This technique, which is known
56 as foaming, can be conducted by mechanically mixing a pre-made foam with cement paste or adding
57 a chemical foaming agent (such as hydrogen peroxide) that releases gas as a result of its reaction in
58 an alkaline environment [4]. Compared with the use of lightweight aggregates, the foaming technique
59 is generally more efficient in reducing overall density. Therefore, ultra-lightweight components with
60 densities as low as 300 kg/m3 can be developed. However, the major problem associated with
61 foaming is that controlling the density is not straightforward [8]. The stability of pre-made foam, the
3
62 setting time of the cement, and the simultaneous reaction of the binder and chemical foaming agent,
63 bring complications to the design and manufacturing of the foam concrete. Some variations in the
64 quality and density of the foamed concrete seem unavoidable during the manufacturing process.
65 Above all, the main problem is that foam concrete is in general not strong enough for applications as
66 a structural component. Lightweight and foam concrete with a density of 1000 kg/m3 (or lower) have
67 been broadly researched for non-structural applications. The typical lightweight concrete in this
68 density range can reach a strength of about 2-7 MPa [9]. However, for structural lightweight systems
69 such as floor systems, a strength in the range of 10-14 MPa is required [10].
70
71 This study explores the possibility of developing high-strength lightweight composites using one-part
72 mix geopolymers and cenospheres. Geopolymers are known as environmentally-friendly construction
73 materials that can convert landfill wastes such as fly ash and blast furnace slag into useful
74 cementitious binders [11-13]. The conventional geopolymer reaction process involves the alkali
75 activation of aluminosilicate powders, often sourced as waste materials, by using alkaline solutions
76 such as water glass and sodium hydroxide. The key silica and alumina elements of the powder
77 precursors are released into the alkaline aqueous environment and undergo speciation,
78 reorganisation, gelation and polymerisation stages until they form a three-dimensional
79 aluminosilicate network. One of the problems with this form of geopolymer synthesis is the difficult
80 handling of the alkali solutions; nevertheless, one-part geopolymers have been explored to resolve
81 this problem [14].
82
83 A cenosphere is an aluminosilicate hollow sphere which is filled with air or inert gas, and is generated
84 as a by-product of coal combustion in thermal power plants, readily separated from the bulk of the
85 combustion ash by density separation [15]. The rigidity, lightweight, small size and spherical shape of
86 cenospheres have made them very useful for manufacturing syntactic foams [16]. Syntactic foams
87 are lightweight composites that are made from hollow spheres and a binding matrix. The matrix
88 material can be any metal, ceramic, polymer or resin that can hold the lightweight filler together and
89 give it the desired shape. Lightweight cementitious composites made from cenospheres are gaining
90 much attention recently because of their attractive structural and thermal performance.
91
92 Blanco et al. [17] manufactured lightweight concretes using cenospheres. They used powder packing
93 theory to optimize the properties of the concrete, but no microstructural enhancements and high
4
94 curing temperatures were applied. The optimum strength achieved for low densities (around 1000
95 kg/m3) was 5 MPa [17]. Huang et al. [18] used cenospheres and industrial wastes to produce
96 environmentally friendly lightweight composites. They achieved mixtures as light as 1649 kg/m3 with
97 the compressive strength of 25 MPa, whereby the samples were cured under ambient conditions
98 [18]. Nematollahi et al. [19] studied lightweight geopolymer composites using cenospheres,
99 expanded perlite and expanded glass aggregates, achieving densities of 1586-1833 kg/m3 and
100 reporting strengths of 43.4-56.8 MPa [19]. Gao et al. [20] used aerogels to reduce the density of
101 cement composites to 1000 kg/m3 and gained a strength of about 8.3 MPa [20]. Tラヮ屯┌ et al. [21]
102 fabricated lightweight cement composites using diatomite and pumice lightweight aggregates. The
103 density of the samples with pumice was dropped to around 1500 kg/m3, and with diatomite as low
104 as 900 kg/m3. For the lightweight diatomite samples, the maximum strength was reported to be
105 around 6 MPa [21]. Ng et al. [22] reported making lightweight composites from cement and aerogels.
106 They reported that the optimum amount of aerogel addition is about 50 vol%, yielding samples of
107 density 1400 kg/m3 with a strength of 20 MPa at 28th day; the strength of the samples sharply
108 dropped with higher amounts of aerogel (i.e. lower densities) [22].
109
110 Some researchers also applied microstructural enhancement techniques to achieve higher strength
111 to density ratios. Hanif et al. [23] produced lightweight composites using cenospheres and aerogel,
112 and achieved high strength to density ratio. They enhanced the binder performance by the addition
113 of silica fume, PVA fibre and superplasticizer. Their oven dried samples could reach 1003 kg/m3
114 density and 18.63 MPa strength, but the oven temperature and the duration of drying was not
115 reported [23]. Senthamarai et al. [24] also investigated replacing cement with cenospheres, and
116 adding silica fume to compensate for the strength reduction caused by the cenospheres. The density
117 of the samples was not reported, but 12% silica fume replacement helped in enhancing the
118 microstructure of the binder and maintaining the strength of matrix [24]. Liu et al. [25] made high
119 strength lightweight cement composites adding cenospheres to a cement binder. The strength of the
120 lightest samples (1300 kg/m3) was reported to be about 58 MPa, with the use of silica fume, PVA fibre
121 and superplasticizer, curing for 28 days in high humidity (>95%) [25]. Wang et al. also made
122 lightweight samples using cement and cenospheres, with a density of about 1040 kg/m3 and
123 compressive strength of 25 MPa. Silica fume, shrinkage reducing admixtures and superplasticizer
124 were used, and the curing condition of the samples was not reported [26]. Wang et al. have also
125 reported making high performance lightweight composites using metakaolin-based geopolymer and
5
126 cenospheres, reaching 36.5 MPa strength for samples (small cylindrical specimens of ø20x20 mm)
127 with 820 kg/m3 density. In their study, metakaolin was calcined at 800 °C for 4 hours, and the
128 geopolymer composite was cured at 80 °C for 6 days [27]. Shao et al. [28] have reported making high
129 strength to density geopolymer composites using ultra-fine fly ash with a mean particle size of 4.6
130 µm, and hollow glass spheres as lightweight fillers. They reported achieving 22 MPa in compression,
131 for the samples as light as 782 kg/m3 [28]. Wu et al. made lightweight cement composites using
132 hollow cenospheres, at a density of 1154 kg/m3 after one day, with a strength of 33 MPa at 28 days.
133 They used silica fume, superplasticizer, viscosity modifier, shrinkage reducing admixture, and
134 polyethylene fibres, curing in a fog room at 28-30°C until the testing age. They mentioned a further
135 drop of the density to 1042 kg/m3 in the oven-dried samples, but the temperature and duration of
136 the drying process were not reported [29].
137
138 From this summary of some of the available literature, it is evident that the application of ultra-fine
139 fly ash, silica fume, and other admixtures can improve the microstructure and enhance the
140 performance of lightweight cementitious composites. Also, high humidity, high temperature curing,
141 calcination of the source materials at high temperatures, or extending the curing duration of
142 composites can all enhance the performance of composites. However, costly source materials and
143 energy-intensive processes negatively impact the environmental sustainability and commercial
144 viability of the products for construction applications.
145
146 In this study, a syntactic foam of cenospheres with a matrix of one-part mix geopolymers has been
147 explored for the first time to synthesise an environmentally-friendly and commercially viable
148 lightweight composite. One-part mix geopolymers are user-friendly binders that improve the
149 commercial viability of geopolymers by eliminating the difficulties associated with handling corrosive
150 alkali solutions. They facilitate manufacturing of a dry component that can be activated simply by
151 just adding water (similar to cement) [14]. Samples are manufactured and cured at ambient
152 conditions, and it was targeted to achieve high strength to density ratios at very low densities (below
153 1000 kg/m3).
154
155 The importance of interfacial microstructure on strength development of composites is well known
156 [30] . Since cenospheres have a similar chemical composition to the other fractions of the bulk fly ash,
157 there is a possibility that, if exposed to an alkaline environment, the surface of the filler can take part
6
158 in the reaction. The bonding of a filler with its surrounding matrix can improve the mechanical
159 performance of the composite in the long term and facilitate the development of lightweight
160 structural foams [31]. Wang et al. [27] mapped the elemental distribution at the interface of
161 geopolymers and cenospheres, and reported that an interfacial layer is forming due to the elemental
162 diffusion. Li et al. [32] studied the interface of phosphate geopolymers with cenospheres. They
163 reported that the formation of the amorphous layer at the interface indicates chemical reaction
164 between cenospheres and geopolymer, although their electron diffraction results could not
165 distinguish the nature of the chemical bonding due to the amorphous structure of interface region
166 [32].
167 This summary of the literature highlights that there is a large research gap in understanding how
168 cenospheres interact within geopolymer composites. The superior characteristics of high photon flux
169 density and diffraction-limited spatial resolution with enhanced spectral quality achieved by
170 synchrotron Fourier transform infrared (SR-FTIR) microspectroscopy was demonstrated to be the key
171 requirement allowing for spatially resolved chemical mapping measurement of amorphous materials
172 at a micron-scale spatial resolution [33] . In this research, we utilized the SR-FTIR technique to reveal
173 the spatial distribution of chemical bonding interaction at the interface of the geopolymer
174 composites.
175
176 2. Materials and methods
177 The fly ash (FA) used in this study was obtained from Cement Australia with the commercial name of
178 Melbourne Ash, and ground granulated blast furnace slag (GBFS) was purchased from Independent
179 Cement, Australia. Sodium metasilicate powder with a composition of 50.5 wt% Na2O, 46.2 wt% SiO2
180 and 3.3 wt% H2O was supplied from Redox. Cenospheres, with a commercial name of E-Spheres
181 (grade ES300), were purchased from Envirospheres. According to the material data obtained from
182 the manufacturer, the maximum bulk density of E-Spheres is 450 kg/m3, maximum moisture content
183 is 0.5 %, and the shell thickness of each sphere is approximately 10% of the diameter. Table 1
184 summarises the results obtained by X-ray fluorescence (XRF) analysis of the source materials.
185
186 To make one-part mix geopolymer composites, 21 wt% FA, 14 wt% GBFS, 38 wt% E-Sphere and 3 wt%
187 sodium metasilicate were dry mixed. They were then blended for one minute, and 24 wt% of water
188 was added and mixed into the dry mixture for five minutes to make a paste. The composition and the
7
189 percentage of the lightweight filler (E-Spheres) were adjusted to target a dry density of around 1000
190 kg/m3.
191
192 Table 1. Chemical composition (mass %) of FA, GBFS and E-Spheres determined by XRFa.
SiO2 TiO2 Al2O3 Fe2O3 MnO MgO CaO K2O P2O5 SO3 Na2O LOI (a)
FA 42.09 1.44 25.13 13.16 0.18 1.27 13.56 0.41 1.10 0.41 0.81 0.44
GBFS 31.00 0.49 13.96 0.32 0.33 6.33 40.92 0.31 0.01 2.17 t(a) 4.16
E-Sphere 60.96 1.00 29.08 4.20 0.02 0.97 0.70 2.21 0.10 0.04 0.41 0.31
193 a t: trace amounts detected. LOI: loss on ignition at 1000 °C.
194
195 After preparing the paste, the mixtures were poured into 50 mm cubic moulds, and sealed and cured
196 under ambient conditions. The compressive strength of the samples was determined using an ELE
197 ADRAuto 1500 compression testing machine at a rate of 0.5 kN/s. For each age of testing, three cubic
198 samples were tested, and the average results reported. Attenuated total reflectance Fourier
199 transform infrared (ATR-FTIR) spectroscopy was used to monitor the chemical bonding interaction of
200 the geopolymer binder over time. A Varian FTS 7000 FT-IR spectrometer with a single reflectance
201 diamond ATR attachment was used for this analysis. Absorbance spectra within the spectral range of
202 4000-400 cm-1 were collected at a resolution of 2 cm-1 and a scanning speed of 5 kHz with 64 scans.
203 The paste used for the ATR-FTIR analysis did not include the E-Sphere filler, in order to show the
204 chemical changes in the geopolymer binder. The setting time of the geopolymer paste has also been
205 measured using a Vicat instrument, following ASTM C191 .
206
207 XRD analysis has been performed on E-Spheres and the geopolymer binder to show the crystalline
208 phases and estimate the amorphous content of the samples. XRD data were collected using Bruker
209 D8 Advance X-ray diffractometer with Ni-aキノデWヴWS C┌ Kü ヴ;Sキ;デキラミ ふヱくヵヴ Åぶが ┘キデエ ヰくヰヲこ ヲ. ゲデWヮゲ ;ミS ;
210 scan rate of 1.0 s per step. To identify the crystalline phases, diffraction patterns were compared to
211 the ICDD PDF4 database using the Jade 7 software. Phase identification was conducted using
212 Diffrac.EVAV4.1 software with the ICDD PDF4+ 2015 database and Quantitative Rietveld analysis for
213 the quantification of identified crystalline phases was carried out using Bruker Diffracplus Topas
8
214 software. Crystal structures for the identified phases were taken from the ICDD PDF4+ 2015 database
215 and entered into Topas. The model parameters were allowed to vary in order to give the best fit
216 between the model and the measured data.
217
218 A Leica M205FA automated microscopy unit was used to produce microscopic images of E-Spheres:
219 a thin layer of E-Spheres was moistened and spread on a microscope slide to capture microscopic
220 images. The particle size distribution of the E-Spheres was calculated by image analysis. The image
221 pixels were first calibrated to the scale of the image in millimetres and the size distribution of the E-
222 Spheres was then calculated using the Fiji ImageJ software [34].
223
224 The thermal conductivity of the lightweight geopolymer composites was measured using the
225 transient method with a needle probe. Cylindrical samples with a diameter of 50 mm and a height of
226 110 mm were prepared with a hollow core that can accommodate the probe. A heat transfer gel was
227 applied on the probe and the probe was inserted into the hollow core. The temperature was then
228 recorded for 10 minutes under constant heat dissipation over the length of the probe. To obtain the
229 thermal conductivity, the inverse value of thermal resistivity was calculated based on the
230 temperature difference.
231
232 Scanning Electron Microscopy (SEM) was used to analyse the microstructure of the foam; a Philips
233 XL30 (FEG-SEM) instrument was used with a voltage of 20 kV. A fractured surface of each sample was
234 mounted on the SEM stubs using double carbon adhesive film and then carbon coated for preventing
235 the electric charging. In addition, SEM with a backscatter detector, combined with energy dispersion
236 X-ray (EDX) analysis, was also used to determine chemical compositions and composite
237 microstructures. The samples were cut with a diamond saw to a small size (< 10 × 10 × 10 mm) and
238 then embedded in resin inside a 25 mm diameter container. The total height of the samples was cut
239 to less than 11 mm and the surface was polished to a 1 µm diamond finish.
240
241 To understand the interfacial bonding interaction between geopolymers and E-Spheres, and to
242 observe any spatial variations of the chemical bonding at the interface, spatially resolved FTIR
243 microspectroscopic technique that allows an acquisition of chemical mapping measurement at a high
9
244 resolution is the key requirement. For this purpose, a synchrotron IR light source was used. SR-FTIR
245 measurements were performed at the Australian Synchrotron Infrared Microspectroscopy (IRM)
246 Beamline (Victoria, Australia), using a Bruker Vertex 80v spectrometer coupled with a Hyperion 2000
247 FTIR microscope and a liquid nitrogen-cooled narrow-band mercury cadmium telluride (MCT)
248 detector (Bruker Optik GmbH, Ettlingen, Germany).
249
250 An in-house macro ATR-FTIR device equipped with a 250 µm diameter germanium (Ge) ATR crystal
251 was used for collecting the SR-FTIR spectra. Details of this in-house developed ATR-FTIR technique
252 were published elsewhere [35]. The area of interest, which is the interface between E-Spheres and
253 geopolymer binder, was initially observed and captured on the sample surface to create a visible
254 microscopic image prior to commencing the SR-FTIR spectral data acquisition. With this synchrotron
255 ATR-FTIR technique, a background spectrum was collected only once through the air in non-contact
256 mode and used for the entire mapping measurements. When the sample was brought into contact
257 with the Ge ATR crystal, the SR-FTIR data were collected in the range of 3800䳼700 cm-1 over a defined
258 area on the sample at two different step resolutions of 10 µm and 2 µm for low- and high-resolution
259 mapping measurements, respectively. All SR-FTIR spectra were recorded using 4 cmЪ1 spectral
260 resolution. Blackman-Harris 3-Term anodization, Mertz phase correction, and zero-filling factor of 2
261 were set as default acquisition parameters using OPUS 7.2 software suite (Bruker Optik GmbH,
262 Ettlingen, Germany). After that, the collected SR-FTIR map were post-processed using spectral cut
263 and vector-normalisation within the spectral range of 1400-700 cm-1. A Chemical map is subsequently
264 created based on an integrated area under the overlapping bands within the spectral range of 1050-
265 1030 cm -1, using the same OPUS 7.2 software suite (Bruker Optik GmbH, Ettlingen, Germany). The
266 average spectra were extracted from each color group and color-coded according to the areas on the
267 map.
268
269
3. Results and Discussion
270
271
3.1. The characteristics of the binder and filler
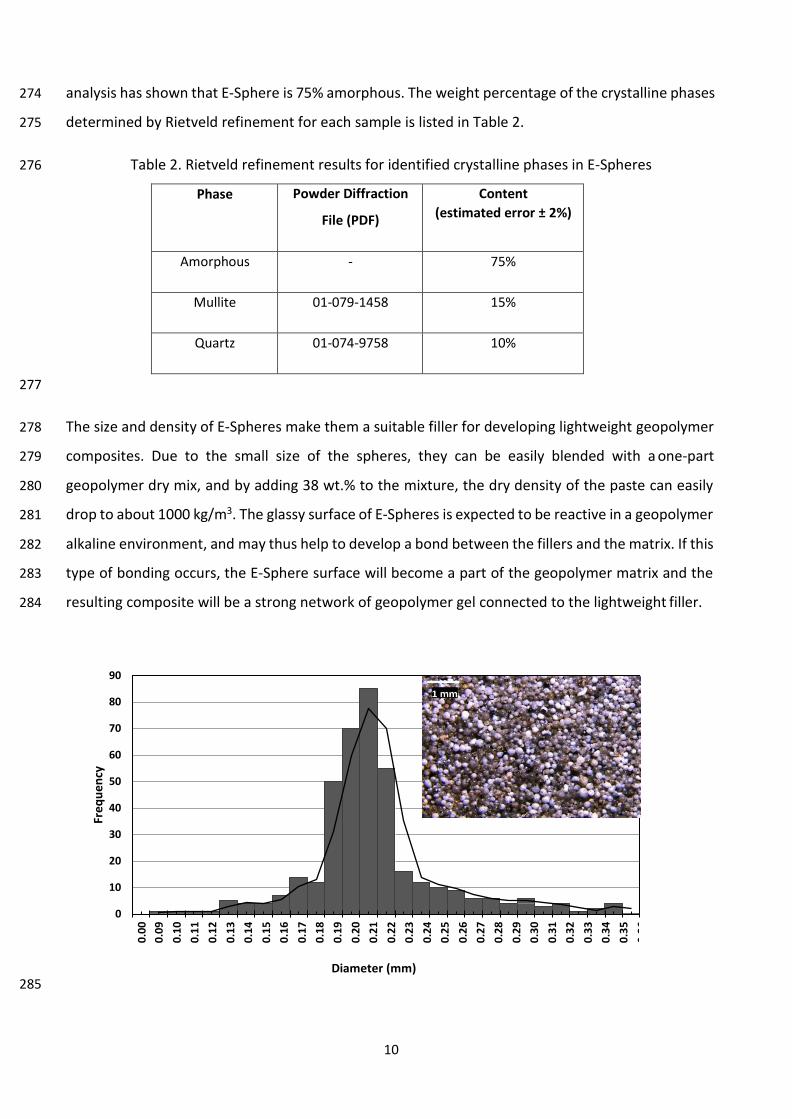
272 Figure 1 shows the microscopic image of E-Sphere and its particle size distribution. The majority of
273 the hollow spheres have diameters between 0.19-0.22 mm. Quantitative X-ray diffraction (XRD)
10
274 analysis has shown that E-Sphere is 75% amorphous. The weight percentage of the crystalline phases
275 determined by Rietveld refinement for each sample is listed in Table 2.
276
277
Table 2. Rietveld refinement results for identified crystalline phases in E-Spheres
Phase Powder Diffraction
File (PDF)
Content
(estimated error ± 2%)
Amorphous - 75%
Mullite 01-079-1458 15%
Quartz 01-074-9758 10%
278 The size and density of E-Spheres make them a suitable filler for developing lightweight geopolymer
279 composites. Due to the small size of the spheres, they can be easily blended with a one-part
280 geopolymer dry mix, and by adding 38 wt.% to the mixture, the dry density of the paste can easily
281 drop to about 1000 kg/m3. The glassy surface of E-Spheres is expected to be reactive in a geopolymer
282 alkaline environment, and may thus help to develop a bond between the fillers and the matrix. If this
283 type of bonding occurs, the E-Sphere surface will become a part of the geopolymer matrix and the
284 resulting composite will be a strong network of geopolymer gel connected to the lightweight filler.
90
80
70
60
50
40
30
20
10
0
Diameter (mm)
285
Fre
qu
en
cy
0.0
0
0.0
9
0.1
0
0.1
1
0.1
2
0.1
3
0.1
4
0.1
5
0.1
6
0.1
7
0.1
8
0.1
9
0.2
0
0.2
1
0.2
2
0.2
3
0.2
4
0.2
5
0.2
6
0.2
7
0.2
8
0.2
9
0.3
0
0.3
1
0.3
2
0.3
3
0.3
4
0.3
5
03
6
11
286 Figure 1. Optical micrograph of E-Spheres, and results of particle-size distribution determination
287 obtained by image analysis.
288
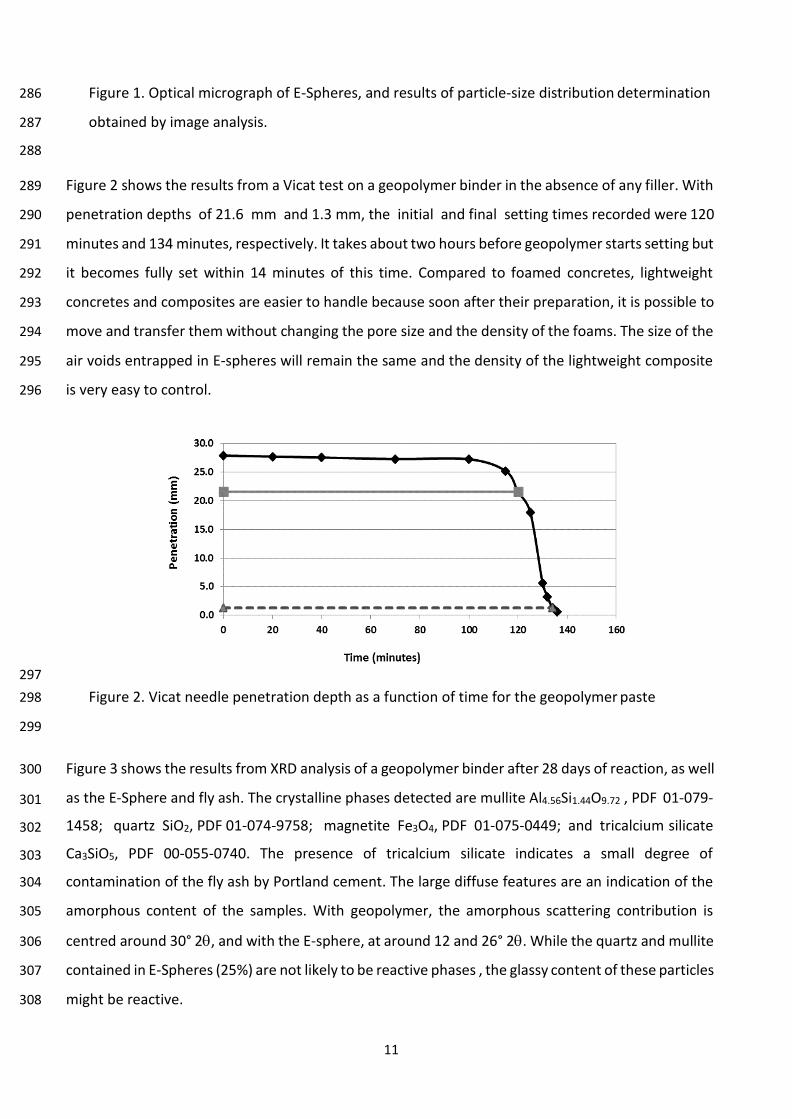
289 Figure 2 shows the results from a Vicat test on a geopolymer binder in the absence of any filler. With
290 penetration depths of 21.6 mm and 1.3 mm, the initial and final setting times recorded were 120
291 minutes and 134 minutes, respectively. It takes about two hours before geopolymer starts setting but
292 it becomes fully set within 14 minutes of this time. Compared to foamed concretes, lightweight
293 concretes and composites are easier to handle because soon after their preparation, it is possible to
294 move and transfer them without changing the pore size and the density of the foams. The size of the
295 air voids entrapped in E-spheres will remain the same and the density of the lightweight composite
296 is very easy to control.
297
298 Figure 2. Vicat needle penetration depth as a function of time for the geopolymer paste
299
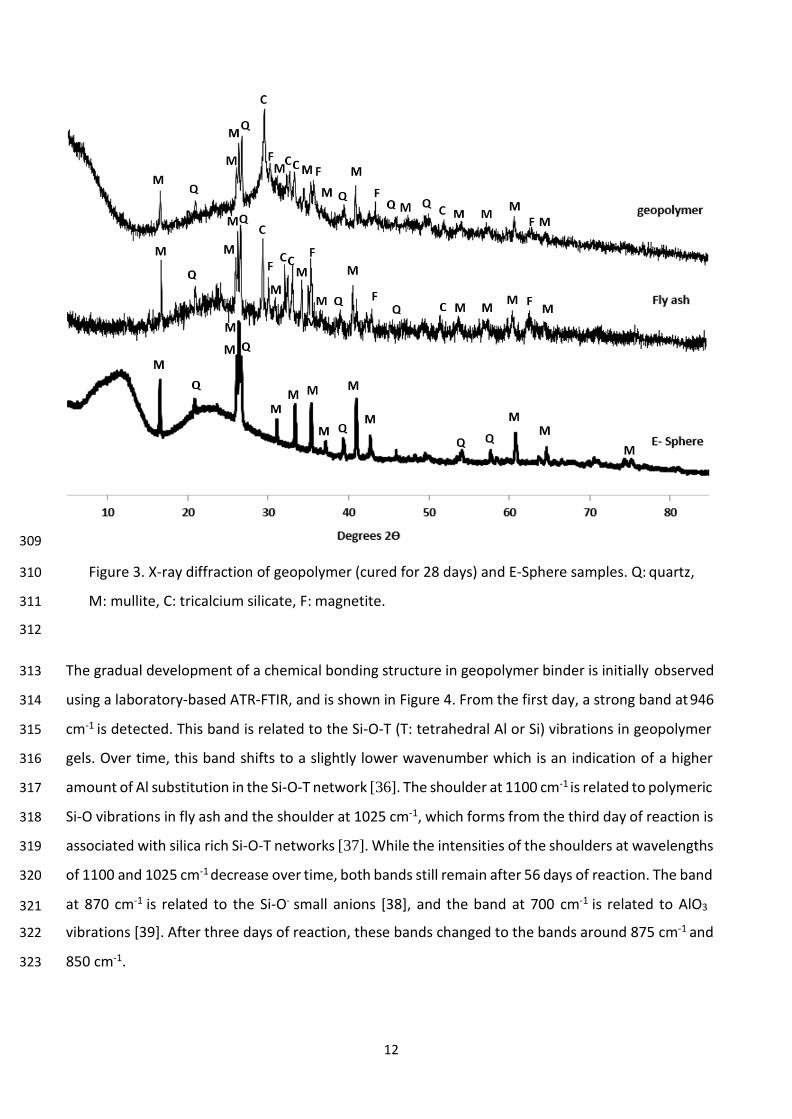
300 Figure 3 shows the results from XRD analysis of a geopolymer binder after 28 days of reaction, as well
301 as the E-Sphere and fly ash. The crystalline phases detected are mullite Al4.56Si1.44O9.72 , PDF 01-079-
302 1458; quartz SiO2, PDF 01-074-9758; magnetite Fe3O4, PDF 01-075-0449; and tricalcium silicate
303 Ca3SiO5, PDF 00-055-0740. The presence of tricalcium silicate indicates a small degree of
304 contamination of the fly ash by Portland cement. The large diffuse features are an indication of the
305 amorphous content of the samples. With geopolymer, the amorphous scattering contribution is
306 centred around 30° 2θ, and with the E-sphere, at around 12 and 26° 2θ. While the quartz and mullite
307 contained in E-Spheres (25%) are not likely to be reactive phases , the glassy content of these particles
308 might be reactive.
12
309
310 Figure 3. X-ray diffraction of geopolymer (cured for 28 days) and E-Sphere samples. Q: quartz,
311 M: mullite, C: tricalcium silicate, F: magnetite.
312
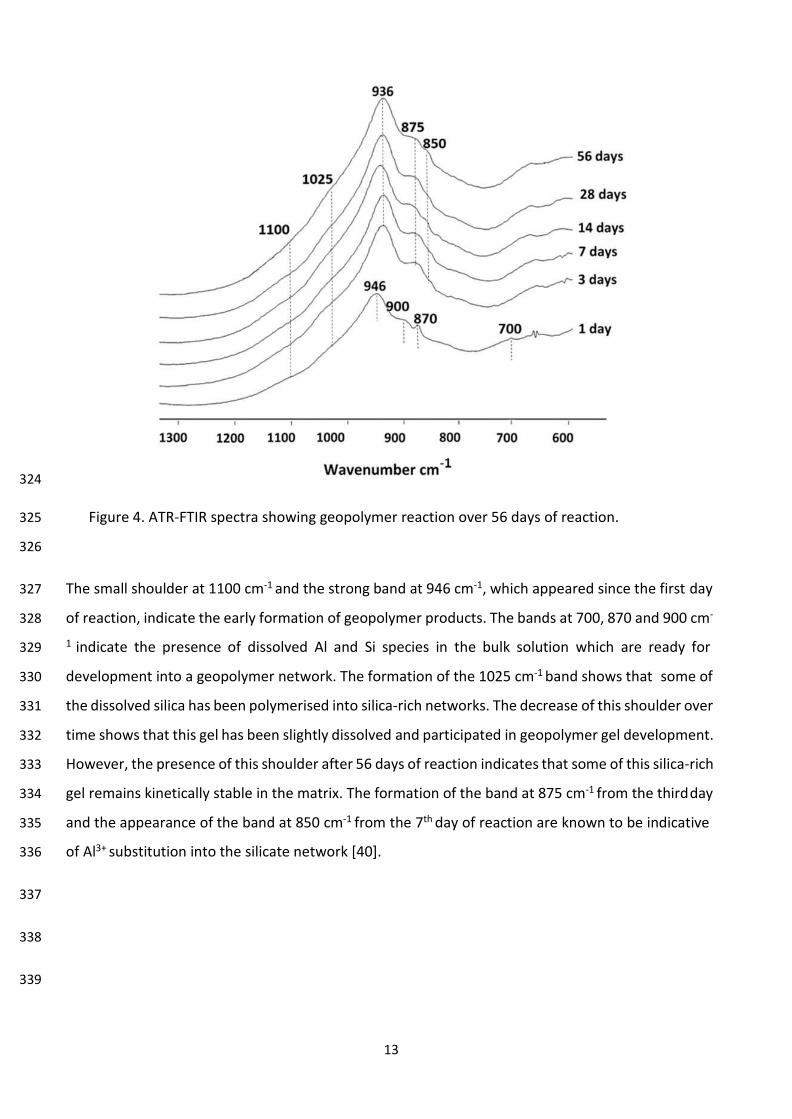
313 The gradual development of a chemical bonding structure in geopolymer binder is initially observed
314 using a laboratory-based ATR-FTIR, and is shown in Figure 4. From the first day, a strong band at 946
315 cm-1 is detected. This band is related to the Si-O-T (T: tetrahedral Al or Si) vibrations in geopolymer
316 gels. Over time, this band shifts to a slightly lower wavenumber which is an indication of a higher
317 amount of Al substitution in the Si-O-T network [36]. The shoulder at 1100 cm-1 is related to polymeric
318 Si-O vibrations in fly ash and the shoulder at 1025 cm-1, which forms from the third day of reaction is
319 associated with silica rich Si-O-T networks [37]. While the intensities of the shoulders at wavelengths
320 of 1100 and 1025 cm-1 decrease over time, both bands still remain after 56 days of reaction. The band
321 at 870 cm-1 is related to the Si-O- small anions [38], and the band at 700 cm-1 is related to AlO3
322 vibrations [39]. After three days of reaction, these bands changed to the bands around 875 cm-1 and
323 850 cm-1.
13
324
325
326
Figure 4. ATR-FTIR spectra showing geopolymer reaction over 56 days of reaction.
327 The small shoulder at 1100 cm-1 and the strong band at 946 cm-1, which appeared since the first day
328 of reaction, indicate the early formation of geopolymer products. The bands at 700, 870 and 900 cm-
329 1 indicate the presence of dissolved Al and Si species in the bulk solution which are ready for
330 development into a geopolymer network. The formation of the 1025 cm-1 band shows that some of
331 the dissolved silica has been polymerised into silica-rich networks. The decrease of this shoulder over
332 time shows that this gel has been slightly dissolved and participated in geopolymer gel development.
333 However, the presence of this shoulder after 56 days of reaction indicates that some of this silica-rich
334 gel remains kinetically stable in the matrix. The formation of the band at 875 cm-1 from the third day
335 and the appearance of the band at 850 cm-1 from the 7th day of reaction are known to be indicative
336 of Al3+ substitution into the silicate network [40].
337
338
339
14
340 3.2. Interfacial chemistry
341
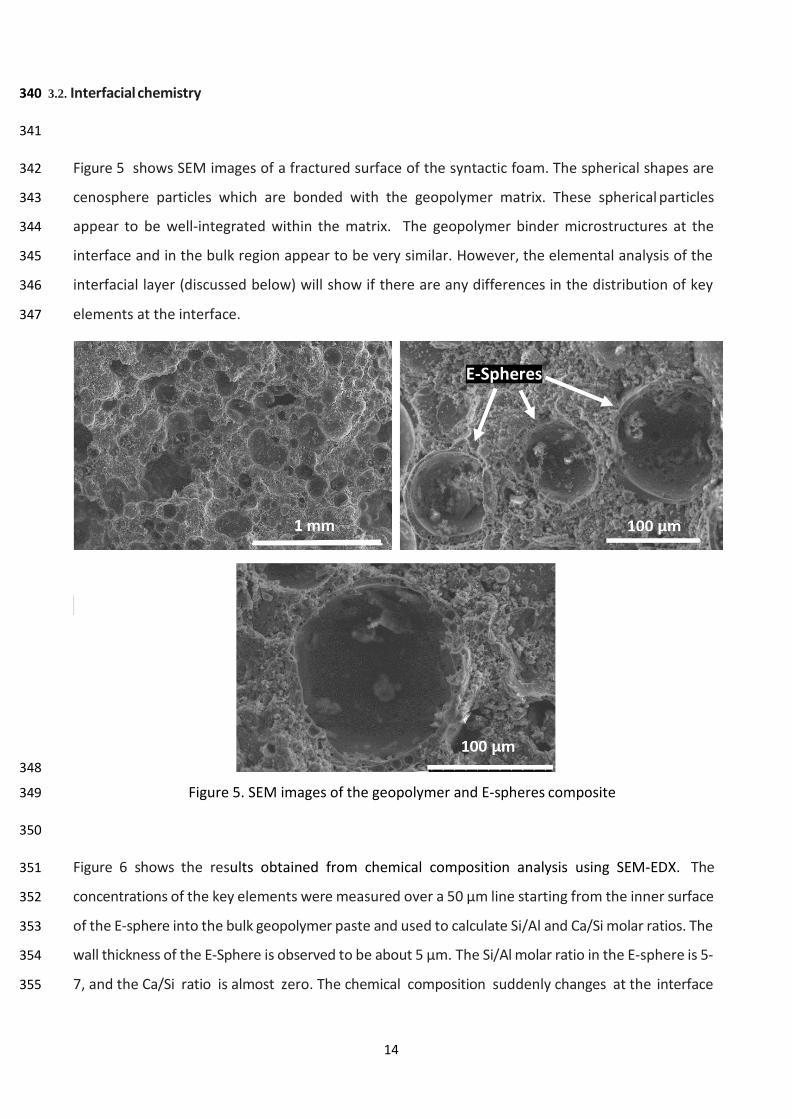
342 Figure 5 shows SEM images of a fractured surface of the syntactic foam. The spherical shapes are
343 cenosphere particles which are bonded with the geopolymer matrix. These spherical particles
344 appear to be well-integrated within the matrix. The geopolymer binder microstructures at the
345 interface and in the bulk region appear to be very similar. However, the elemental analysis of the
346 interfacial layer (discussed below) will show if there are any differences in the distribution of key
347 elements at the interface.
348
349 Figure 5. SEM images of the geopolymer and E-spheres composite
350
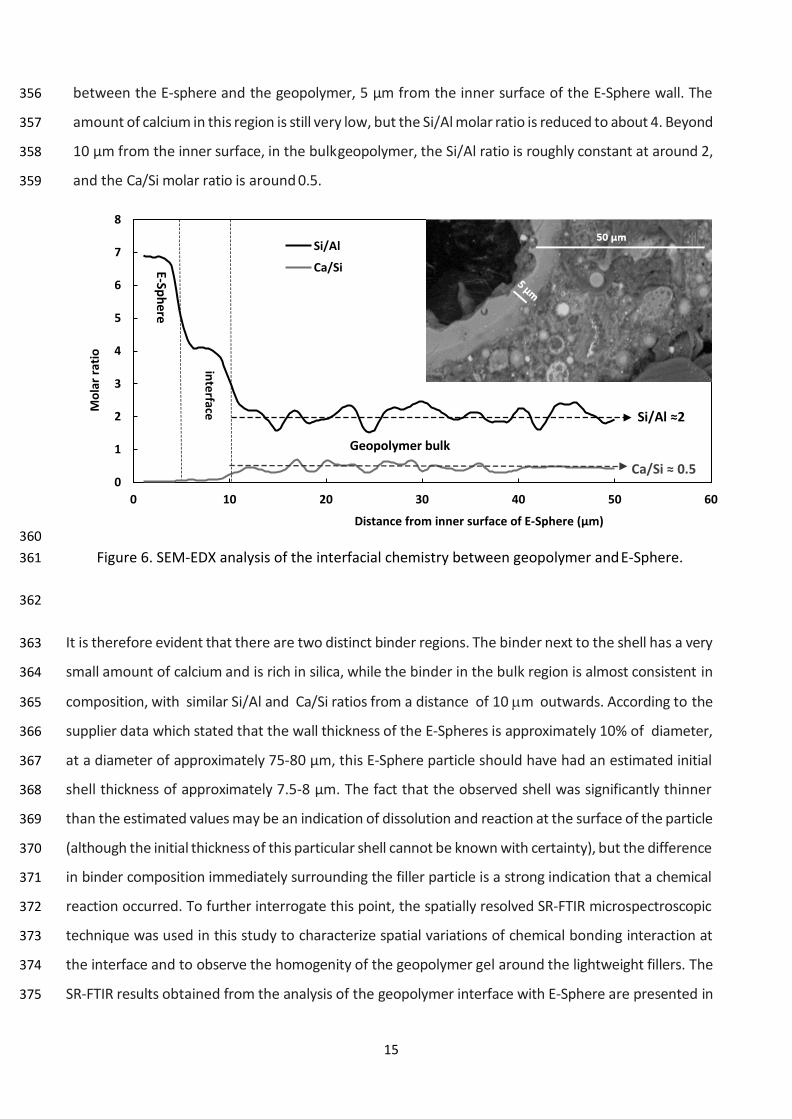
351 Figure 6 shows the results obtained from chemical composition analysis using SEM-EDX. The
352 concentrations of the key elements were measured over a 50 µm line starting from the inner surface
353 of the E-sphere into the bulk geopolymer paste and used to calculate Si/Al and Ca/Si molar ratios. The
354 wall thickness of the E-Sphere is observed to be about 5 µm. The Si/Al molar ratio in the E-sphere is 5-
355 7, and the Ca/Si ratio is almost zero. The chemical composition suddenly changes at the interface
E-Spheres
15
356 between the E-sphere and the geopolymer, 5 µm from the inner surface of the E-Sphere wall. The
357 amount of calcium in this region is still very low, but the Si/Al molar ratio is reduced to about 4. Beyond
358 10 µm from the inner surface, in the bulk geopolymer, the Si/Al ratio is roughly constant at around 2,
359 and the Ca/Si molar ratio is around 0.5.
8
7
6
5
4
3
2
1
0
0 10 20 30 40 50 60
Distance from inner surface of E-Sphere (µm)
360
361 Figure 6. SEM-EDX analysis of the interfacial chemistry between geopolymer and E-Sphere.
362
363 It is therefore evident that there are two distinct binder regions. The binder next to the shell has a very
364 small amount of calcium and is rich in silica, while the binder in the bulk region is almost consistent in
365 composition, with similar Si/Al and Ca/Si ratios from a distance of 10 µm outwards. According to the
366 supplier data which stated that the wall thickness of the E-Spheres is approximately 10% of diameter,
367 at a diameter of approximately 75-80 µm, this E-Sphere particle should have had an estimated initial
368 shell thickness of approximately 7.5-8 µm. The fact that the observed shell was significantly thinner
369 than the estimated values may be an indication of dissolution and reaction at the surface of the particle
370 (although the initial thickness of this particular shell cannot be known with certainty), but the difference
371 in binder composition immediately surrounding the filler particle is a strong indication that a chemical
372 reaction occurred. To further interrogate this point, the spatially resolved SR-FTIR microspectroscopic
373 technique was used in this study to characterize spatial variations of chemical bonding interaction at
374 the interface and to observe the homogenity of the geopolymer gel around the lightweight fillers. The
375 SR-FTIR results obtained from the analysis of the geopolymer interface with E-Sphere are presented in
Si/Al
Ca/Si
SキっAノ Яヲ
Geopolymer bulk
C;っSキ Я ヰくヵ
inte
rface
E-S
ph
ere
Mo
lar
rati
o
16
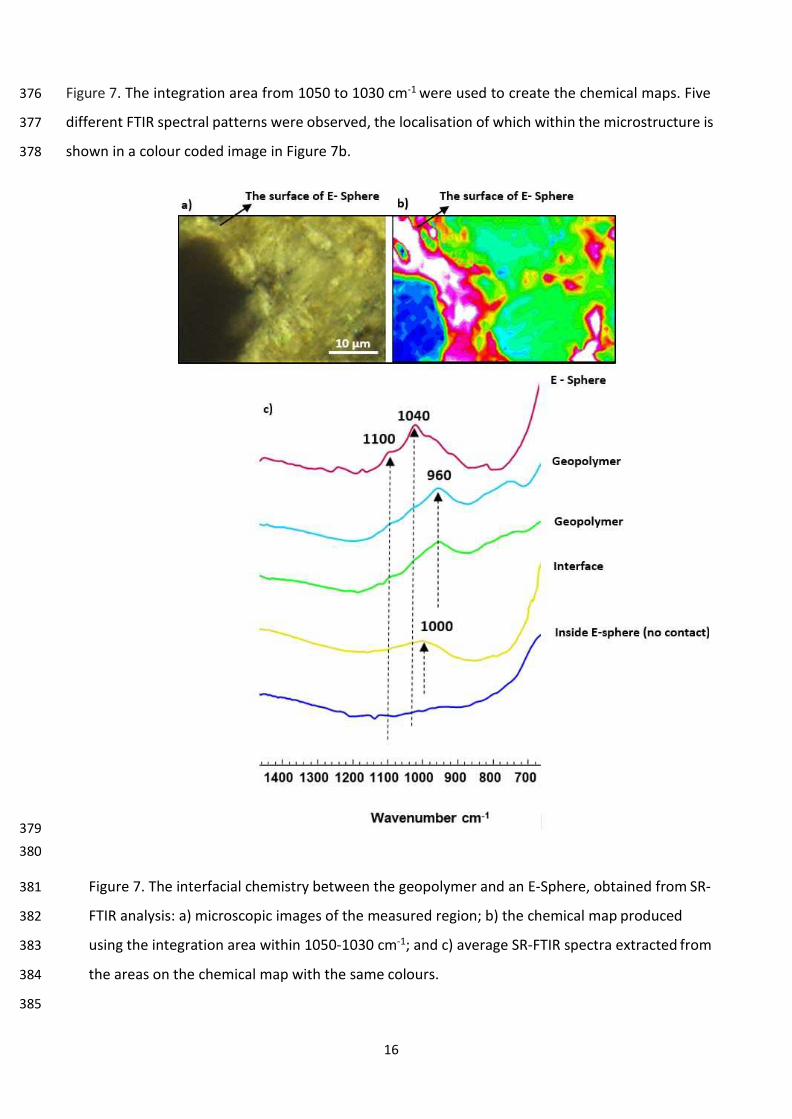
376 Figure 7. The integration area from 1050 to 1030 cm-1 were used to create the chemical maps. Five
377 different FTIR spectral patterns were observed, the localisation of which within the microstructure is
378 shown in a colour coded image in Figure 7b.
379
380
381 Figure 7. The interfacial chemistry between the geopolymer and an E-Sphere, obtained from SR-
382 FTIR analysis: a) microscopic images of the measured region; b) the chemical map produced
383 using the integration area within 1050-1030 cm-1; and c) average SR-FTIR spectra extracted from
384 the areas on the chemical map with the same colours.
385
17
386 The dark blue area in Figure 7b indicates a lack of contact with the ATR crystal, because this area is
387 associated with the air voids inside an E-Sphere. The circular region surrounding this area, which is
388 related to the shell of the E-Sphere, shows a very high intensity of the band at 1040 cm-1 and the
389 shoulder at 1100 cm-1. The band at 1100 cm-1 is related to the asymmetric stretching of the Si-O-Si
390 bonds in the aluminosilicate E-Sphere, and the band at 1040 cm-1 is related to the asymmetric stretch
391 of the Si-O-Si bond with an increased bond length and angle [37] . An increase in the length and angle
392 of this bond occurs when the amount of network modifiers increases in the neighbouring Si-O-Si
393 bonds [37]. This area is surrounded by a thin interfacial layer shown in yellow, which has a broad band
394 around 1000 cm-1. The majority of the gel around the E-Sphere has a distinct band at 960 cm-1.
395
396 The chemical bonding structure in the bulk region is related to a typical geopolymer network with the
397 main Si-O-T band around 960 cm-1. This wavenumber shows a well-developed geopolymer gel
398 structure with Al substitution in the silica network. At the interface, the presence of the band at 1000
399 cm-1 indicates that the gel here is richer in silica [37] , which is in a good agreement with the chemical
400 composition results obtained from SEM-EDX, Figure 5. However, the thickness of this region and its
401 overlap with nearby green and light blue regions suggest that the silica-rich region is relatively well
402 integrated, in a chemical perspective, with the geopolymer matrix. While the inner side of the E-
403 Sphere is indicated by a clear circular line, its outer layer is noticeably perturbed in its contact with
404 geopolymer. This may be attributed to the uneven, potentially porous surface of the chemically-
405 attacked E-Sphere that allows the geopolymer gel to penetrate into the surface, which consequently
406 makes its interface appear disordered in the chemical map (Figure 7b). As the glassy content of E-
407 Spheres reacted in the alkali environment over time, the surface dissolved and participated in the
408 formation and development of a geopolymer gel of composition distinct from the bulk, at the
409 interface. This reaction can evolve the E-Sphere filler to become a part of the hardening matrix and
410 assist with the strength development of the composite. However, the wall thickness of the spheres is
411 sufficiently high, and their dissolution sufficiently slow, that they are not punctured or perforated
412 during the geopolymerisation process, and so are still able to act effectively to reduce the density of
413 the composite foam.
414
415
416
3.3. Strength development and thermal performance
18
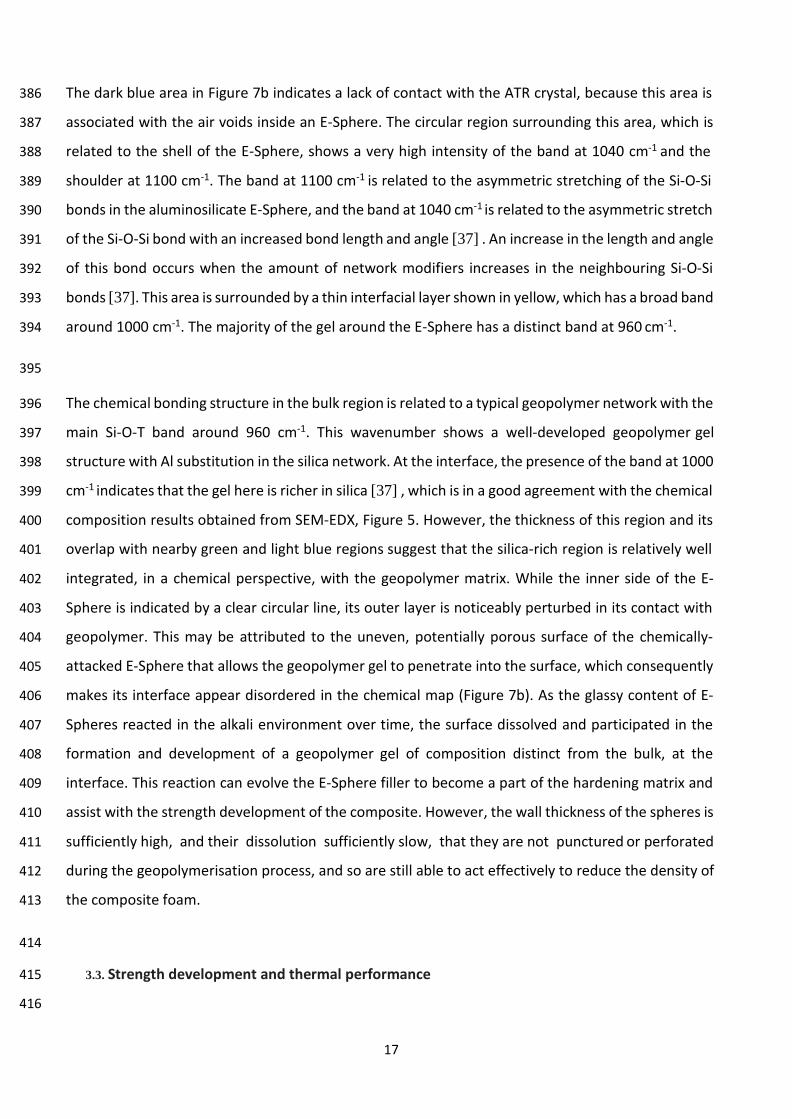
417 Figure 8 shows the results obtained from compressive strength testing of the lightweight geopolymer
418 composites as a function of time. The strength of the composite foam was 9 MPa at only 7 days of
419 reaction, as the GBFS in the precursor blend provides good early strength to geopolymer materials.
420 After two weeks, not much further strength development was recorded, but at 28 days, the strength of
421 the composites increased, and dry density reduced to slightly below 1000 kg/m3. When the samples
422 were tested again after 56 days of reaction, with an average density of 978 kg/m3, an average strength
423 of 17.5 MPa was achieved. For materials of such low density, this strength improvement is
424 remarkable, and is attributed to the fact that the surface of E-Spheres has participated in the reaction,
425 along with the continued alkali-activation of the fly ash in the blended precursor at the later age.
426
427 Figure 8. Compressive strength development in geopolymer composites over time
428
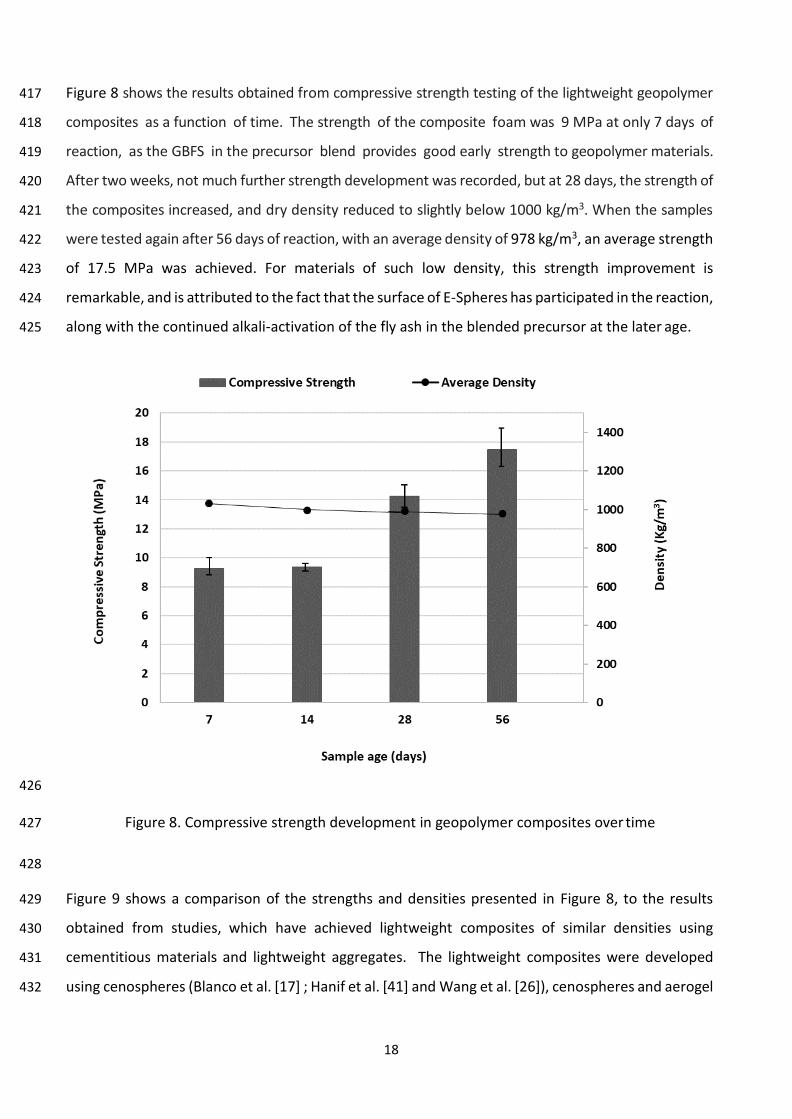
429 Figure 9 shows a comparison of the strengths and densities presented in Figure 8, to the results
430 obtained from studies, which have achieved lightweight composites of similar densities using
431 cementitious materials and lightweight aggregates. The lightweight composites were developed
432 using cenospheres (Blanco et al. [17] ; Hanif et al. [41] and Wang et al. [26]), cenospheres and aerogel
19
433 (Hanif et al. [23] and W;ミェ Wデ ;ノく ぷヲヶへぶが ;WヴラェWノ ふG;ラ Wデ ;ノく ぷヲヰへぶが Sキ;デラマキデW ぷTラヮ屯┌ Wデ ;ノく ぷヲヱへ and Ünal
434 et al. [42]], foam and aerated concretes (Awang et al. [43], Sanjayan et al. [44], and Hussin et al. [45]),
435 foam and aggregate (Jones et al. [46]), Sidorajo mud (Ekaputri et al. [47]), glass microspheres
436 (Shahidan et al. [48] and Shao et al. [28] ), expanded perlite (Sengual et al. [49]) and porous siliceous
437 materials (Pimraksa et al. [50]).
438 439 This graph shows that the strength improvement in this study (which used environmentally-friendly
440 processes) is well above those obtained from the aforementioned studies. The studies in Figure 9 that
441 are displayed by triangle markers have been explained in detail in the Introduction section of this
442 paper. These have used manufacturing processes which negatively impact the commercial viability
443 and sustainability of the composites, such as high temperature, ultra-fine source materials, or
444 prolonged high humidity curing followed by oven drying. The high strength/density ratio composites
445 made in this study are made from one-part geopolymers and the samples are cured in an ambient
446 environment. The simple sample preparation procedures are desirable for bulk production and
447 commercial applications of lightweight composites.
40
Blanco, et al.
Gao, et al.
35 Tラヮ屯┌が Wデ al.
Sengual, et al.
30 Awang, et al.
Jones, et al.
25 Pimraksa, et al.
Ekaputri, et al.
Sanjayan, et al. 20
Hussin, et al.
Hanif, et al. (2017)
15 Shahidan, et al.
This study
10 Hanif, et al. (2016)
Wang, et al. (2014)
5 Wang, et al. (2011)
Shao, et al.
448
0
700 800 900 1000 1100
Density (kg/m3)
Co
mp
ress
ive
Str
en
gth
(M
Pa
)
20
449
450
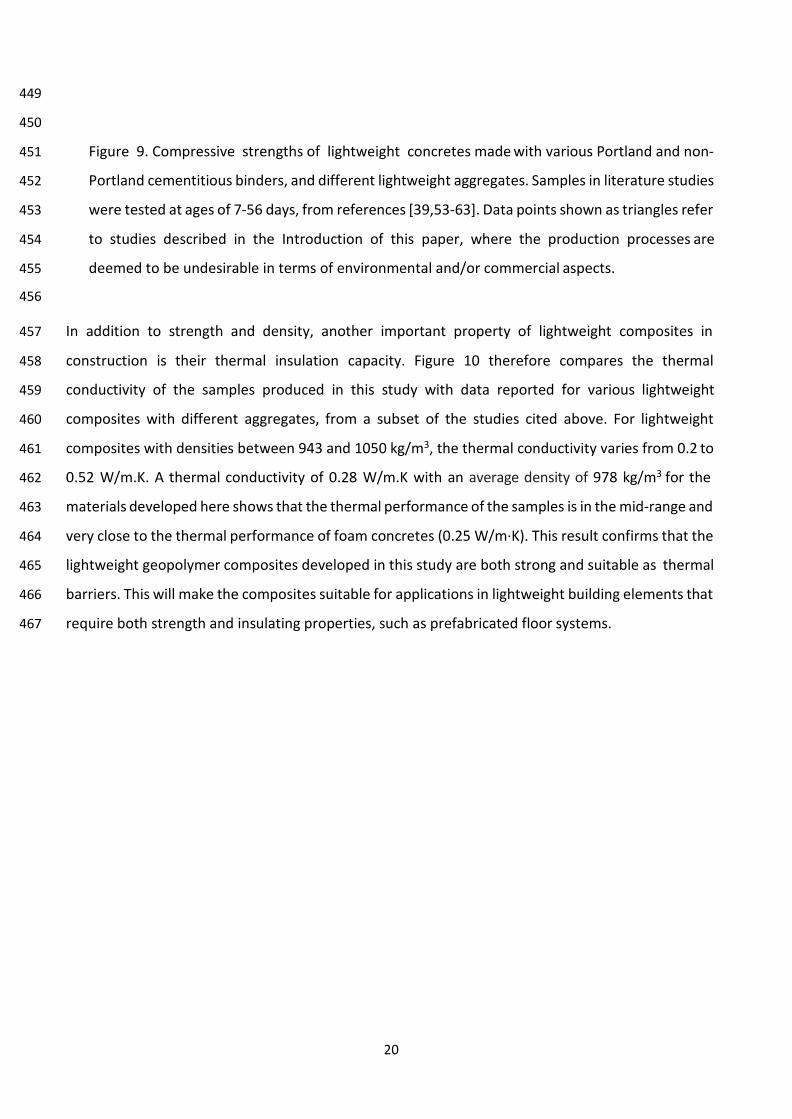
451 Figure 9. Compressive strengths of lightweight concretes made with various Portland and non-
452 Portland cementitious binders, and different lightweight aggregates. Samples in literature studies
453 were tested at ages of 7-56 days, from references [39,53-63]. Data points shown as triangles refer
454 to studies described in the Introduction of this paper, where the production processes are
455 deemed to be undesirable in terms of environmental and/or commercial aspects.
456
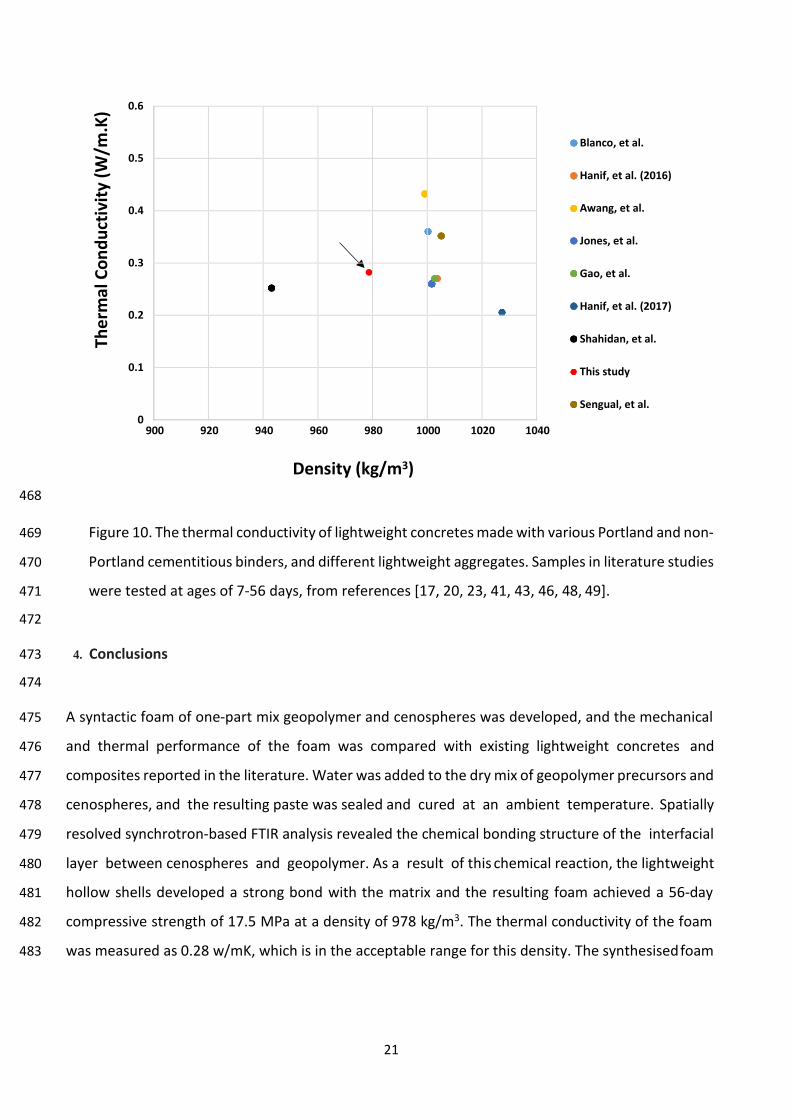
457 In addition to strength and density, another important property of lightweight composites in
458 construction is their thermal insulation capacity. Figure 10 therefore compares the thermal
459 conductivity of the samples produced in this study with data reported for various lightweight
460 composites with different aggregates, from a subset of the studies cited above. For lightweight
461 composites with densities between 943 and 1050 kg/m3, the thermal conductivity varies from 0.2 to
462 0.52 W/m.K. A thermal conductivity of 0.28 W/m.K with an average density of 978 kg/m3 for the
463 materials developed here shows that the thermal performance of the samples is in the mid-range and
464 very close to the thermal performance of foam concretes (0.25 W/m·K). This result confirms that the
465 lightweight geopolymer composites developed in this study are both strong and suitable as thermal
466 barriers. This will make the composites suitable for applications in lightweight building elements that
467 require both strength and insulating properties, such as prefabricated floor systems.
21
0.6
0.5
0.4
0.3
0.2
0.1
0
900 920 940 960 980 1000 1020 1040
Blanco, et al.
Hanif, et al. (2016)
Awang, et al.
Jones, et al.
Gao, et al.
Hanif, et al. (2017)
Shahidan, et al.
This study
Sengual, et al.
Density (kg/m3)
468
469 Figure 10. The thermal conductivity of lightweight concretes made with various Portland and non-
470 Portland cementitious binders, and different lightweight aggregates. Samples in literature studies
471 were tested at ages of 7-56 days, from references [17, 20, 23, 41, 43, 46, 48, 49].
472
473
474
4. Conclusions
475 A syntactic foam of one-part mix geopolymer and cenospheres was developed, and the mechanical
476 and thermal performance of the foam was compared with existing lightweight concretes and
477 composites reported in the literature. Water was added to the dry mix of geopolymer precursors and
478 cenospheres, and the resulting paste was sealed and cured at an ambient temperature. Spatially
479 resolved synchrotron-based FTIR analysis revealed the chemical bonding structure of the interfacial
480 layer between cenospheres and geopolymer. As a result of this chemical reaction, the lightweight
481 hollow shells developed a strong bond with the matrix and the resulting foam achieved a 56-day
482 compressive strength of 17.5 MPa at a density of 978 kg/m3. The thermal conductivity of the foam
483 was measured as 0.28 w/mK, which is in the acceptable range for this density. The synthesised foam
Th
erm
al
Co
nd
uct
ivit
y (
W/m
.K)
22
484 has desirable strength and insulation properties for lightweight structural applications in energy
485 efficient buildings.
486
487 Acknowledgements
488 This work was funded by the ARC Training Centre for Advanced Manufacturing of Prefabricated
489 Housing [Grant ID: IC150100023], and in part by Australian Research Council (ARC) Linkage Grant
490 [Grant ID: LP140100504]. The authors would like to acknowledge Melbourne School of Engineering
491 for the �International Research Fellowship for Female Academics� that facilitated Dr
492 Hajimohammadi�s research visit to the University of Sheffield. This work was performed at the
493 Materials Characterisation and Fabrication Platform (MCFP) at the University of Melbourne and the
494 Victorian Node of the Australian National Fabrication Facility (ANFF) and in part on the Infrared
495 Microspectroscopy (IRM) beamline at the Australian Synchrotron, part of ANSTO.
496
497 References
498
499 [1] Kashani A, Ngo TD, Hajimohammadi A. Effect of recycled glass fines on mechanical and durability properties
500 of concrete foam in comparison with traditional cementitious fines. Cement and Concrete Composites.
501 2019;99:120-9.
502 [2] Colangelo F, Cioffi R, Liguori B, Iucolano F. Recycled polyolefins waste as aggregates for lightweight
503 concrete. Composites Part B: Engineering. 2016;106:234-41. 504 [3] Ramamurthy K, Kunhanandan Nambiar EK, Indu Siva Ranjani G. A classification of studies on properties of
505 foam concrete. Cement and Concrete Composites. 2009;31(6):388-96.
506 [4] Zhang Z, Provis JL, Reid A, Wang H. Mechanical, thermal insulation, thermal resistance and acoustic
507 absorption properties of geopolymer foam concrete. Cement and Concrete Composites. 2015;62:97-105.
508 [5] Hajimohammadi A, Ngo T, Kashani A. Sustainable one-part geopolymer foams with glass fines versus sand
509 as aggregates. Construction and Building Materials. 2018;171:223-31. 510 [6] Zhou Y, Zheng Y, Sui L, Xing F, Hu J, Li P. Behavior and modeling of FRP-confined ultra-lightweight cement 511 composites under monotonic axial compression. Composites Part B: Engineering. 2019;162:289-302.
512 [7] Kashani A, Ngo TD, Mendis P, Black JR, Hajimohammadi A. A sustainable application of recycled tyre crumbs
513 as insulator in lightweight cellular concrete. Journal of cleaner production. 2017;149:925-35.
514 [8] Hajimohammadi A, Ngo T, Mendis P. Enhancing the strength of pre-made foams for foam concrete
515 applications. Cement and Concrete Composites. 2018;87:164-71.
516 [9] Narayanan N, Ramamurthy K. Structure and properties of aerated concrete: a review. Cement and Concrete 517 Composites. 2000;22(5):321-9.
518 [10] Samsudin S, Mohamad N. Structural Behaviour of Precast Lightweight Foamed Concrete Sandwich Panel 519 under Axial Load: An Overview. International Journal of Integrated Engineering. 2013;4(4):47-52. 520 [11] Provis JL, Palomo A, Shi C. Advances in understanding alkali-activated materials. Cement and Concrete
521 Research. 2015;78:110-25.
23
522 [12] Bagheri A, Nazari A, Hajimohammadi A, Sanjayan JG, Rajeev P, Nikzad M, et al. Microstructural study of 523 environmentally friendly boroaluminosilicate geopolymers. Journal of Cleaner Production. 2018;189:805-12. 524 [13] Gholampour A, Ho VD, Ozbakkaloglu T. Ambient-cured geopolymer mortars prepared with waste-based 525 sands: Mechanical and durability-related properties and microstructure. Composites Part B: Engineering.
526 2019;160:519-34.
527 [14] Luukkonen T, Abdollahnejad Z, Yliniemi J, Kinnunen P, Illikainen M. One-part alkali-activated materials: A
528 review. Cement and Concrete Research. 2018;103:21-34.
529 [15] Ranjbar N, Kuenzel C. Cenospheres: A review. Fuel. 2017;207:1-12.
530 [16] Fan Z, Miao Y, Wang Z, Zhang B, Ma H. Effect of the cenospheres size and internally lateral constraints on 531 dynamic compressive behavior of fly ash cenospheres polyurethane syntactic foams. Composites Part B:
532 Engineering. 2019;171:329-38.
533 [17] Blanco F, G;ヴIタ; P, Mateos P, Ayala J. Characteristics and properties of lightweight concrete manufactured 534 with cenospheres. Cement and Concrete Research. 2000;30(11):1715-22.
535 [18] Huang X, Ranade R, Zhang Q, Ni W, Li V. Mechanical and thermal properties of green lightweight
536 engineered cementitious composites. Construction and Building Materials. 2013;48:954-60.
537 [19] Nematollahi B, Ranade R, Sanjayan J, Ramakrishnan S. Thermal and mechanical properties of sustainable
538 lightweight strain hardening geopolymer composites. Archives of Civil and Mechanical Engineering.
539 2017;17(1):55-64.
540 [20] Gao T, Jelle BP, Gustavsen A, Jacobsen S. Aerogel-incorporated concrete: An experimental study. 541 Construction and Building Materials. 2014;52:130-6.
542 [21] Topçu İBが U┞ェ┌ミラャノ┌ T. Properties of autoclaved lightweight aggregate concrete. Building and
543 Environment. 2007;42(12):4108-16. 544 [22] Ng S, Sandberg LIC, Jelle BP. Insulating and strength properties of an aerogel-incorporated mortar based
545 an UHPC formulations. Key Engineering Materials: Trans Tech Publ; 2015. p. 43-8.
546 [23] Hanif A, Diao S, Lu Z, Fan T, Li Z. Green lightweight cementitious composite incorporating aerogels and fly 547 ash cenospheres�Mechanical and thermal insulating properties. Construction and Building Materials.
548 2016;116:422-30.
549 [24] Senthamarai Kannan K, Andal L, Shanmugasundaram M. An investigation on strength development of
550 cement with cenosphere and silica fume as pozzolanic replacement. Advances in Materials Science
551 Engineering. 2016;2016.
552 [25] Liu X, Zhang M-H, Chia KS, Yan J, Liew JR. Mechanical properties of ultra-lightweight cement composite at 553 ノラ┘ デWマヮWヴ;デ┌ヴWゲ ラa ヰ デラЪ ヶヰェ Cく CWマWミデ ;ミS CラミIヴWデW CラマヮラゲキデWゲく 2016;73:289-98.
554 [26] Wang J-Y, Yang Y, Liew J-YR, Zhang M-H. Method to determine mixture proportions of workable ultra 555 lightweight cement composites to achieve target unit weights. Cement and Concrete Composites.
556 2014;53:178-86.
557 [27] Wang M-R, Jia D-C, He P-G, Zhou Y. Microstructural and mechanical characterization of fly ash
558 cenosphere/metakaolin-based geopolymeric composites. Ceramics International. 2011;37(5):1661-6.
559 [28] Shao N-N, Liu Z, Xu Y-Y, Kong F-L, Wang D-M. Fabrication of hollow microspheres filled fly ash geopolymer 560 composites with excellent strength and low density. Materials Letters. 2015;161:451-4.
561 [29] Wu Y, Wang J-Y, Monteiro PJ, Zhang M-H. Development of ultra-lightweight cement composites with low 562 thermal conductivity and high specific strength for energy efficient buildings. Construction and Building
563 Materials. 2015;87:100-12.
564 [30] Lei D-Y, Guo L-P, Chen B, Curosu I, Mechtcherine V. The connection between microscopic and macroscopic 565 properties of ultra-high strength and ultra-high ductility cementitious composites (UHS-UHDCC). Composites
566 Part B: Engineering. 2019;164:144-57.
567 [31] Hajimohammadi A, Ngo T, Kashani A. Glass waste versus sand as aggregates: the characteristics of the
568 evolving geopolymer binders. Journal of cleaner production. 2018;193:593-603.
569 [32] Li R, Wu G, Jiang L, Sun D. Interface microstructure and compressive behavior of fly ash/phosphate
570 geopolymer hollow sphere structures. Materials Design. 2015;65:585-90.
571 [33] Hajimohammadi A, Provis JL, Van Deventer JS. Time-resolved and spatially-resolved infrared spectroscopic 572 observation of seeded nucleation controlling geopolymer gel formation. Journal of colloid interface science.
573 2011;357(2):384-92.
24
574 [34] Schindelin J, Arganda-Carreras I, Frise E, Kaynig V, Longair M, Pietzsch T, et al. Fiji: an open-source platform 575 for biological-image analysis. Nature Methods. 2012;9:676-82. 576 [35] Vongsvivut J, Pérez-Guaita D, Wood BR, Heraud P, Khambatta K, Hartnell D, et al. Synchrotron macro ATR- 577 FTIR microspectroscopy for high-resolution chemical mapping of single cells. Analyst. 2019;144:3226-38.
578 [36] Hajimohammadi A, van Deventer JSJ. Solid Reactant-Based Geopolymers from Rice Hull Ash and Sodium
579 Aluminate. Waste and Biomass Valorization. 2017;8(6):2131-40.
580 [37] Rees CA, Provis JL, Lukey GC, van Deventer JSJ. Attenuated total reflectance fourier transform infrared
581 analysis of fly ash geopolymer gel aging. Langmuir. 2007;23:8170-9.
582 [38] Bass JL, Turner GL. Anion Distributions in Sodium Silicate Solutions. Characterization by 29SI NMR and 583 Infrared Spectroscopies, and Vapor Phase Osmometry. The Journal of Physical Chemistry B.
584 1997;101(50):10638-44.
585 [39] Moolenaar RJ, Evans JC, McKeever LD. Structure of the aluminate ion in solutions at high pH. The Journal
586 of Physical Chemistry. 1970;74(20):3629-36.
587 [40] Sデ┌HキL;ミ V, Rustum R. Isomorphous substitution and infra-red spectra of the layer lattice silicates*.
588 American Mineralogist. 1961;46(1-2):32-51.
589 [41] Hanif A, Lu Z, Li Z. Utilization of fly ash cenosphere as lightweight filler in cement-based composites � A 590 review. Construction and Building Materials. 2017;144:373-84.
591 [42] Ünal O, U┞ェ┌ミラャノ┌ T, Yildiz A. Investigation of properties of low-strength lightweight concrete for thermal
592 insulation. Building and Environment. 2007;42(2):584-90.
593 [43] Awang H, Mydin MAO, Roslan AF. Effect of additives on mechanical and thermal properties of lightweight
594 foamed concrete. Advances in applied science research. 2012;3(5):3326-38.
595 [44] Sanjayan JG, Nazari A, Chen L, Nguyen GH. Physical and mechanical properties of lightweight aerated 596 geopolymer. Construction and Building Materials. 2015;79:236-44.
597 [45] Hussin MW, Muthusamy K, Zakaria F. Effect of mixing constituent toward engineering properties of POFA
598 cement-based aerated concrete. Journal of Materials in Civil Engineering. 2010;22(4):287-95.
599 [46] Jones R, Zheng L, Yerramala A, Rao KS. Use of recycled and secondary aggregates in foamed concretes.
600 Magazine of concrete research. 2012;64(6):513-25.
601 [47] Ekaputri JJ, Junaedi S, Aji R. Light weight geopolymer paste made with Sidoarjo Mud (Lusi). Materials
602 Science Forum: Trans Tech Publ; 2015. p. 63-74.
603 [48] Shahidan S, Aminuddin E, Mohd Noor K, Ramzi Hannan Nurul Izzati R, Saiful Bahari Nur A. Potential of 604 Hollow Glass Microsphere as Cement Replacement for Lightweight Foam Concrete on Thermal Insulation
605 Performance. MATEC Web of Conferences. 2017;103:01014.
606 [49] Sengul O, Azizi S, Karaosmanoglu F, Tasdemir MA. Effect of expanded perlite on the mechanical properties
607 and thermal conductivity of lightweight concrete. Energy and Buildings. 2011;43(2-3):671-6.
608 [50] Pimraksa K, Chindaprasirt P, Rungchet A, Sagoe-Crentsil K, Sato T. Lightweight geopolymer made of highly 609 porous siliceous materials with various Na2O/Al2O3 and SiO2/Al2O3 ratios. Materials Science and Engineering:
610 A. 2011;528(21):6616-23.
611
Recommended


![Thermoplastic Syntactic Foam - CMT Materialscmtmaterials.com/wp-content/uploads/2018/08/Hytac... · 10,215 psi [70.4 Mpa] 350°F [176°C] 23.7 Psi [163.4 kPa] THERMOPLASTIC Material](https://img.pdfslide.us/doc/110x75/60170c8d915d91472d1ea28b/thermoplastic-syntactic-foam-cmt-m-10215-psi-704-mpa-350f-176c-237.jpg)