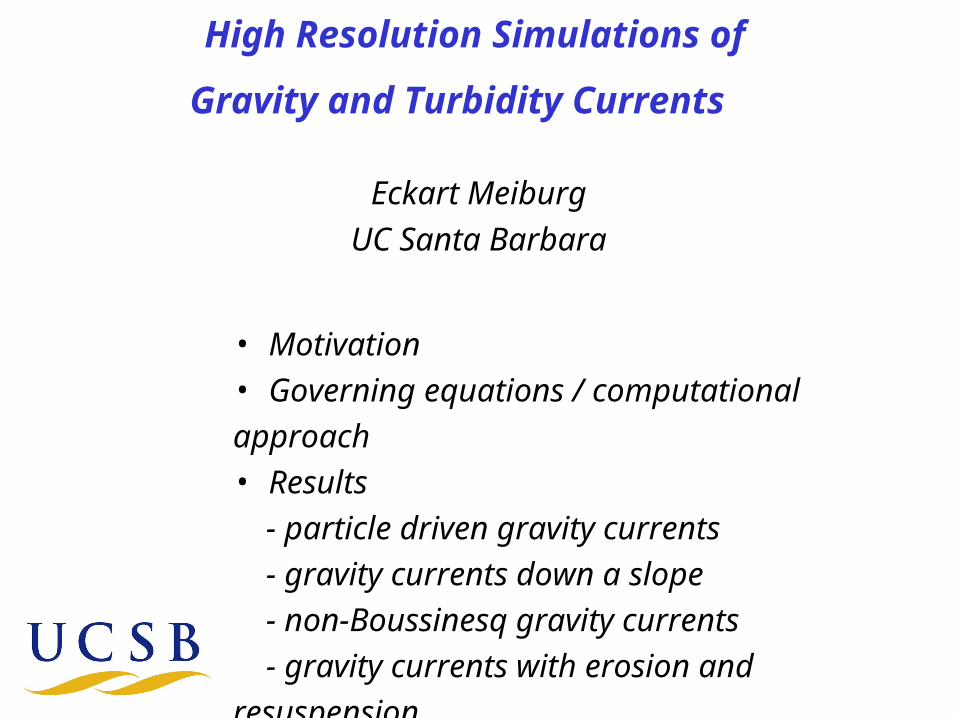
High Resolution Simulations of
Gravity and Turbidity Currents
Eckart Meiburg
UC Santa Barbara
• Motivation• Governing equations / computational approach• Results
- particle driven gravity currents
- gravity currents down a slope
- non-Boussinesq gravity currents
- gravity currents with erosion and resuspension• Summary and outlook
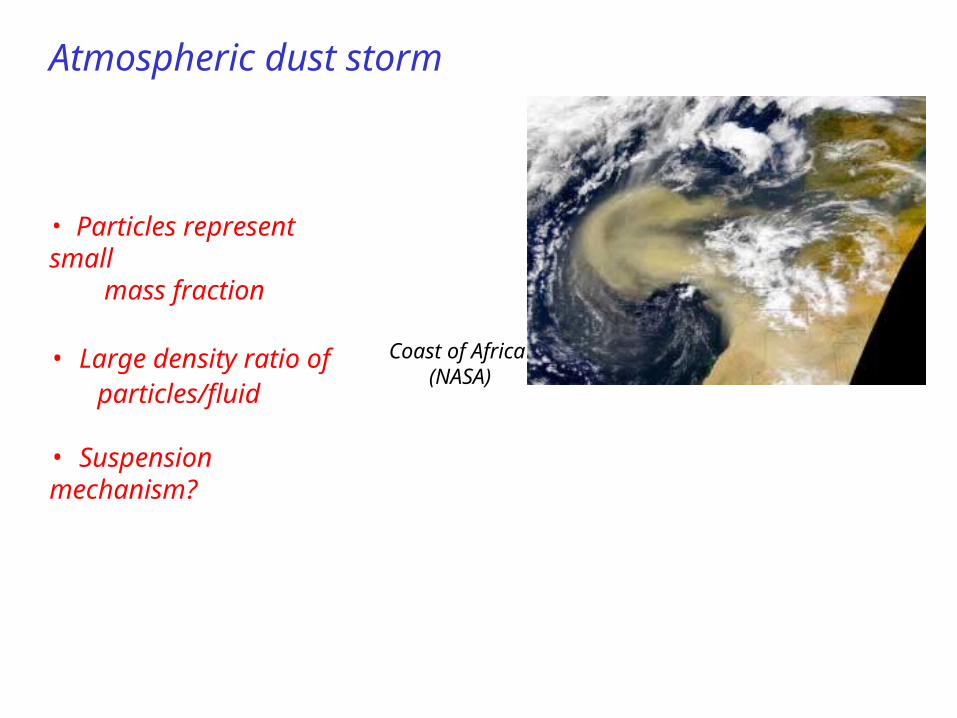
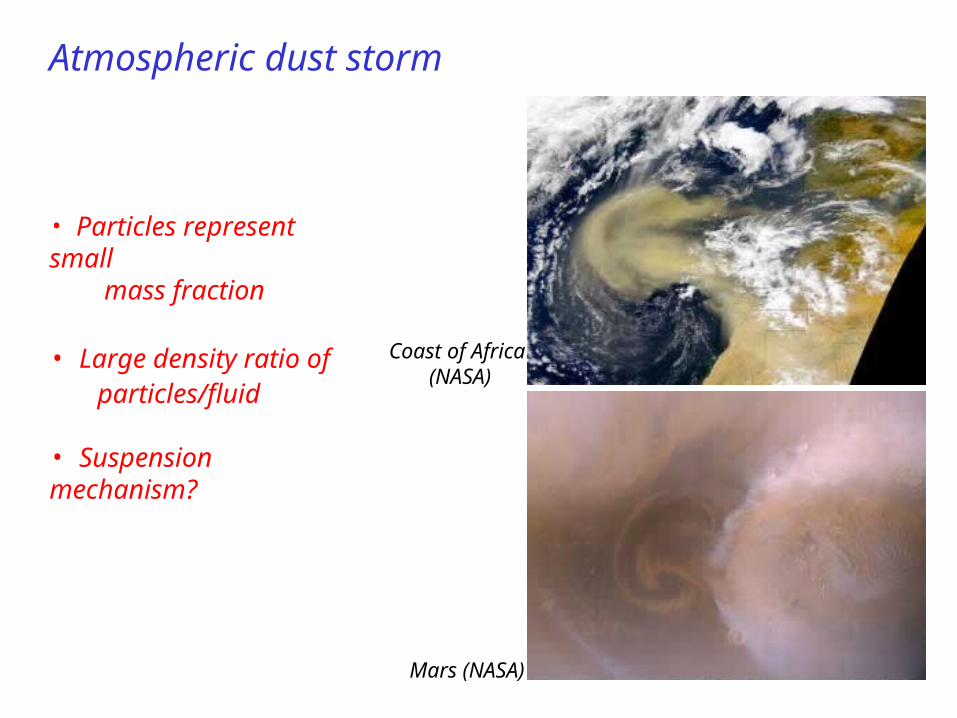
Atmospheric dust storm
• Particles represent small mass fraction
• Large density ratio of particles/fluid
• Suspension mechanism?
Coast of Africa (NASA)
Atmospheric dust storm
Mars (NASA)
• Particles represent small mass fraction
• Large density ratio of particles/fluid
• Suspension mechanism?
Coast of Africa (NASA)
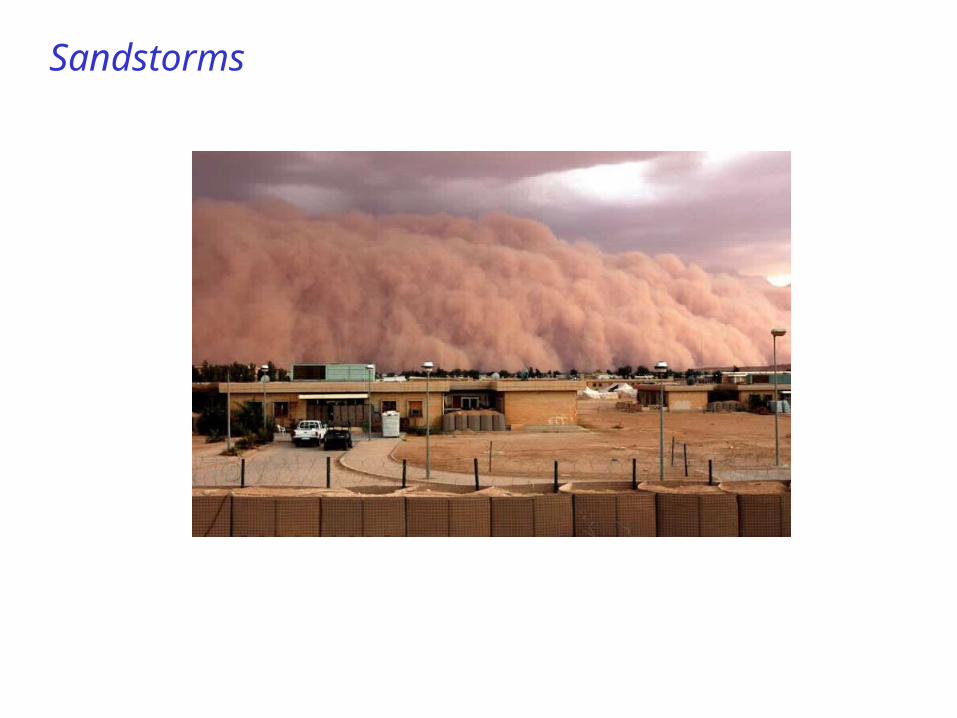
Sandstorms
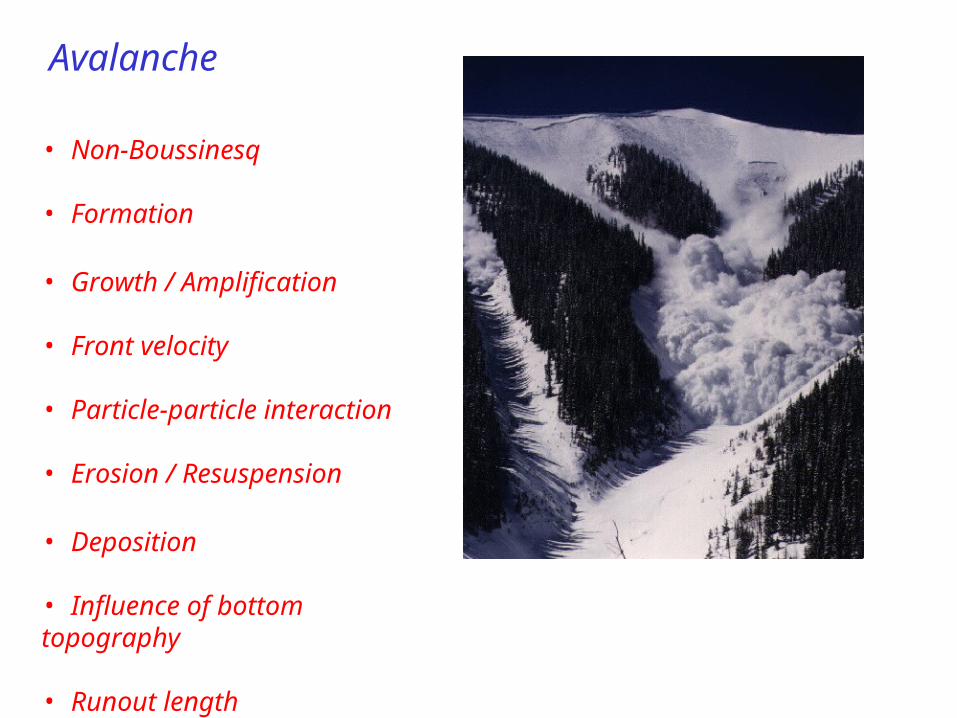
Avalanche
• Non-Boussinesq
• Formation
• Growth / Amplification
• Front velocity
• Particle-particle interaction
• Erosion / Resuspension
• Deposition
• Influence of bottom topography
• Runout length
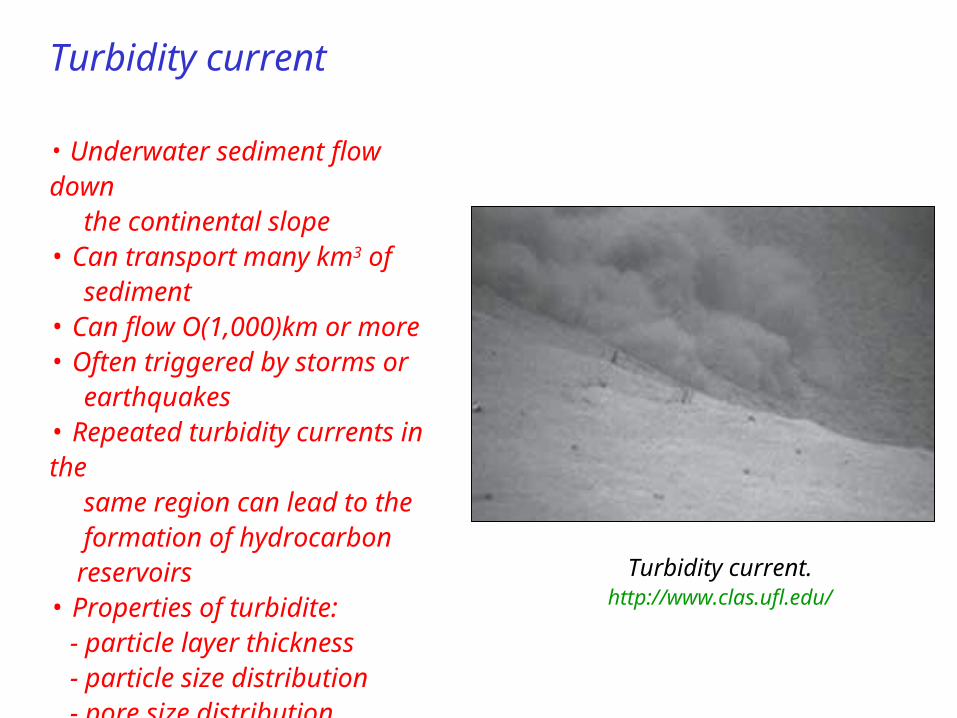
Turbidity current
Turbidity current.http://www.clas.ufl.edu/
• Underwater sediment flow down the continental slope• Can transport many km3 of sediment• Can flow O(1,000)km or more• Often triggered by storms or earthquakes• Repeated turbidity currents in the same region can lead to the formation of hydrocarbon reservoirs• Properties of turbidite: - particle layer thickness - particle size distribution - pore size distribution
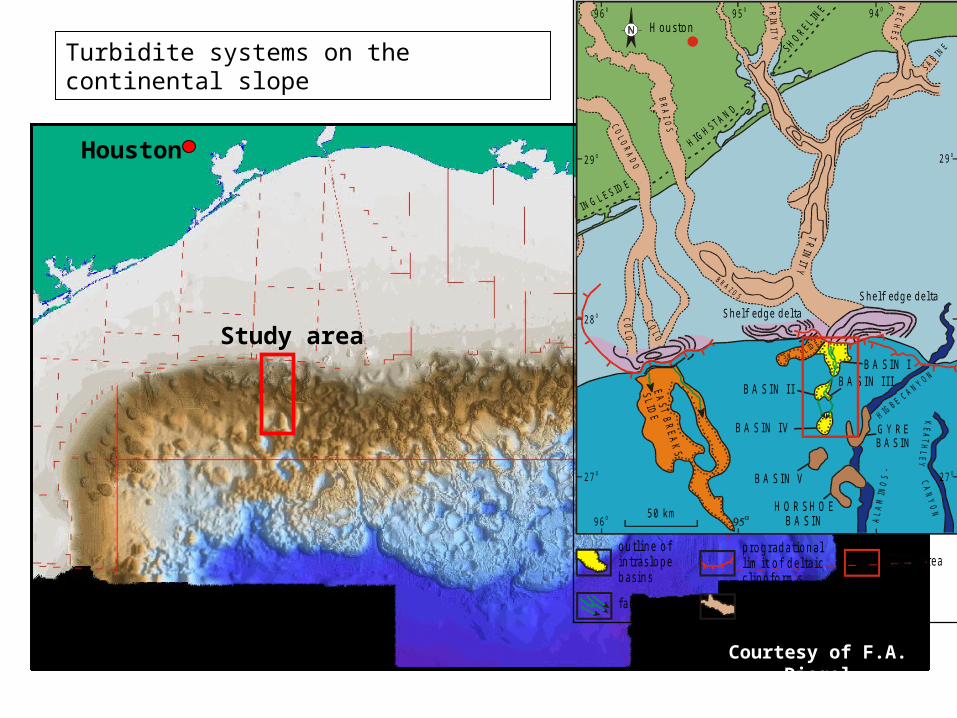
Houston
Study area
Courtesy of F.A. Diegel
o u tlin e o fin tra s lo p eb a s in s
fa n c h a n n e ls
s tu d y a re ap ro g ra d a tio n a llim it o f d e lta icc lin o fo rm s
in c ise d v a lle ysy s te m
CO
LO.
CO
LO
.
EA
ST B
RE
AK
S
SLID
E
SW SLIDE
B A S IN I
S h e lf e d g e d e lta
S h e lf e d g e d e lta
B A S IN I I
IN G L E S ID E
SH OREL INE
B A S IN I II
B A S IN IV
B A S IN V
H O R S H O EB A S IN
BR AZO SB
RA
ZO
SCO
L OR
AD
O
SA B INE
TR
INIT
Y
TR
INIT
Y
NE
CH
ES
AL
AM
INO
S -
G Y R EB A S IN
H IGB E C
A N Y O N
CA
NY
ON
KE
AT
HL
EY
5 0 k m9 6 O
9 6 O 9 5 O 9 4 O
2 7 O 2 7 O
2 9 O
2 8 O
2 9 O
H IGH STA N D
H o u s to n
Turbidite systems on the continental slope
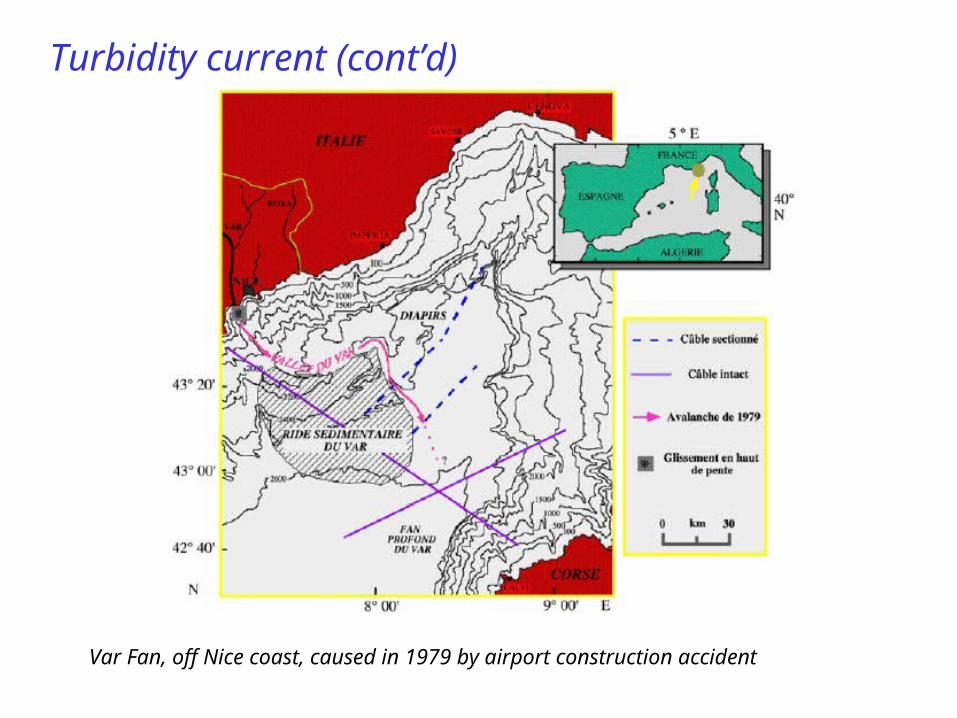
Turbidity current (cont’d)
Var Fan, off Nice coast, caused in 1979 by airport construction accident
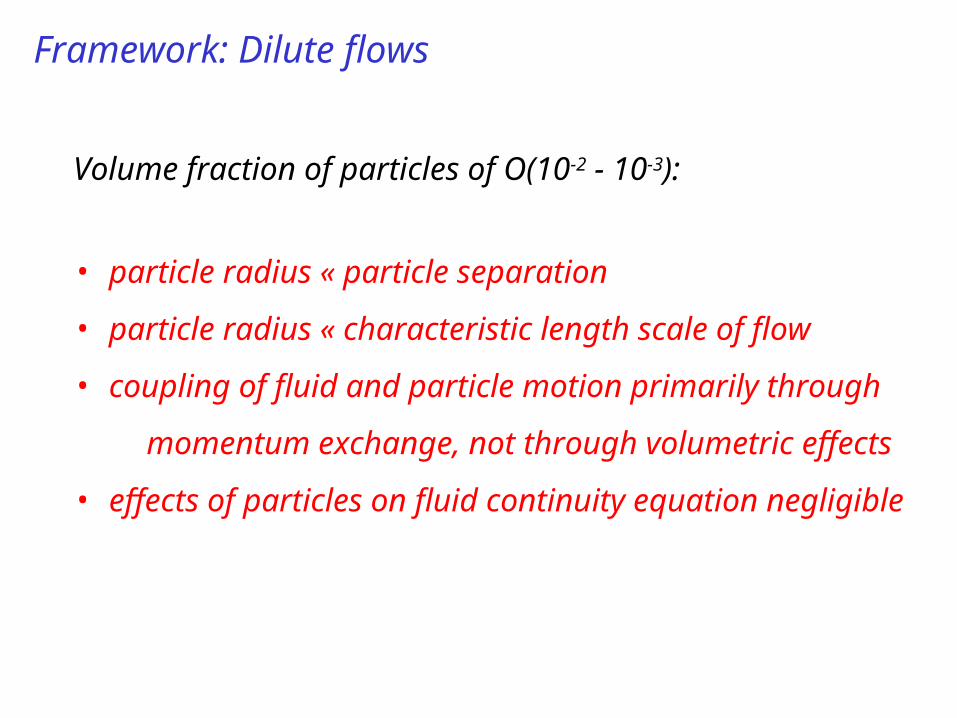
Framework: Dilute flows
Volume fraction of particles of O(10-2 - 10-3):
• particle radius « particle separation
• particle radius « characteristic length scale of flow
• coupling of fluid and particle motion primarily through
momentum exchange, not through volumetric effects
• effects of particles on fluid continuity equation negligible
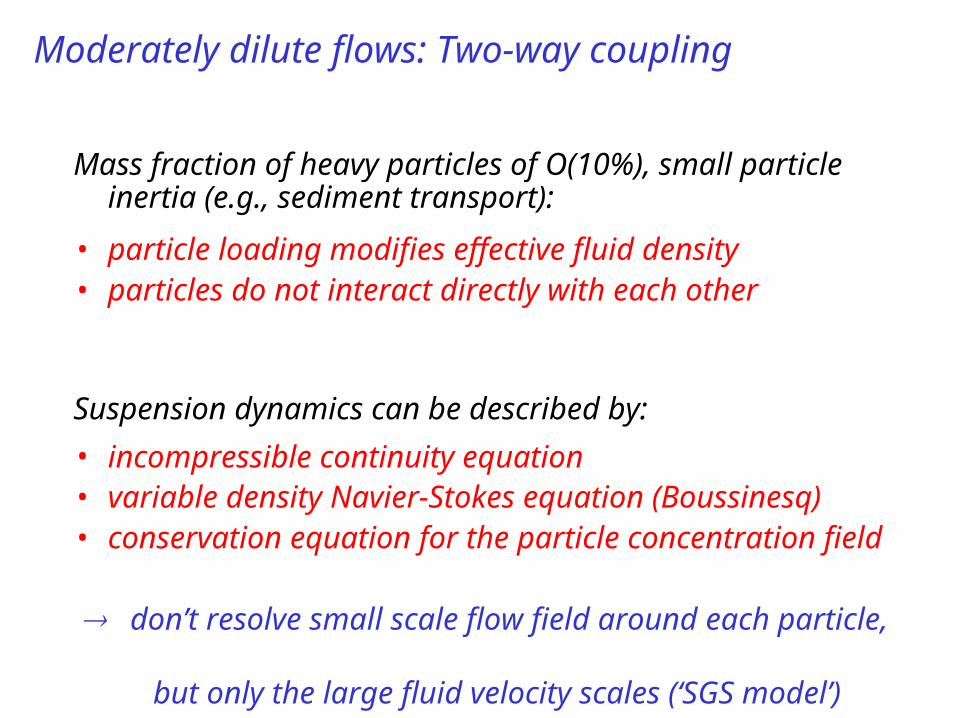
Moderately dilute flows: Two-way coupling
Mass fraction of heavy particles of O(10%), small particle inertia (e.g., sediment transport):
• particle loading modifies effective fluid density• particles do not interact directly with each other
Suspension dynamics can be described by:
• incompressible continuity equation• variable density Navier-Stokes equation (Boussinesq)• conservation equation for the particle concentration field
don’t resolve small scale flow field around each particle, but only the large fluid velocity scales (‘SGS model’)
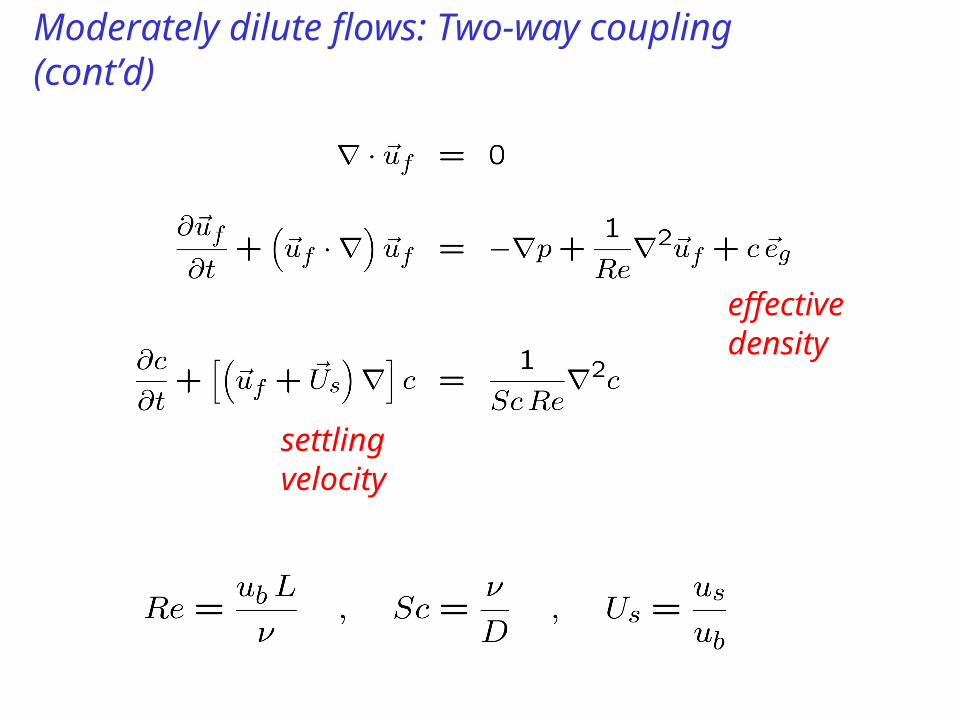
Moderately dilute flows: Two-way coupling (cont’d)
settling velocity
effective density
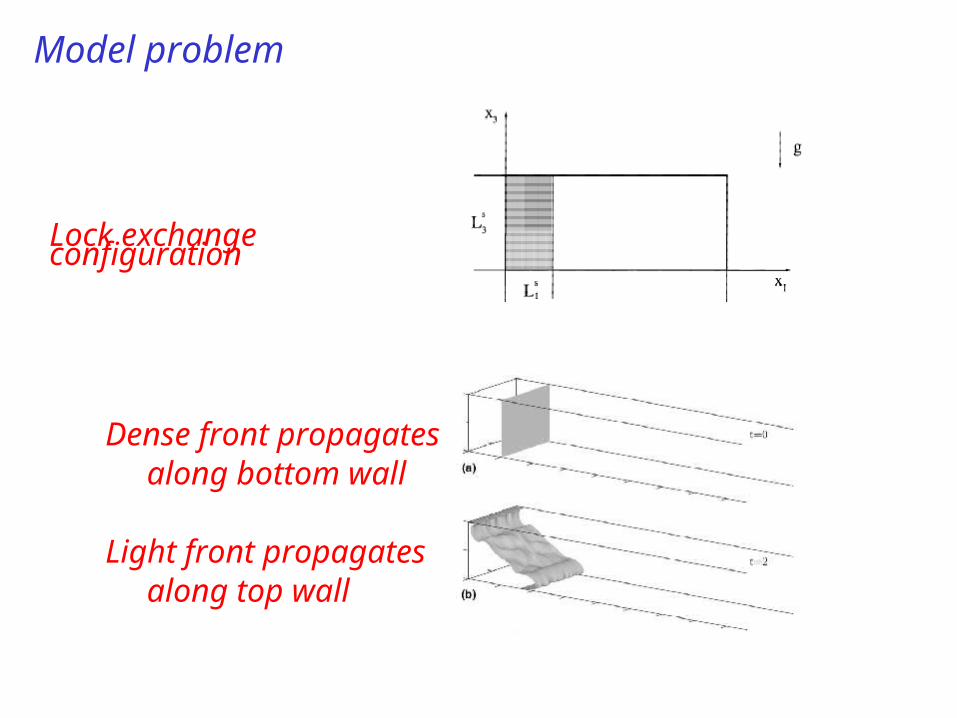
Model problem
Lock exchange configuration
Dense front propagates along bottom wall
Light front propagates along top wall
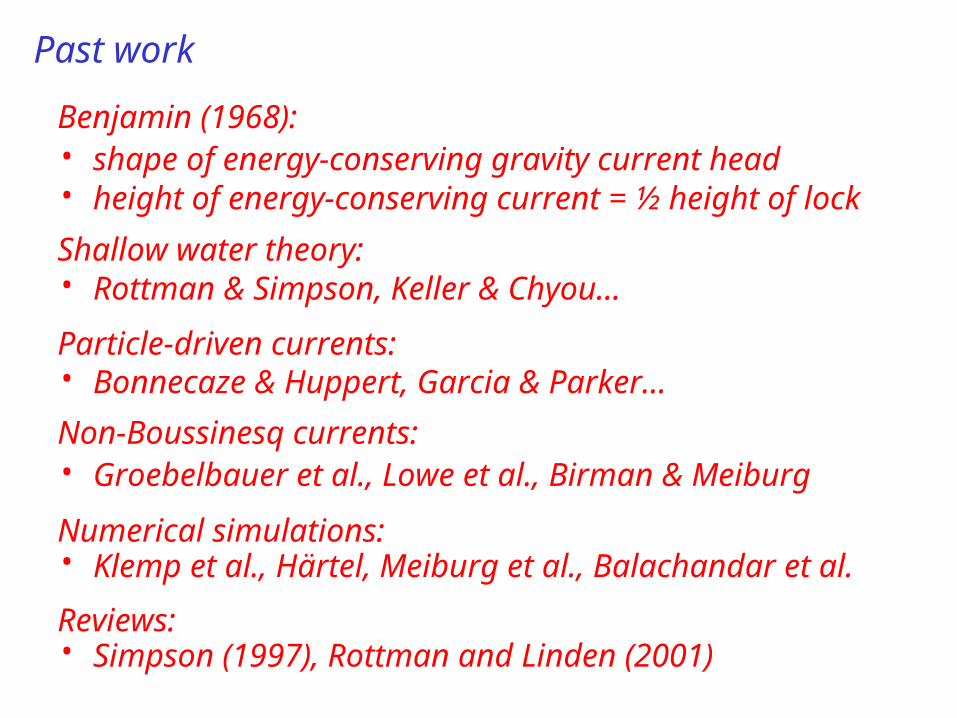
Past work
Benjamin (1968):• shape of energy-conserving gravity current head• height of energy-conserving current = ½ height of lock
Shallow water theory:• Rottman & Simpson, Keller & Chyou…
Particle-driven currents:• Bonnecaze & Huppert, Garcia & Parker…
Non-Boussinesq currents:• Groebelbauer et al., Lowe et al., Birman & Meiburg
Numerical simulations:• Klemp et al., Härtel, Meiburg et al., Balachandar et al.
Reviews:• Simpson (1997), Rottman and Linden (2001)
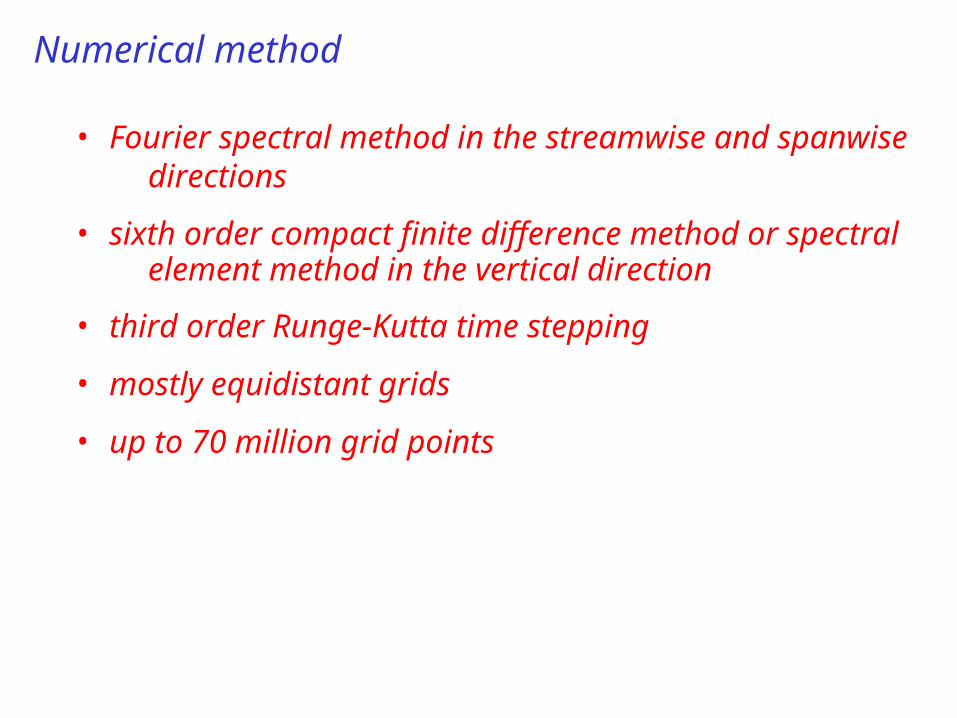
Numerical method
• Fourier spectral method in the streamwise and spanwise directions
• sixth order compact finite difference method or spectral element method in the vertical direction
• third order Runge-Kutta time stepping
• mostly equidistant grids
• up to 70 million grid points
Results: 3D turbidity current – Temporal evolution
Necker, Härtel, Kleiser and Meiburg (2002a,b)
DNS simulation (Fourier, spectral element, 7x10⁷ grid points)
• turbidity current develops lobe-and-cleft instability of the front
• current is fully turbulent
• erosion, resuspension not accounted for
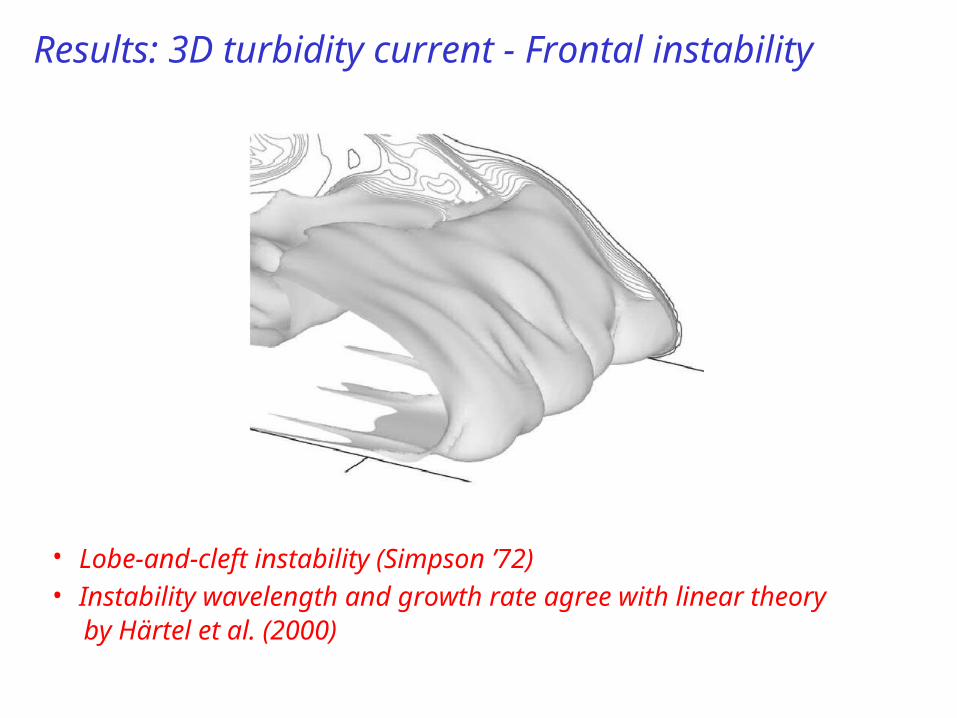
Results: 3D turbidity current - Frontal instability
• Lobe-and-cleft instability (Simpson ’72)• Instability wavelength and growth rate agree with linear theory by Härtel et al. (2000)
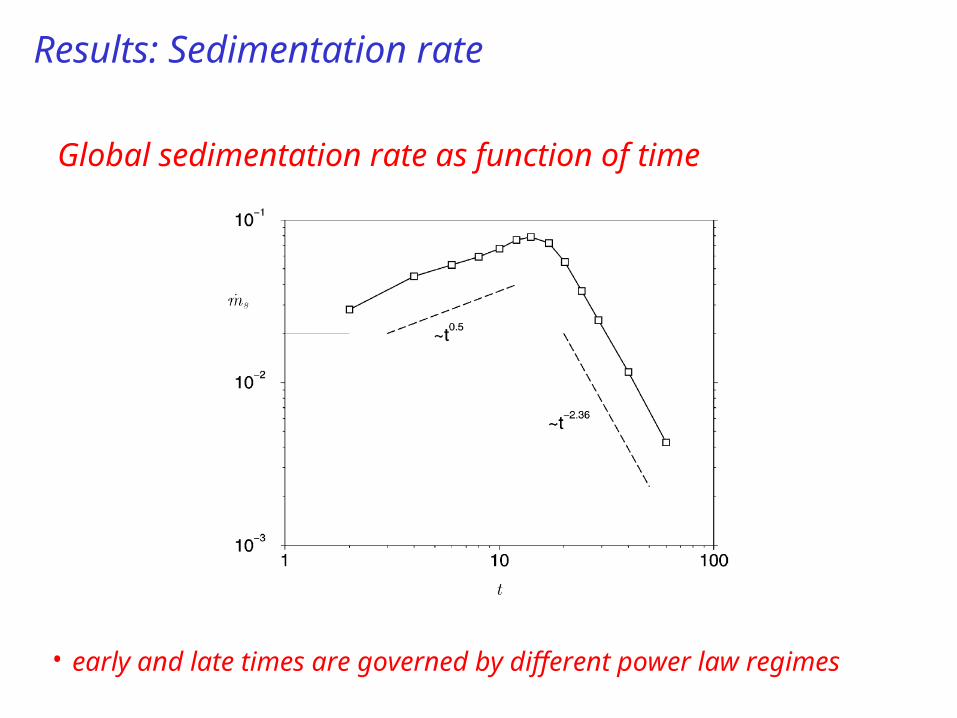
Results: Sedimentation rate
Global sedimentation rate as function of time
• early and late times are governed by different power law regimes
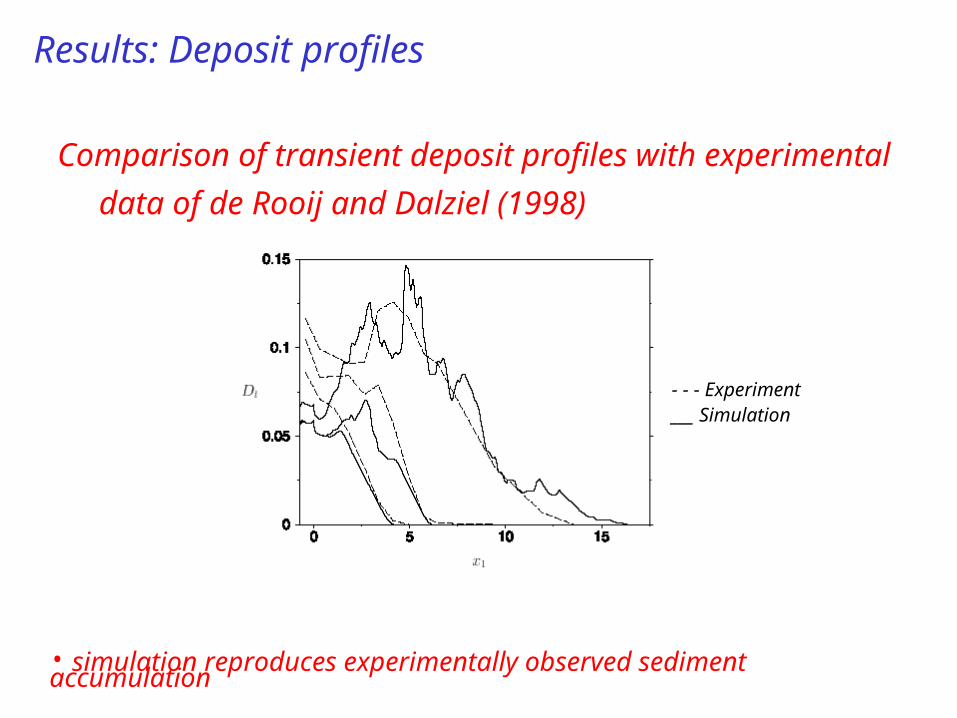
Results: Deposit profiles
Comparison of transient deposit profiles with experimental
data of de Rooij and Dalziel (1998)
• simulation reproduces experimentally observed sediment accumulation
- - - Experiment___ Simulation
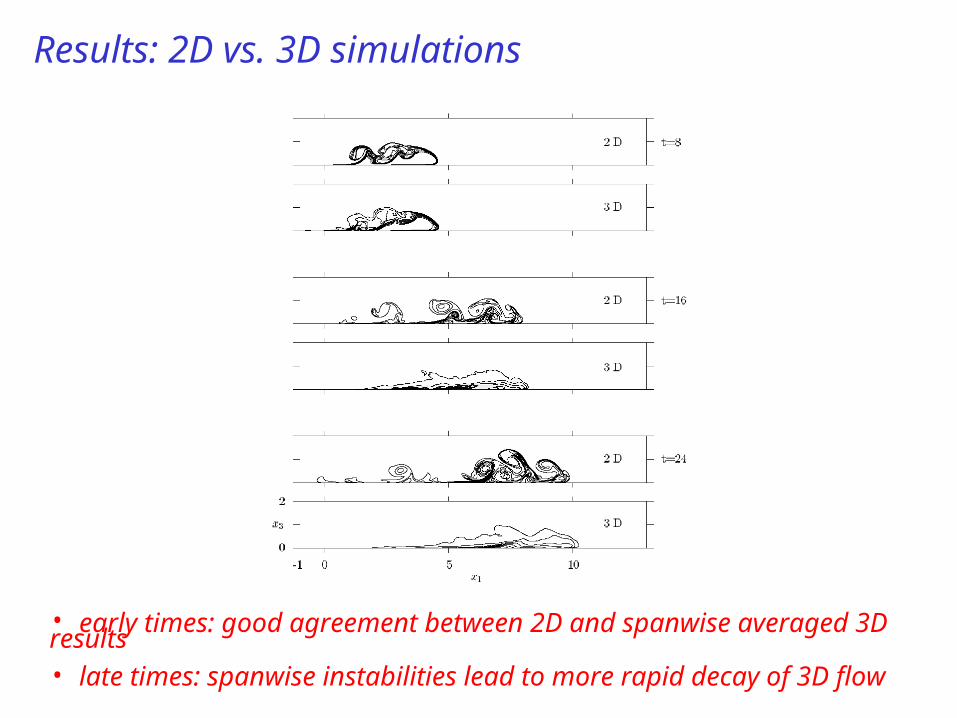
Results: 2D vs. 3D simulations
• early times: good agreement between 2D and spanwise averaged 3D results• late times: spanwise instabilities lead to more rapid decay of 3D flow
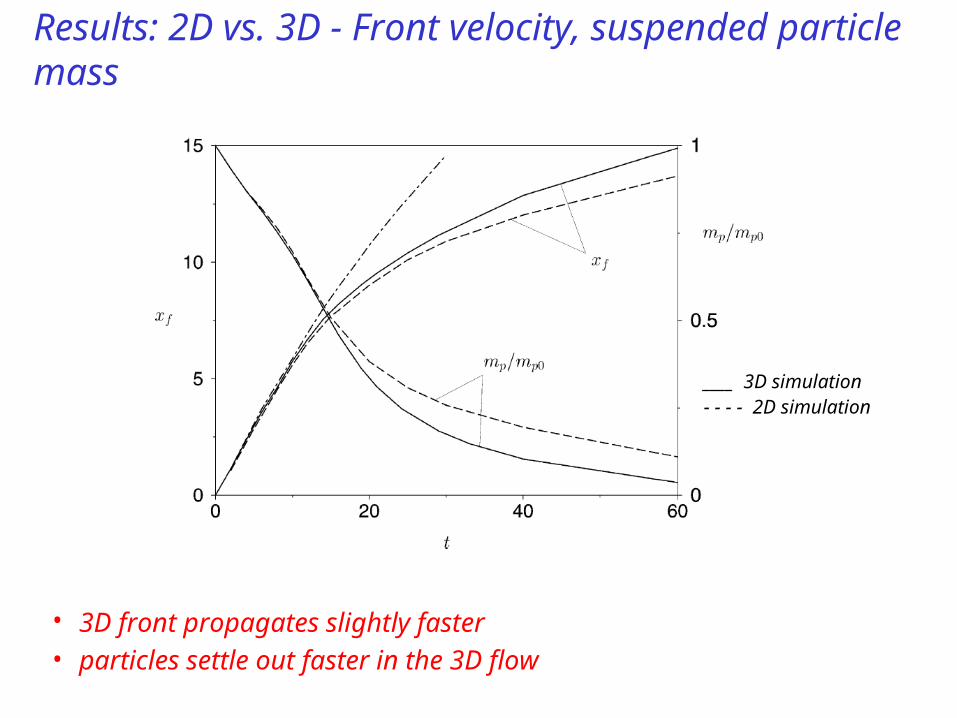
Results: 2D vs. 3D - Front velocity, suspended particle mass
• 3D front propagates slightly faster• particles settle out faster in the 3D flow
____ 3D simulation- - - - 2D simulation
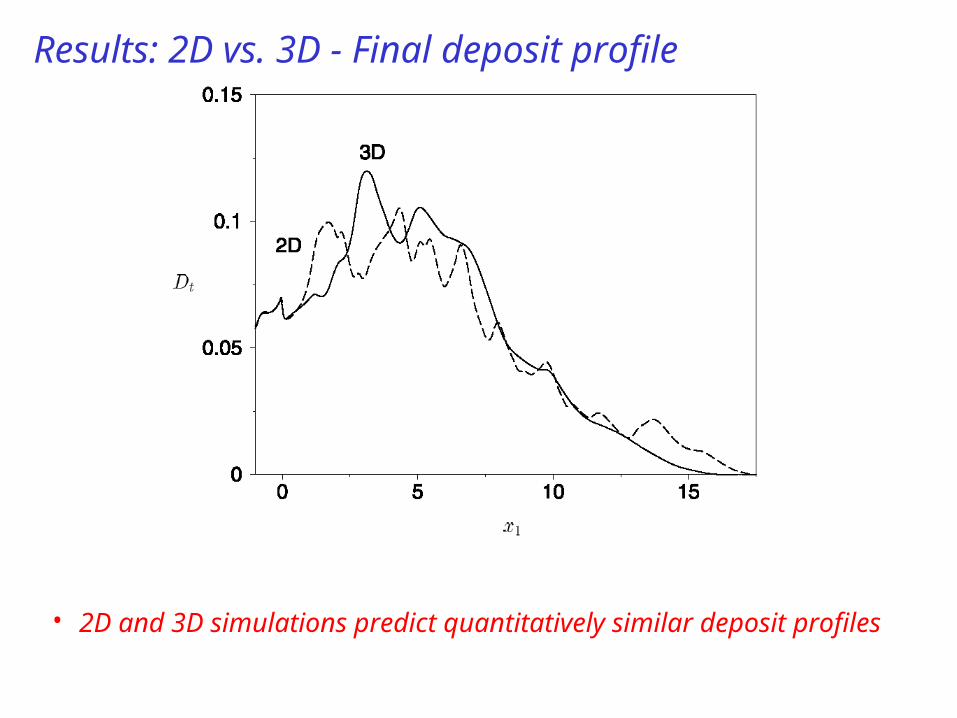
Results: 2D vs. 3D - Final deposit profile
• 2D and 3D simulations predict quantitatively similar deposit profiles
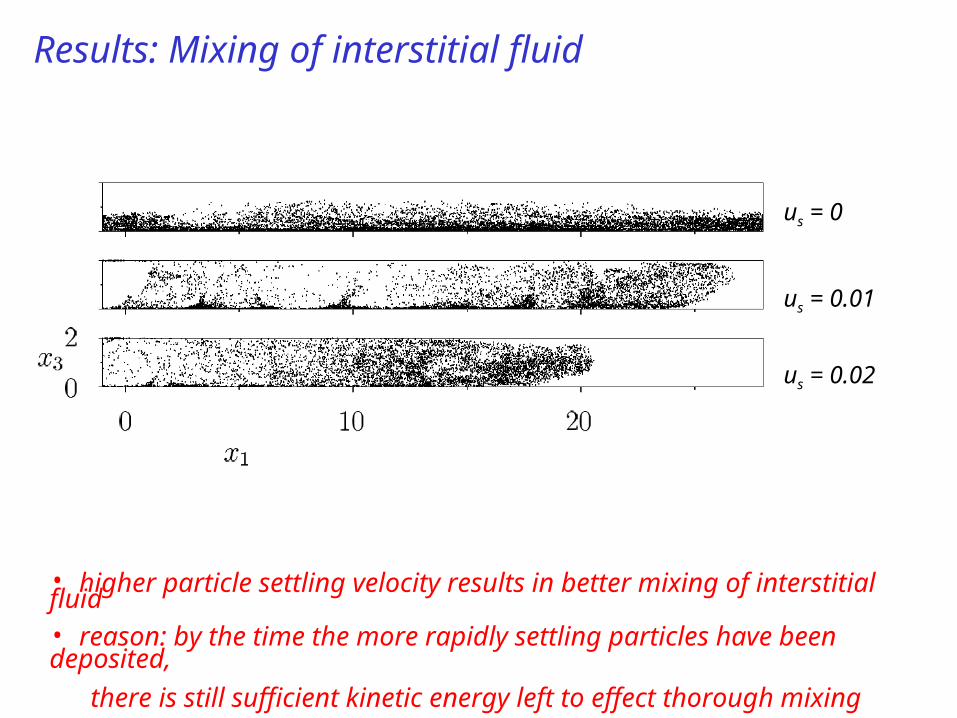
Results: Mixing of interstitial fluid
• higher particle settling velocity results in better mixing of interstitial fluid• reason: by the time the more rapidly settling particles have been deposited,
there is still sufficient kinetic energy left to effect thorough mixing
us = 0
us = 0.01
us = 0.02
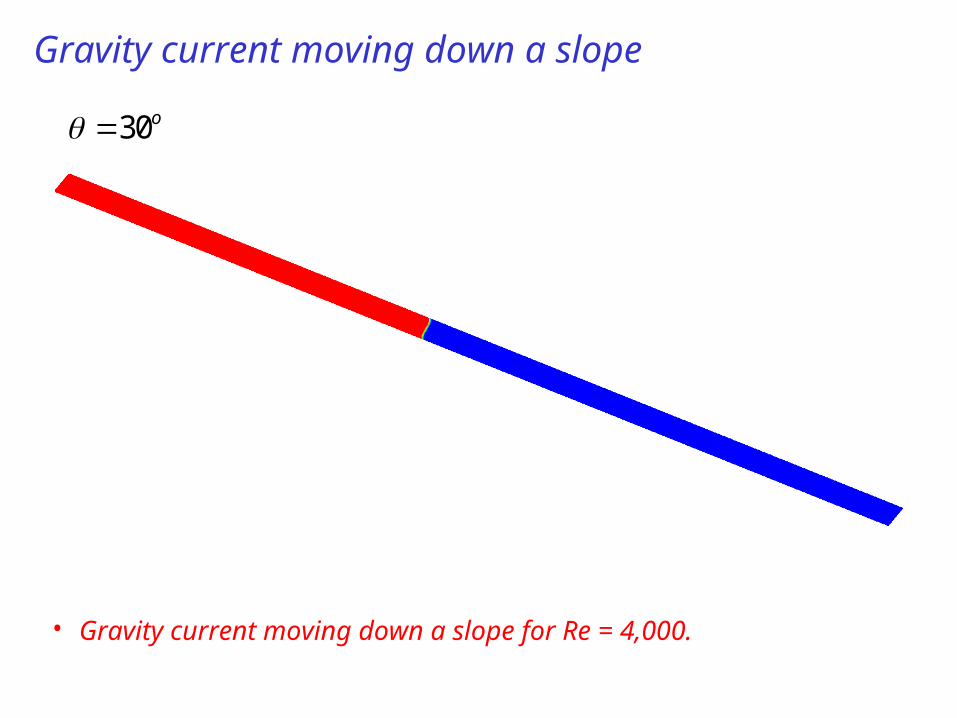
Gravity current moving down a slope
• Gravity current moving down a slope for Re = 4,000.
30o
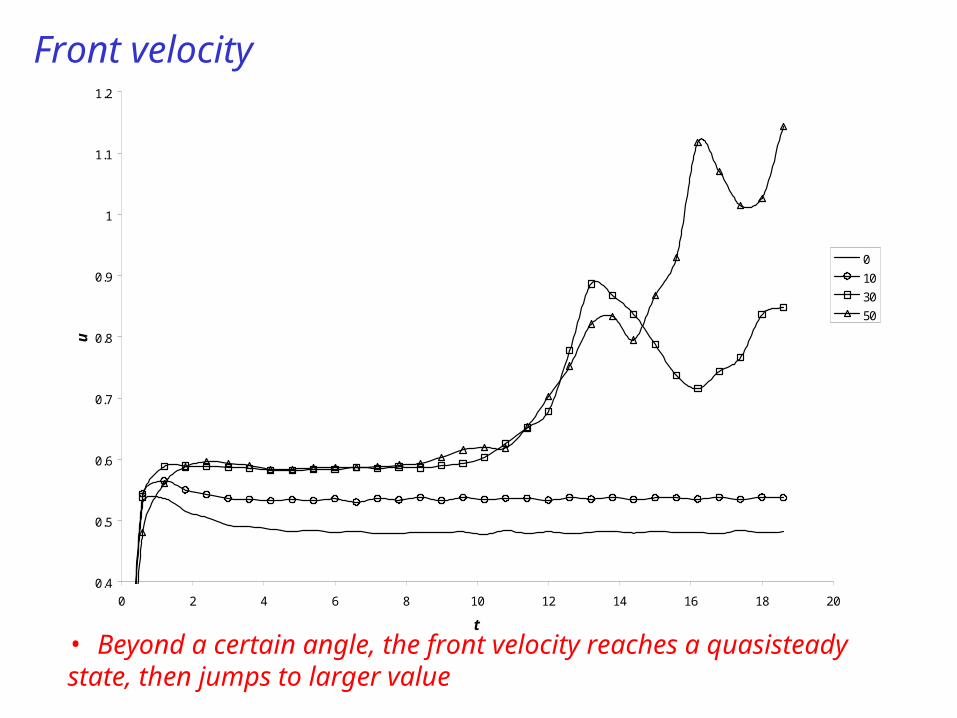
Front velocity
• Beyond a certain angle, the front velocity reaches a quasisteady state, then jumps to larger value
0.4
0.5
0.6
0.7
0.8
0.9
1
1.1
1.2
0 2 4 6 8 10 12 14 16 18 20
t
u
0
10
30
50
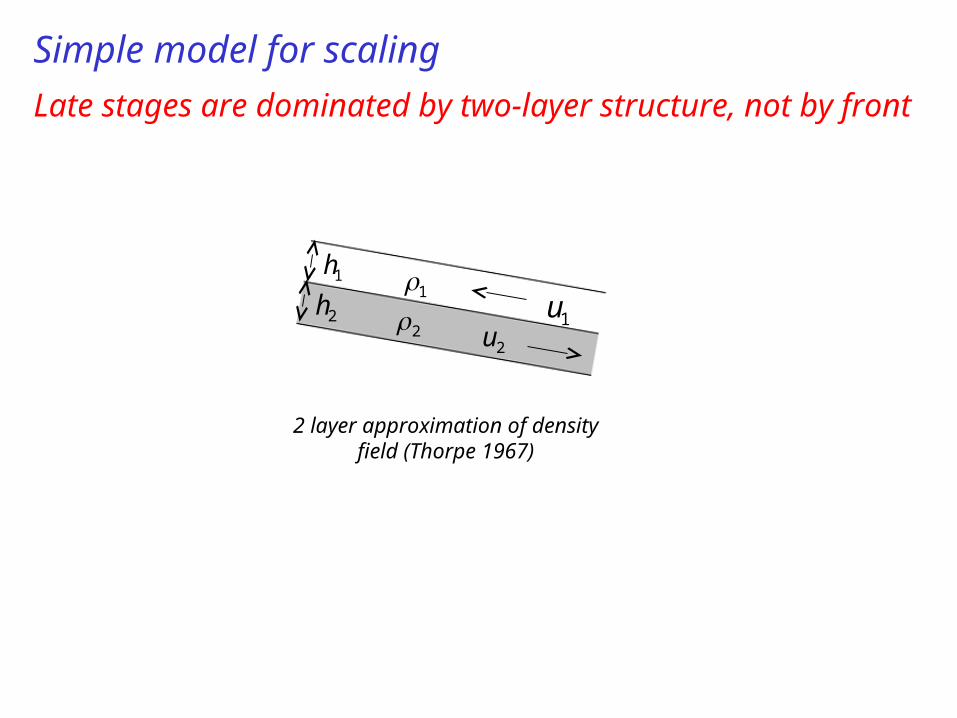
Simple model for scaling
Late stages are dominated by two-layer structure, not by front
2u1u2h
1h1
2
2 layer approximation of density field (Thorpe 1967)
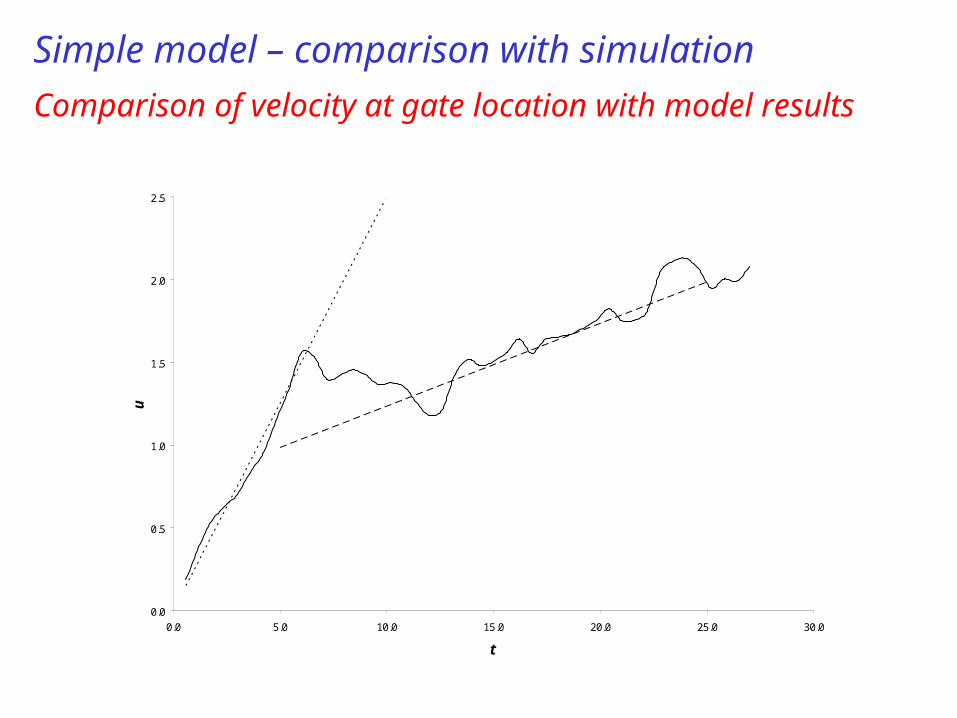
Simple model – comparison with simulation
Comparison of velocity at gate location with model results
0.0
0.5
1.0
1.5
2.0
2.5
0.0 5.0 10.0 15.0 20.0 25.0 30.0
t
u
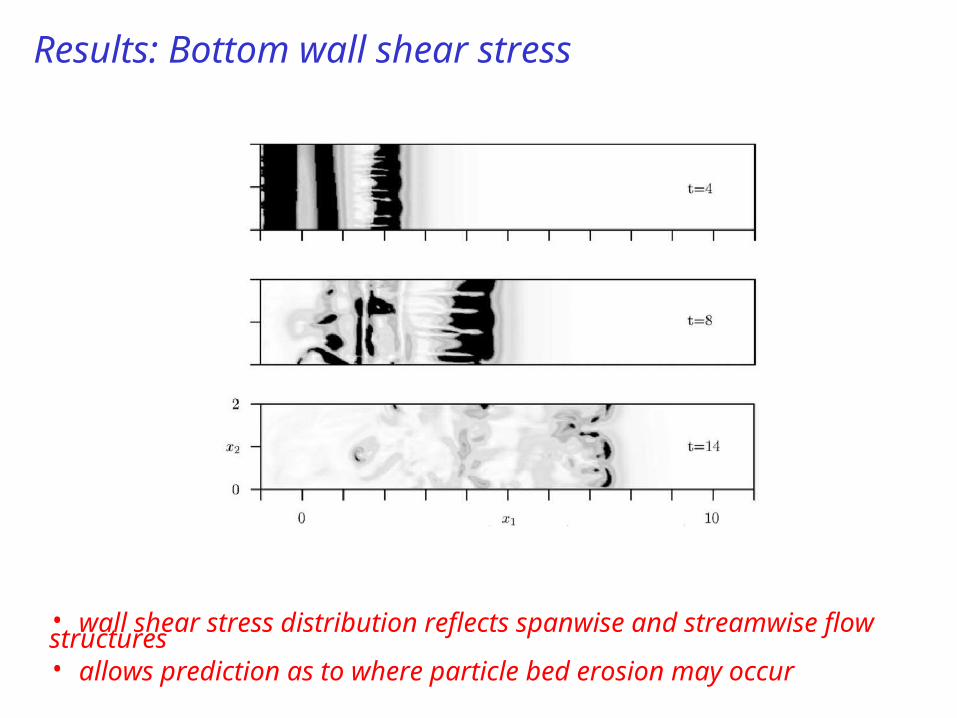
Results: Bottom wall shear stress
• wall shear stress distribution reflects spanwise and streamwise flow structures• allows prediction as to where particle bed erosion may occur
Erosion, resuspension of particle bed
Experimentally determined correlation by Garcia & Parker (1993) evaluates resuspension flux at the particle bedsurface as function of:
• bottom wall shear stress• settling velocity• particle Reynolds number
Here we model this resuspension as diffusive flux from the
particle bed surface into the flow
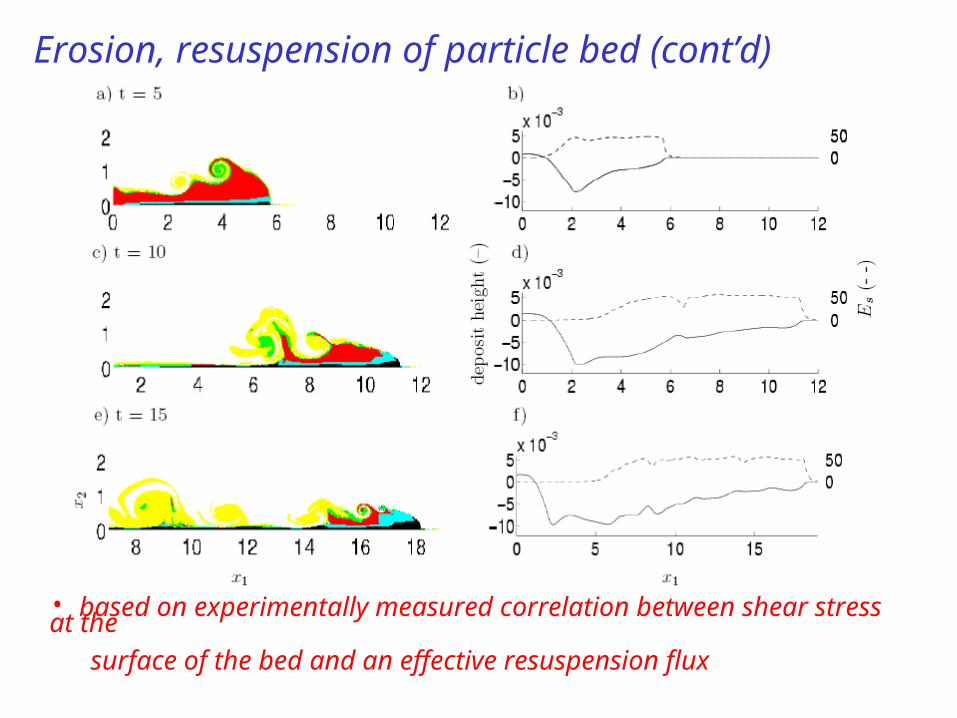
Erosion, resuspension of particle bed (cont’d)
• based on experimentally measured correlation between shear stress at the
surface of the bed and an effective resuspension flux
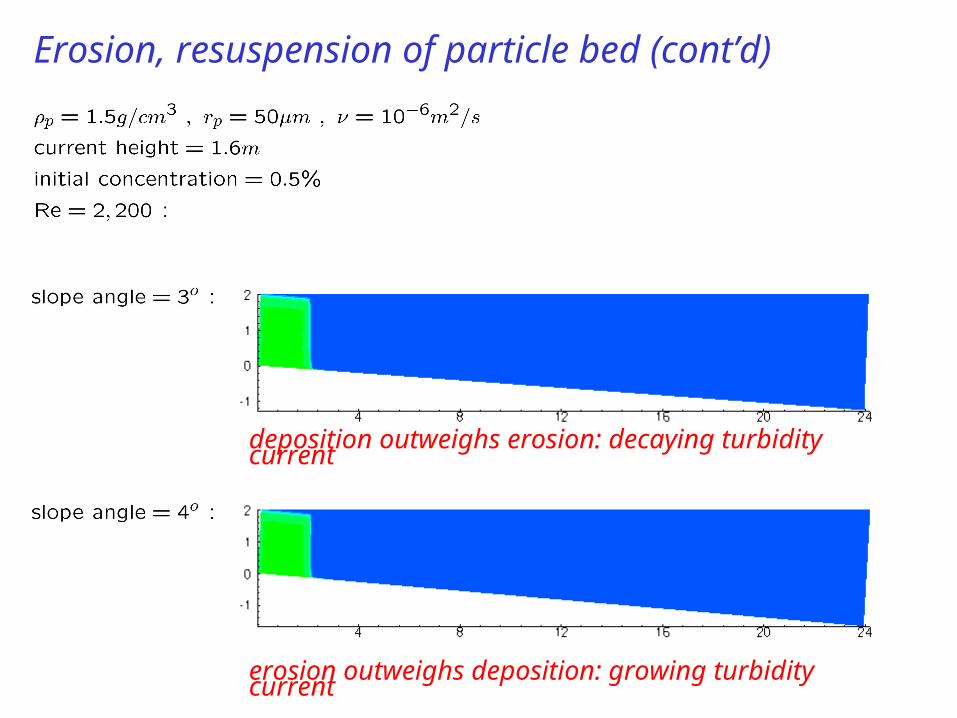
Erosion, resuspension of particle bed (cont’d)
deposition outweighs erosion: decaying turbidity current
erosion outweighs deposition: growing turbidity current
Erosion, resuspension of particle bed (cont’d)
• multiple, polydisperse flows
• feedback of deposit on subsequent flows
• formation of ripples, dunes etc.
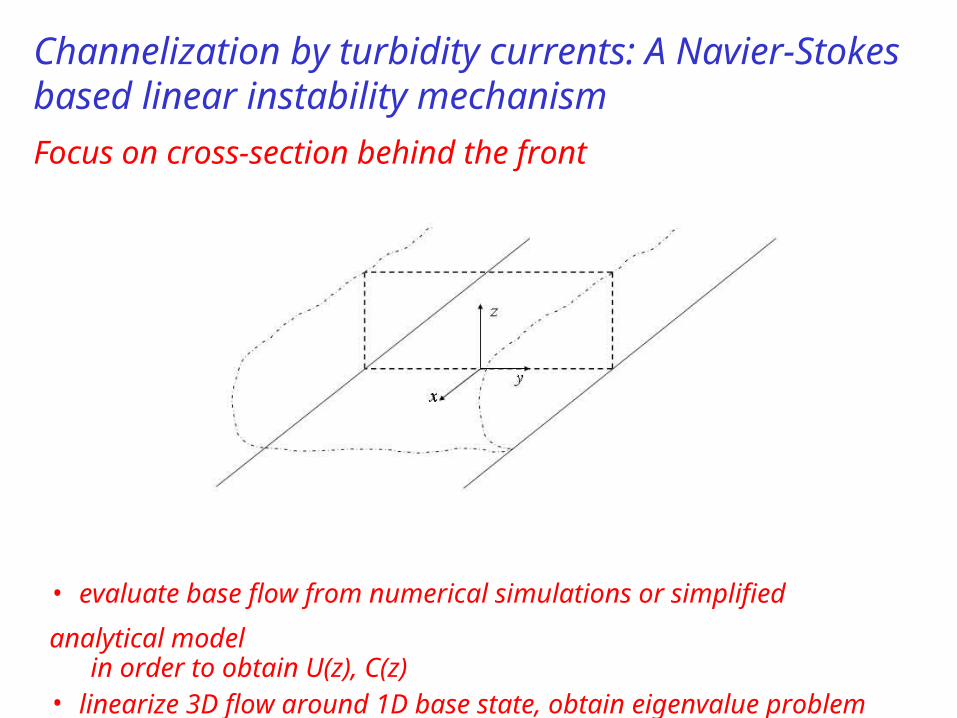
Channelization by turbidity currents: A Navier-Stokes based linear instability mechanism
• evaluate base flow from numerical simulations or simplified analytical model in order to obtain U(z), C(z)• linearize 3D flow around 1D base state, obtain eigenvalue problem
Focus on cross-section behind the front
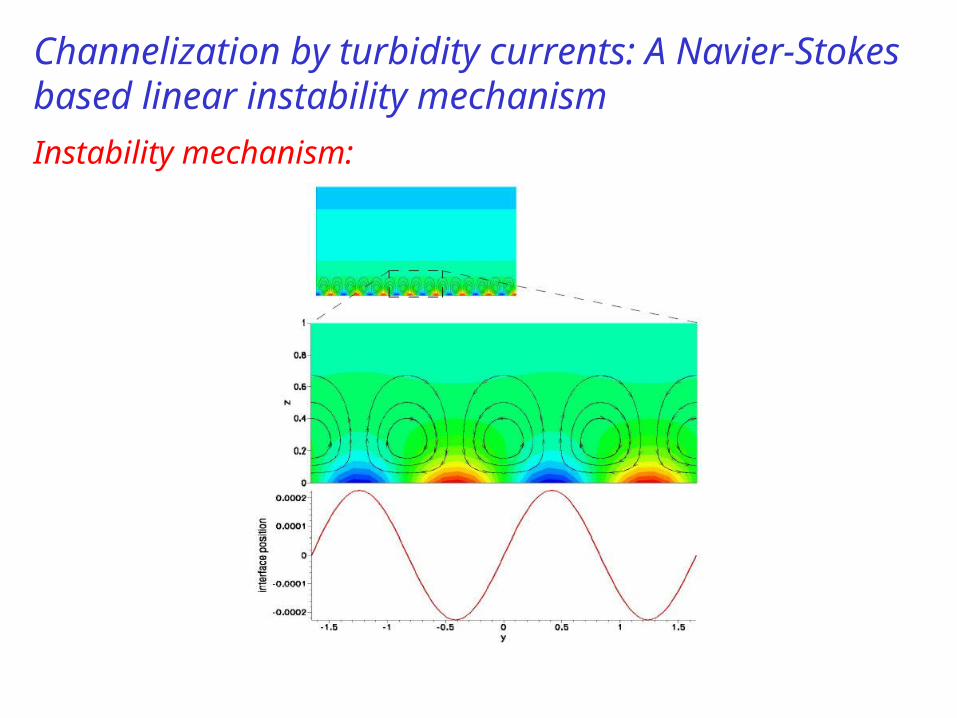
Channelization by turbidity currents: A Navier-Stokes based linear instability mechanism
Instability mechanism:
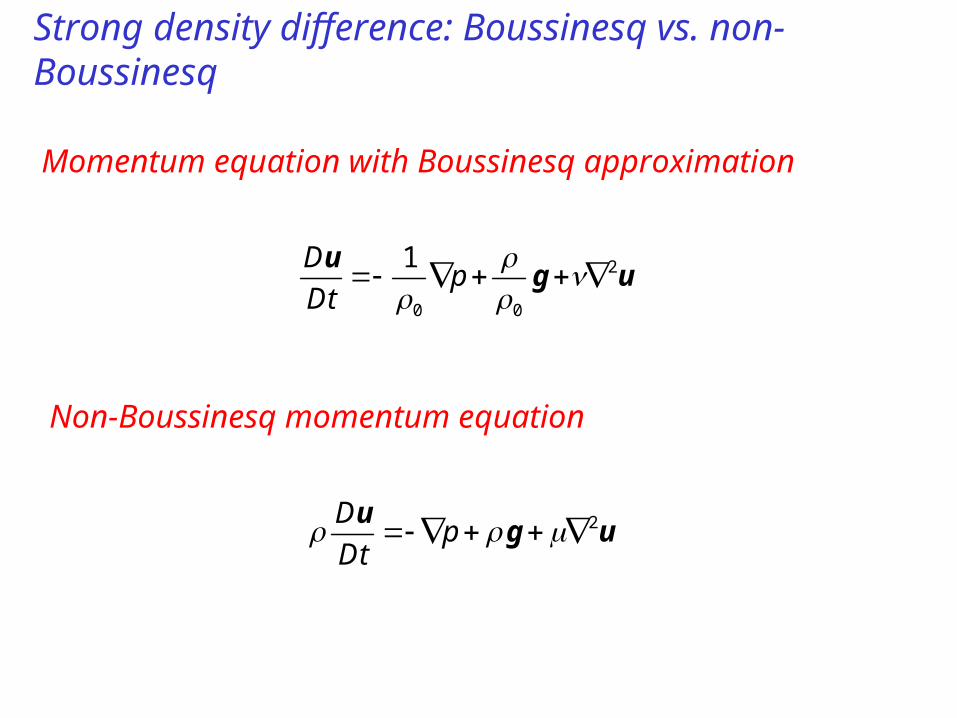
Strong density difference: Boussinesq vs. non-Boussinesq
2Dp
Dt
ug u
2
0 0
1Dp
Dt
u
g u
Momentum equation with Boussinesq approximation
Non-Boussinesq momentum equation
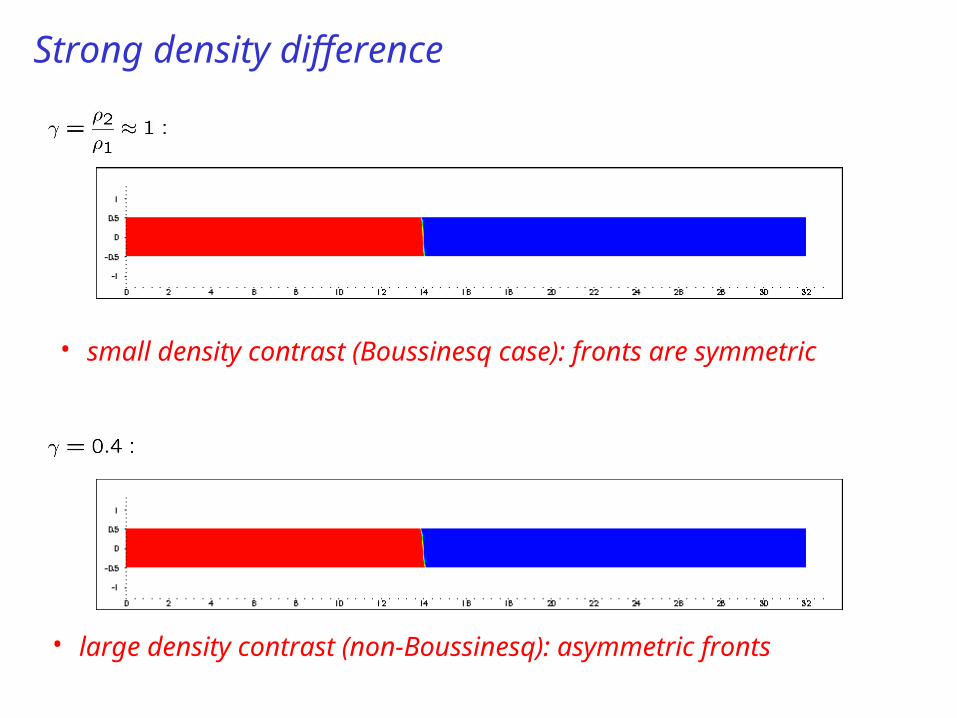
Strong density difference
• large density contrast (non-Boussinesq): asymmetric fronts
• small density contrast (Boussinesq case): fronts are symmetric
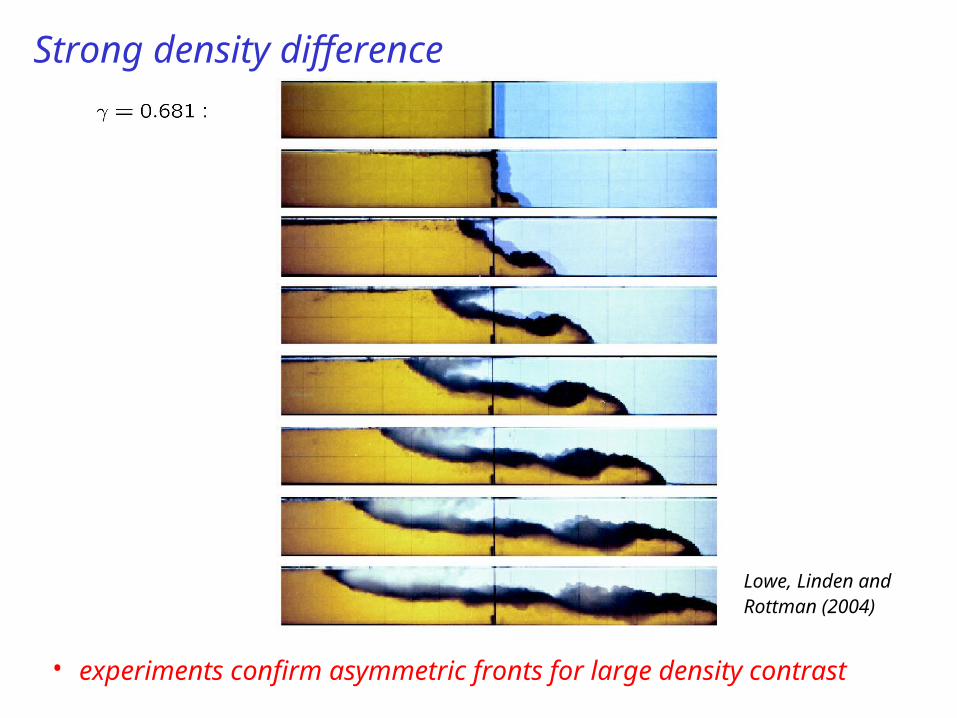
Strong density difference
Lowe, Linden andRottman (2004)
• experiments confirm asymmetric fronts for large density contrast
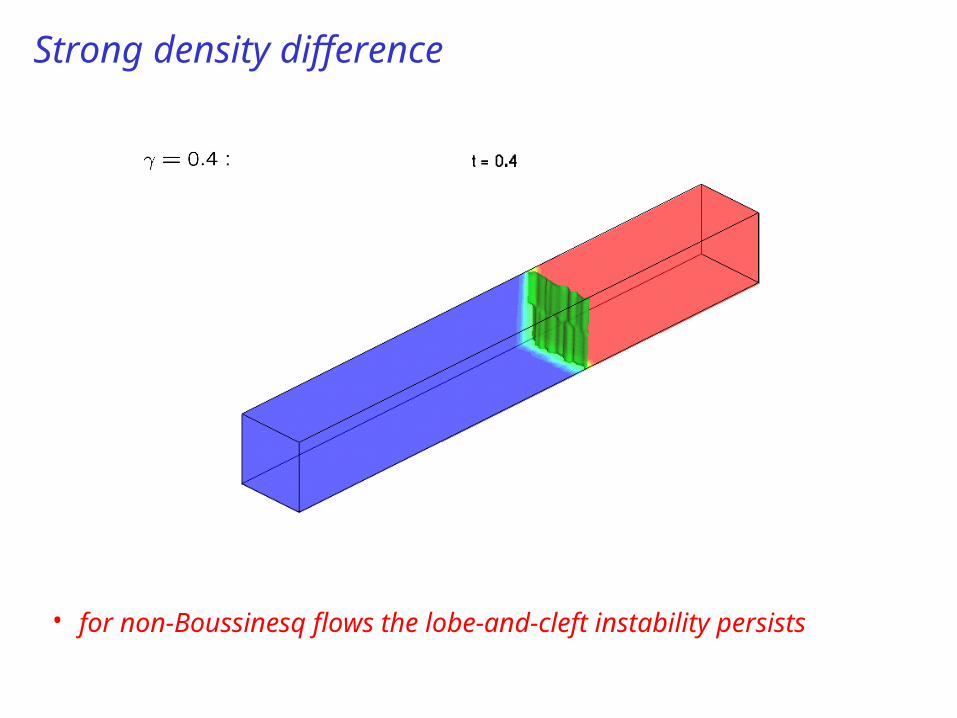
Strong density difference
• for non-Boussinesq flows the lobe-and-cleft instability persists
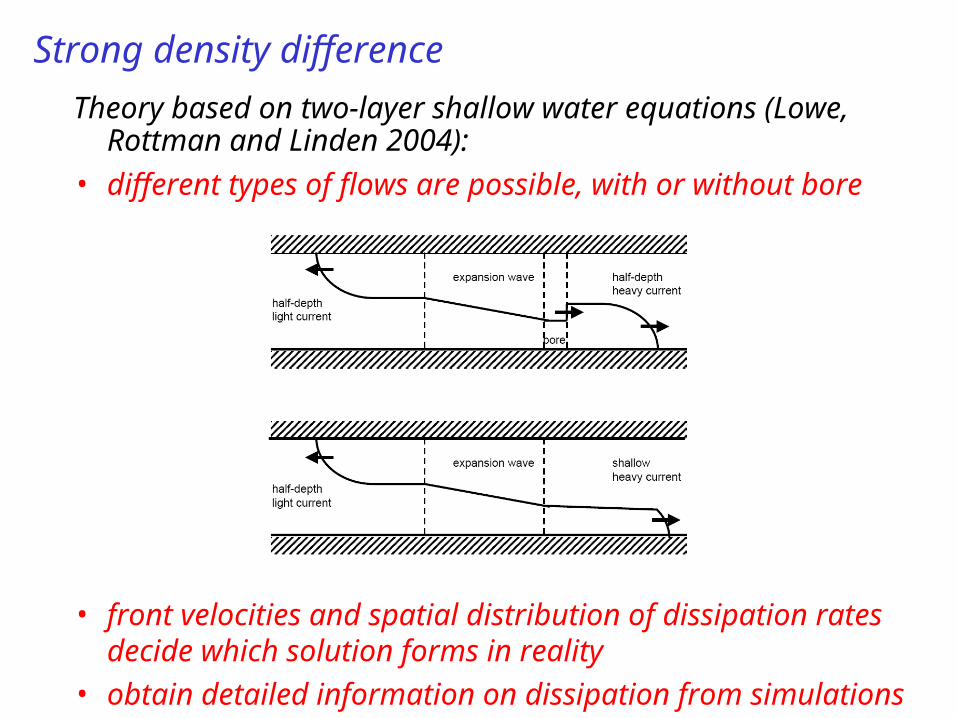
Strong density difference
Theory based on two-layer shallow water equations (Lowe, Rottman and Linden 2004):
• different types of flows are possible, with or without bore
• front velocities and spatial distribution of dissipation rates decide which solution forms in reality
• obtain detailed information on dissipation from simulations
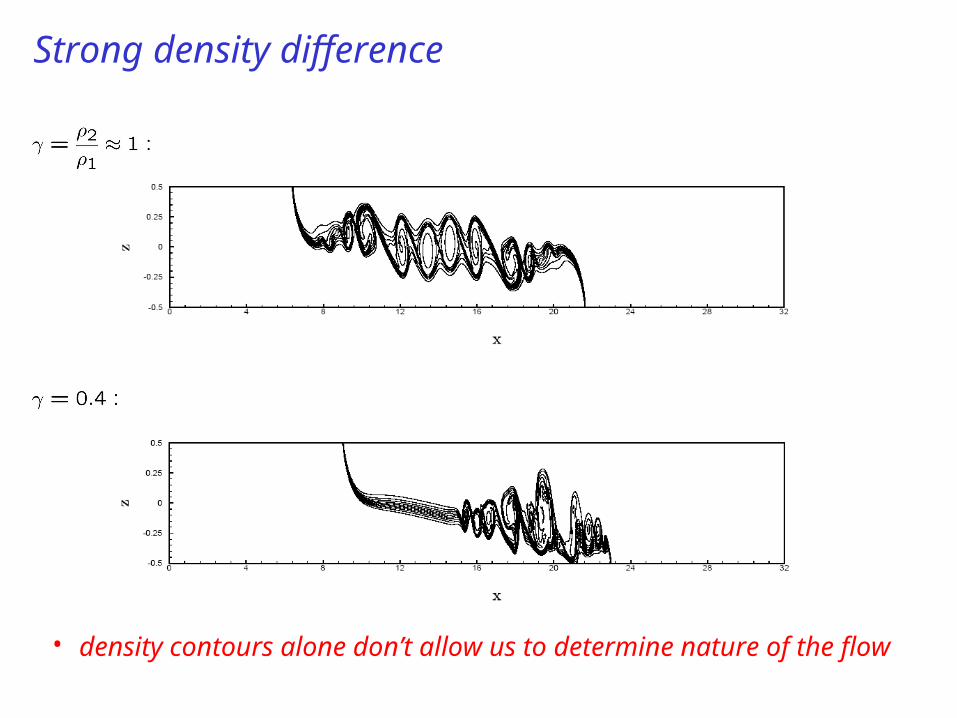
Strong density difference
• density contours alone don’t allow us to determine nature of the flow
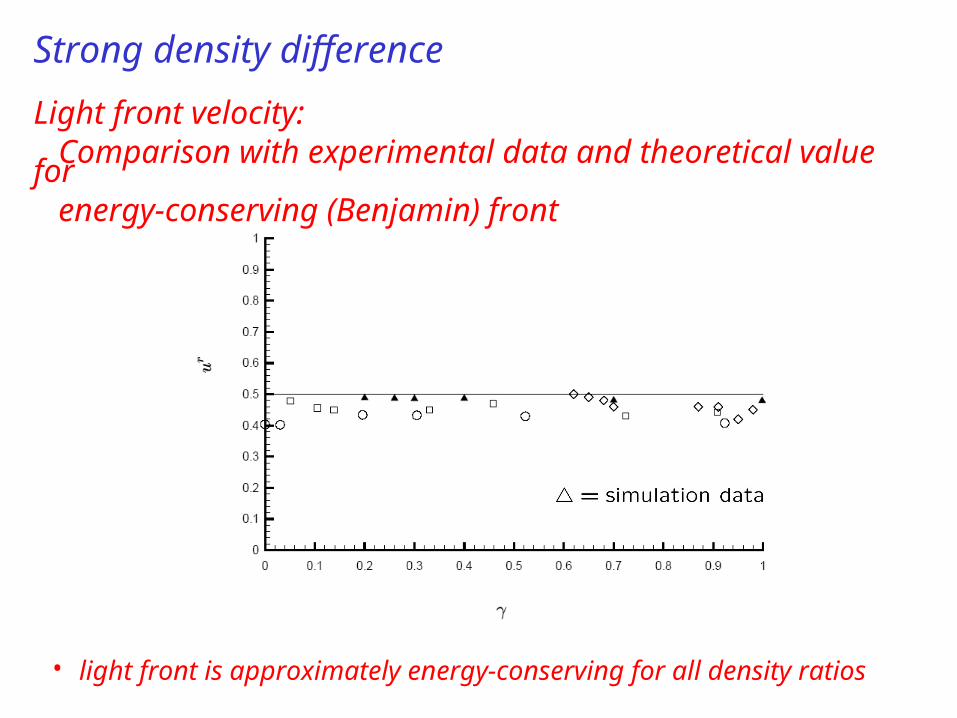
Strong density difference
• light front is approximately energy-conserving for all density ratios
Light front velocity: Comparison with experimental data and theoretical value for energy-conserving (Benjamin) front
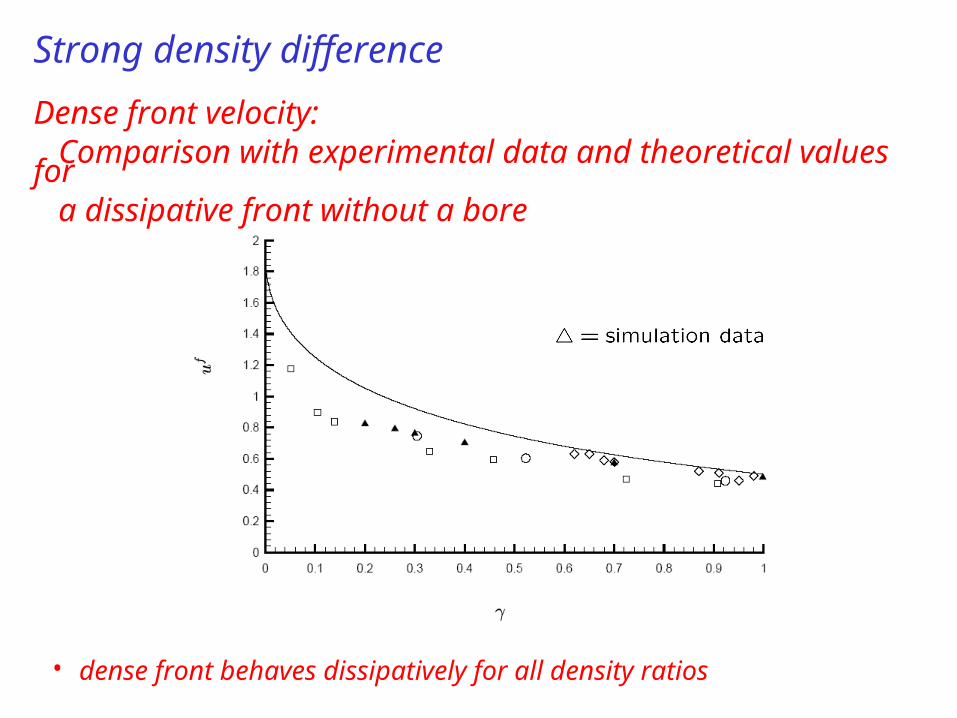
Strong density difference
• dense front behaves dissipatively for all density ratios
Dense front velocity: Comparison with experimental data and theoretical values for a dissipative front without a bore
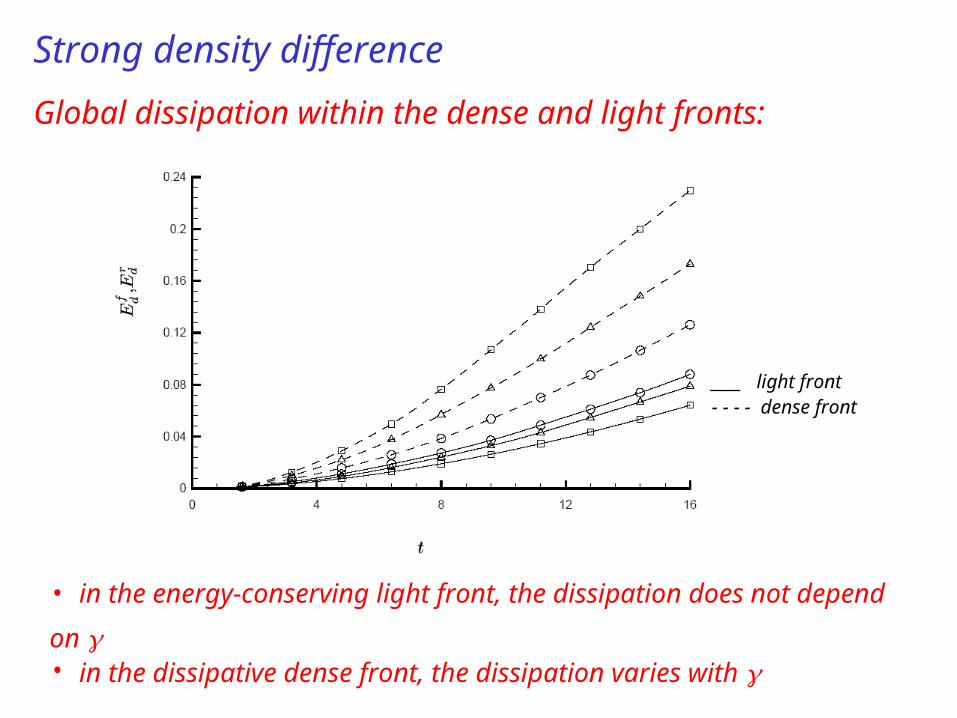
Strong density difference
• in the energy-conserving light front, the dissipation does not depend on • in the dissipative dense front, the dissipation varies with
Global dissipation within the dense and light fronts:
____ light front- - - - dense front
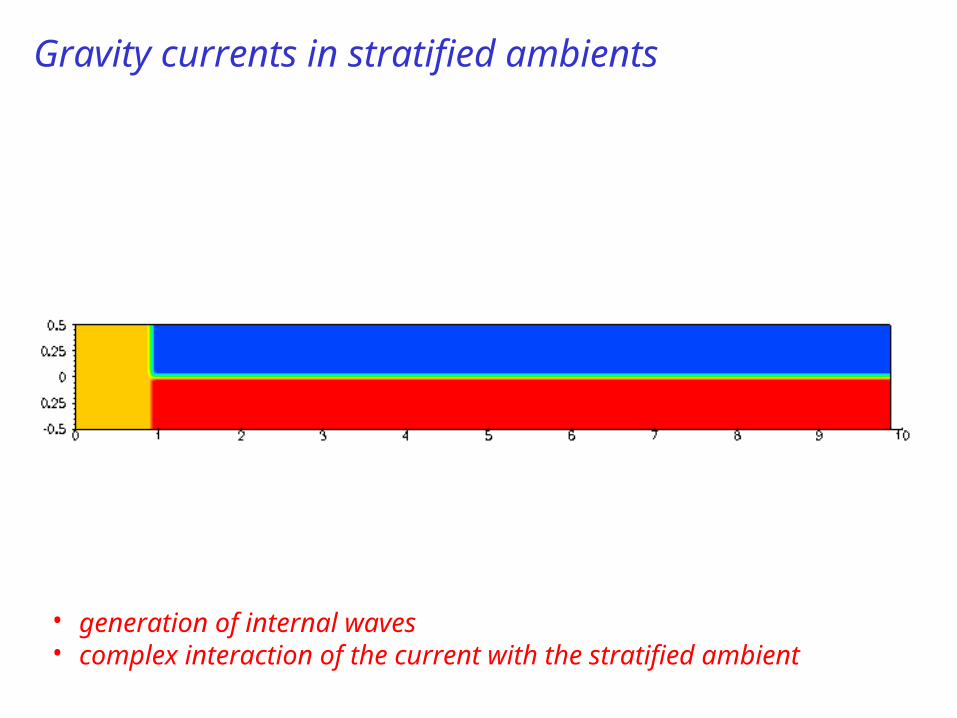
Gravity currents in stratified ambients
• generation of internal waves• complex interaction of the current with the stratified ambient
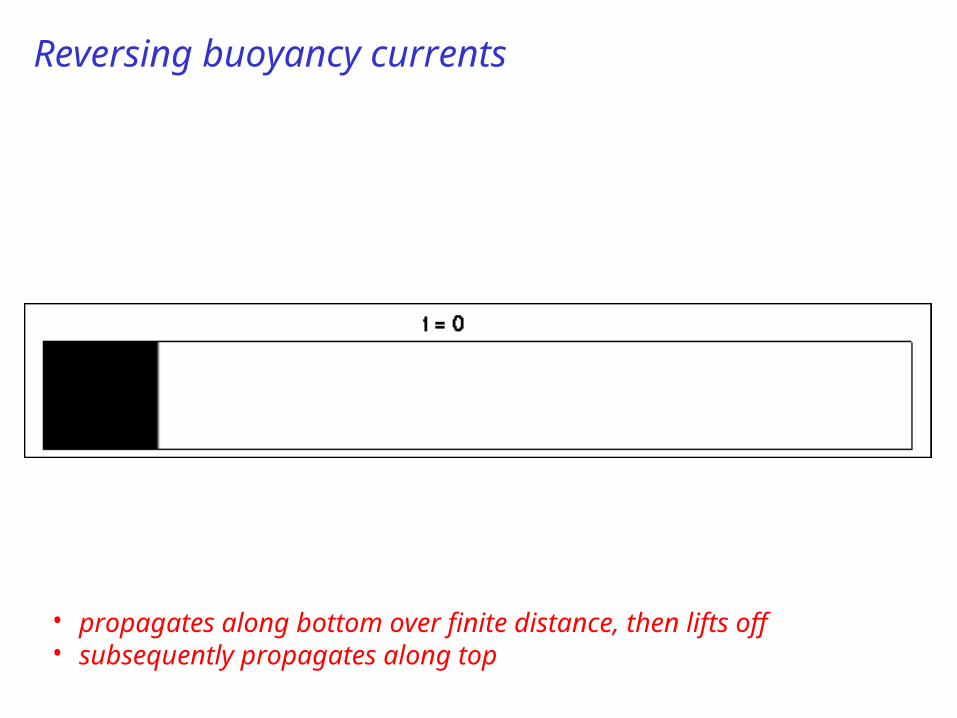
Reversing buoyancy currents
• propagates along bottom over finite distance, then lifts off• subsequently propagates along top
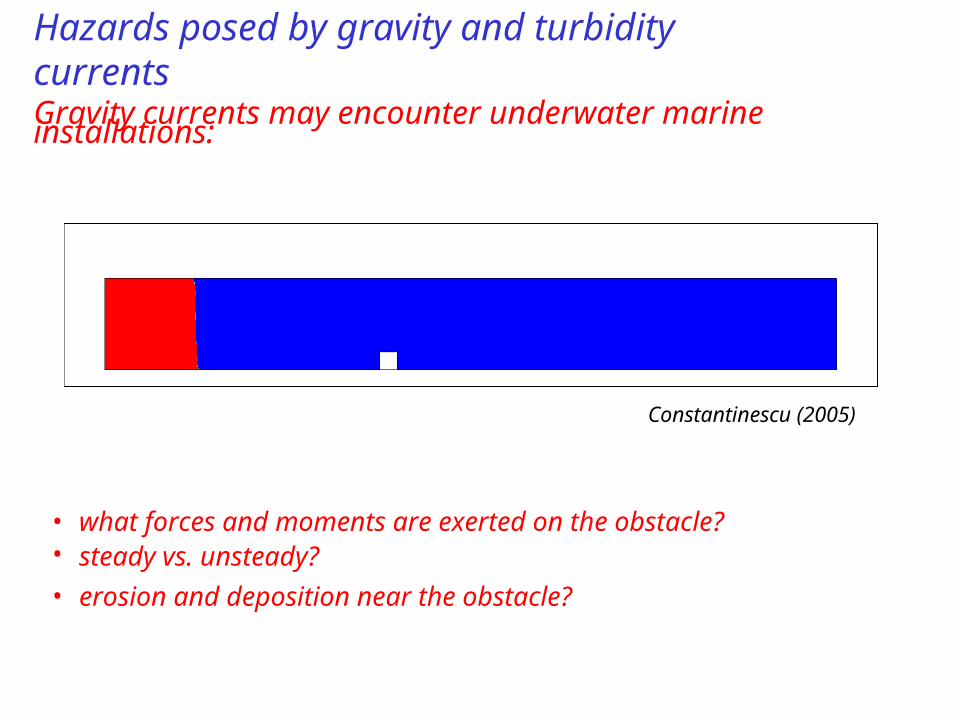
• what forces and moments are exerted on the obstacle?• steady vs. unsteady?
• erosion and deposition near the obstacle?
Gravity currents may encounter underwater marine installations:
Hazards posed by gravity and turbidity currents
Constantinescu (2005)
• high resolution three-dimensional simulations of gravity currents
• detailed information regarding sedimentation dynamics, energy
budgets, mixing behavior, dissipation…
• important differences between 2D and 3D simulation results
• current extension to gravity currents flowing down a slope, more
complex geometries, erosion and resuspension, intrusions,
reversing buoyancy, submarine structures
• non-Boussinesq currents: light front is energy-conserving,
dense front is dissipative
Summary
Acknowledgments
• National Science Foundation, NASA, BHP Billiton Petroleum
• V. Birman, F. Necker, C. Härtel, L. Kleiser, J. Martin,
F. Blanchette, B. Hall, E. Gonzales, M. Strauss, B. Kneller,
M. Glinsky
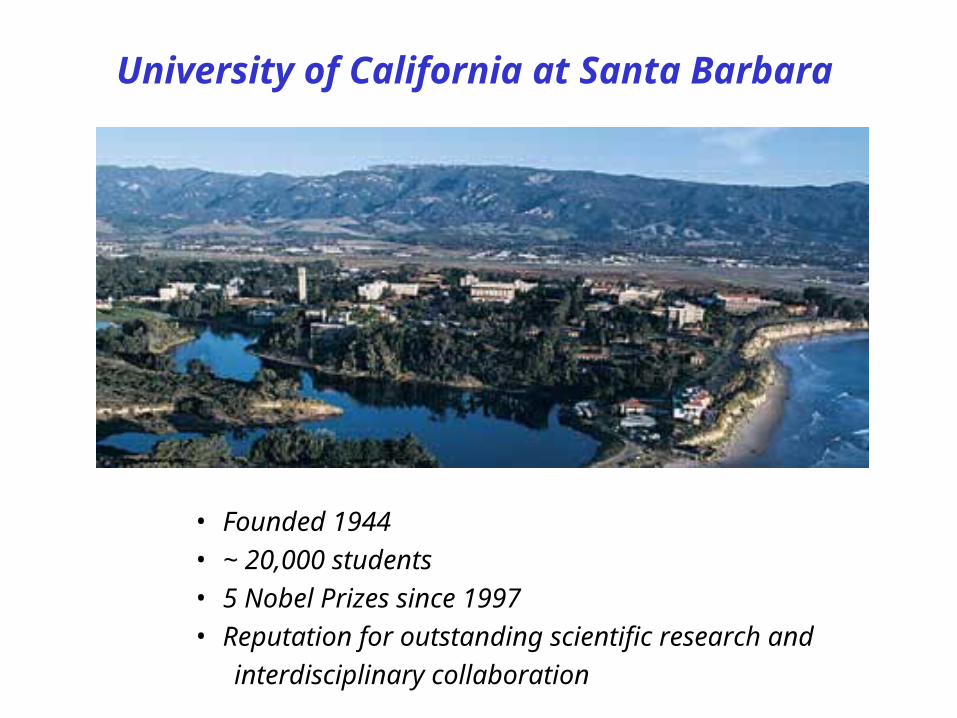
University of California at Santa Barbara
• Founded 1944• ~ 20,000 students• 5 Nobel Prizes since 1997• Reputation for outstanding scientific research and
interdisciplinary collaboration
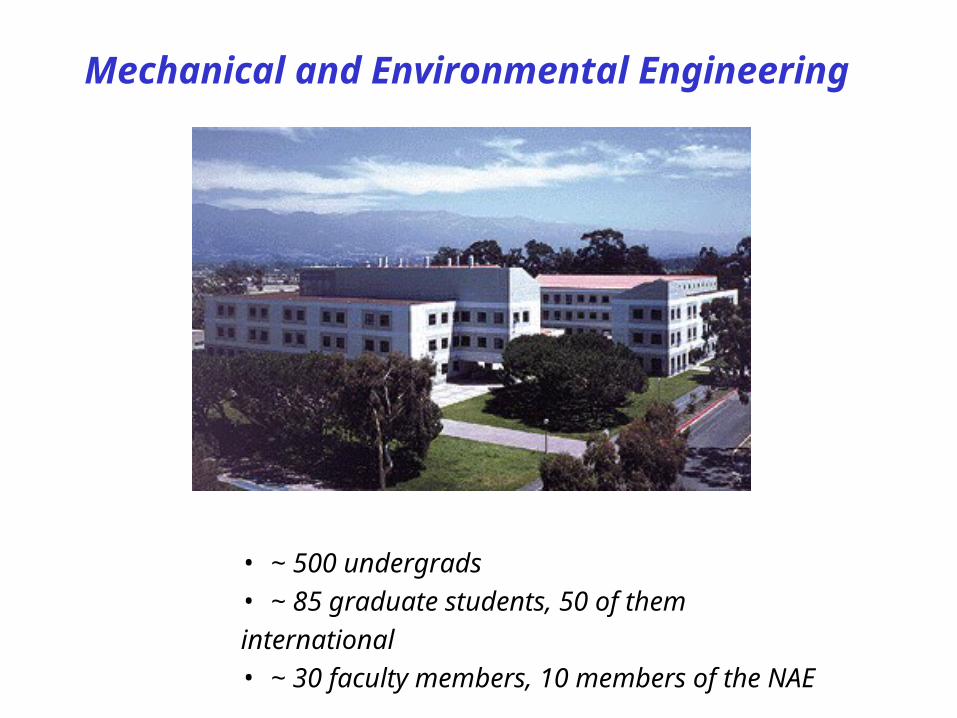
Mechanical and Environmental Engineering
• ~ 500 undergrads• ~ 85 graduate students, 50 of them international• ~ 30 faculty members, 10 members of the NAE
Research Areas
• Computational Science and Engineering
• Dynamics, Control, and Robotics
• Fluids and Thermal Transport
• Microscale and Nanoscale Engineering
• Solid Mechanics, Materials, and Structures
Recommended


![Eckart[Harrison Mag]Ad](https://img.pdfslide.us/doc/110x75/556a8939d8b42ac9298b475f/eckartharrison-magad.jpg)