High Performance Direct Pairwise Comparison of Genomic Sequences
Christopher Mueller, Mehmet Dalkilic, Andrew Lumsdaine
HiCOMB
April 4, 2005
Denver, Colorado
April 4, 2005 High-Performance Direct Pairwise Comparison of Large Genomic Sequences 2
Introduction Goals
Generate data for large format visualization Exploit parallel features present in commodity hardware
SIMD/vector processors SMP/multiple processors per machine Clusters
Genome Comparison Dot plot is the only complete method for comparing genomes Often ruled out due to quadratic running time Size of data has an upper bound and modern hardware is
approaching the point where this bound is (almost) within reach Target Data
DNA sequences, one direction (5’ to 3’) Target Platform
Apple dual processor G5, Altivec vector processor
April 4, 2005 High-Performance Direct Pairwise Comparison of Large Genomic Sequences 3
Related Work
BLAST Apple and Genentech (AGBLAST), 5x speedup using
Altivec Smith-Waterman
Rognes and Seeberg, 6x speedup using MMX HMMER
Erik Lindahl, 30% improvement using Altivec Hardware Solutions
Various commercial FPGA solutions exist for different algorithms (e.g., TimeLogic’s DeCypher platform offers BLAST, HMM, SW)
April 4, 2005 High-Performance Direct Pairwise Comparison of Large Genomic Sequences 4
SIMD Overview
3
2
5
3 2 1 4
2 4 5 9
5 6 6 13
+
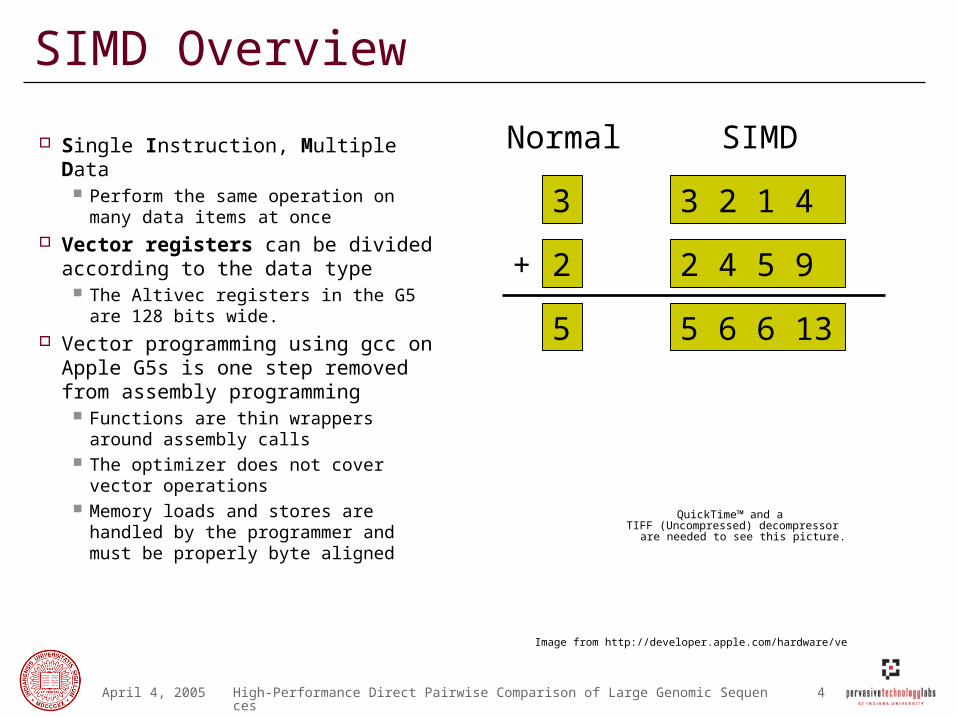
Normal SIMD
QuickTime™ and aTIFF (Uncompressed) decompressor
are needed to see this picture.
Image from http://developer.apple.com/hardware/ve
Single Instruction, Multiple Data Perform the same operation on many
data items at once Vector registers can be divided
according to the data type The Altivec registers in the G5 are 128
bits wide. Vector programming using gcc on
Apple G5s is one step removed from assembly programming
Functions are thin wrappers around assembly calls
The optimizer does not cover vector operations
Memory loads and stores are handled by the programmer and must be properly byte aligned
April 4, 2005 High-Performance Direct Pairwise Comparison of Large Genomic Sequences 5
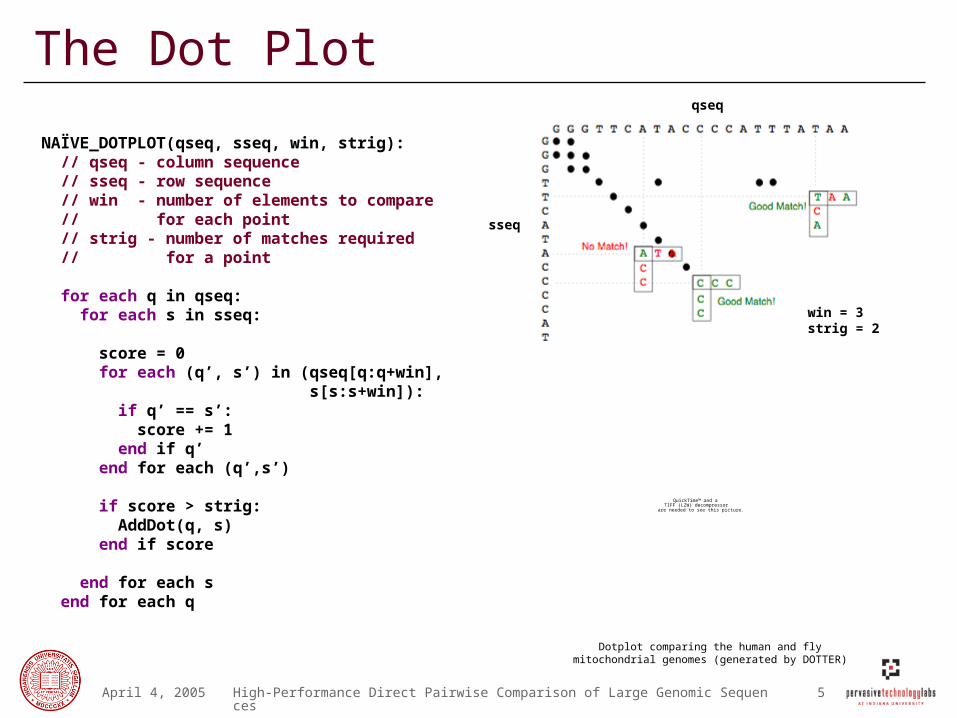
The Dot Plot
QuickTime™ and aTIFF (LZW) decompressor
are needed to see this picture.
Dotplot comparing the human and fly mitochondrial genomes (generated by DOTTER)
NAÏVE_DOTPLOT(qseq, sseq, win, strig): // qseq - column sequence // sseq - row sequence // win - number of elements to compare // for each point // strig - number of matches required // for a point
for each q in qseq: for each s in sseq: score = 0 for each (q’, s’) in (qseq[q:q+win], s[s:s+win]): if q’ == s’: score += 1 end if q’ end for each (q’,s’)
if score > strig: AddDot(q, s) end if score
end for each s end for each q
qseq
sseq
win = 3strig = 2
April 4, 2005 High-Performance Direct Pairwise Comparison of Large Genomic Sequences 6
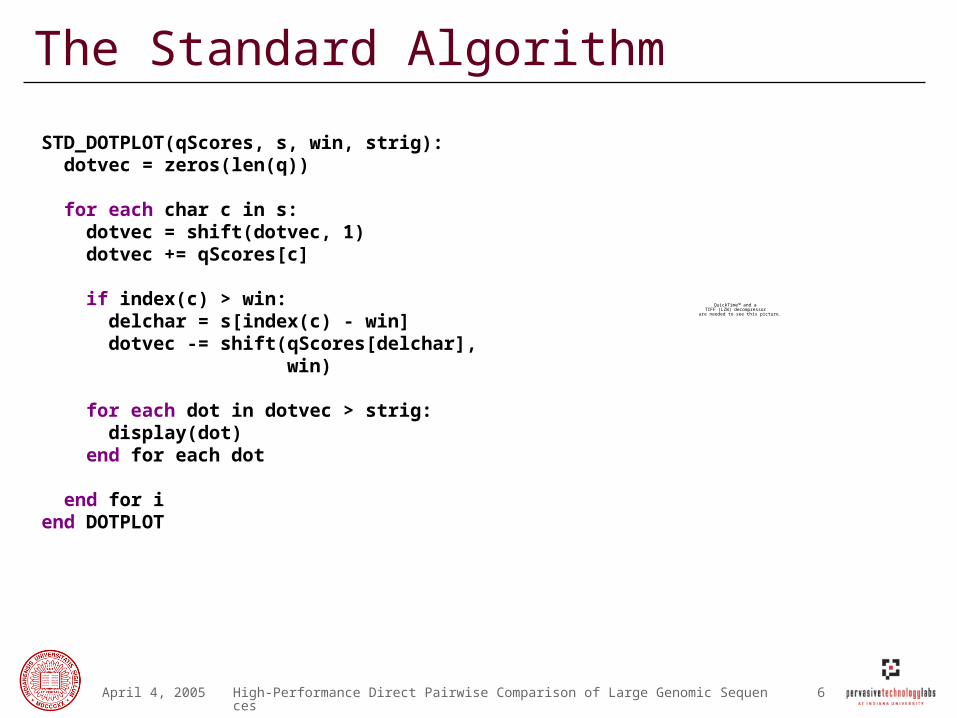
The Standard Algorithm
STD_DOTPLOT(qScores, s, win, strig): dotvec = zeros(len(q))
for each char c in s: dotvec = shift(dotvec, 1) dotvec += qScores[c]
if index(c) > win: delchar = s[index(c) - win] dotvec -= shift(qScores[delchar], win)
for each dot in dotvec > strig: display(dot) end for each dot
end for iend DOTPLOT
QuickTime™ and aTIFF (LZW) decompressor
are needed to see this picture.
April 4, 2005 High-Performance Direct Pairwise Comparison of Large Genomic Sequences 7
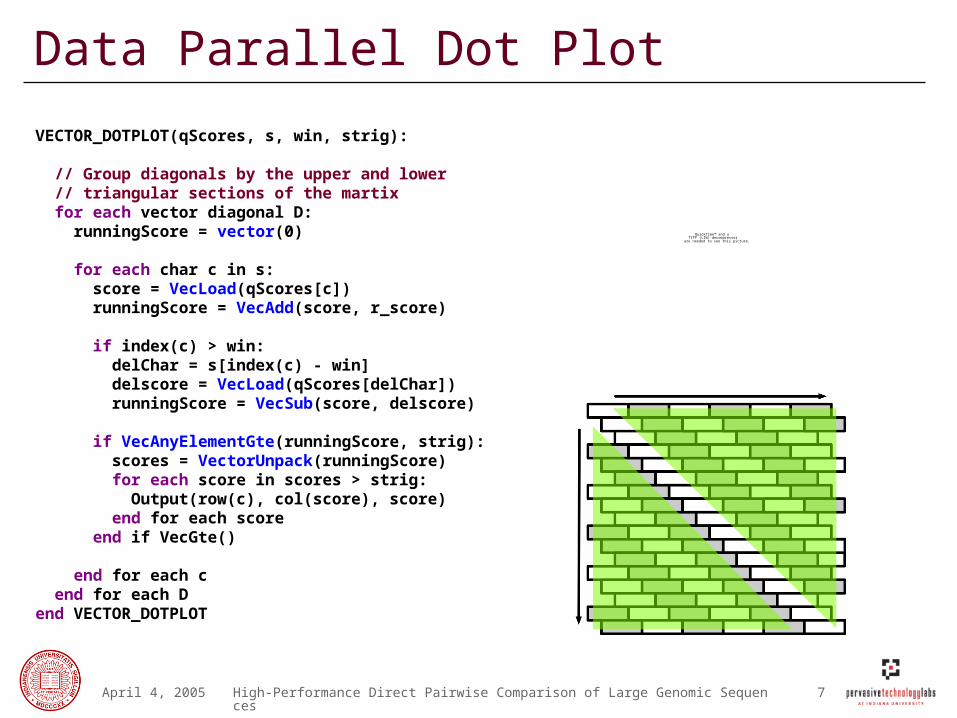
Data Parallel Dot Plot
VECTOR_DOTPLOT(qScores, s, win, strig):
// Group diagonals by the upper and lower // triangular sections of the martix for each vector diagonal D: runningScore = vector(0)
for each char c in s: score = VecLoad(qScores[c]) runningScore = VecAdd(score, r_score)
if index(c) > win: delChar = s[index(c) - win] delscore = VecLoad(qScores[delChar]) runningScore = VecSub(score, delscore)
if VecAnyElementGte(runningScore, strig): scores = VectorUnpack(runningScore) for each score in scores > strig: Output(row(c), col(score), score) end for each score end if VecGte()
end for each c end for each Dend VECTOR_DOTPLOT
QuickTime™ and aTIFF (LZW) decompressor
are needed to see this picture.
April 4, 2005 High-Performance Direct Pairwise Comparison of Large Genomic Sequences 8
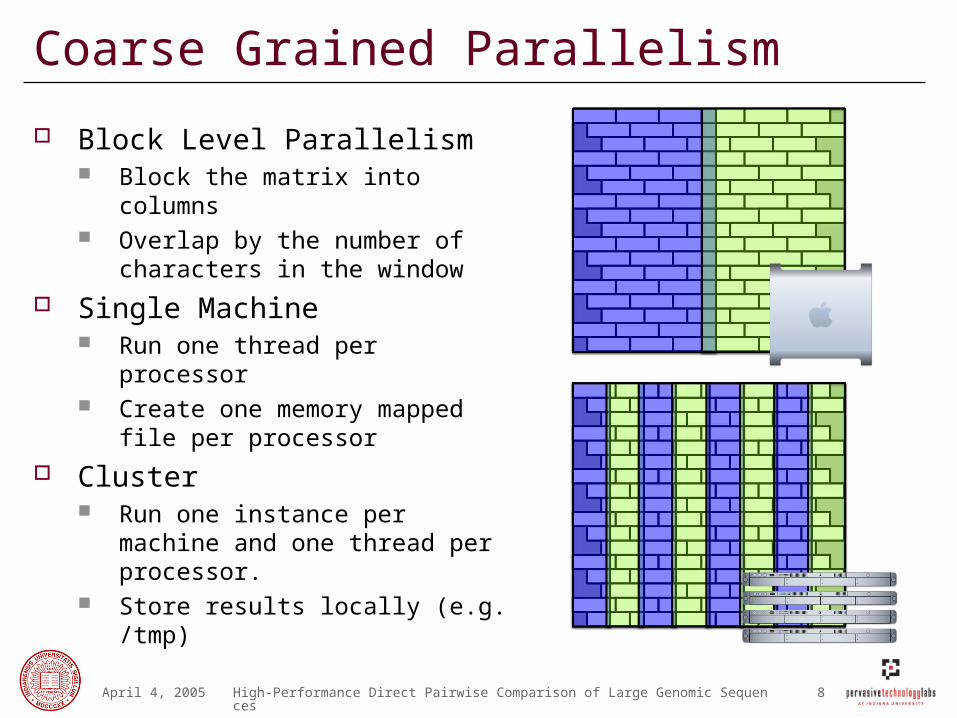
Coarse Grained Parallelism
Block Level Parallelism Block the matrix into columns Overlap by the number of
characters in the window
Single Machine Run one thread per processor Create one memory mapped file
per processor
Cluster Run one instance per machine
and one thread per processor. Store results locally (e.g. /tmp)
April 4, 2005 High-Performance Direct Pairwise Comparison of Large Genomic Sequences 9
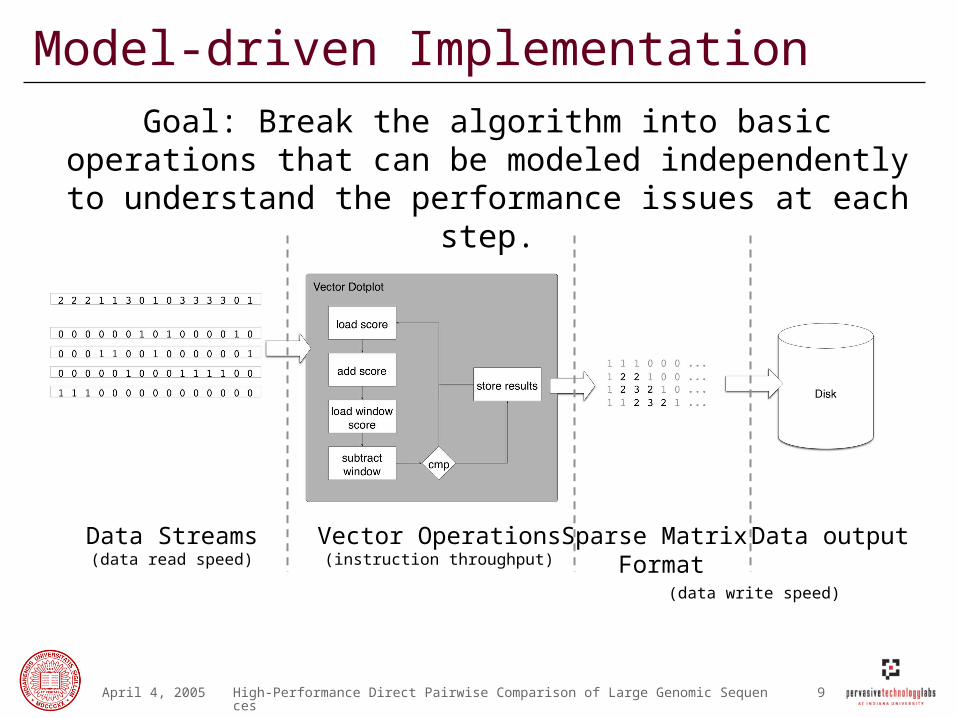
Model-driven Implementation
Goal: Break the algorithm into basic operations that can be modeled independently to understand the performance
issues at each step.
Data Streams(data read speed)
Vector Operations(instruction throughput)
Sparse Matrix Format
Data output
(data write speed)
April 4, 2005 High-Performance Direct Pairwise Comparison of Large Genomic Sequences 10
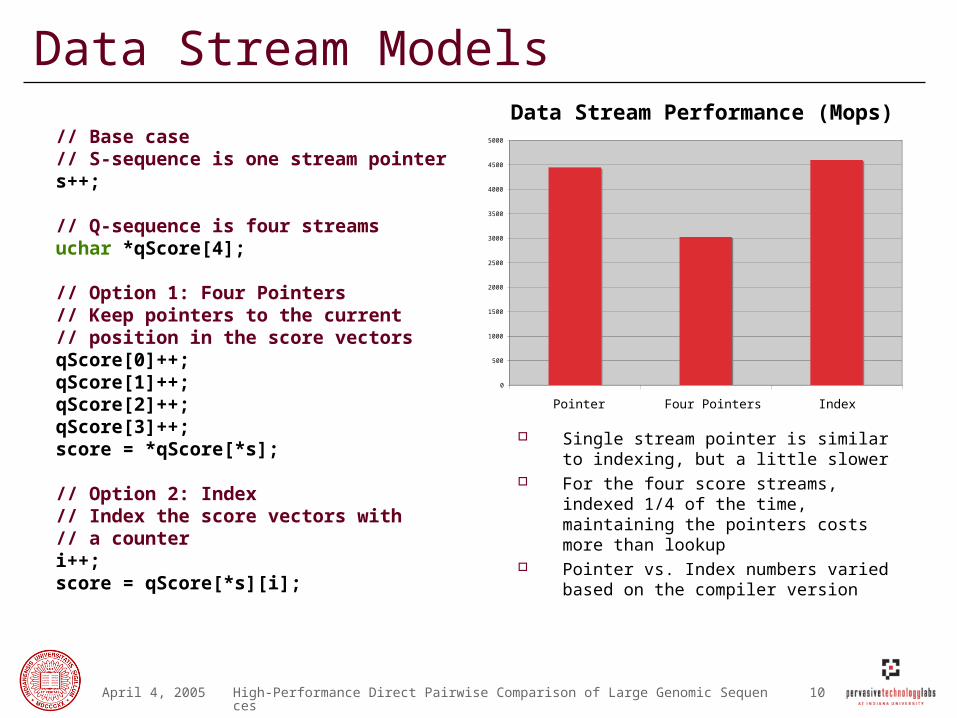
Data Stream Models
Single stream pointer is similar to indexing, but a little slower
For the four score streams, indexed 1/4 of the time, maintaining the pointers costs more than lookup
Pointer vs. Index numbers varied based on the compiler version
// Base case// S-sequence is one stream pointers++;
// Q-sequence is four streamsuchar *qScore[4];
// Option 1: Four Pointers// Keep pointers to the current// position in the score vectorsqScore[0]++;qScore[1]++;qScore[2]++;qScore[3]++;score = *qScore[*s];
// Option 2: Index// Index the score vectors with // a counteri++;score = qScore[*s][i];
0
500
1000
1500
2000
2500
3000
3500
4000
4500
5000
Pointer Four Pointers Index
Data Stream Performance (Mops)
April 4, 2005 High-Performance Direct Pairwise Comparison of Large Genomic Sequences 11
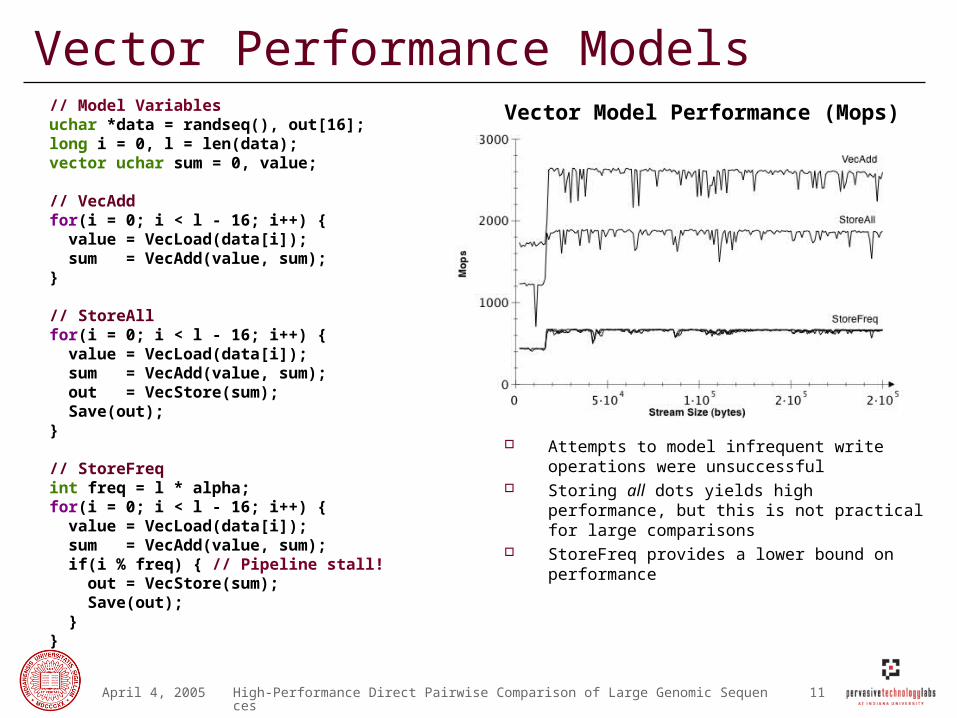
Vector Performance Models
Attempts to model infrequent write operations were unsuccessful
Storing all dots yields high performance, but this is not practical for large comparisons
StoreFreq provides a lower bound on performance
// Model Variablesuchar *data = randseq(), out[16]; long i = 0, l = len(data);vector uchar sum = 0, value; // VecAddfor(i = 0; i < l - 16; i++) { value = VecLoad(data[i]); sum = VecAdd(value, sum);}
// StoreAllfor(i = 0; i < l - 16; i++) { value = VecLoad(data[i]); sum = VecAdd(value, sum); out = VecStore(sum); Save(out);}
// StoreFreqint freq = l * alpha;for(i = 0; i < l - 16; i++) { value = VecLoad(data[i]); sum = VecAdd(value, sum); if(i % freq) { // Pipeline stall! out = VecStore(sum); Save(out); }}
Vector Model Performance (Mops)
April 4, 2005 High-Performance Direct Pairwise Comparison of Large Genomic Sequences 12
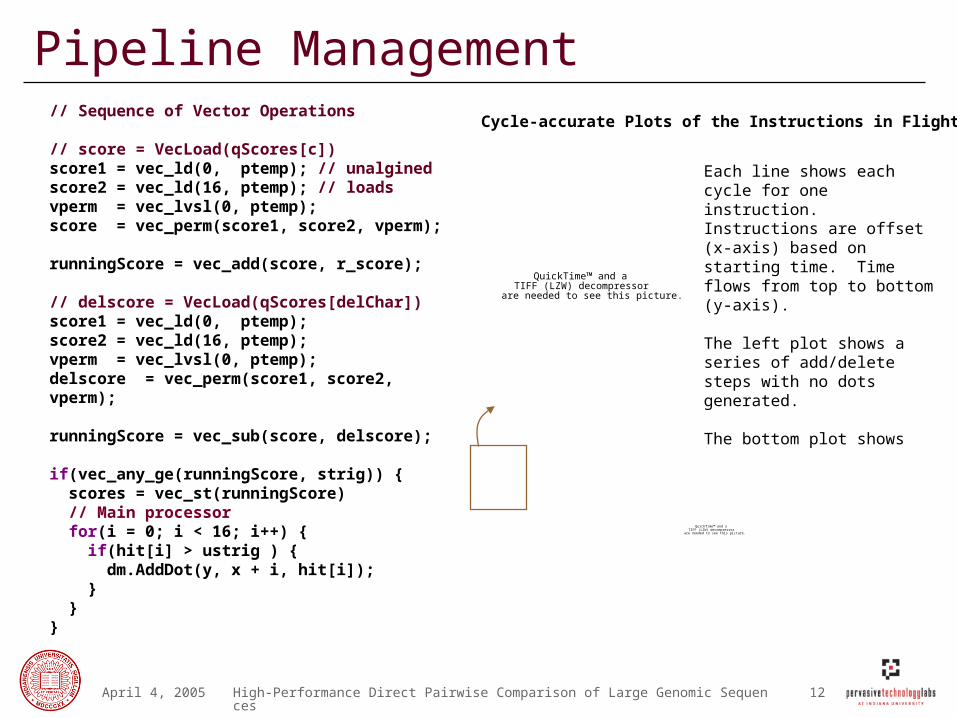
Pipeline Management// Sequence of Vector Operations
// score = VecLoad(qScores[c])score1 = vec_ld(0, ptemp); // unalgined score2 = vec_ld(16, ptemp); // loads vperm = vec_lvsl(0, ptemp); score = vec_perm(score1, score2, vperm);
runningScore = vec_add(score, r_score);
// delscore = VecLoad(qScores[delChar])score1 = vec_ld(0, ptemp); score2 = vec_ld(16, ptemp); vperm = vec_lvsl(0, ptemp); delscore = vec_perm(score1, score2, vperm);
runningScore = vec_sub(score, delscore);
if(vec_any_ge(runningScore, strig)) { scores = vec_st(runningScore) // Main processor for(i = 0; i < 16; i++) { if(hit[i] > ustrig ) { dm.AddDot(y, x + i, hit[i]); } }}
QuickTime™ and aTIFF (LZW) decompressor
are needed to see this picture.
Each line shows each cycle for one instruction. Instructions are offset (x-axis) based on starting time. Time flows from top to bottom (y-axis).
The left plot shows a series of add/delete steps with no dots generated.
The bottom plot shows the pipeline being interrupted when a dot is generated.
QuickTime™ and aTIFF (LZW) decompressor
are needed to see this picture.
Cycle-accurate Plots of the Instructions in Flight
April 4, 2005 High-Performance Direct Pairwise Comparison of Large Genomic Sequences 13
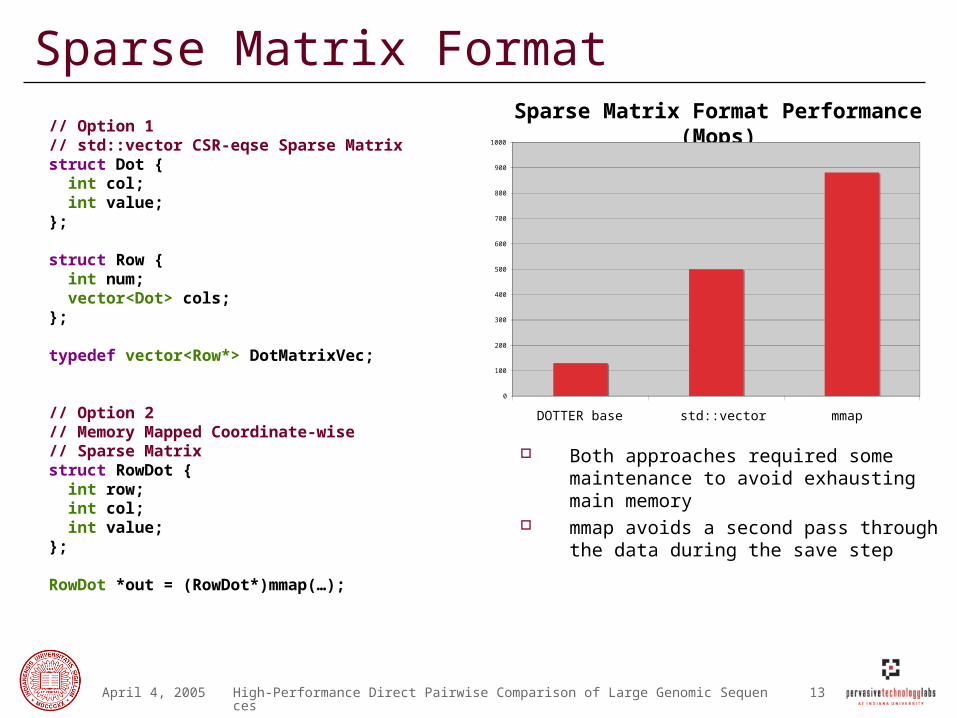
Sparse Matrix Format// Option 1// std::vector CSR-eqse Sparse Matrixstruct Dot { int col; int value;};
struct Row { int num; vector<Dot> cols;};
typedef vector<Row*> DotMatrixVec;
// Option 2// Memory Mapped Coordinate-wise// Sparse Matrixstruct RowDot { int row; int col; int value;};
RowDot *out = (RowDot*)mmap(…);
Sparse Matrix Format Performance (Mops)
Both approaches required some maintenance to avoid exhausting main memory
mmap avoids a second pass through the data during the save step
3.85x
6.78x
1.0x
0
100
200
300
400
500
600
700
800
900
1000
DOTTER base std::vector mmap
April 4, 2005 High-Performance Direct Pairwise Comparison of Large Genomic Sequences 14
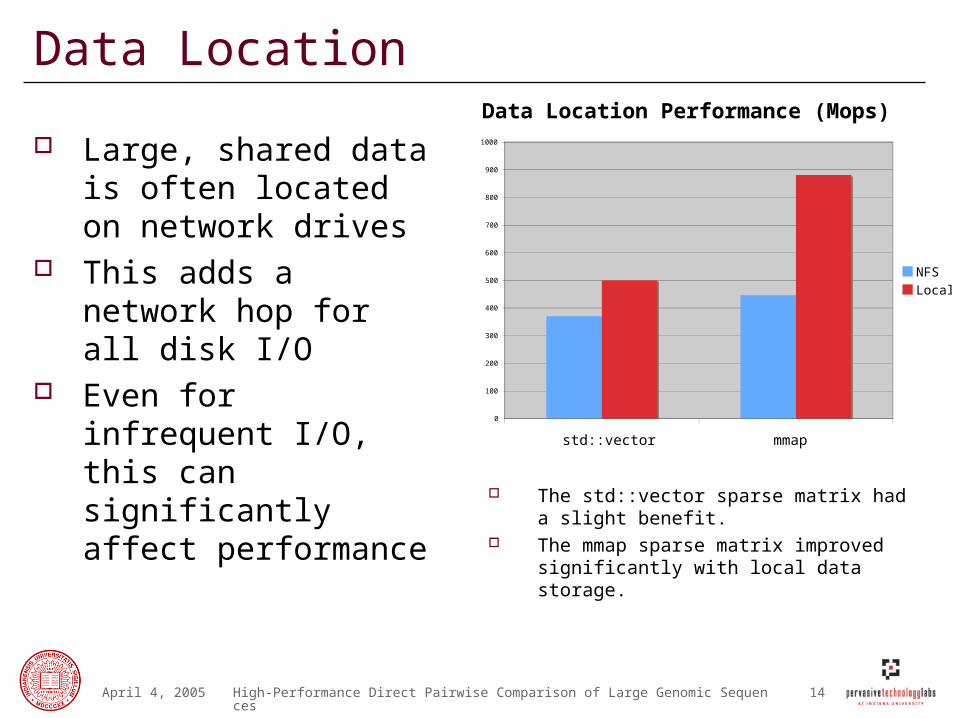
Data Location
Large, shared data is often located on network drives
This adds a network hop for all disk I/O
Even for infrequent I/O, this can significantly affect performance
Data Location Performance (Mops)
The std::vector sparse matrix had a slight benefit.
The mmap sparse matrix improved significantly with local data storage.
1.0x1.0x
1.35x
1.98x
0
100
200
300
400
500
600
700
800
900
1000
std::vector mmap
NFSLocal
April 4, 2005 High-Performance Direct Pairwise Comparison of Large Genomic Sequences 15
Traditional Manual Optimizations
Prefetch G5 hardware prefetch is very good Attempts to optimize had negative impact
Blocking Slight negative impact due to burps in the stream
Unrolling Complicated code very quickly No measurable improvement
April 4, 2005 High-Performance Direct Pairwise Comparison of Large Genomic Sequences 16
System Details Apple Dual 2.0 GHz G5, 3.5 GB RAM 100 Mbit network to file server OS X 10.3.5 (Darwin Kernel Version 7.5.0) g++ 3.3 (build 1620)
-O3 -fast (different compiler, aggressive optimizations) -altivec (limited optimizations) Upgrade from 1614 to 1620 improved DOTTER’s performance
by 30% Libraries
Boost::thread Data (from GenBank)
Mitochondrial genomes E. Coli, Listeria bacterial genomes
April 4, 2005 High-Performance Direct Pairwise Comparison of Large Genomic Sequences 17
0
200
400
600
800
1000
1200
1400
1600
1800
2000
DOTTER (1 CPU) Data-parallel,mitochondrial (1 CPU)
Data-parallel,mitochondrial (2 CPU)
Data-parallel, bacterial(2 CPU)
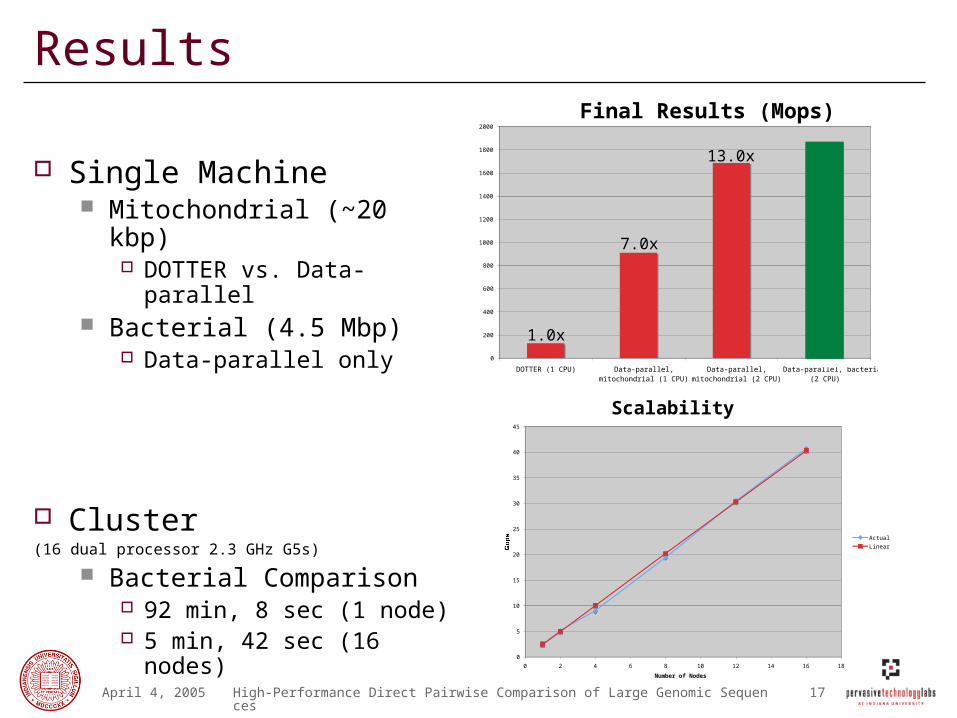
Results
Single Machine Mitochondrial (~20 kbp)
DOTTER vs. Data-parallel Bacterial (4.5 Mbp)
Data-parallel only
Cluster (16 dual processor 2.3 GHz G5s)
Bacterial Comparison 92 min, 8 sec (1 node) 5 min, 42 sec (16 nodes)
Final Results (Mops)
7.0x
13.0x
Scalability (time/nodes)
0
5
10
15
20
25
30
35
40
45
0 2 4 6 8 10 12 14 16 18
Number of Nodes
Gops
Actual
Linear
1.0x
Scalability
April 4, 2005 High-Performance Direct Pairwise Comparison of Large Genomic Sequences 18
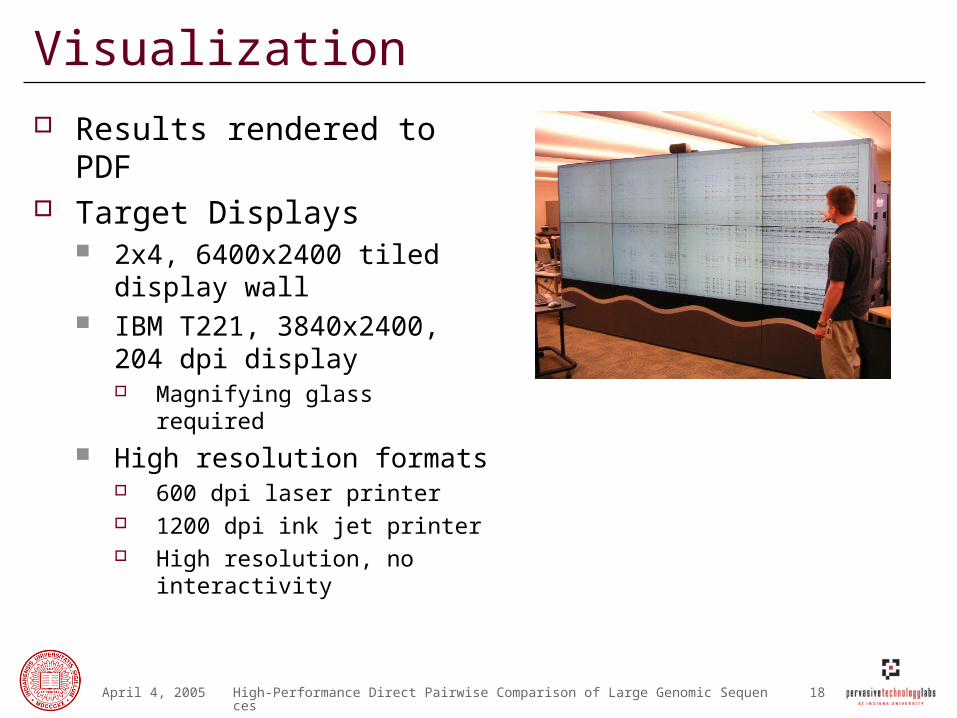
Visualization
Results rendered to PDF Target Displays
2x4, 6400x2400 tiled display wall
IBM T221, 3840x2400, 204 dpi display Magnifying glass required
High resolution formats 600 dpi laser printer 1200 dpi ink jet printer High resolution, no
interactivity
April 4, 2005 High-Performance Direct Pairwise Comparison of Large Genomic Sequences 19
Conclusions
Modern commodity hardware is close to providing the performance necessary for large direct genomic comparisons. 5,000,000 base pair sequences are realistic (bacteria) 50,000,000 base pair sequences are possible (small
human chromosomes) It is important to take a careful, experimental
approach to implementation and to test all assumptions.
April 4, 2005 High-Performance Direct Pairwise Comparison of Large Genomic Sequences 20
Acknowledgements
Jeremiah Willcock helped develop the initial prototype Eric Wernert, Craig Jacobs, and Charlie Moad from the
UITS Advanced Visualization Lab at Indiana University provided visualization support
This work was supported by a grant from the Lilly Endowment
ReferencesApple Developer’s Connection, Velocity Engine and Xcode, from, Apple Developer Connection, Cupertino, CA, 2004.
http://developer.apple.com/hardware/ve http://developer.apple.com/tools/xcode
A. J. Gibbs and G. A. McIntyre, The diagram, a method for comparing sequences. Its use with amino acid and nucleotide sequences, Eur J Biochem, 16 (1970), pp. 1-11.
E. L. L. Sonnhammer and R. Durbin, A Dot-Matrix Program with Dynamic Threshold Control Suited for Genomic DNA and Protein-Sequence Analysis, Gene-Combis, 167 (1995), pp. 1-10.
Recommended


![Color Demosaicing in Plenoptic Cameras - Todor Georgievtgeorgiev.net/Demosaicing.pdf · 2012. 4. 4. · Lytro [22]. Lumsdaine et al. [21] introduced another design by fo-cusing the](https://img.pdfslide.us/doc/110x75/6021f9801d890254bd43dbae/color-demosaicing-in-plenoptic-cameras-todor-2012-4-4-lytro-22-lumsdaine.jpg)
