Vol. No. 6 Issue No. 10
Average assets under management for April 2009: Rs. 63,880.63 Crore
April 2009
Hit a home run
hdfc-cov-apr-09.qxd 5/7/2009 8:24 PM Page 1

2 April 2009 Intouchmutually
The equity markets continued to rally in April as
the global economy showed signs of stabilizing
fueling optimism that the worst is behind us.
Coordinated global efforts have injected an unprece-
dented amount of liquidity into the system. Not sur-
prisingly, some of this has found its way into the equi-
ty markets. Furthermore, corporate results both in
India and abroad have been more resilient than expec-
tations. At the same time the market seems to have
come to terms with a fractious outcome to the current
election. As a result of a combination of these factors,
markets across the world have rallied. The Indian mar-
kets outperformed most of its Asian peers with the
Sensex up 17.5%, Nifty up 15% and the CNX Midcap
Index up 13.3% for the month.
Globally, the rally enveloped both developed and
emerging equity markets as well as the commodity
arena. The Dow Jones was up 7.4%, NASDAQ up
12.4%, DAX up 16.8%, CAC up 12.6% and the FTSE
up 8.1% for the month. Asian markets were also pos-
itive, with the Nikkei up 6.9%, Hang Seng up 14.1%,
Kospi up 11%, Shanghai up 3.2%, Indonesia up 19%
and Taiwan up 13%. Along with equity markets, com-
modity prices also rallied: Copper was up 9.7%,
Aluminum up 10.3%, Zinc up 10.4% and Lead up
5.8%. Gold was down 3.4% and closed down at USD
888.20/kilo as investor moved away from this safe
haven, a further indication that some risk appetite has
returned. Crude was at USD51.12/barrel, up 2.9%
from the previous month.
On the liquidity front, April 2009 was the best
month in the past one year, and was comparable to the
best months in 2006 and 2007, when the sentiment
was very positive. FIIs were net buyers of USD1.3bn,
whereas domestic mutual funds were net sellers of
INR 0.3bn for the month of April.
Domestic economic data released this month was
mixed. On one hand, industrial production continued
to be weak and the IIP was down 1.2% for February.
On the other hand though, there were some scattered
signs that pointed towards a recovery in economic
activity. Growth in the six infrastructure sectors rose
to a six-month high of 2.9%. Automobile sales and
railway freight were also supporting indicators. The
RBI continued to provide impetus to growth by cut-
ting the repo and the reverse repo rates by 25bps
which signals that rates are likely to fall further.
Going forward, the outcome of the ongoing
General Elections will obviously be important particu-
larly as the newly formed government will have to take
some quick decisions to support economic activity and
initiate much needed reforms. Needless to say, specu-
lating on the outcome of such a close election is
extremely difficult. Additionally, on the global news
front, the result of the stress test of major US Financial
institutions and other policy action will also play an
important role. While there could be a knee jerk reac-
tion to the election result, once that is past us the focus
is likely to return to economic fundamentals both in
India and overseas. Fortunately, the initial signs of sta-
bilization are encouraging but we need to track eco-
nomic data closely in order to gain confidence that the
positive momentum will continue. With the markets
having rallied almost 50% from its lows, finding oppor-
tunities has become relatively more challenging and
therefore we feel even more strongly that the key is to
remain disciplined and focused on well-managed busi-
nesses that can deliver superior long-term results. �
Equity market update
The yields in the debt markets decreased during
the month of April. The yield on the 10-year
Government Security fell to 6.23%, a decrease
of 0.78% over March 2009.
The stock of liquidity (LAF + MSS + Surplus cash
held by center) remains comfortable. The average LAF
during the month was Rs.103,727 crs, which is sub-
stantially higher than the average of Rs. 36,420 crs in
the previous month. The NSE overnight MIBOR
ended at 3.31% lower than the rate seen in end March.
In April, WPI inflation moved up to 0.57% com-
pared to 0.26% at the end of March 2009. INR appre-
ciated to 50.09 as compared to 50.73 at end of previ-
ous month. Net FII investment in equities & debt was
an inflow of USD 1790.50 million in April compared
to an outflow of USD 1152.20 million in March.
RBI in its annual monetary policy statement on
21st April 2009 cut the Reverse Repo and Repo rate by
25 bps to 3.25% and 4.75% respectively. Liquidity is
expected to remain comfortable going forward. After
a decent rally in the fixed income markets across all
types of securities, markets may pause and wait for the
election results before taking any direction. The Fund
continues to position itself in instruments and maturity
buckets that provide higher relative value in an attempt
to deliver superior risk adjusted returns. �
Debt market update
Market Review
hdfc-mkt1:hdfc-mkt1.qxd 5/7/2009 08:08 PM Page 1

April 2009 3Intouchmutually
In the last two months, things have changedquite sharply for the potential homebuyers.For one, developers have officially started
announcing price reductions. And even banks,mainly in the public sector, have started cuttingrates aggressively.
For instance, the country’s largest bank,State Bank of India (SBI) has reduced its homeloan rates to 8 per cent for one year. This can beavailed up to September 30.
Other public sector banks (PSBs) arealready offering special rates under a schemeannounced in December. The interest rate onhome loans up to Rs 5 lakh is fixed at 8.5 percent and for those between Rs 5 lakh and Rs 20lakh at 9.25 per cent, along with free insurance.
Even the private sector banks have respond-ed, but not as aggressively.
Property developers are already on a price-cutting mode. Rajiv Singh, who heads the coun-try’s biggest real estate company DLF, hasrecently said that there is a ‘virtual shutdown’ inthe real estate market. In tandem with the mar-ket’s performance, DLF plans to reduce 15 percent prices across markets. The company is alsoexpected to launch a residential project in WestDelhi at 50 per cent of the prevailing price.
Unitech, the country’s second largest realestate player, too plans discount in Kolkata andDelhi NCR. Mumbai-based Orbit Corporationhas also announced 20 per cent discount in pre-mium projects such as Orbit Grande and OrbitEternia as it sees a correction of 20-30 per centin South and Central Mumbai.
Given this backdrop, should one purchaseproperty now?
According to Harsh Roongta, chief execu-tive officer, apnapaisa.com, an online loan por-tal the interest rate scenario is likely to bebenign for some time. So, one should not beinfluenced too much by the fall in rates.
Even if public sector banks (PSBs) do notreduce their rates, private sector lenders coulddo so. “Another rate cut is likely by June-end.This will evidently affect home loan rates,” saysSonal Varma, India economist at Nomura.
Though most believe that property priceswould fall further, but many think that withbuilders becoming more proactive, there couldbe some bottoming out by June-end. In manyareas, prices have dropped to their late 2005 orearly 2006 levels. These include, Gurgaon andNoida in Delhi, Whitefield in Bangalore anddistant suburbs of Mumbai such as Kandivali,
Malad, Thane and Navi Mumbai.However, the reality is that though things
look better now, buyers are not actually tookeen. The reason: Fears of job losses due to theglobal recession. “Despite the package, buyerinterest has been quite low,” says SC Jain, gen-eral manager (retail), Bank of India.
Also, though rates have been cut, bankersare exercising more prudence. Though PSBs areoffering lower rates, the margin money that onehas to cough out now is much more. Earlier,banks would happily lend 80-90 per cent of theproperty price. Many private sector banks evengave over 100 per cent loans for furnishing thehome. Today, you would have to pay 20-30 percent of the margin money because banks fearthat property prices could correct further. Theeligibility criterion is also stricter. Many bankswould reject the loan application if you have anexisting personal loan or credit card defaults. Ifyou have delayed repayment of an ongoingloan, there are chances your loan will not besanctioned.
Given all these factors, the bottom line isthat things are definitely much better. But indi-cations of further correction in property pricesand the fact that more margin money will haveto be paid now, you could wait some more.
However, if you need to buy andhave already found a house thatfits your budget, this could be agood opportunity to get the bestdeal. For instance, you canconvince the builder to waiveoff the floor rise, get free parking and other amenities. “All these will add up to much big-ger discount,” says Ramesh TJogani, managing director,Indiareit Fund Advisors, a realestate fund.
But be cautious. Expertsexpect that under-construc-tion projects will bedelayed and even scrappedif some developers don’tget funding in time. Go forreadymade products only orprojects that are near completion.Stay away from schemes thatrequire more than three months for completion. ●
TINESH BHASIN
With both property prices and interest rates falling sharply, does it make sense to buy a house now?
Hit a home run
hdfc-edit:hdfc-edit.qxd 5/7/2009 08:10 PM Page 1

NNaattuurree ooff SScchheemmee
IInnvveessttmmeenntt OObbjjeeccttiivvee
FFuunndd MMaannaaggeerr
IInncceeppttiioonn DDaattee((DDaattee ooff AAlllloottmmeenntt))
EEnnttrryy // SSaalleess LLooaadd((NNoonn--SSIIPP // SSTTPP))
EExxiitt LLooaadd((NNoonn--SSIIPP // SSTTPP))
IInnvveessttmmeennttPPllaann // OOppttiioonnss
MMiinniimmuumm AApppplliiccaattiioonn AAmmoouunntt((UUnnddeerr eeaacchh PPllaann))
LLoocckk--iinn PPeerriioodd
NNeett AAsssseett VVaalluuee((NNAAVV))
RReeddeemmppttiioonnPPrroocceeeeddss
HDFC Growth
Fund
Open-ended GrowthScheme
To generate long termcapital appreciationfrom a portfolio that is invested predominantly in equity and equity related instruments.
Srinivas Rao Ravuri(since Apr 3, 06)
September 11, 2000
Growth & Dividend
Nil
Every Business Day
Normally despatchedwithin 3 BusinessDays.
HDFC Equity
Fund
Open-endedGrowth Scheme
To achieve capital appreciation.
Prashant Jain(since Jun 19, 03)*
January 1, 1995
Growth & Dividend
Nil
Every Business Day
Normallydespatched within3 Business Days.
HDFC Top 200
Fund
Open-ended Growth Scheme
To generate long term capital appreciation from aportfolio of equity and equity-linked instrumentsprimarily drawn from thecompanies in BSE 200index.
Prashant Jain(since Jun19, 03)*
October 11, 1996
Growth & Dividend
Nil
Every Business Day
Normally despatched within3 Business Days.
HDFC Capital
Builder Fund
Open-endedGrowth Scheme
To achieve capital appreciation in the long term.
Chirag Setalvad(since Apr 2, 07)
February 1, 1994
Growth & Dividend
Nil
Every Business Day
Normallydespatched within3 Business Days.
HDFC Core & Satellite
Fund
Open-ended GrowthScheme
To generate capital appreciation through equity investment in companies whose sharesare quoting at prices belowtheir true value.
Vinay Kulkarni(since Nov 21, 06)
September 17, 2004
Growth & Dividend
Nil
Every Business Day
Normally despatched within 3 Business Days.
HDFC Premier
Multi-Cap Fund
Open-ended Growth Scheme
To generate capital appreciation in the long term through equity investments by investing in a diversified portfolio of Mid Cap & Large Cap‘blue chip’ companies.
Vinay Kulkarni(since Nov 21, 06)
April 6, 2005
Growth & Dividend
Nil
Every Business Day
Normally despatchedwithin 3 Business Days.
Applications routed through any Distributor/Agent/Broker:● In respect of eeaacchh purchase / switch-in of Units less than Rs. 5 crore in value, an Entry Load of 2.25% is payable.● In respect of eeaacchh purchase / switch-in of Units equal to or greater than Rs. 5 Crore in value, no Entry Load is payable.Applications not routed through any Distributor/Agent/Broker (Direct Applications): Nil
Purchase : Rs. 5,000 and any amount thereafter.
Additional Purchase : Rs. 1,000 and any amount thereafter.
The Dividend Plan / Option offers Dividend Payout and Reinvestment facility.
Investors are advised to consult their tax advisors with respect to the tax consequences of the purchase, ownership and disposal of mutual fund units.
For Tax Benefits / Consequences, Please refer to page 9
* Date of migration from Zurich India Mutual Fund
● In respect of eeaacchh purchase / switch-in of Units less than Rs. 5 Crore in value, an Exit Load of 1% is payable if units are redeemed / switched-outwithin 1 year from the date of allotment.
● In respect of eeaacchh purchase / switch-in of Units equal to or greater than Rs. 5 Crore in value, no Exit Load is payable.
No Entry/Exit Load shall be levied on bonus units and units allotted on dividend reinvestment.
Features of our following schemes
Intouchmutually4 April 2009
hdfc-fos.qxd 5/7/2009 8:19 PM Page 1
NNaattuurree ooff SScchheemmee
IInnvveessttmmeenntt OObbjjeeccttiivvee
FFuunndd MMaannaaggeerr
IInncceeppttiioonn DDaattee((DDaattee ooff AAlllloottmmeenntt))
EEnnttrryy // SSaalleess LLooaadd((NNoonn--SSIIPP // SSTTPP))
EExxiitt LLooaadd((NNoonn--SSIIPP // SSTTPP))
IInnvveessttmmeennttPPllaann // OOppttiioonnss
MMiinniimmuumm AApppplliiccaattiioonn AAmmoouunntt((UUnnddeerr eeaacchh PPllaann))
LLoocckk--iinn PPeerriioodd
NNeett AAsssseett VVaalluuee((NNAAVV))
RReeddeemmppttiioonnPPrroocceeeeddss
HDFC Children’s Gift Fund^#
Open-ended Balanced Scheme
The primary objective of both the Plans viz.Investment Plan & Savings Plan under theScheme is to generate long term capital appreciation.
Chirag Setalvad (since April 2, 07)
March 2, 2001
Applications routed through any Distributor/Agent/Broker: IInnvveessttmmeenntt PPllaann:: 2.25%; SSaavviinnggss PPllaann:: 1.25%Applications not routed through any Distributor/Agent/Broker (Direct Applications): Nil
● For Units subject to Lock-in Period: NIL● For Units not subject to Lock-in Period: 3%
if the Units are redeemed / switched-out within one year from the date of allotment;2% if the Units are redeemed / switched-outbetween the first and second year of thedate of allotment; 1% if Units are redeemed/ switched-out between the second andthird year of the date of allotment; Nil if theUnits are redeemed / switched -out afterthird year from the date of allotment.
No Entry/Exit Load shall be levied on bonus units
IInnvveessttmmeenntt PPllaann :: ((Equity Oriented)SSaavviinnggss PPllaann :: ((Debt Oriented)
Purchase : Rs. 5,000 and any amount thereafter.Additional Purchase : Rs. 1,000 and anyamount thereafter.
IIff oopptteedd :: Until the Unit holder (being the beneficiary child) attains the age of 18 years or until completion of 3 years from date ofallotment, whichever is later.
Every Business Day
Normally despatched within 3 Business Days(subject to completion of Lock-in Period, if opted).
HDFC Arbitrage Fund
Open ended Equity Fund
To generate income through arbitrage opportunitiesbetween cash and derivative market and arbitrageopportunities within the derivative segment and bydeployment of surplus cash in debt securities and money market instruments.
Anil Bamboli (since Oct 23, 07)
October 23, 2007
● In respect of eeaacchh purchase/switch-in of units, an Exit load of 0.50% is payable if units are redeemed /switched-out within 3 months from the date of allotment.
● No Exit Load is payable if units are redeemed /switched-out after 3 months from the date of allotment.
No Entry/Exit Load shall be levied on bonus units and units allotted on dividend reinvestment.
Wholesale Plan and Retail Plan - Both Plan offers Dividend and Growth Option. Dividend Option offersQuarterly Dividend Option with Payout and Reinvestment Facility.
Wholesale Plan: Purchase / Additional Purchase :Rs. 1 Crore and any amount thereafter.Retail Plan: Purchase / Additional Purchase : Growth / Quaterly Dividend Option: Rs. 5,000 and anyamount thereafter.
Nil
Every Business Day
Normally despatched within 3 Business days.
^̂ EElliiggiibbiilliittyy ((ooff UUnniitt hhoollddeerr)) :: Children less than 18 years of age as on the date of investment by the Investor / Applicant are eligible as Unit holders in the Scheme. ## Personal Accident Insurance Cover (for resident Unit holders only), equivalentto 10 times the face value of Units held by the Unit holder under all the applications / account statements / folios, subject to a maximum amount of Rs. 3 lakhs per Unit holder. The insurance premium in respect of the personal accident insurancecover will be borne by the AMC. This accident insurance cover is subject to conditions of the group personal accident insurance policy. Investors are advised to consult their tax advisors with respect to the tax consequences of the purchase, ownership and disposal of mutual fund units.
For Tax Benefits / Consequences, Please refer to page 9
HDFC Index Fund
Open-ended Index Linked Scheme
NNiiffttyy PPllaann :: To generate returns that arecommensurate with the performance ofthe Nifty, subject to tracking errors.SSEENNSSEEXX PPllaann :: To generate returns that arecommensurate with the performance of the SENSEX, subject to tracking errors.SSEENNSSEEXX PPlluuss PPllaann :: To invest 80 to 90% ofthe net assets of the Plan in companieswhose securities are included in SENSEX and between 10% & 20% of the net assets incompanies whose securities are not included in the SENSEX.
Vinay Kulkarni (since Dec 29, 06)
July 17, 2002
● In respect of eeaacchh purchase / switch-in ofUnits upto and including Rs. 5 lakh invalue, an Exit Load of 1.00% is payable ifUnits are redeemed within one year fromthe date of allotment.
● In respect of eeaacchh purchase / switch-in ofUnits greater than Rs. 5 lakh in value, noExit Load is payable.
No Entry/Exit Load shall be levied on bonus units
Nifty Plan, SENSEX Plan, SENSEX Plus PlanAt present, each Plan offers Growth Optiononly.
Purchase : Rs. 5,000 and any amount thereafter.Additional Purchase : Rs. 1,000 and anyamount thereafter.
Nil
Every Business Day
Normally despatched within3 Business Days.
Direct Applications and Applications routed through any Agent/Distributor/Broker : Nil
Features of our following schemes
Intouchmutually April 2009 5
hdfc-fos.qxd 5/7/2009 8:19 PM Page 2
Intouchmutually6 April 2009
NNaattuurree ooff SScchheemmee
IInnvveessttmmeenntt OObbjjeeccttiivvee
FFuunndd MMaannaaggeerrss
IInncceeppttiioonn DDaattee((DDaattee ooff AAlllloottmmeenntt))
EEnnttrryy // SSaalleess LLooaadd((NNoonn--SSIIPP // SSTTPP))
EExxiitt LLooaadd((NNoonn--SSIIPP // SSTTPP))
IInnvveessttmmeennttPPllaann // OOppttiioonnss
MMiinniimmuumm AApppplliiccaattiioonn AAmmoouunntt
LLoocckk--iinn PPeerriioodd
NNeett AAsssseett VVaalluuee((NNAAVV))
RReeddeemmppttiioonnPPrroocceeeeddss
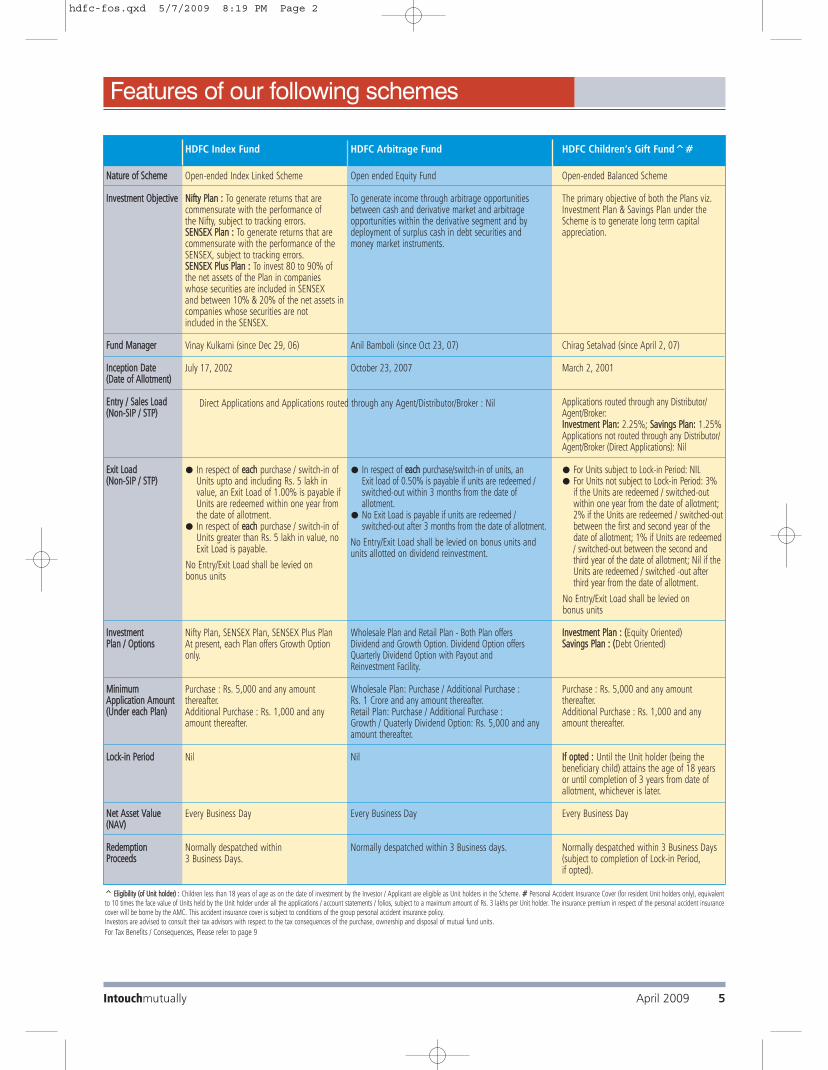
Investors are advised to consult their tax advisors with respect to the tax consequences of the purchase, ownership and disposal of mutual fund units. # Previously HDFC Tax Plan 2000For Tax Benefits / Consequences, Please refer to page 9
* Date of migration from Zurich India Mutual Fund
HDFC Balanced Fund
Open-ended Balanced Scheme
To generate capital appreciationalong with current income from a combined portfolio of equity &equity-related and debt & moneymarket instruments.
Chirag Setalvad (since April 2, 07)
September 11, 2000
● In respect of eeaacchh purchase /switch-in of Units less than Rs. 5 Crore in value, an ExitLoad of 1% is payable if unitsare redeemed / switched-outwithin 1 year from the date of allotment.
● In respect of eeaacchh purchase /switch-in of Units equal to orgreater than Rs. 5 Crore invalue, no Exit Load is payable.
Growth & Dividend
Nil
Every Business Day
Normally despatched within 3 Business Days.
HDFC Prudence Fund
Open-ended Balanced Scheme
To provide periodic returns and capital appreciation over a longperiod of time from a judicious mixof equity and debt investments withan aim to prevent / minimise anycapital erosion.
Prashant Jain (since Jun 19, 03)*
February 1, 1994
● In respect of eeaacchh purchase /switch-in of Units less than Rs. 5 Crore in value, an ExitLoad of 1% is payable if unitsare redeemed / switched-outwithin 1 year from the date of allotment.
● In respect of eeaacchh purchase /switch-in of Units equal to orgreater than Rs. 5 Crore invalue, no Exit Load is payable.
Growth & Dividend
Nil
Every Business Day
Normally despatched within 3 Business Days.
HDFC Long Term AdvantageFund #
Open-ended Equity Linked SavingsScheme with a lock-in period of 3 years
To generate long term capital appreciation from a portfolio that is invested predominantly in equity and equity-related instruments.
Chirag Setalvad (since April 2, 2007)
January 2, 2001
Nil
Growth & Dividend
Every Business Day
HDFC TaxSaver
Open-ended Equity Linked SavingsScheme with a lock-in period of 3 years
To achieve long term growth of capital.
Vinay Kulkarni (since Nov 21, 2006)
March 31, 1996
Nil
Growth & Dividend
Every Business Day
3 years from the date of allotment of the respective Units
Normally despatched within 3 Business Days (subject to completionof Lock-in Period).
The Dividend Plan offers Dividend payout and Reinvestment facility.
No Entry/Exit Load shall be levied on bonus units and units allotted on dividend reinvestment.
Applications routed through any Distributor/Agent/Broker:● In respect of eeaacchh purchase / switch-in of Units less than Rs. 5 crore in value, an Entry Load of 2.25% is payable.● In respect of eeaacchh purchase / switch-in of Units equal to or greater than Rs. 5 crore in value, no Entry Load is payable.Applications not routed through any Distributor/Agent/Broker (Direct Applications): Nil
For Purchase & Additional Purchase : Rs. 500 and in multiples of Rs 500 thereafter.
Purchase : Rs. 5,000 and any amount thereafter.Additional Purchase : Rs. 1,000 and any amount thereafter.
Features of our following schemes
hdfc-fos.qxd 5/7/2009 8:19 PM Page 3
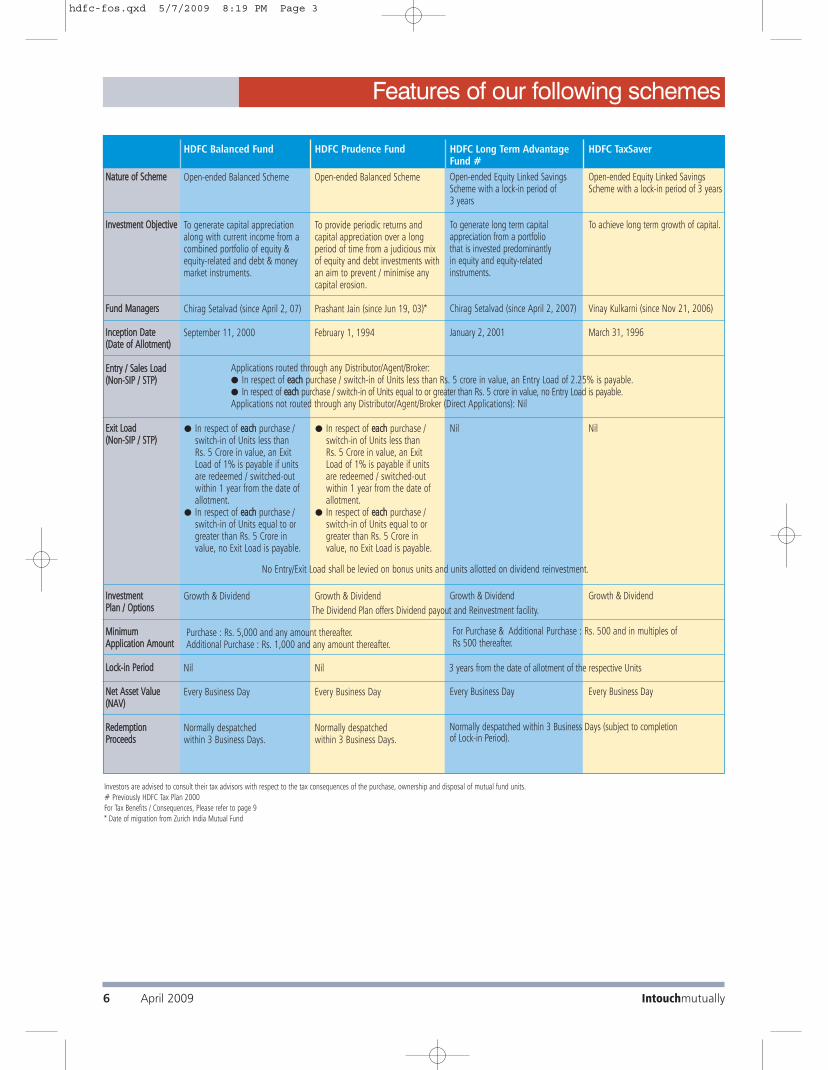
Investors are advised to consult their tax advisors with respect to the tax consequences of the purchase, ownership and disposal of mutual fund units. For Tax Benefits / Consequences, Please refer to page 9
HDFC Income Fund
Open-ended Income Scheme
To optimise returns while maintaining a balance of safety, yield and liquidity.
Shobhit Mehrotra(since Sep 1, 07)
September 11, 2000
Direct Applications & Applications routed through anyAgent/Distributor/Broker: Nil
● In respect of eeaacchh purchase /switch-in of Units less than Rs. 1 crore in value:
❍ an Exit Load of 2.00% ispayable if Units are redeemed /switched-out within 6 monthsfrom the date of allotment.
❍ an Exit Load of 1.00% ispayable if Units are redeemed /switched-out after 6 monthsbut within 1 year from the date of allotment.
● In respect of eeaacchh purchase /switch-in of Units equal to orgreater than Rs. 1 crore invalue:
❍ an Exit Load of 0.50% ispayable if Units are redeemed /switched-out within 3 monthsfrom the date of allotment.
❍ an Exit Load of 0.25% ispayable if Units are redeemed /switched-out after 3 monthsbut within 6 months from thedate of allotment.
Nil
Every Business Day
Normally despatched within 3 Business Days
HDFC Multiple Yield Fund– Plan 2005
Open-ended Income Scheme
To generate positive returns over medium time frame withlow risk of capital loss overmedium time frame.
Chirag Setalvad (Equities), (since April 2, 07)Anil Bamboli (Debt)(since Aug 17, 05)
August 17, 2005
● In respect of eeaacchh purchase / switch-in of Units, upto and including Rs. 2 crore invalue, an Exit Load of1.00% is payable if Unitsare redeemed / switched -out within 15 months fromthe date of allotment.
● In respect of eeaacchh purchase / switch-in of Units greaterthan Rs. 2 crore in value, noExit Load is payable.
Nil
Every Business Day
Normally depatched within 3 Business Days
HDFC Multiple Yield Fund
Open-ended Income Scheme
To generate positive returnsover medium time frame withlow risk of capital loss overmedium time frame.
Vinay Kulkarni (Equities), (since Nov 21, 06)Anil Bamboli (Debt)(since Sep 17, 04)
September 17, 2004
● In respect of eeaacchh purchase / switch-in of Units, upto and including Rs. 2 crore invalue, an Exit Load of 1.00%is payable if Units areredeemed / switched - outwithin 1 year from the dateof allotment.
● In respect of eeaacchh purchase / switch-in of Units greaterthan Rs. 2 crore in value, noExit Load is payable.
Nil
Every Business Day
Normally depatched within 3 Business Days
NNaattuurree ooff SScchheemmee
IInnvveessttmmeenntt OObbjjeeccttiivvee
FFuunndd MMaannaaggeerrss
IInncceeppttiioonn DDaattee((DDaattee ooff AAlllloottmmeenntt))
EEnnttrryy // SSaalleess LLooaadd((NNoonn--SSIIPP // SSTTPP))
EExxiitt LLooaadd((NNoonn--SSIIPP // SSTTPP))
IInnvveessttmmeennttPPllaann // OOppttiioonnss
MMiinniimmuumm AApppplliiccaattiioonn AAmmoouunntt
LLoocckk--iinn PPeerriioodd
NNeett AAsssseett VVaalluuee((NNAAVV))
RReeddeemmppttiioonnPPrroocceeeeddss
Growth & Dividend. The Dividend Option offers Dividend Payout and Reinvestment facility.
Purchase : Rs 5,000 and any amount thereafter. Additional Purchase : Rs. 1,000 and any amount thereafter.
HDFC MF Monthly Income Plan
An open-ended income scheme. Monthly income is not assured and is subject to availability of distributable surplus
The primary objective of Scheme is to generate regularreturns through investment primarily in Debt and Money Market Instruments. The secondary objective of the Scheme is to generate long-term capital appreciation by investing a portion of the Scheme’sassets in equity and equity related instruments.
LTP - Prashant Jain (Equities) (since Dec 26, 03),Shobhit Mehrotra (Debt) (since Sep 1, 07),STP - Vinay Kulkarni (Equities) (since Nov 21, 06),Shobhit Mehrotra (Debt) (since Feb 16, 04)
December 26, 2003
Direct Applications & Applications routed through anyAgent/Distributor/Broker: Nil
FFoorr SShhoorrtt--TTeerrmm PPllaann ● In respect of each purchase / switch-in of Units less
than Rs. 1 crore in value, an Exit Load of 1.00% ispayable if Units are redeemed/switched-out within12 months from the date of allotment.
● In respect of each purchase / switch-in of Units equalto or greater than Rs. 1 crore in value, an Exit Loadof 0.25% is payable if Units are redeemed/ switched-out within 3 months from the date of allotment.
FFoorr LLoonngg--TTeerrmm PPllaann● In respect of eeaacchh purchase / switch-in of Units less
than Rs. 5 crore in value, an Exit Load of 1% ispayable if Units are redeemed / switched-out within1 year from the date of allotment.
● In respect of eeaacchh purchase / switch-in of Units equalto or greater than Rs. 5 crore in value, no Exit Loadis payable.
Short Term Plan (STP) & Long Term Plan (LTP). Each Planoffers Growth, Monthly Dividend & Quarterly DividendOption. The Dividend Option offers Dividend Payout andReinvestment facility.
SShhoorrtt TTeerrmm PPllaann :: Purchase : (Growth & Quarterly Dividend Option) – Rs. 5,000 andany amount thereafter under each Option.(Monthly Dividend Option) – Rs. 25,000 and anyamount thereafter.Additional Purchase : Rs. 1,000 and any amount thereafter.LLoonngg TTeerrmm PPllaann :: Purchase :(Growth & Quarterly Dividend Option) – Rs. 5,000 andany amount thereafter under each Option.(Monthly Dividend Option) – Rs. 25,000 and anyamount thereafter.Additional Purchase : Rs. 1,000 and any amount thereafter.
Nil
Every Business Day
Normally despatched within 3 Business Days
Applications routed through any Distributor/Agent/Broker: 1%Applications not routed through any Distributor/Agent/Broker(Direct Applications): Nil
No Entry/Exit Load shall be levied on bonus units and units allotted on dividend reinvestment.
Features of our following schemes
Intouchmutually April 2009 7
hdfc-fos.qxd 5/7/2009 8:19 PM Page 4
Features of our following schemes
NNaattuurree ooff SScchheemmee
IInnvveessttmmeenntt OObbjjeeccttiivvee
FFuunndd MMaannaaggeerrss
IInncceeppttiioonn DDaattee((DDaattee ooff AAlllloottmmeenntt))
EEnnttrryy // SSaalleess LLooaadd((NNoonn--SSIIPP // SSTTPP))
EExxiitt LLooaadd((NNoonn--SSIIPP // SSTTPP))
IInnvveessttmmeennttPPllaann // OOppttiioonnss
MMiinniimmuumm AApppplliiccaattiioonn AAmmoouunntt
LLoocckk--iinn PPeerriioodd
NNeett AAsssseett VVaalluuee((NNAAVV))
RReeddeemmppttiioonnPPrroocceeeeddss
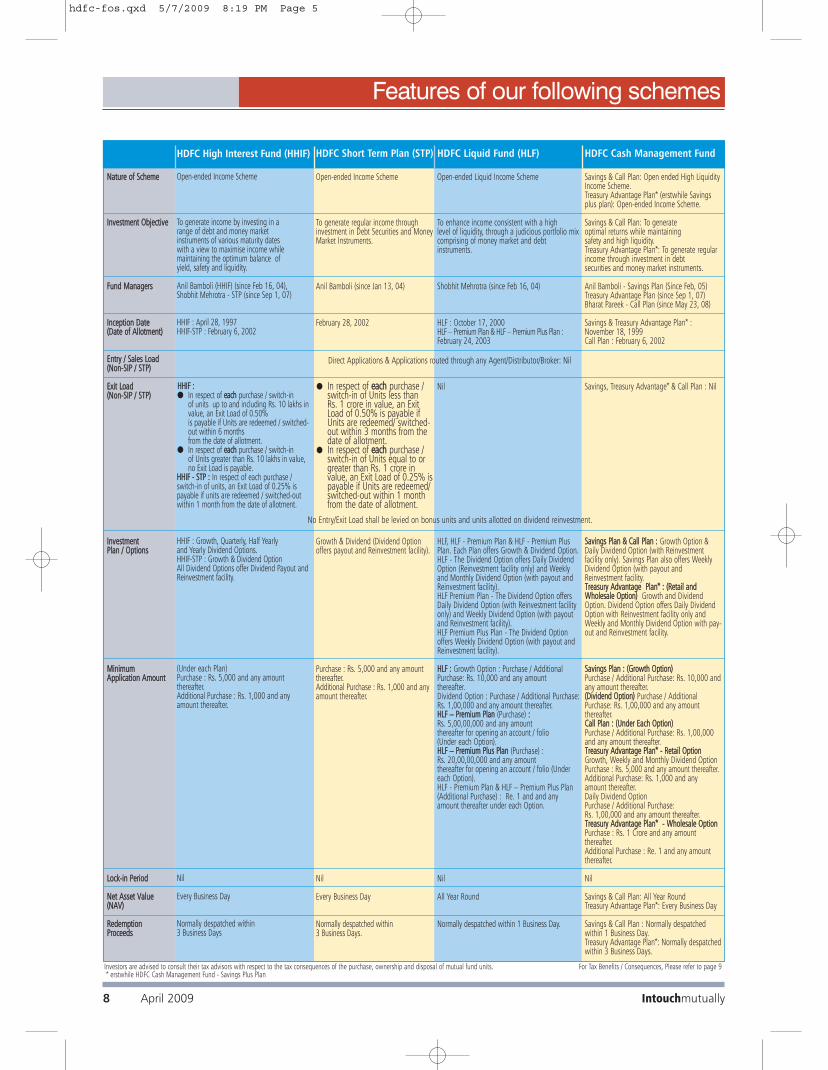
HDFC Cash Management Fund
Savings & Call Plan: Open ended High LiquidityIncome Scheme.Treasury Advantage Plan* (erstwhile Savingsplus plan): Open-ended Income Scheme.
Savings & Call Plan: To generateoptimal returns while maintainingsafety and high liquidity.Treasury Advantage Plan*: To generate regularincome through investment in debt securities and money market instruments.
Anil Bamboli - Savings Plan (Since Feb, 05)Treasury Advantage Plan (since Sep 1, 07)Bharat Pareek - Call Plan (since May 23, 08)
Savings & Treasury Advantage Plan* :November 18, 1999Call Plan : February 6, 2002
Savings, Treasury Advantage* & Call Plan : Nil
SSaavviinnggss PPllaann && CCaallll PPllaann :: Growth Option &Daily Dividend Option (with Reinvestment facility only). Savings Plan also offers WeeklyDividend Option (with payout andReinvestment facility. TTrreeaassuurryy AAddvvaannttaaggee PPllaann** :: ((RReettaaiill aannddWWhhoolleessaallee OOppttiioonn)) Growth and DividendOption. Dividend Option offers Daily DividendOption with Reinvestment facility only andWeekly and Monthly Dividend Option with pay-out and Reinvestment facility.
SSaavviinnggss PPllaann :: ((GGrroowwtthh OOppttiioonn))Purchase / Additional Purchase: Rs. 10,000 andany amount thereafter.((DDiivviiddeenndd OOppttiioonn)) Purchase / AdditionalPurchase: Rs. 1,00,000 and any amount thereafter.CCaallll PPllaann :: ((UUnnddeerr EEaacchh OOppttiioonn))Purchase / Additional Purchase: Rs. 1,00,000and any amount thereafter.TTrreeaassuurryy AAddvvaannttaaggee PPllaann** -- RReettaaiill OOppttiioonnGrowth, Weekly and Monthly Dividend OptionPurchase : Rs. 5,000 and any amount thereafter.Additional Purchase: Rs. 1,000 and anyamount thereafter.Daily Dividend Option Purchase / Additional Purchase: Rs. 1,00,000 and any amount thereafter.TTrreeaassuurryy AAddvvaannttaaggee PPllaann** -- WWhhoolleessaallee OOppttiioonnPurchase : Rs. 1 Crore and any amount thereafter.Additional Purchase : Re. 1 and any amountthereafter.
Nil
Savings & Call Plan: All Year RoundTreasury Advantage Plan*: Every Business Day
Savings & Call Plan : Normally despatchedwithin 1 Business Day.Treasury Advantage Plan*: Normally despatched within 3 Business Days.
Investors are advised to consult their tax advisors with respect to the tax consequences of the purchase, ownership and disposal of mutual fund units. For Tax Benefits / Consequences, Please refer to page 9 * erstwhile HDFC Cash Management Fund - Savings Plus Plan
HDFC Short Term Plan (STP)
Open-ended Income Scheme
To generate regular income through investment in Debt Securities and MoneyMarket Instruments.
Anil Bamboli (since Jan 13, 04)
February 28, 2002
● In respect of eeaacchh purchase /switch-in of Units less than Rs. 1 crore in value, an ExitLoad of 0.50% is payable ifUnits are redeemed/ switched-out within 3 months from thedate of allotment.
● In respect of eeaacchh purchase /switch-in of Units equal to orgreater than Rs. 1 crore invalue, an Exit Load of 0.25% ispayable if Units are redeemed/switched-out within 1 monthfrom the date of allotment.
Growth & Dividend (Dividend Optionoffers payout and Reinvestment facility).
Purchase : Rs. 5,000 and any amountthereafter.Additional Purchase : Rs. 1,000 and anyamount thereafter.
Nil
Every Business Day
Normally despatched within 3 Business Days.
HDFC Liquid Fund (HLF)
Open-ended Liquid Income Scheme
To enhance income consistent with a high level of liquidity, through a judicious portfolio mixcomprising of money market and debtinstruments.
Shobhit Mehrotra (since Feb 16, 04)
HLF : October 17, 2000HLF – Premium Plan & HLF – Premium Plus Plan :February 24, 2003
Nil
HLF, HLF - Premium Plan & HLF - Premium PlusPlan. Each Plan offers Growth & Dividend Option.HLF - The Dividend Option offers Daily DividendOption (Reinvestment facility only) and Weeklyand Monthly Dividend Option (with payout andReinvestment facility).HLF Premium Plan - The Dividend Option offersDaily Dividend Option (with Reinvestment facilityonly) and Weekly Dividend Option (with payoutand Reinvestment facility).HLF Premium Plus Plan - The Dividend Optionoffers Weekly Dividend Option (with payout andReinvestment facility).
HHLLFF :: Growth Option : Purchase / AdditionalPurchase: Rs. 10,000 and any amount thereafter. Dividend Option : Purchase / Additional Purchase:Rs. 1,00,000 and any amount thereafter.HHLLFF –– PPrreemmiiuumm PPllaann (Purchase) :: Rs. 5,00,00,000 and any amount thereafter for opening an account / folio (Under each Option). HHLLFF –– PPrreemmiiuumm PPlluuss PPllaann (Purchase) : Rs. 20,00,00,000 and any amount thereafter for opening an account / folio (Undereach Option). HLF - Premium Plan & HLF – Premium Plus Plan(Additional Purchase) : Re. 1 and and anyamount thereafter under each Option.
Nil
All Year Round
Normally despatched within 1 Business Day.
HDFC High Interest Fund (HHIF)
Open-ended Income Scheme
To generate income by investing in a range of debt and money market instruments of various maturity dates with a view to maximise income while maintaining the optimum balance of yield, safety and liquidity.
Anil Bamboli (HHIF) (since Feb 16, 04), Shobhit Mehrotra - STP (since Sep 1, 07)
HHIF : April 28, 1997HHIF-STP : February 6, 2002
HHHHIIFF ::● In respect of eeaacchh purchase / switch-in
of units up to and including Rs. 10 lakhs invalue, an Exit Load of 0.50% is payable if Units are redeemed / switched-out within 6 months from the date of allotment.
● In respect of eeaacchh purchase / switch-in of Units greater than Rs. 10 lakhs in value,no Exit Load is payable.
HHHHIIFF -- SSTTPP :: In respect of each purchase /switch-in of units, an Exit Load of 0.25% ispayable if units are redeemed / switched-outwithin 1 month from the date of allotment.
HHIF : Growth, Quarterly, Half Yearly and Yearly Dividend Options.HHIF-STP : Growth & Dividend OptionAll Dividend Options offer Dividend Payout andReinvestment facility.
(Under each Plan)Purchase : Rs. 5,000 and any amount thereafter.Additional Purchase : Rs. 1,000 and anyamount thereafter.
Nil
Every Business Day
Normally despatched within 3 Business Days
No Entry/Exit Load shall be levied on bonus units and units allotted on dividend reinvestment.
Direct Applications & Applications routed through any Agent/Distributor/Broker: Nil
Intouchmutually8 April 2009
hdfc-fos.qxd 5/7/2009 8:19 PM Page 5

HDFC Floating Rate Income Fund
Open-ended Income Scheme.
To generate regular income through investment in a portfolio comprising substantially of floatingrate debt / money market instruments, fixed rate debt / money market instruments swapped forfloating rate returns and fixed rate debt securities and money market instruments.
Shobhit Mehrotra (since Feb 16, 04)
January 16, 2003
SShhoorrtt TTeerrmm PPllaann :: Direct Applications & Applications routed through any Agent/Distributor/Broker: NilLLoonngg TTeerrmm PPllaann :: ● Applications not routed through any distributor/agent/ broker (Direct Applications): Nil ● Applications routed through any distributor/agent/ broker: In respect of each purchase /switch-in
of units, an Entry Load of 1% is payable.
SShhoorrtt TTeerrmm PPllaann :: NilLLoonngg TTeerrmm PPllaann :: ● In respect of eeaacchh purchase / switch-in of units, upto and including Rs.10 lakhs in value, an
Exit Load of 0.50% is payable if units are redeemed / switched-out within 6 months from thedate of allotment.
● In respect of eeaacchh purchase / switch-in of units greater than Rs.10 lakhs in value, an Exit Load of 3% is payable if units are redeemed /switched out within 18 months from the date of allotment.
SShhoorrtt TTeerrmm PPllaann :: For investors who wish to invest for short time period.LLoonngg TTeerrmm PPllaann :: For investors who wish to invest for relatively longer time period. SShhoorrtt TTeerrmm PPllaann -- WWhhoolleessaallee && RReettaaiill OOppttiioonn :: Growth and Dividend Option. The Dividend Optionoffers Daily Dividend Option (with Reinvestment facility only) and Weekly and Monthly DividendOption (with payout and Reinvestment facility).LLoonngg TTeerrmm PPllaann :: Growth and Dividend Option. The Dividend Option offers Reinvestment facility only.
SShhoorrtt TTeerrmm PPllaann -- RReettaaiill OOppttiioonn :: ((GGrroowwtthh OOppttiioonn,, WWeeeekkllyy DDiivviiddeenndd OOppttiioonn &&MMoonntthhllyy DDiivviiddeenndd OOppttiioonn))Purchase : Rs 5,000 and any amount thereafter.Additional Purchase : Rs 1,000 and any amount thereafter.((DDaaiillyy DDiivviiddeenndd OOppttiioonn)) Purchase / Additional Purchase : Rs 1 lakh and any amount thereafter.SShhoorrtt TTeerrmm PPllaann -- WWhhoolleessaallee OOppttiioonn :: ((GGrroowwtthh OOppttiioonn,, DDaaiillyy DDiivviiddeenndd OOppttiioonn,, WWeeeekkllyy DDiivviiddeenndd OOppttiioonn && MMoonntthhllyy DDiivviiddeenndd OOppttiioonn))Under each option : Purchase : Rs 1 crore and any amount thereafter.Additional Purchase : Re 1 and and any amount thereafter.LLoonngg TTeerrmm PPllaann :: For Purchase : Rs. 5,000 and any amount thereafter.Additional Purchase : Rs. 1,000 and any amount thereafter.
Nil
Every Business Day
Normally despatched within 3 Business Days.
HDFC Gilt Fund
Open-ended Income Scheme.
To generate credit risk-free returns through investmentsin sovereign securities issued by the Central Governmentand / or a State Government.
Anil Bamboli (since Sep 1, 2007)
July 25, 2001
Direct Applications & Applications routed through anyAgent/Distributor/Broker: Nil
Nil
SShhoorrtt TTeerrmm PPllaann :: For investors who wish to invest for short time period. LLoonngg TTeerrmm PPllaann :: For investors who wish to invest forrelatively longer time period.
(Under each Plan / Option)Purchase :Rs. 5,000 and any amount thereafter.Additional Purchase :Rs. 1,000 and any amount thereafter.
Nil
Every Business Day
Normally despatched within 3 Business Days.
NNaattuurree ooff SScchheemmee
IInnvveessttmmeenntt OObbjjeeccttiivvee
FFuunndd MMaannaaggeerr
IInncceeppttiioonn DDaattee((DDaattee ooff AAlllloottmmeenntt))
EEnnttrryy // SSaalleess LLooaadd((NNoonn--SSIIPP // SSTTPP))
EExxiitt LLooaadd((NNoonn--SSIIPP // SSTTPP))
IInnvveessttmmeennttPPllaann // OOppttiioonnss
MMiinniimmuumm AApppplliiccaattiioonn AAmmoouunntt
LLoocckk--iinn PPeerriioodd
NNeett AAsssseett VVaalluuee((NNAAVV))
RReeddeemmppttiioonnPPrroocceeeeddss
Each Plan offers Growth and Dividend Options.The Dividend Option offers Dividend Payout andReinvestment facility.
Investors are advised to consult their tax advisors with respect to the tax consequences of the purchase, ownership and disposal of mutual fund units.
TTaaxx BBeenneeffiittss // CCoonnsseeqquueenncceess :: Income distributed by the Scheme(s) will be exempt from Income-tax in the hands of investors. Distribution tax in case of Scheme(s) other than equity-oriented funds shall bepayable by the mutual fund at the rate of 14.1625% (including surcharge @10%, education cess @2% and secondary and higher education cess @1%) on income distributed to an individual/HUF and atthe rate of 22.66% (including surcharge @10%, education cess @2% and secondary and higher education cess @1%) on income distributed to any other investor. In case of income distributed by LiquidFunds and Money Market Mutual Funds, Dividend Distribution Tax is payable by the Mutual Fund @28.325% (including surcharge @10%, education cess @2% and secondary and higher education cess@1%). Units of the Scheme(s) are not subject to Wealth-tax and Gift-tax. Unit holders are required to pay Securities Transaction Tax (STT) at the rate of 0.25% at the time of redemption / switch-out of unitsof an equity-oriented fund.Investors should be aware that the fiscal rules / tax laws may change and there can be no guarantee that the current tax position may continue indefinitely. In view of individual nature of tax consequences,each investor is advised to consult his / her own professional tax advisor.
FFuunndd MMaannaaggeerr TToottaall EExxppeerriieenncceePrashant Jain Over 17 yearsShobhit Mehrotra Over 16 yearsAnil Bamboli Over 14 yearsVinay Kulkarni Over 16 yearsChirag Setalvad Over 12 yearsSrinivas Rao Ravuri Over 14 yearsBharat Pareek Over 8 years
No Entry/Exit Load shall be levied on bonus units and units allotted on dividend reinvestment.
Intouchmutually April 2009 9
Features of our following schemes
hdfc-fos.qxd 5/7/2009 8:19 PM Page 6
DDaattee PPeerriioodd NNAAVV RReettuurrnnss BBeenncchhmmaarrkkppeerr UUnniitt ((RRss..)) ((%%))^̂ RReettuurrnnss ((%%))##
^̂PPaasstt ppeerrffoorrmmaannccee mmaayy oorr mmaayy nnoott bbee ssuussttaaiinneedd iinn tthhee ffuuttuurreePerformance of the Dividend Plan for the investor would be net of Distribution Tax as applicable* Absolute Returns ** Compounded Annualised Returns # SENSEX
Portfolio – Top 10 Holdings (as at April 30, 2009)
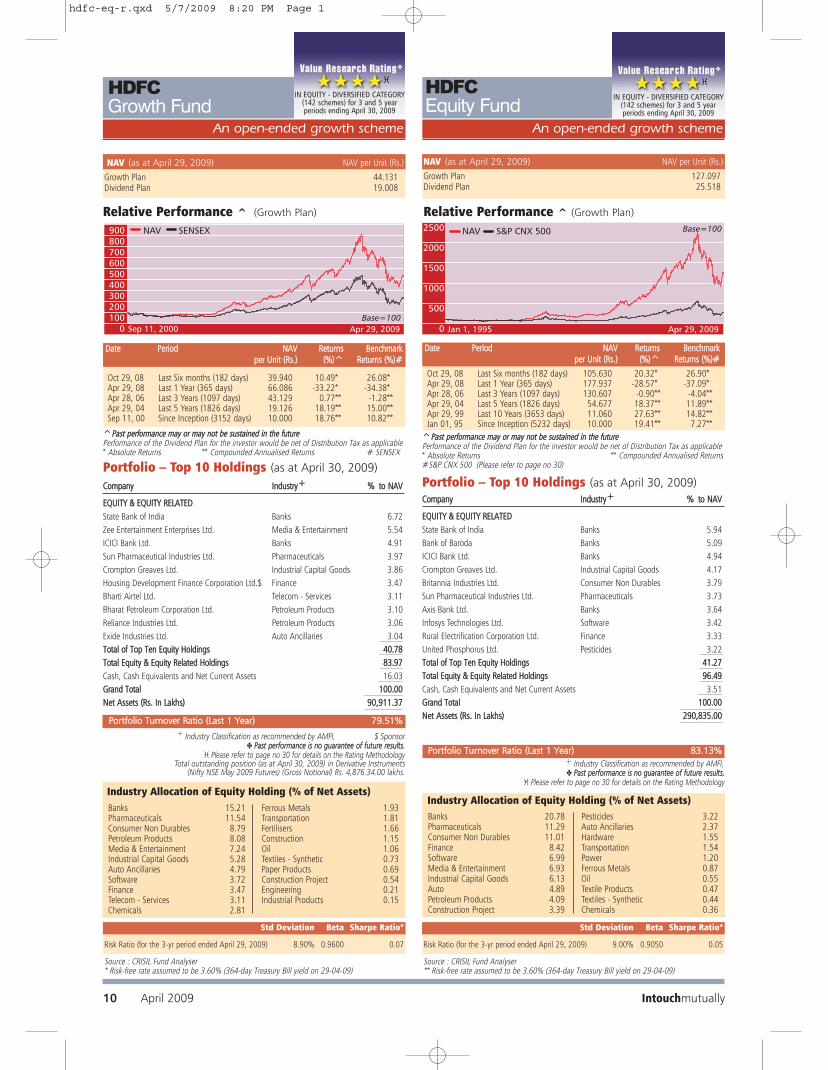
HDFC
Growth Fund
Relative Performance ^ (Growth Plan)
+ Industry Classification as recommended by AMFI, $ Sponsor✤ PPaasstt ppeerrffoorrmmaannccee iiss nnoo gguuaarraanntteeee ooff ffuuttuurree rreessuullttss..
� Please refer to page no 30 for details on the Rating MethodologyTotal outstanding position (as at April 30, 2009) in Derivative Instruments
(Nifty NSE May 2009 Futures) (Gross Notional) Rs. 4,876.34.00 lakhs.
An open-ended growth scheme
HDFC
Equity FundAn open-ended growth scheme
Banks 15.21Pharmaceuticals 11.54Consumer Non Durables 8.79Petroleum Products 8.08Media & Entertainment 7.24Industrial Capital Goods 5.28Auto Ancillaries 4.79Software 3.72Finance 3.47Telecom - Services 3.11Chemicals 2.81
Ferrous Metals 1.93Transportation 1.81Fertilisers 1.66Construction 1.15Oil 1.06Textiles - Synthetic 0.73Paper Products 0.69Construction Project 0.54Engineering 0.21Industrial Products 0.15
Industry Allocation of Equity Holding (% of Net Assets)
PPoorrttffoolliioo TTuurrnnoovveerr RRaattiioo ((LLaasstt 11 YYeeaarr)) 7799..5511%%
NAV (as at April 29, 2009) NAV per Unit (Rs.)
Growth Plan 44.131Dividend Plan 19.008
Std Deviation Beta Sharpe Ratio*
Risk Ratio (for the 3-yr period ended April 29, 2009) 8.90% 0.9600 0.07
Std Deviation Beta Sharpe Ratio*
Risk Ratio (for the 3-yr period ended April 29, 2009) 9.00% 0.9050 0.05
IN EQUITY - DIVERSIFIED CATEGORY(142 schemes) for 3 and 5 year periods ending April 30, 2009
DDaattee PPeerriioodd NNAAVV RReettuurrnnss BBeenncchhmmaarrkkppeerr UUnniitt ((RRss..)) ((%%))^̂ RReettuurrnnss ((%%))##
Relative Performance ^ (Growth Plan)
^̂PPaasstt ppeerrffoorrmmaannccee mmaayy oorr mmaayy nnoott bbee ssuussttaaiinneedd iinn tthhee ffuuttuurreePerformance of the Dividend Plan for the investor would be net of Distribution Tax as applicable* Absolute Returns ** Compounded Annualised Returns#S&P CNX 500 (Please refer to page no 30)
Oct 29, 08 Last Six months (182 days) 105.630 20.32* 26.90*Apr 29, 08 Last 1 Year (365 days) 177.937 -28.57* -37.09*Apr 28, 06 Last 3 Years (1097 days) 130.607 -0.90** -4.04**Apr 29, 04 Last 5 Years (1826 days) 54.677 18.37** 11.89**Apr 29, 99 Last 10 Years (3653 days) 11.060 27.63** 14.82**Jan 01, 95 Since Inception (5232 days) 10.000 19.41** 7.27**
Oct 29, 08 Last Six months (182 days) 39.940 10.49* 26.08*Apr 29, 08 Last 1 Year (365 days) 66.086 -33.22* -34.38*Apr 28, 06 Last 3 Years (1097 days) 43.129 0.77** -1.28**Apr 29, 04 Last 5 Years (1826 days) 19.126 18.19** 15.00**Sep 11, 00 Since Inception (3152 days) 10.000 18.76** 10.82**
NAV (as at April 29, 2009) NAV per Unit (Rs.)
Growth Plan 127.097Dividend Plan 25.518
Portfolio – Top 10 Holdings (as at April 30, 2009)
PPoorrttffoolliioo TTuurrnnoovveerr RRaattiioo ((LLaasstt 11 YYeeaarr)) 8833..1133%%+ Industry Classification as recommended by AMFI,✤ PPaasstt ppeerrffoorrmmaannccee iiss nnoo gguuaarraanntteeee ooff ffuuttuurree rreessuullttss..
� Please refer to page no 30 for details on the Rating Methodology
Banks 20.78Pharmaceuticals 11.29Consumer Non Durables 11.01Finance 8.42Software 6.99Media & Entertainment 6.93Industrial Capital Goods 6.13Auto 4.89Petroleum Products 4.09Construction Project 3.39
Pesticides 3.22Auto Ancillaries 2.37Hardware 1.55Transportation 1.54Power 1.20Ferrous Metals 0.87Oil 0.55Textile Products 0.47Textiles - Synthetic 0.44Chemicals 0.36
Industry Allocation of Equity Holding (% of Net Assets)
CCoommppaannyy IInndduussttrryy++ %% ttoo NNAAVV
EEQQUUIITTYY && EEQQUUIITTYY RREELLAATTEEDD
State Bank of India Banks 6.72
Zee Entertainment Enterprises Ltd. Media & Entertainment 5.54
ICICI Bank Ltd. Banks 4.91
Sun Pharmaceutical Industries Ltd. Pharmaceuticals 3.97
Crompton Greaves Ltd. Industrial Capital Goods 3.86
Housing Development Finance Corporation Ltd.$ Finance 3.47
Bharti Airtel Ltd. Telecom - Services 3.11
Bharat Petroleum Corporation Ltd. Petroleum Products 3.10
Reliance Industries Ltd. Petroleum Products 3.06
Exide Industries Ltd. Auto Ancillaries 3.04
TToottaall ooff TToopp TTeenn EEqquuiittyy HHoollddiinnggss 4400..7788
TToottaall EEqquuiittyy && EEqquuiittyy RReellaatteedd HHoollddiinnggss 8833..9977
Cash, Cash Equivalents and Net Current Assets 16.03
GGrraanndd TToottaall 110000..0000
NNeett AAsssseettss ((RRss.. IInn LLaakkhhss)) 9900,,991111..3377
CCoommppaannyy IInndduussttrryy++ %% ttoo NNAAVV
EEQQUUIITTYY && EEQQUUIITTYY RREELLAATTEEDD
State Bank of India Banks 5.94
Bank of Baroda Banks 5.09
ICICI Bank Ltd. Banks 4.94
Crompton Greaves Ltd. Industrial Capital Goods 4.17
Britannia Industries Ltd. Consumer Non Durables 3.79
Sun Pharmaceutical Industries Ltd. Pharmaceuticals 3.73
Axis Bank Ltd. Banks 3.64
Infosys Technologies Ltd. Software 3.42
Rural Electrification Corporation Ltd. Finance 3.33
United Phosphorus Ltd. Pesticides 3.22
TToottaall ooff TToopp TTeenn EEqquuiittyy HHoollddiinnggss 4411..2277
TToottaall EEqquuiittyy && EEqquuiittyy RReellaatteedd HHoollddiinnggss 9966..4499
Cash, Cash Equivalents and Net Current Assets 3.51
GGrraanndd TToottaall 110000..0000
NNeett AAsssseettss ((RRss.. IInn LLaakkhhss)) 229900,,883355..0000
IN EQUITY - DIVERSIFIED CATEGORY(142 schemes) for 3 and 5 year periods ending April 30, 2009
Source : CRISIL Fund Analyser* Risk-free rate assumed to be 3.60% (364-day Treasury Bill yield on 29-04-09)
Source : CRISIL Fund Analyser** Risk-free rate assumed to be 3.60% (364-day Treasury Bill yield on 29-04-09)
Intouchmutually10 April 2009
hdfc-eq-r.qxd 5/7/2009 8:20 PM Page 1

HDFC Top 200 Fund
An open-ended growth scheme
HDFCCapital Builder Fund
An open-ended growth scheme
DDaattee PPeerriioodd NNAAVV RReettuurrnnss BBeenncchhmmaarrkkppeerr UUnniitt ((RRss..)) ((%%)) $$^ RReettuurrnnss ((%%))##
Relative Performance ^ (Growth Plan)
^̂PPaasstt ppeerrffoorrmmaannccee mmaayy oorr mmaayy nnoott bbee ssuussttaaiinneedd iinn tthhee ffuuttuurreePerformance of the Dividend Plan for the investor would be net of Distribution Tax as applicable* Absolute Returns ** Compounded Annualised Returns #BSE 200$$ Adjusted for the dividends declared under the scheme prior to its splittng into the Dividendand Growth Plans
Oct 29, 08 Last Six months (182 days) 87.487 22.97* 25.03*Apr 29, 08 Last 1 Year (365 days) 143.160 -24.85* -38.18*Apr 28, 06 Last 3 Years (1097 days) 98.534 2.97** -3.14**Apr 29, 04 Last 5 Years (1826 days) 42.158 20.59** 12.01**Apr 29, 99 Last 10 Years (3653 days) 16.472 23.04** 14.98**Oct 11, 96 Since Inception (4583 days) 10.000 22.75** 12.26**
NAV (as at April 29, 2009) NAV per Unit (Rs.)
Growth Plan 53.006
Dividend Plan 14.159
NAV (as at April 29, 2009) NAV per Unit (Rs.)
Growth Plan 107.584
Dividend Plan 27.820
CCoommppaannyy IInndduussttrryy++ // RRaattiinngg %% ttoo NNAAVV
EEQQUUIITTYY && EEQQUUIITTYY RREELLAATTEEDDInfosys Technologies Ltd. Software 5.61 ICICI Bank Ltd. Banks 5.46 Reliance Industries Ltd. Petroleum Products 5.44 State Bank of India Banks 5.11 Hero Honda Motors Ltd. Auto 3.37 Axis Bank Ltd. Banks 3.01 Bank of Baroda Banks 2.94 Housing Development Finance Corporation Ltd.$ Finance 2.88 Bharti Airtel Ltd. Telecom - Services 2.86 Sun Pharmaceutical Industries Ltd. Pharmaceuticals 2.76 TToottaall ooff TToopp TTeenn EEqquuiittyy HHoollddiinnggss 3399..4444TToottaall EEqquuiittyy && EEqquuiittyy RReellaatteedd HHoollddiinnggss 9944..7733PPrreeffeerreennccee SShhaarreessTata Steel Ltd. Ferrous Metals 0.07 TToottaall EEqquuiittyy && EEqquuiittyy RReellaatteedd HHoollddiinnggss 00..0077MMoonneeyy MMaarrkkeett IInnssttrruummeennttss && OOtthheerr CCrreeddiitt EExxppoossuurreess
Housing Development Finance Corporation Ltd. $ AAA 0.40 TToottaall MMoonneeyy MMaarrkkeett IInnssttrruummeennttss && OOtthheerr CCrreeddiitt EExxppoossuurreess 00..4400
Cash, Cash Equivalents and Net Current Assets 4.80 GGrraanndd TToottaall 110000..0000
NNeett AAsssseettss ((RRss.. IInn LLaakkhhss)) 225500,,332233..9988
Portfolio – Top 10 Holdings (as at April 30, 2009)
IN EQUITY - DIVERSIFIED CATEGORY(142 schemes) for 3 and 5 year periods ending April 30, 2009
Relative Performance ^ (Growth Plan)
DDaattee PPeerriioodd NNAAVV RReettuurrnnss BBeenncchhmmaarrkkppeerr UUnniitt ((RRss..)) ((%%))^̂ RReettuurrnnss ((%%))##
^̂PPaasstt ppeerrffoorrmmaannccee mmaayy oorr mmaayy nnoott bbee ssuussttaaiinneedd iinn tthhee ffuuttuurreePerformance of the Dividend Plan for the investor would be net of Distribution Tax as applicable#S&P CNX 500 (Please refer to page no 30) ** Compounded Annualised Returns* Absolute Returns
Oct 29, 08 Last Six months (182 days) 45.436 16.66* 26.90*Apr 29, 08 Last 1 Year (365 days) 79.379 -33.22* -37.09*Apr 28, 06 Last 3 Years (1097 days) 65.153 -6.63** -4.04**Apr 29, 04 Last 5 Years (1826 days) 24.674 16.51** 11.89**Apr 29, 99 Last 10 Years (3653 days) 10.470 17.59** 14.82**Feb 01, 94 Since Inception (5566 days) 10.000 11.56** 6.21**
Portfolio – Top 10 Holdings (as at April 30, 2009)
PPoorrttffoolliioo TTuurrnnoovveerr RRaattiioo ((LLaasstt 11 YYeeaarr)) 3388..9933%%
CCoommppaannyy IInndduussttrryy++ %% ttoo NNAAVV
EEQQUUIITTYY && EEQQUUIITTYY RREELLAATTEEDD
Hero Honda Motors Ltd. Auto 6.83
State Bank of India Banks 5.42
ICICI Bank Ltd. Banks 5.37
Reliance Industries Ltd. Petroleum Products 4.50
Crompton Greaves Ltd. Industrial Capital Goods 4.35
Dr Reddy’s Laboratories Ltd. Pharmaceuticals 4.07
Britannia Industries Ltd. Consumer Non Durables 3.95
Exide Industries Ltd. Auto Ancillaries 3.84
ITC Ltd. Consumer Non Durables 3.76
Bharti Airtel Ltd. Telecom - Services 3.75
TToottaall ooff TToopp TTeenn EEqquuiittyy HHoollddiinnggss 4455..8844
TToottaall EEqquuiittyy && EEqquuiittyy RReellaatteedd HHoollddiinnggss 9944..8855
Cash, Cash Equivalents and Net Current Assets 5.15
GGrraanndd TToottaall 110000..0000
NNeett AAsssseettss ((RRss.. IInn LLaakkhhss)) 4400,,113399..4433
Banks 20.14Consumer Non Durables 11.50Software 9.53Pharmaceuticals 8.10Finance 7.87Petroleum Products 7.44Auto 5.07Industrial Capital Goods 4.07Construction Project 4.02Telecom - Services 3.63
Oil 3.08Ferrous Metals 2.67Pesticides 1.45Media & Entertainment 1.37Power 1.32Transportation 1.06Cement 1.01Non - Ferrous Metals 0.82Hardware 0.43Auto Ancillaries 0.22
Industry Allocation of Equity Holding (% of Net Assets) Banks 15.61
Pharmaceuticals 14.31
Consumer Non Durables 14.16
Industrial Capital Goods 11.23
Petroleum Products 7.63
Auto 6.83
Software 4.13
Auto Ancillaries 3.84
Telecom - Services 3.75
Consumer Durables 2.46
Transportation 2.18
Construction Project 1.73
Pesticides 1.72
Industrial Products 1.23
Gas 1.17
Chemicals 1.16
Media & Entertainment 1.13
Textile Products 0.52
Finance 0.06
Industry Allocation of Equity Holding (% of Net Assets)
Std Deviation Beta Sharpe Ratio*
Risk Ratio (for the 3-yr period ended April 29, 2009) 8.70% 0.8880 0.08
Std Deviation Beta Sharpe Ratio*
Risk Ratio (for the 3-yr period ended April 29, 2009) 9.50% 0.9340 0.02
+ Industry Classification as recommended by AMFITotal outstanding position (as at April 30, 2009) in Derivative Instruments
(Nifty NSE May 2009 Futures) (Gross Notional) Rs. 435.39 lakhs.
Source : CRISIL Fund Analyser* Risk-free rate assumed to be 3.60% (364-day Treasury Bill yield on 29-04-09)
Source : CRISIL Fund Analyser* Risk-free rate assumed to be 3.60% (364-day Treasury Bill yield on 29-04-09)
Intouchmutually April 2009 11
PPoorrttffoolliioo TTuurrnnoovveerr RRaattiioo ((LLaasstt 11 YYeeaarr)) 8844..1144%%
+ Industry Classification as recommended by AMFI, $ Sponsor, ✤ PPaasstt ppeerrffoorrmmaannccee iiss nnoo gguuaarraanntteeee ooff ffuuttuurree rreessuullttss..
� Please refer to page no 30 for details on the Rating Methodology
hdfc-eq-r.qxd 5/7/2009 8:20 PM Page 2

An open-ended growth scheme An open-ended growth scheme
HDFCCore & Satellite Fund
PPoorrttffoolliioo TTuurrnnoovveerr RRaattiioo ((LLaasstt 11 YYeeaarr)) 7755..2244%%
DDaattee PPeerriioodd NNAAVV RReettuurrnnss BBeenncchhmmaarrkkppeerr UUnniitt ((RRss..)) ((%%))^̂ RReettuurrnnss ((%%))##
Oct 29, 08 Last Six months (182 days) 15.598 19.12* 25.03*Apr 29, 08 Last 1 Year (365 days) 28.367 -34.50* -38.18*Apr 28, 06 Last 3 Years (1097 days) 25.505 -10.00** -3.14**Sep 17, 04 Since Inception (1685 days) 10.000 14.36** 14.23**
+ Industry Classification as recommended by AMFI + Industry Classification as recommended by AMFI
Banks 18.44Software 10.67Media & Entertainment 10.28Pharmaceuticals 9.31Consumer Non Durables 7.29Auto Ancillaries 7.29Pesticides 5.95Industrial Capital Goods 4.71Petroleum Products 4.41Telecom - Services 3.10Auto 2.99Power 2.50Consumer Durables 2.15Industrial Products 1.82Chemicals 1.23Construction 1.17
Industry Allocation of Equity Holding (% of Net Assets)
NAV (as at April 29, 2009) NAV per Unit (Rs.)
Growth Option 18.580
Dividend Option 12.794
Relative Performance ^ (Growth Option) Relative Performance ^ (Growth Option)
NAV (as at April 29, 2009) NAV per Unit (Rs.)
Growth Option 13.809
Dividend Option 9.533
DDaattee PPeerriioodd NNAAVV RReettuurrnnss BBeenncchhmmaarrkkppeerr UUnniitt ((RRss..)) ((%%))^̂ RReettuurrnnss ((%%))##
^̂PPaasstt ppeerrffoorrmmaannccee mmaayy oorr mmaayy nnoott bbee ssuussttaaiinneedd iinn tthhee ffuuttuurreePerformance of the Dividend Option for the investor would be net of Distribution Tax as applicable* Absolute Returns ** Compounded Annualised Returns#S&P CNX 500 (Please refer to page no 30)
Oct 29, 08 Last Six months (182 days) 11.890 16.14* 26.90*Apr 29, 08 Last 1 Year (365 days) 20.887 -33.89* -37.09*Apr 28, 06 Last 3 Years (1097 days) 17.227 -7.09** -4.04**Apr 06, 05 Since Inception (1484 days) 10.000 8.26** 10.01**
CCoommppaannyy IInndduussttrryy++ %% ttoo NNAAVV
EEQQUUIITTYY && EEQQUUIITTYY RREELLAATTEEDD
State Bank of India Banks 6.24
ICICI Bank Ltd. Banks 5.85
Crompton Greaves Ltd. Industrial Capital Goods 5.80
United Phosphorus Ltd. Pesticides 5.08
Dr Reddy’s Laboratories Ltd. Pharmaceuticals 4.98
Container Corporation of India Ltd. Transportation 4.50
AIA Engineering Ltd. Industrial Capital Goods 4.12
Bharat Petroleum Corporation Ltd. Petroleum Products 3.90
Bank of Baroda Banks 3.49
Hindustan Petroleum Corporation Ltd. Petroleum Products 3.36
TToottaall ooff TToopp TTeenn EEqquuiittyy HHoollddiinnggss 4477..3322
TToottaall EEqquuiittyy && EEqquuiittyy RReellaatteedd HHoollddiinnggss 9922..1133
Cash, Cash Equivalents and Net Current Assets 7.87
GGrraanndd TToottaall 110000..0000
NNeett AAsssseettss ((RRss.. IInn LLaakkhhss)) 3322,,778888..7711
Portfolio – Top 10 Holdings (as at April 30, 2009)
Banks 19.13Pharmaceuticals 11.38Industrial Capital Goods 9.92Consumer Non Durables 9.26Media & Entertainment 8.49Petroleum Products 7.26Software 6.25Pesticides 5.08Transportation 4.50Power 3.04Auto Ancillaries 2.92Chemicals 1.84Auto 1.80Construction Project 0.63Paper Products 0.48Consumer Durables 0.15
Industry Allocation of Equity Holding (% of Net Assets)
PPoorrttffoolliioo TTuurrnnoovveerr RRaattiioo ((LLaasstt 11 YYeeaarr)) 6644..0044%%
HDFC Premier Multi-Cap Fund
^̂PPaasstt ppeerrffoorrmmaannccee mmaayy oorr mmaayy nnoott bbee ssuussttaaiinneedd iinn tthhee ffuuttuurreePerformance of the Dividend Option for the investor would be net of Distribution Tax as applicable*Absolute Returns #BSE 200 ** Compounded Annualised Returns
CCoommppaannyy IInndduussttrryy++ %% ttoo NNAAVV
EEQQUUIITTYY && EEQQUUIITTYY RREELLAATTEEDD
ICICI Bank Ltd. Banks 6.51
State Bank of India Banks 6.11
United Phosphorus Ltd. Pesticides 5.95
Bank of Baroda Banks 5.82
Infosys Technologies Ltd. Software 5.27
Dr Reddy’s Laboratories Ltd. Pharmaceuticals 5.00
Crompton Greaves Ltd. Industrial Capital Goods 4.71
Tata Consultancy Services Ltd. Software 4.29
Britannia Industries Ltd. Consumer Non Durables 3.70
United Spirits Ltd. Consumer Non Durables 3.59
TToottaall ooff TToopp TTeenn EEqquuiittyy HHoollddiinnggss 5500..9955
TToottaall EEqquuiittyy && EEqquuiittyy RReellaatteedd HHoollddiinnggss 9933..3311
Cash, Cash Equivalents and Net Current Assets 6.69
GGrraanndd TToottaall 110000..0000
NNeett AAsssseettss ((RRss.. IInn LLaakkhhss)) 2277,,222233..6633
Portfolio – Top 10 Holdings (as at April 30, 2009)
Std Deviation Beta Sharpe Ratio*
Risk Ratio (for the 3-yr period ended April 29, 2009) 9.60% 0.9600 -0.01
Source : CRISIL Fund Analyser** Risk-free rate assumed to be 3.60% (364-day Treasury Bill yield on 29-04-09)
Std Deviation Beta Sharpe Ratio*
Risk Ratio (for the 3-yr period ended April 29, 2009) 9.30% 0.9330 0.00
Source : CRISIL Fund Analyser** Risk-free rate assumed to be 3.60% (364-day Treasury Bill yield on 29-04-09)
12 April 2009 Intouchmutually
hdfc-eq-r.qxd 5/7/2009 8:20 PM Page 3

CCoommppaannyy IInndduussttrryy++ %% ttoo NNAAVV
EEQQUUIITTYY && EEQQUUIITTYY RREELLAATTEEDD
Reliance Industries Ltd. Petroleum Products 17.20
Infosys Technologies Ltd. Software 8.90
ICICI Bank Ltd. Banks 6.45
ITC Ltd. Consumer Non Durables 6.05
Bharti Airtel Ltd. Telecom - Services 6.04
Larsen & Toubro Ltd. Construction Project 5.62
Housing Development Finance Corporation Ltd.$ Finance 5.08
HDFC Bank Ltd. Banks 4.82
Oil & Natural Gas Corporation Ltd. Oil 4.49
State Bank of India Banks 4.43
TToottaall ooff TToopp TTeenn EEqquuiittyy HHoollddiinnggss 6699..0088
TToottaall EEqquuiittyy && EEqquuiittyy RReellaatteedd HHoollddiinnggss 9988..9911
Cash, Cash Equivalents and Net Current Assets 1.09
GGrraanndd TToottaall 110000..0000
NNeett AAsssseettss ((RRss.. IInn LLaakkhhss)) 44,,443300..1100
Portfolio – Top 10 Holdings (as at April 30, 2009)
PPoorrttffoolliioo TTuurrnnoovveerr RRaattiioo ((LLaasstt 11 YYeeaarr)) 111122..3366%%
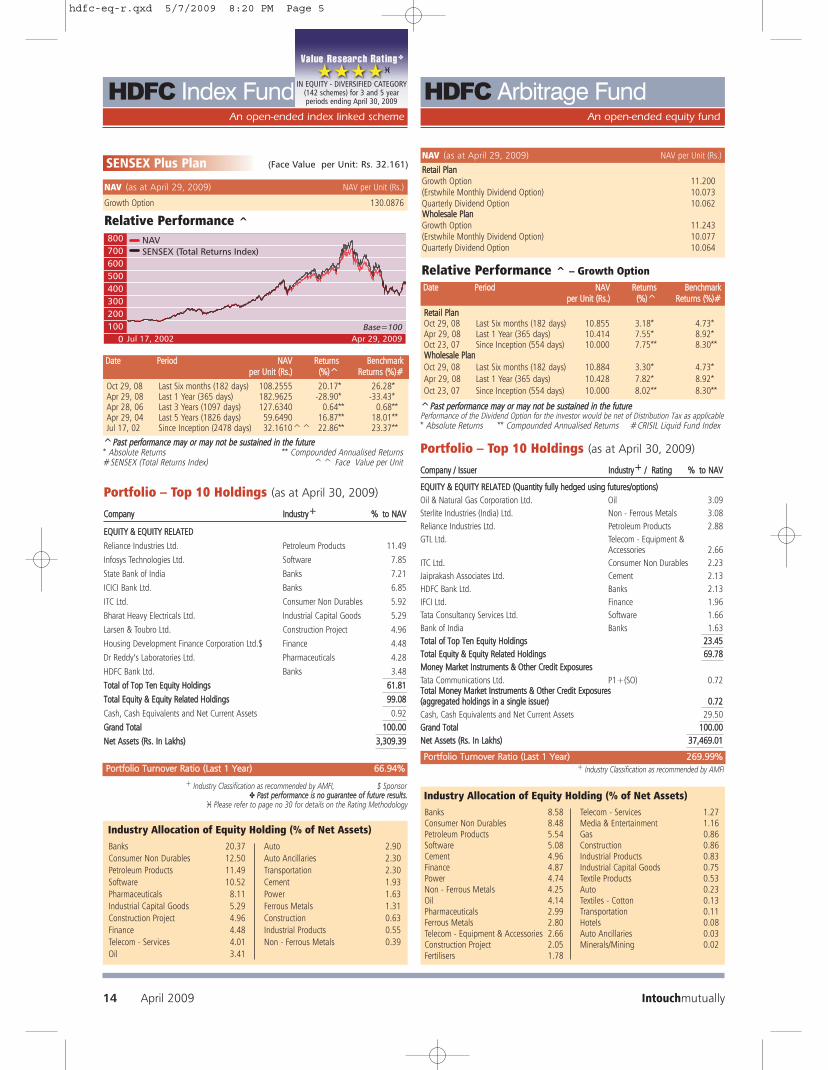
Relative Performance ^
+ Industry Classification as recommended by AMFI,$ Sponsor
SENSEX Plan (Face Value per Unit: Rs. 32.161)
DDaattee PPeerriioodd NNAAVV RReettuurrnnss BBeenncchhmmaarrkkppeerr UUnniitt ((RRss..)) ((%%))^̂ RReettuurrnnss ((%%))##
^̂PPaasstt ppeerrffoorrmmaannccee mmaayy oorr mmaayy nnoott bbee ssuussttaaiinneedd iinn tthhee ffuuttuurree* Absolute Returns ** Compounded Annualised Returns#SENSEX (Total Returns Index) ^^Face Value per Unit
Oct 29, 08 Last Six months (182 days) 79.1979 22.13* 26.28*Apr 29, 08 Last 1 Year (365 days) 150.9082 -35.91* -33.43*Apr 28, 06 Last 3 Years (1097 days) 110.1050 -4.22** 0.68**Apr 29, 04 Last 5 Years (1826 days) 53.5150 12.56** 18.01**Jul 17, 02 Since Inception (2478 days) 32.1610^^ 17.61** 23.37**
NAV (as at April 29, 2009) NAV per Unit (Rs.)
Growth Option 96.7233
An open-ended index linked scheme
HDFC Index Fund HDFC Index Fund
NIFTY Plan (Face Value per Unit: Rs. 10.326)
DDaattee PPeerriioodd NNAAVV RReettuurrnnss BBeenncchhmmaarrkkppeerr UUnniitt ((RRss..)) ((%%))^̂ RReettuurrnnss ((%%))##
Relative Performance ^
^̂PPaasstt ppeerrffoorrmmaannccee mmaayy oorr mmaayy nnoott bbee ssuussttaaiinneedd iinn tthhee ffuuttuurree* Absolute Returns ** Compounded Annualised Returns#S&P CNX Nifty (Total Returns Index) ^^Face Value per Unit
Oct 29, 08 Last Six months (182 days) 24.5742 26.32* 29.33*Apr 29, 08 Last 1 Year (365 days) 46.4252 -33.14* -32.36*Apr 28, 06 Last 3 Years (1097 days) 34.4030 -3.36** 0.98**Apr 29, 04 Last 5 Years (1826 days) 18.1710 11.30** 15.70**Jul 17, 02 Since Inception (2478 days) 10.3260^^ 17.60** 21.47**
NAV (as at April 29, 2009) NAV per Unit (Rs.)
Growth Option 31.0413
CCoommppaannyy IInndduussttrryy++ %% ttoo NNAAVV
EEQQUUIITTYY && EEQQUUIITTYY RREELLAATTEEDD
Reliance Industries Ltd. Petroleum Products 12.88
Oil & Natural Gas Corporation Ltd. Oil 8.38
NTPC Ltd. Power 7.10
Bharti Airtel Ltd. Telecom - Services 6.47
Infosys Technologies Ltd. Software 3.92
State Bank of India Banks 3.68
Bharat Heavy Electricals Ltd. Industrial Capital Goods 3.67
ITC Ltd. Consumer Non Durables 3.23
Tata Consultancy Services Ltd. Software 2.77
ICICI Bank Ltd. Banks 2.42
TToottaall ooff TToopp TTeenn EEqquuiittyy HHoollddiinnggss 5544..5522
TToottaall EEqquuiittyy && EEqquuiittyy RReellaatteedd HHoollddiinnggss 9988..6699
Cash, Cash Equivalents and Net Current Assets 1.31
GGrraanndd TToottaall 110000..0000
NNeett AAsssseettss ((RRss.. IInn LLaakkhhss)) 22,,667733..5588
Portfolio – Top 10 Holdings (as at April 30, 2009)
PPoorrttffoolliioo TTuurrnnoovveerr RRaattiioo ((LLaasstt 11 YYeeaarr)) 117777..5533%%
+ Industry Classification as recommended by AMFI
An open-ended index linked scheme
Petroleum Products 17.20
Banks 15.70
Software 11.91
Consumer Non Durables 9.15
Telecom - Services 7.92
Power 5.77
Construction Project 5.62
Finance 5.08
Oil 4.49
Industrial Capital Goods 3.43
Cement 3.40
Auto 3.30
Non - Ferrous Metals 2.13
Pharmaceuticals 1.62
Ferrous Metals 1.47
Construction 0.72
Industry Allocation of Equity Holding (% of Net Assets) Petroleum Products 15.80
Power 11.83
Telecom - Services 10.01
Oil 9.98
Banks 9.84
Software 9.27
Consumer Non Durables 5.55
Industrial Capital Goods 5.04
Auto 3.26
Ferrous Metals 2.83
Finance 2.81
Pharmaceuticals 2.37
Non - Ferrous Metals 2.35
Construction Project 2.33
Construction 2.09
Cement 1.86
Gas 1.47
Industry Allocation of Equity Holding (% of Net Assets)
TTrraacckkiinngg EErrrroorr SSiinnccee IInncceeppttiioonn ((AAnnnnuuaalliisseedd)) 22..5533%% TTrraacckkiinngg EErrrroorr SSiinnccee IInncceeppttiioonn ((AAnnnnuuaalliisseedd)) 22..8833%%
April 2009 13Intouchmutually
hdfc-eq-r.qxd 5/7/2009 8:20 PM Page 4
CCoommppaannyy IInndduussttrryy++ %% ttoo NNAAVV
EEQQUUIITTYY && EEQQUUIITTYY RREELLAATTEEDD
Reliance Industries Ltd. Petroleum Products 11.49
Infosys Technologies Ltd. Software 7.85
State Bank of India Banks 7.21
ICICI Bank Ltd. Banks 6.85
ITC Ltd. Consumer Non Durables 5.92
Bharat Heavy Electricals Ltd. Industrial Capital Goods 5.29
Larsen & Toubro Ltd. Construction Project 4.96
Housing Development Finance Corporation Ltd.$ Finance 4.48
Dr Reddy’s Laboratories Ltd. Pharmaceuticals 4.28
HDFC Bank Ltd. Banks 3.48
TToottaall ooff TToopp TTeenn EEqquuiittyy HHoollddiinnggss 6611..8811
TToottaall EEqquuiittyy && EEqquuiittyy RReellaatteedd HHoollddiinnggss 9999..0088
Cash, Cash Equivalents and Net Current Assets 0.92
GGrraanndd TToottaall 110000..0000
NNeett AAsssseettss ((RRss.. IInn LLaakkhhss)) 33,,330099..3399
Portfolio – Top 10 Holdings (as at April 30, 2009)
PPoorrttffoolliioo TTuurrnnoovveerr RRaattiioo ((LLaasstt 11 YYeeaarr)) 6666..9944%%
DDaattee PPeerriioodd NNAAVV RReettuurrnnss BBeenncchhmmaarrkkppeerr UUnniitt ((RRss..)) ((%%))^̂ RReettuurrnnss ((%%))##
Relative Performance ^
^̂PPaasstt ppeerrffoorrmmaannccee mmaayy oorr mmaayy nnoott bbee ssuussttaaiinneedd iinn tthhee ffuuttuurree* Absolute Returns ** Compounded Annualised Returns#SENSEX (Total Returns Index) ^^ Face Value per Unit
Oct 29, 08 Last Six months (182 days) 108.2555 20.17* 26.28*Apr 29, 08 Last 1 Year (365 days) 182.9625 -28.90* -33.43*Apr 28, 06 Last 3 Years (1097 days) 127.6340 0.64** 0.68**Apr 29, 04 Last 5 Years (1826 days) 59.6490 16.87** 18.01**Jul 17, 02 Since Inception (2478 days) 32.1610^^ 22.86** 23.37**
+ Industry Classification as recommended by AMFI, $ Sponsor✤ PPaasstt ppeerrffoorrmmaannccee iiss nnoo gguuaarraanntteeee ooff ffuuttuurree rreessuullttss..
� Please refer to page no 30 for details on the Rating Methodology
SENSEX Plus Plan (Face Value per Unit: Rs. 32.161)
NAV (as at April 29, 2009) NAV per Unit (Rs.)
Growth Option 130.0876
An open-ended index linked scheme
HDFC Index Fund
Banks 20.37
Consumer Non Durables 12.50
Petroleum Products 11.49
Software 10.52
Pharmaceuticals 8.11
Industrial Capital Goods 5.29
Construction Project 4.96
Finance 4.48
Telecom - Services 4.01
Oil 3.41
Auto 2.90
Auto Ancillaries 2.30
Transportation 2.30
Cement 1.93
Power 1.63
Ferrous Metals 1.31
Construction 0.63
Industrial Products 0.55
Non - Ferrous Metals 0.39
Industry Allocation of Equity Holding (% of Net Assets)
PPoorrttffoolliioo TTuurrnnoovveerr RRaattiioo ((LLaasstt 11 YYeeaarr)) 226699..9999%%
DDaattee PPeerriioodd NNAAVV RReettuurrnnss BBeenncchhmmaarrkkppeerr UUnniitt ((RRss..)) ((%%))^̂ RReettuurrnnss ((%%))##
Relative Performance ^ – Growth Option
^̂PPaasstt ppeerrffoorrmmaannccee mmaayy oorr mmaayy nnoott bbee ssuussttaaiinneedd iinn tthhee ffuuttuurreePerformance of the Dividend Option for the investor would be net of Distribution Tax as applicable* Absolute Returns ** Compounded Annualised Returns #CRISIL Liquid Fund Index
RReettaaiill PPllaannOct 29, 08 Last Six months (182 days) 10.855 3.18* 4.73*Apr 29, 08 Last 1 Year (365 days) 10.414 7.55* 8.92*Oct 23, 07 Since Inception (554 days) 10.000 7.75** 8.30**WWhhoolleessaallee PPllaann
Oct 29, 08 Last Six months (182 days) 10.884 3.30* 4.73*
Apr 29, 08 Last 1 Year (365 days) 10.428 7.82* 8.92*
Oct 23, 07 Since Inception (554 days) 10.000 8.02** 8.30**
+ Industry Classification as recommended by AMFI
NAV (as at April 29, 2009) NAV per Unit (Rs.)
RReettaaiill PPllaannGrowth Option 11.200(Erstwhile Monthly Dividend Option) 10.073Quarterly Dividend Option 10.062WWhhoolleessaallee PPllaannGrowth Option 11.243(Erstwhile Monthly Dividend Option) 10.077Quarterly Dividend Option 10.064
An open-ended equity fund
HDFC Arbitrage Fund
Banks 8.58Consumer Non Durables 8.48Petroleum Products 5.54Software 5.08Cement 4.96Finance 4.87Power 4.74Non - Ferrous Metals 4.25Oil 4.14Pharmaceuticals 2.99Ferrous Metals 2.80Telecom - Equipment & Accessories 2.66Construction Project 2.05Fertilisers 1.78
Telecom - Services 1.27Media & Entertainment 1.16Gas 0.86Construction 0.86Industrial Products 0.83Industrial Capital Goods 0.75Textile Products 0.53Auto 0.23Textiles - Cotton 0.13Transportation 0.11Hotels 0.08Auto Ancillaries 0.03Minerals/Mining 0.02
Industry Allocation of Equity Holding (% of Net Assets)
IN EQUITY - DIVERSIFIED CATEGORY(142 schemes) for 3 and 5 year periods ending April 30, 2009
CCoommppaannyy // IIssssuueerr IInndduussttrryy++ // RRaattiinngg %% ttoo NNAAVV
EEQQUUIITTYY && EEQQUUIITTYY RREELLAATTEEDD ((QQuuaannttiittyy ffuullllyy hheeddggeedd uussiinngg ffuuttuurreess//ooppttiioonnss))
Oil & Natural Gas Corporation Ltd. Oil 3.09
Sterlite Industries (India) Ltd. Non - Ferrous Metals 3.08
Reliance Industries Ltd. Petroleum Products 2.88
GTL Ltd. Telecom - Equipment & Accessories 2.66
ITC Ltd. Consumer Non Durables 2.23
Jaiprakash Associates Ltd. Cement 2.13
HDFC Bank Ltd. Banks 2.13
IFCI Ltd. Finance 1.96
Tata Consultancy Services Ltd. Software 1.66
Bank of India Banks 1.63
TToottaall ooff TToopp TTeenn EEqquuiittyy HHoollddiinnggss 2233..4455
TToottaall EEqquuiittyy && EEqquuiittyy RReellaatteedd HHoollddiinnggss 6699..7788
MMoonneeyy MMaarrkkeett IInnssttrruummeennttss && OOtthheerr CCrreeddiitt EExxppoossuurreess
Tata Communications Ltd. P1+(SO) 0.72 TToottaall MMoonneeyy MMaarrkkeett IInnssttrruummeennttss && OOtthheerr CCrreeddiitt EExxppoossuurreess((aaggggrreeggaatteedd hhoollddiinnggss iinn aa ssiinnggllee iissssuueerr)) 00..7722
Cash, Cash Equivalents and Net Current Assets 29.50
GGrraanndd TToottaall 110000..0000
NNeett AAsssseettss ((RRss.. IInn LLaakkhhss)) 3377,,446699..0011
Portfolio – Top 10 Holdings (as at April 30, 2009)
14 April 2009 Intouchmutually
hdfc-eq-r.qxd 5/7/2009 8:20 PM Page 5

+ Industry Classification as recommended by AMFI, $ Sponsor
DDaattee PPeerriioodd NNAAVV RReettuurrnnss BBeenncchhmmaarrkkppeerr UUnniitt ((RRss..)) ((%%))^̂ RReettuurrnnss ((%%))##
NAV (as at April 29, 2009) NAV per Unit (Rs.)
Growth Plan 29.489Dividend Plan 13.040
Relative Performance ^ (Growth Plan)
^̂PPaasstt ppeerrffoorrmmaannccee mmaayy oorr mmaayy nnoott bbee ssuussttaaiinneedd iinn tthhee ffuuttuurreePerformance of the Dividend Plan for the investor would be net of Distribution Tax as applicable* Absolute Returns ** Compounded Annualised Returns N.A. Not Available #CRISIL Balanced Fund Index
Oct 29, 08 Last Six Months (182 days) 24.726 19.26* 23.58*Apr 29, 08 Last 1 Year (365 days) 36.460 -19.12* -18.31*Apr 28, 06 Last 3 Years (1097 days) 29.499 -0.01** 3.60**Apr 29, 04 Last 5 Years (1826 days) 17.177 11.41** 10.91**Sep 11, 00 Since Inception (3152 days) 10.000 13.34** N.A.
PPoorrttffoolliioo TTuurrnnoovveerr RRaattiioo ((LLaasstt 11 YYeeaarr)) 3366..0055%%
HDFCBalanced FundAn open-ended balanced scheme
HDFC
Prudence Fund
An open-ended balanced scheme
DDaattee PPeerriioodd NNAAVV RReettuurrnnss BBeenncchhmmaarrkkppeerr UUnniitt ((RRss..)) ((%%))$$$$^̂ RReettuurrnnss ((%%))##
NAV (as at April 29, 2009) NAV per Unit (Rs.)
Growth Plan 104.758Dividend Plan 18.121
Relative Performance ^ (Growth Plan)
^̂PPaasstt ppeerrffoorrmmaannccee mmaayy oorr mmaayy nnoott bbee ssuussttaaiinneedd iinn tthhee ffuuttuurree Performance of the Dividend Plan for the investor would be net of Distribution Tax as applicable* Absolute Returns ** Compounded Annualised Returns #CRISIL Balanced Fund Index$$ Adjusted for the dividends declared under the scheme prior to its splittng into the Dividendand Growth Plans N.A. Not Available
Oct 29, 08 Last Six Months (182 days) 88.251 18.70* 23.58*Apr 29, 08 Last 1 Year (365 days) 133.965 -21.80* -18.31*Apr 28, 06 Last 3 Years (1097 days) 95.995 2.95** 3.60**Apr 29, 04 Last 5 Years (1826 days) 47.770 17.00** 10.91**Apr 29, 99 Last 10 Years (3653 days) 12.960 23.22** N.A.Feb 01, 94 Since Inception (5566 days) 10.000 18.63** N.A.
IN HYBRID EQUITY - ORIENTED CATEGORY(25 schemes) for 3 and 5 year periods ending April 30, 2009
PPoorrttffoolliioo TTuurrnnoovveerr RRaattiioo ((LLaasstt 11 YYeeaarr)) 6666..9966%%+ Industry Classification as recommended by AMFI $ Sponsor
✤ PPaasstt ppeerrffoorrmmaannccee iiss nnoo gguuaarraanntteeee ooff ffuuttuurree rreessuullttss.. � Please refer to page no 30 for details on the Rating Methodology
CCoommppaannyy // IIssssuueerr IInndduussttrryy++ // RRaattiinngg %% ttoo NNAAVV
EEQQUUIITTYY && EEQQUUIITTYY RREELLAATTEEDD
Reliance Industries Ltd. Petroleum Products 6.20
Coromandel Fertilisers Ltd. Fertilisers 5.18
Sun Pharmaceutical Industries Ltd. Pharmaceuticals 4.24
The Federal Bank Ltd. Banks 4.15
ITC Ltd. Consumer Non Durables 3.87
Infosys Technologies Ltd. Software 3.34
Bharat Heavy Electricals Ltd. Industrial Capital Goods 3.21
Dabur India Ltd. Consumer Non Durables 2.87
Motherson Sumi Systems Ltd. Auto Ancillaries 2.80
Axis Bank Ltd. Banks 2.78
TToottaall ooff TToopp TTeenn EEqquuiittyy HHoollddiinnggss 3388..6644
TToottaall EEqquuiittyy && EEqquuiittyy RReellaatteedd HHoollddiinnggss 6699..6633
MMoonneeyy MMaarrkkeett IInnssttrruummeennttss && OOtthheerr CCrreeddiitt EExxppoossuurreess
Grasim Industries Ltd. AAA(SO) 5.57
Housing Development Finance Corporation Ltd.$ AAA 5.37
Shriram Transport Finance Co. Ltd. AA(SO) 4.37
Bajaj Auto Ltd. AAA(SO) 3.11
State Bank of India AAA 3.03
Reliance Industries Ltd. AAA(SO) 1.18
TToottaall MMoonneeyy MMaarrkkeett IInnssttrruummeennttss && OOtthheerr CCrreeddiitt EExxppoossuurreess((aaggggrreeggaatteedd hhoollddiinnggss iinn aa ssiinnggllee iissssuueerr)) 2222..6633
Cash, Cash Equivalents and Net Current Assets 7.74
GGrraanndd TToottaall 110000..0000
NNeett AAsssseettss ((RRss.. IInn LLaakkhhss)) 99,,003366..1111
Portfolio – Top Holdings (as at April 30, 2009)
CCoommppaannyy // IIssssuueerr IInndduussttrryy++ // RRaattiinngg %% ttoo NNAAVV
EEQQUUIITTYY && EEQQUUIITTYY RREELLAATTEEDDGlaxoSmithkline Consumer Healthcare Ltd. Consumer Non Durables 3.80 Bank of Baroda Banks 3.29 ICICI Bank Ltd. Banks 3.18 LIC Housing Finance Ltd. Finance 3.17 Crompton Greaves Ltd. Industrial Capital Goods 3.06 State Bank of India Banks 2.87 Axis Bank Ltd. Banks 2.56 Sun Pharmaceutical Industries Ltd. Pharmaceuticals 2.37 AIA Engineering Ltd. Industrial Capital Goods 2.30 Rural Electrification Corporation Ltd. Finance 2.06 TToottaall ooff TToopp TTeenn EEqquuiittyy HHoollddiinnggss 2288..6666TToottaall EEqquuiittyy && EEqquuiittyy RReellaatteedd HHoollddiinnggss 7744..9988MMoonneeyy MMaarrkkeett IInnssttrruummeennttss && OOtthheerr CCrreeddiitt EExxppoossuurreess // GGoovveerrnnmmeenntt SSeeccuurriittiieessIndian Railways Finance Corporation Ltd. AAA 6.16 Power Finance Corporation Ltd. AAA 3.37 State Bank of India AAA 3.36 Housing Development Finance Corporation Ltd.$ AAA 1.66 Government Securities SOV 1.25 Punjab National Bank AAA 1.08 Infrastructure Development Finance Co. Ltd. AAA 0.82 National Bank for Agriculture & Rural Development AAA 0.82 State Bank of Indore AAA 0.81 State Bank of Bikaner & Jaipur AAA 0.55 TToottaall ooff TToopp TTeenn MMoonneeyy MMaarrkkeett IInnssttrruummeennttss && OOtthheerr CCrreeddiitt EExxppoossuurreess // GGoovveerrnnmmeenntt SSeeccuurriittiieess((aaggggrreeggaatteedd hhoollddiinnggss iinn aa ssiinnggllee iissssuueerr)) 1199..8888 TToottaall MMoonneeyy MMaarrkkeett IInnssttrruummeennttss && OOtthheerr CCrreeddiitt EExxppoossuurreess // GGoovveerrnnmmeenntt SSeeccuurriittiieess 2200..8800Cash, Cash Equivalents and Net Current Assets 4.22 GGrraanndd TToottaall 110000..0000NNeett AAsssseettss ((RRss.. IInn LLaakkhhss)) 119955,,777744..2211
Portfolio – Top 10 Holdings (as at April 30, 2009)
Pharmaceuticals 9.78
Banks 9.46
Consumer Non Durables 8.96
Petroleum Products 8.41
Software 6.10
Industrial Capital Goods 5.53
Fertilisers 5.18
Auto Ancillaries 4.75
Construction Project 2.51
Telecom - Services 2.50
Chemicals 1.70
Power 1.38
Consumer Durables 1.24
Construction 1.15
Industrial Products 0.98
Industry Allocation of Equity Holding (% of Net Assets) Banks 14.95Consumer Non Durables 9.70Pharmaceuticals 8.08Industrial Capital Goods 6.02Finance 5.55Media & Entertainment 5.53Software 3.39Industrial Products 2.84Auto Ancillaries 2.60Textile Products 2.15Construction Project 2.05
Pesticides 1.90Chemicals 1.63Trading 1.41Petroleum Products 1.39Auto 1.33Cement 1.06Power 0.95Paper Products 0.94Construction 0.81Ferrous Metals 0.49Textiles - Synthetic 0.21
Industry Allocation of Equity Holding (% of Net Assets)
April 2009 15Intouchmutually
hdfc-eq-r.qxd 5/7/2009 8:20 PM Page 6
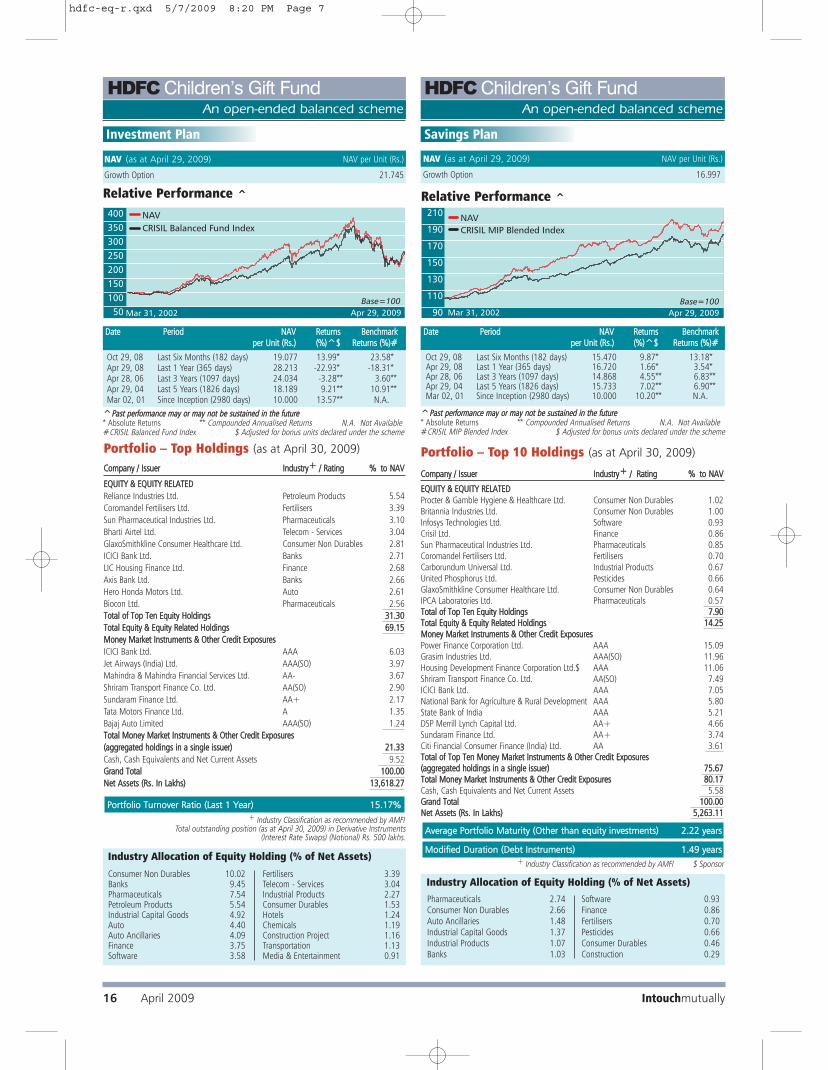
HDFCChildren’s Gift FundAn open-ended balanced scheme
HDFCChildren’s Gift FundAn open-ended balanced scheme
Investment Plan
DDaattee PPeerriioodd NNAAVV RReettuurrnnss BBeenncchhmmaarrkkppeerr UUnniitt ((RRss..)) ((%%))^̂$$ RReettuurrnnss ((%%))##
Oct 29, 08 Last Six Months (182 days) 19.077 13.99* 23.58*Apr 29, 08 Last 1 Year (365 days) 28.213 -22.93* -18.31*Apr 28, 06 Last 3 Years (1097 days) 24.034 -3.28** 3.60**Apr 29, 04 Last 5 Years (1826 days) 18.189 9.21** 10.91**Mar 02, 01 Since Inception (2980 days) 10.000 13.57** N.A.
Relative Performance ^
NAV (as at April 29, 2009) NAV per Unit (Rs.)
Growth Option 21.745
PPoorrttffoolliioo TTuurrnnoovveerr RRaattiioo ((LLaasstt 11 YYeeaarr)) 1155..1177%%
+ Industry Classification as recommended by AMFITotal outstanding position (as at April 30, 2009) in Derivative Instruments
(Interest Rate Swaps) (Notional) Rs. 500 lakhs.
DDaattee PPeerriioodd NNAAVV RReettuurrnnss BBeenncchhmmaarrkkppeerr UUnniitt ((RRss..)) ((%%))^̂$$ RReettuurrnnss ((%%))##
Relative Performance ^
Oct 29, 08 Last Six Months (182 days) 15.470 9.87* 13.18*Apr 29, 08 Last 1 Year (365 days) 16.720 1.66* 3.54*Apr 28, 06 Last 3 Years (1097 days) 14.868 4.55** 6.83**Apr 29, 04 Last 5 Years (1826 days) 15.733 7.02** 6.90**Mar 02, 01 Since Inception (2980 days) 10.000 10.20** N.A.
Savings Plan
NAV (as at April 29, 2009) NAV per Unit (Rs.)
Growth Option 16.997
MMooddiiffiieedd DDuurraattiioonn ((DDeebbtt IInnssttrruummeennttss)) 11..4499 yyeeaarrss
AAvveerraaggee PPoorrttffoolliioo MMaattuurriittyy ((OOtthheerr tthhaann eeqquuiittyy iinnvveessttmmeennttss)) 22..2222 yyeeaarrss
+ Industry Classification as recommended by AMFI $ Sponsor
Portfolio – Top Holdings (as at April 30, 2009)
CCoommppaannyy // IIssssuueerr IInndduussttrryy++ // RRaattiinngg %% ttoo NNAAVV
EEQQUUIITTYY && EEQQUUIITTYY RREELLAATTEEDDProcter & Gamble Hygiene & Healthcare Ltd. Consumer Non Durables 1.02 Britannia Industries Ltd. Consumer Non Durables 1.00 Infosys Technologies Ltd. Software 0.93 Crisil Ltd. Finance 0.86 Sun Pharmaceutical Industries Ltd. Pharmaceuticals 0.85 Coromandel Fertilisers Ltd. Fertilisers 0.70 Carborundum Universal Ltd. Industrial Products 0.67 United Phosphorus Ltd. Pesticides 0.66 GlaxoSmithkline Consumer Healthcare Ltd. Consumer Non Durables 0.64 IPCA Laboratories Ltd. Pharmaceuticals 0.57 TToottaall ooff TToopp TTeenn EEqquuiittyy HHoollddiinnggss 77..9900TToottaall EEqquuiittyy && EEqquuiittyy RReellaatteedd HHoollddiinnggss 1144..2255MMoonneeyy MMaarrkkeett IInnssttrruummeennttss && OOtthheerr CCrreeddiitt EExxppoossuurreessPower Finance Corporation Ltd. AAA 15.09 Grasim Industries Ltd. AAA(SO) 11.96 Housing Development Finance Corporation Ltd.$ AAA 11.06 Shriram Transport Finance Co. Ltd. AA(SO) 7.49 ICICI Bank Ltd. AAA 7.05 National Bank for Agriculture & Rural Development AAA 5.80 State Bank of India AAA 5.21 DSP Merrill Lynch Capital Ltd. AA+ 4.66 Sundaram Finance Ltd. AA+ 3.74 Citi Financial Consumer Finance (India) Ltd. AA 3.61 TToottaall ooff TToopp TTeenn MMoonneeyy MMaarrkkeett IInnssttrruummeennttss && OOtthheerr CCrreeddiitt EExxppoossuurreess((aaggggrreeggaatteedd hhoollddiinnggss iinn aa ssiinnggllee iissssuueerr)) 7755..6677TToottaall MMoonneeyy MMaarrkkeett IInnssttrruummeennttss && OOtthheerr CCrreeddiitt EExxppoossuurreess 8800..1177Cash, Cash Equivalents and Net Current Assets 5.58 GGrraanndd TToottaall 110000..0000NNeett AAsssseettss ((RRss.. IInn LLaakkhhss)) 55,,226633..1111
Portfolio – Top 10 Holdings (as at April 30, 2009)
Consumer Non Durables 10.02Banks 9.45Pharmaceuticals 7.54Petroleum Products 5.54Industrial Capital Goods 4.92Auto 4.40Auto Ancillaries 4.09Finance 3.75Software 3.58
Fertilisers 3.39Telecom - Services 3.04Industrial Products 2.27Consumer Durables 1.53Hotels 1.24Chemicals 1.19Construction Project 1.16Transportation 1.13Media & Entertainment 0.91
Industry Allocation of Equity Holding (% of Net Assets)
Pharmaceuticals 2.74Consumer Non Durables 2.66Auto Ancillaries 1.48Industrial Capital Goods 1.37Industrial Products 1.07Banks 1.03
Software 0.93Finance 0.86Fertilisers 0.70Pesticides 0.66Consumer Durables 0.46Construction 0.29
Industry Allocation of Equity Holding (% of Net Assets)
CCoommppaannyy // IIssssuueerr IInndduussttrryy++ // RRaattiinngg %% ttoo NNAAVV
EEQQUUIITTYY && EEQQUUIITTYY RREELLAATTEEDD
Reliance Industries Ltd. Petroleum Products 5.54
Coromandel Fertilisers Ltd. Fertilisers 3.39
Sun Pharmaceutical Industries Ltd. Pharmaceuticals 3.10
Bharti Airtel Ltd. Telecom - Services 3.04
GlaxoSmithkline Consumer Healthcare Ltd. Consumer Non Durables 2.81
ICICI Bank Ltd. Banks 2.71
LIC Housing Finance Ltd. Finance 2.68
Axis Bank Ltd. Banks 2.66
Hero Honda Motors Ltd. Auto 2.61
Biocon Ltd. Pharmaceuticals 2.56
TToottaall ooff TToopp TTeenn EEqquuiittyy HHoollddiinnggss 3311..3300
TToottaall EEqquuiittyy && EEqquuiittyy RReellaatteedd HHoollddiinnggss 6699..1155
MMoonneeyy MMaarrkkeett IInnssttrruummeennttss && OOtthheerr CCrreeddiitt EExxppoossuurreess
ICICI Bank Ltd. AAA 6.03
Jet Airways (India) Ltd. AAA(SO) 3.97
Mahindra & Mahindra Financial Services Ltd. AA- 3.67
Shriram Transport Finance Co. Ltd. AA(SO) 2.90
Sundaram Finance Ltd. AA+ 2.17
Tata Motors Finance Ltd. A 1.35
Bajaj Auto Limited AAA(SO) 1.24
TToottaall MMoonneeyy MMaarrkkeett IInnssttrruummeennttss && OOtthheerr CCrreeddiitt EExxppoossuurreess
((aaggggrreeggaatteedd hhoollddiinnggss iinn aa ssiinnggllee iissssuueerr)) 2211..3333
Cash, Cash Equivalents and Net Current Assets 9.52
GGrraanndd TToottaall 110000..0000
NNeett AAsssseettss ((RRss.. IInn LLaakkhhss)) 1133,,661188..2277
^̂PPaasstt ppeerrffoorrmmaannccee mmaayy oorr mmaayy nnoott bbee ssuussttaaiinneedd iinn tthhee ffuuttuurree* Absolute Returns ** Compounded Annualised Returns N.A. Not Available#CRISIL Balanced Fund Index $ Adjusted for bonus units declared under the scheme
^̂PPaasstt ppeerrffoorrmmaannccee mmaayy oorr mmaayy nnoott bbee ssuussttaaiinneedd iinn tthhee ffuuttuurree* Absolute Returns ** Compounded Annualised Returns N.A. Not Available#CRISIL MIP Blended Index $ Adjusted for bonus units declared under the scheme
16 April 2009 Intouchmutually
hdfc-eq-r.qxd 5/7/2009 8:20 PM Page 7
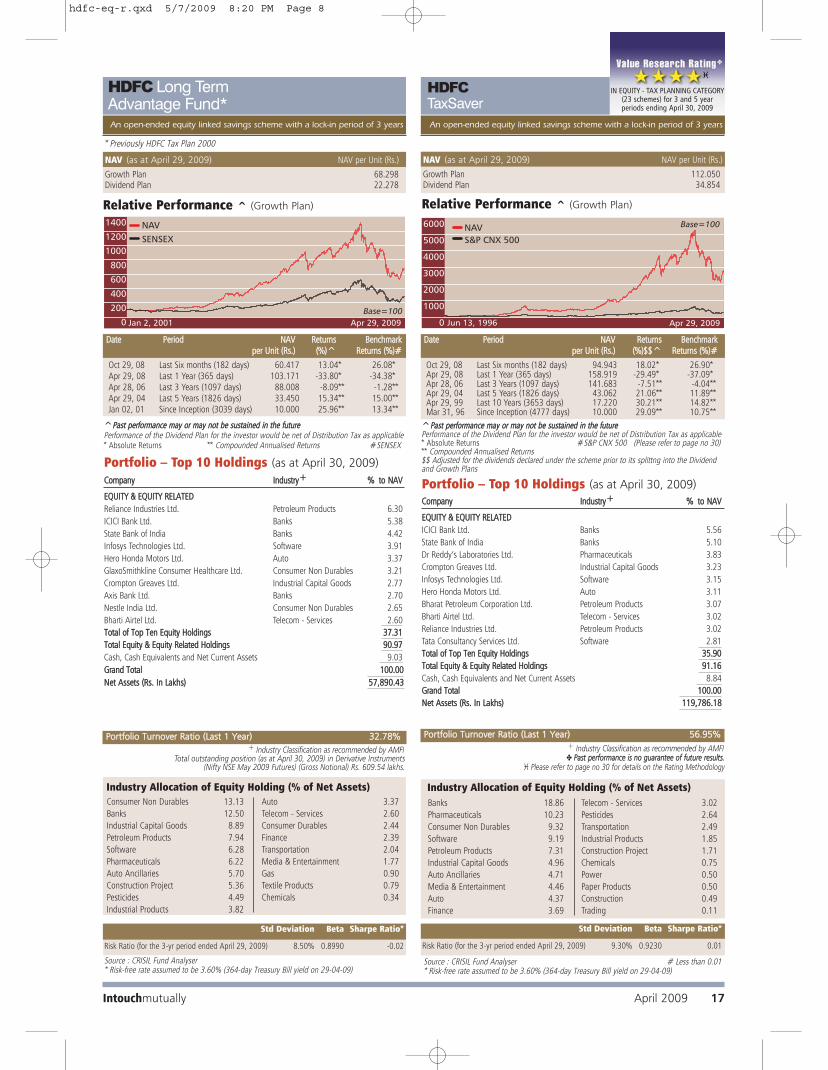
HDFC Long Term Advantage Fund*An open-ended equity linked savings scheme with a lock-in period of 3 years
HDFC
TaxSaver
An open-ended equity linked savings scheme with a lock-in period of 3 years
Portfolio – Top 10 Holdings (as at April 30, 2009)
DDaattee PPeerriioodd NNAAVV RReettuurrnnss BBeenncchhmmaarrkkppeerr UUnniitt ((RRss..)) ((%%))^̂ RReettuurrnnss ((%%))##
NAV (as at April 29, 2009) NAV per Unit (Rs.)
Growth Plan 68.298Dividend Plan 22.278
Relative Performance ^ (Growth Plan)
^̂PPaasstt ppeerrffoorrmmaannccee mmaayy oorr mmaayy nnoott bbee ssuussttaaiinneedd iinn tthhee ffuuttuurreePerformance of the Dividend Plan for the investor would be net of Distribution Tax as applicable* Absolute Returns ** Compounded Annualised Returns #SENSEX
Oct 29, 08 Last Six months (182 days) 60.417 13.04* 26.08*Apr 29, 08 Last 1 Year (365 days) 103.171 -33.80* -34.38*Apr 28, 06 Last 3 Years (1097 days) 88.008 -8.09** -1.28**Apr 29, 04 Last 5 Years (1826 days) 33.450 15.34** 15.00**Jan 02, 01 Since Inception (3039 days) 10.000 25.96** 13.34**
+ Industry Classification as recommended by AMFITotal outstanding position (as at April 30, 2009) in Derivative Instruments
(Nifty NSE May 2009 Futures) (Gross Notional) Rs. 609.54 lakhs.
PPoorrttffoolliioo TTuurrnnoovveerr RRaattiioo ((LLaasstt 11 YYeeaarr)) 3322..7788%%
CCoommppaannyy IInndduussttrryy++ %% ttoo NNAAVV
EEQQUUIITTYY && EEQQUUIITTYY RREELLAATTEEDD
Reliance Industries Ltd. Petroleum Products 6.30
ICICI Bank Ltd. Banks 5.38
State Bank of India Banks 4.42
Infosys Technologies Ltd. Software 3.91
Hero Honda Motors Ltd. Auto 3.37
GlaxoSmithkline Consumer Healthcare Ltd. Consumer Non Durables 3.21
Crompton Greaves Ltd. Industrial Capital Goods 2.77
Axis Bank Ltd. Banks 2.70
Nestle India Ltd. Consumer Non Durables 2.65
Bharti Airtel Ltd. Telecom - Services 2.60
TToottaall ooff TToopp TTeenn EEqquuiittyy HHoollddiinnggss 3377..3311
TToottaall EEqquuiittyy && EEqquuiittyy RReellaatteedd HHoollddiinnggss 9900..9977
Cash, Cash Equivalents and Net Current Assets 9.03
GGrraanndd TToottaall 110000..0000
NNeett AAsssseettss ((RRss.. IInn LLaakkhhss)) 5577,,889900..4433
DDaattee PPeerriioodd NNAAVV RReettuurrnnss BBeenncchhmmaarrkkppeerr UUnniitt ((RRss..)) ((%%))$$$$^̂ RReettuurrnnss ((%%))##
Relative Performance ^ (Growth Plan)
^̂PPaasstt ppeerrffoorrmmaannccee mmaayy oorr mmaayy nnoott bbee ssuussttaaiinneedd iinn tthhee ffuuttuurreePerformance of the Dividend Plan for the investor would be net of Distribution Tax as applicable* Absolute Returns #S&P CNX 500 (Please refer to page no 30)** Compounded Annualised Returns $$ Adjusted for the dividends declared under the scheme prior to its splittng into the Dividendand Growth Plans
Oct 29, 08 Last Six months (182 days) 94.943 18.02* 26.90*Apr 29, 08 Last 1 Year (365 days) 158.919 -29.49* -37.09*Apr 28, 06 Last 3 Years (1097 days) 141.683 -7.51** -4.04**Apr 29, 04 Last 5 Years (1826 days) 43.062 21.06** 11.89**Apr 29, 99 Last 10 Years (3653 days) 17.220 30.21** 14.82**Mar 31, 96 Since Inception (4777 days) 10.000 29.09** 10.75**
NAV (as at April 29, 2009) NAV per Unit (Rs.)
Growth Plan 112.050Dividend Plan 34.854
Portfolio – Top 10 Holdings (as at April 30, 2009)
PPoorrttffoolliioo TTuurrnnoovveerr RRaattiioo ((LLaasstt 11 YYeeaarr)) 5566..9955%%+ Industry Classification as recommended by AMFI✤ PPaasstt ppeerrffoorrmmaannccee iiss nnoo gguuaarraanntteeee ooff ffuuttuurree rreessuullttss..
� Please refer to page no 30 for details on the Rating Methodology
* Previously HDFC Tax Plan 2000
Consumer Non Durables 13.13
Banks 12.50
Industrial Capital Goods 8.89
Petroleum Products 7.94
Software 6.28
Pharmaceuticals 6.22
Auto Ancillaries 5.70
Construction Project 5.36
Pesticides 4.49
Industrial Products 3.82
Auto 3.37
Telecom - Services 2.60
Consumer Durables 2.44
Finance 2.39
Transportation 2.04
Media & Entertainment 1.77
Gas 0.90
Textile Products 0.79
Chemicals 0.34
Industry Allocation of Equity Holding (% of Net Assets)
Banks 18.86
Pharmaceuticals 10.23
Consumer Non Durables 9.32
Software 9.19
Petroleum Products 7.31
Industrial Capital Goods 4.96
Auto Ancillaries 4.71
Media & Entertainment 4.46
Auto 4.37
Finance 3.69
Telecom - Services 3.02
Pesticides 2.64
Transportation 2.49
Industrial Products 1.85
Construction Project 1.71
Chemicals 0.75
Power 0.50
Paper Products 0.50
Construction 0.49
Trading 0.11
Industry Allocation of Equity Holding (% of Net Assets)
CCoommppaannyy IInndduussttrryy++ %% ttoo NNAAVV
EEQQUUIITTYY && EEQQUUIITTYY RREELLAATTEEDD
ICICI Bank Ltd. Banks 5.56
State Bank of India Banks 5.10
Dr Reddy’s Laboratories Ltd. Pharmaceuticals 3.83
Crompton Greaves Ltd. Industrial Capital Goods 3.23
Infosys Technologies Ltd. Software 3.15
Hero Honda Motors Ltd. Auto 3.11
Bharat Petroleum Corporation Ltd. Petroleum Products 3.07
Bharti Airtel Ltd. Telecom - Services 3.02
Reliance Industries Ltd. Petroleum Products 3.02
Tata Consultancy Services Ltd. Software 2.81
TToottaall ooff TToopp TTeenn EEqquuiittyy HHoollddiinnggss 3355..9900
TToottaall EEqquuiittyy && EEqquuiittyy RReellaatteedd HHoollddiinnggss 9911..1166
Cash, Cash Equivalents and Net Current Assets 8.84
GGrraanndd TToottaall 110000..0000
NNeett AAsssseettss ((RRss.. IInn LLaakkhhss)) 111199,,778866..1188
IN EQUITY - TAX PLANNING CATEGORY(23 schemes) for 3 and 5 year periods ending April 30, 2009
Std Deviation Beta Sharpe Ratio*
Risk Ratio (for the 3-yr period ended April 29, 2009) 8.50% 0.8990 -0.02
Std Deviation Beta Sharpe Ratio*
Risk Ratio (for the 3-yr period ended April 29, 2009) 9.30% 0.9230 0.01
Source : CRISIL Fund Analyser* Risk-free rate assumed to be 3.60% (364-day Treasury Bill yield on 29-04-09)
Source : CRISIL Fund Analyser # Less than 0.01* Risk-free rate assumed to be 3.60% (364-day Treasury Bill yield on 29-04-09)
April 2009 17Intouchmutually
hdfc-eq-r.qxd 5/7/2009 8:20 PM Page 8

Benefits of Systematic Investment Plan (SIP)
# SENSEXPPaasstt ppeerrffoorrmmaannccee mmaayy oorr mmaayy nnoott bbee ssuussttaaiinneedd iinn tthhee ffuuttuurree..
SSIIPP IInnvveessttmmeennttss SSiinnccee IInncceeppttiioonn 55 YYeeaarr SSIIPP 33 YYeeaarr SSIIPP 11 YYeeaarr SSIIPP
Total Amount Invested (Rs. ‘000) 104.00 60.00 36.00 12.00Mkt Value as on April 29, 2009 (Rs. ‘000) 289.38 78.39 33.13 11.95RReettuurrnnss ((AAnnnnuuaalliisseedd))** ((%%)) 2222..7744 1100..6633 --55..3311 --00..8800
Benchmark Returns (Annualised) (%) # 1155..6677 88..1188 --66..7700 1100..7744
HDFC GROWTH FUND
# BSE 200 PPaasstt ppeerrffoorrmmaannccee mmaayy oorr mmaayy nnoott bbee ssuussttaaiinneedd iinn tthhee ffuuttuurree..
SSIIPP IInnvveessttmmeennttss SSiinnccee IInncceeppttiioonn 33 YYeeaarr SSIIPP 11 YYeeaarr SSIIPP
Total Amount Invested (Rs. ‘000) 56.00 36.00 12.00
Market Value as on April 29, 2009 (Rs. ‘000) 55.28 29.38 12.38
RReettuurrnnss ((AAnnnnuuaalliisseedd))** ((%%)) --00..5544 --1122..7766 55..9900
Benchmark Returns (Annualised) (%) # 22..0011 --88..5599 66..8800
HDFC CORE & SATELLITE FUND
# S&P CNX 500 (Please refer to page no 30)PPaasstt ppeerrffoorrmmaannccee mmaayy oorr mmaayy nnoott bbee ssuussttaaiinneedd iinn tthhee ffuuttuurree..
SSIIPP IInnvveessttmmeennttss SSiinnccee 1100 yyeeaarr 55 YYeeaarr 33 YYeeaarr 11 YYeeaarrIInncceeppttiioonn SSIIPP SSIIPP SSIIPP SSIIPP
Total Amount Invested (Rs. ‘000) 172.00 120.00 60.00 36.00 12.00Mkt Value as on April 29, 2009 (Rs. ‘000) 1,338.47 447.49 78.59 33.09 12.87RReettuurrnnss ((AAnnnnuuaalliisseedd))** ((%%)) 2255..5588 2244..8844 1100..7733 --55..4411 1133..6677
Benchmark Returns (Annualised) (%) # 1122..4488 1144..3322 44..7788 --88..7799 88..0044
HDFC EQUITY FUND
# BSE 200PPaasstt ppeerrffoorrmmaannccee mmaayy oorr mmaayy nnoott bbee ssuussttaaiinneedd iinn tthhee ffuuttuurree..
SSIIPP IInnvveessttmmeennttss SSiinnccee 1100 yyeeaarr 55 YYeeaarr 33 YYeeaarr 11 YYeeaarrIInncceeppttiioonn SSIIPP SSIIPP SSIIPP SSIIPP
Total Amount Invested (Rs. ‘000) 151.00 120.00 60.00 36.00 12.00Mkt Value as on April 29, 2009 (Rs. ‘000) 789.82 463.75 85.88 35.91 13.14RReettuurrnnss ((AAnnnnuuaalliisseedd))** ((%%)) 2244..0066 2255..5500 1144..3322 --00..1177 1188..1122
Benchmark Returns (Annualised) (%) # 1133..5533 1144..5511 55..3322 --88..5599 66..8800
HDFC TOP 200 FUND
# S&P CNX 500 (Please refer to page no 30)PPaasstt ppeerrffoorrmmaannccee mmaayy oorr mmaayy nnoott bbee ssuussttaaiinneedd iinn tthhee ffuuttuurree..
SSIIPP IInnvveessttmmeennttss SSiinnccee 1100 yyeeaarr 55 YYeeaarr 33 YYeeaarr 11 YYeeaarrIInncceeppttiioonn SSIIPP SSIIPP SSIIPP SSIIPP
Total Amount Invested (Rs. ‘000) 183.00 120.00 60.00 36.00 12.00Mkt Value as on April 29, 2009 (Rs. ‘000) 745.77 336.20 68.80 31.12 12.23RReettuurrnnss ((AAnnnnuuaalliisseedd))** ((%%)) 1166..7700 1199..5555 55..4411 --99..2244 33..5566
Benchmark Returns (Annualised) (%) # 1111..6688 1144..3322 44..7788 --88..7799 88..0044
HDFC CAPITAL BUILDER FUND
# S&P CNX 500 (Please refer to page no 30)PPaasstt ppeerrffoorrmmaannccee mmaayy oorr mmaayy nnoott bbee ssuussttaaiinneedd iinn tthhee ffuuttuurree..
SSIIPP IInnvveessttmmeennttss SSiinnccee IInncceeppttiioonn 33 YYeeaarr SSIIPP 11 YYeeaarr SSIIPP
Total Amount Invested (Rs. ‘000) 49.00 36.00 12.00
Market Value as on April 29, 2009 (Rs. ‘000) 43.39 29.76 12.16
RReettuurrnnss ((AAnnnnuuaalliisseedd))** ((%%)) --55..8800 --1111..9977 22..5511
Benchmark Returns (Annualised) (%) # --22..5577 --88..7799 88..0044
HDFC PREMIER MULTI-CAP FUND
# CRISIL MIP BLENDED INDEXPPaasstt ppeerrffoorrmmaannccee mmaayy oorr mmaayy nnoott bbee ssuussttaaiinneedd iinn tthhee ffuuttuurree..
SSIIPP IInnvveessttmmeennttss SSiinnccee IInncceeppttiioonn 55 YYeeaarr SSIIPP 33 YYeeaarr SSIIPP 11 YYeeaarr SSIIPP
Total Amount Invested (Rs. ‘000) 65.00 60.00 36.00 12.00Mkt Value as on April 29, 2009 (Rs. ‘000) 75.91 70.33 39.77 13.67RReettuurrnnss ((AAnnnnuuaalliisseedd))** ((%%)) 55..6688 66..2299 66..5577 2266..8855
Benchmark Returns (Annualised) (%) # 77..4488 88..3355 99..1177 3300..3344
HDFC MF MIP - SHORT TERM PLAN
# CRISIL MIP BLENDED INDEXPPaasstt ppeerrffoorrmmaannccee mmaayy oorr mmaayy nnoott bbee ssuussttaaiinneedd iinn tthhee ffuuttuurree..
SSIIPP IInnvveessttmmeennttss SSiinnccee IInncceeppttiioonn 55 YYeeaarr SSIIPP 33 YYeeaarr SSIIPP 11 YYeeaarr SSIIPP
Total Amount Invested (Rs. ‘000) 65.00 60.00 36.00 12.00Mkt Value as on April 29, 2009 (Rs. ‘000) 84.77 78.02 41.82 14.25RReettuurrnnss ((AAnnnnuuaalliisseedd))** ((%%)) 99..7755 1100..4444 99..9988 3366..6600
Benchmark Returns (Annualised) (%) # 7.48 8.35 9.17 30.34
HDFC MF MIP - LONG TERM PLAN
# CRISIL Balanced Fund Index N.A. Not AvailablePPaasstt ppeerrffoorrmmaannccee mmaayy oorr mmaayy nnoott bbee ssuussttaaiinneedd iinn tthhee ffuuttuurree..
SSIIPP IInnvveessttmmeennttss SSiinnccee IInncceeppttiioonn 55 YYeeaarr SSIIPP 33 YYeeaarr SSIIPP 11 YYeeaarr SSIIPP
Total Amount Invested (Rs. ‘000) 104.00 60.00 36.00 12.00Mkt Value as on April 29, 2009 (Rs. ‘000) 190.40 70.94 35.42 13.13RReettuurrnnss ((AAnnnnuuaalliisseedd))** ((%%)) 1133..5544 66..6633 --11..0066 1177..9977
Benchmark Returns (Annualised) (%) # NN..AA.. 88..4422 11..7722 2200..5544
HDFC BALANCED FUND
# CRISIL Balanced Fund Index N.A. Not AvailablePPaasstt ppeerrffoorrmmaannccee mmaayy oorr mmaayy nnoott bbee ssuussttaaiinneedd iinn tthhee ffuuttuurree..
SSIIPP IInnvveessttmmeennttss SSiinnccee 1100 yyeeaarr 55 YYeeaarr 33 YYeeaarr 11 YYeeaarrIInncceeppttiioonn SSIIPP SSIIPP SSIIPP SSIIPP
Total Amount Invested (Rs. ‘000) 183.00 120.00 60.00 36.00 12.00Mkt Value as on April 29, 2009 (Rs. ‘000) 1,118.24 374.70 77.51 34.96 13.09RReettuurrnnss ((AAnnnnuuaalliisseedd))** ((%%)) 2211..2211 2211..5566 1100..1188 --11..9900 1177..2222
Benchmark Returns (Annualised) (%) # NN..AA.. NN..AA.. 88..4422 11..7722 2200..5544
HDFC PRUDENCE FUND
# CRISIL Balanced Fund Index N.A. Not AvailablePPaasstt ppeerrffoorrmmaannccee mmaayy oorr mmaayy nnoott bbee ssuussttaaiinneedd iinn tthhee ffuuttuurree..
SSIIPP IInnvveessttmmeennttss SSiinnccee IInncceeppttiioonn 55 YYeeaarr SSIIPP 33 YYeeaarr SSIIPP 11 YYeeaarr SSIIPP
Total Amount Invested (Rs. ‘000) 98.00 60.00 36.00 12.00Mkt Value as on April 29, 2009 (Rs. ‘000) 152.85 64.69 33.29 12.80RReettuurrnnss ((AAnnnnuuaalliisseedd))** ((%%)) 1100..6633 22..9977 --55..0022 1122..6655
Benchmark Returns (Annualised) (%) # NN..AA.. 88..4422 11..7722 2200..5544
HDFC CHILDREN’S GIFT FUND - INVESTMENT PLAN
# CRISIL MIP Blended Index N.A. Not AvailablePPaasstt ppeerrffoorrmmaannccee mmaayy oorr mmaayy nnoott bbee ssuussttaaiinneedd iinn tthhee ffuuttuurree..
SSIIPP IInnvveessttmmeennttss SSiinnccee IInncceeppttiioonn 55 YYeeaarr SSIIPP 33 YYeeaarr SSIIPP 11 YYeeaarr SSIIPP
Total Amount Invested (Rs. ‘000) 98.00 60.00 36.00 12.00Mkt Value as on April 29, 2009 (Rs. ‘000) 139.29 71.66 40.46 13.64RReettuurrnnss ((AAnnnnuuaalliisseedd))** ((%%)) 88..4433 77..0033 77..7722 2266..2288
Benchmark Returns (Annualised) (%) # NN..AA.. 88..3355 99..1177 3300..3344
HDFC CHILDREN’S GIFT FUND - SAVINGS PLAN
# SENSEXPPaasstt ppeerrffoorrmmaannccee mmaayy oorr mmaayy nnoott bbee ssuussttaaiinneedd iinn tthhee ffuuttuurree..
SSIIPP IInnvveessttmmeennttss SSiinnccee IInncceeppttiioonn 55 YYeeaarr SSIIPP 33 YYeeaarr SSIIPP 11 YYeeaarr SSIIPP
Total Amount Invested (Rs. ‘000) 100.00 60.00 36.00 12.00Mkt Value as on April 29, 2009 (Rs. ‘000) 274.15 64.74 29.63 12.14RReettuurrnnss ((AAnnnnuuaalliisseedd))** ((%%)) 2233..4400 33..0000 --1122..2255 22..1111
Benchmark Returns (Annualised) (%) # 1166..0000 88..1188 --66..7700 1100..7744
HDFC LONG TERM ADVANTAGE FUND
# S&P CNX 500 (Please refer to page no 30)PPaasstt ppeerrffoorrmmaannccee mmaayy oorr mmaayy nnoott bbee ssuussttaaiinneedd iinn tthhee ffuuttuurree..
SSIIPP IInnvveessttmmeennttss SSiinnccee 1100 yyeeaarr 55 YYeeaarr 33 YYeeaarr 11 YYeeaarrIInncceeppttiioonn SSIIPP SSIIPP SSIIPP SSIIPP
Total Amount Invested (Rs. ‘000) 157.00 120.00 60.00 36.00 12.00Mkt Value as on April 29, 2009 (Rs. ‘000) 1,374.60 453.35 73.85 30.91 12.66RReettuurrnnss ((AAnnnnuuaalliisseedd))** ((%%)) 2299..9911 2255..0088 88..2244 --99..6655 1100..3311
Benchmark Returns (Annualised) (%) # 1133..2266 1144..3322 44..7788 --88..7799 88..0044
HDFC TAXSAVER
* Load is not taken into consideration and the Returns are of Growth Plan / Option. Investors areadvised to refer to the Relative Performance table furnished in this booklet for non-SIP returns. PPaasstt ppeerrffoorrmmaannccee mmaayy oorr mmaayy nnoott bbee ssuussttaaiinneedd iinn tthhee ffuuttuurree..DDiissccllaaiimmeerr:: The above investment simulation is for illustrative purposes only and should not beconstrued as a promise on minimum returns and safeguard of capital. The AMC / Mutual Fund isnot guaranteeing or promising or forecasting any returns. SIP does not assure a profit or guaranteeprotection against a loss in a declining market.PPlleeaassee rreeffeerr SSIIPP EEnnrroollmmeenntt FFoorrmm oorr ccoonnttaacctt nneeaarreesstt IISSCC ffoorr SSIIPP LLooaadd SSttrruuccttuurree..
The Terms & Conditions of the SIP facility have been revamped effective September 1,2004 and January 3, 2005 and it is now more flexible and convenient for investors.To illustrate the advantages of SIP investments, this is how your investments wouldhave grown if you had invested say Rs. 1,000 systematically on the first BusinessDay of every month over a period of time.
18 April 2009 Intouchmutually
hdfc-sip.qxd 5/7/2009 8:17 PM Page 1
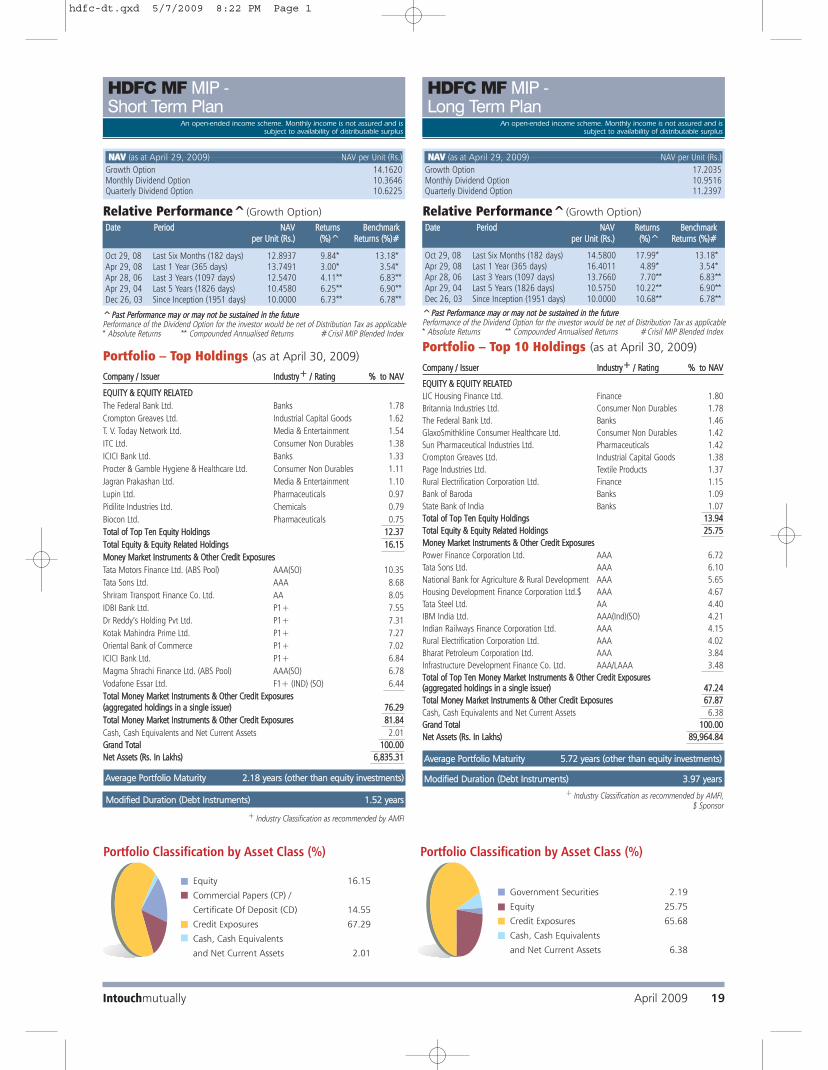
CCoommppaannyy // IIssssuueerr IInndduussttrryy++ // RRaattiinngg %% ttoo NNAAVV
EEQQUUIITTYY && EEQQUUIITTYY RREELLAATTEEDD
The Federal Bank Ltd. Banks 1.78
Crompton Greaves Ltd. Industrial Capital Goods 1.62
T. V. Today Network Ltd. Media & Entertainment 1.54
ITC Ltd. Consumer Non Durables 1.38
ICICI Bank Ltd. Banks 1.33
Procter & Gamble Hygiene & Healthcare Ltd. Consumer Non Durables 1.11
Jagran Prakashan Ltd. Media & Entertainment 1.10
Lupin Ltd. Pharmaceuticals 0.97
Pidilite Industries Ltd. Chemicals 0.79
Biocon Ltd. Pharmaceuticals 0.75
TToottaall ooff TToopp TTeenn EEqquuiittyy HHoollddiinnggss 1122..3377
TToottaall EEqquuiittyy && EEqquuiittyy RReellaatteedd HHoollddiinnggss 1166..1155
MMoonneeyy MMaarrkkeett IInnssttrruummeennttss && OOtthheerr CCrreeddiitt EExxppoossuurreess
Tata Motors Finance Ltd. (ABS Pool) AAA(SO) 10.35
Tata Sons Ltd. AAA 8.68
Shriram Transport Finance Co. Ltd. AA 8.05
IDBI Bank Ltd. P1+ 7.55
Dr Reddy’s Holding Pvt Ltd. P1+ 7.31
Kotak Mahindra Prime Ltd. P1+ 7.27
Oriental Bank of Commerce P1+ 7.02
ICICI Bank Ltd. P1+ 6.84
Magma Shrachi Finance Ltd. (ABS Pool) AAA(SO) 6.78
Vodafone Essar Ltd. F1+ (IND) (SO) 6.44
TToottaall MMoonneeyy MMaarrkkeett IInnssttrruummeennttss && OOtthheerr CCrreeddiitt EExxppoossuurreess((aaggggrreeggaatteedd hhoollddiinnggss iinn aa ssiinnggllee iissssuueerr)) 7766..2299
TToottaall MMoonneeyy MMaarrkkeett IInnssttrruummeennttss && OOtthheerr CCrreeddiitt EExxppoossuurreess 8811..8844
Cash, Cash Equivalents and Net Current Assets 2.01
GGrraanndd TToottaall 110000..0000
NNeett AAsssseettss ((RRss.. IInn LLaakkhhss)) 66,,883355..3311
Portfolio – Top Holdings (as at April 30, 2009)CCoommppaannyy // IIssssuueerr IInndduussttrryy++ // RRaattiinngg %% ttoo NNAAVV
EEQQUUIITTYY && EEQQUUIITTYY RREELLAATTEEDD
LIC Housing Finance Ltd. Finance 1.80
Britannia Industries Ltd. Consumer Non Durables 1.78
The Federal Bank Ltd. Banks 1.46
GlaxoSmithkline Consumer Healthcare Ltd. Consumer Non Durables 1.42
Sun Pharmaceutical Industries Ltd. Pharmaceuticals 1.42
Crompton Greaves Ltd. Industrial Capital Goods 1.38
Page Industries Ltd. Textile Products 1.37
Rural Electrification Corporation Ltd. Finance 1.15
Bank of Baroda Banks 1.09
State Bank of India Banks 1.07
TToottaall ooff TToopp TTeenn EEqquuiittyy HHoollddiinnggss 1133..9944
TToottaall EEqquuiittyy && EEqquuiittyy RReellaatteedd HHoollddiinnggss 2255..7755
MMoonneeyy MMaarrkkeett IInnssttrruummeennttss && OOtthheerr CCrreeddiitt EExxppoossuurreess
Power Finance Corporation Ltd. AAA 6.72
Tata Sons Ltd. AAA 6.10
National Bank for Agriculture & Rural Development AAA 5.65
Housing Development Finance Corporation Ltd.$ AAA 4.67
Tata Steel Ltd. AA 4.40
IBM India Ltd. AAA(Ind)(SO) 4.21
Indian Railways Finance Corporation Ltd. AAA 4.15
Rural Electrification Corporation Ltd. AAA 4.02
Bharat Petroleum Corporation Ltd. AAA 3.84
Infrastructure Development Finance Co. Ltd. AAA/LAAA 3.48
TToottaall ooff TToopp TTeenn MMoonneeyy MMaarrkkeett IInnssttrruummeennttss && OOtthheerr CCrreeddiitt EExxppoossuurreess((aaggggrreeggaatteedd hhoollddiinnggss iinn aa ssiinnggllee iissssuueerr)) 4477..2244
TToottaall MMoonneeyy MMaarrkkeett IInnssttrruummeennttss && OOtthheerr CCrreeddiitt EExxppoossuurreess 6677..8877
Cash, Cash Equivalents and Net Current Assets 6.38
GGrraanndd TToottaall 110000..0000
NNeett AAsssseettss ((RRss.. IInn LLaakkhhss)) 8899,,996644..8844
Portfolio – Top 10 Holdings (as at April 30, 2009)
+ Industry Classification as recommended by AMFI,$ Sponsor
MMooddiiffiieedd DDuurraattiioonn ((DDeebbtt IInnssttrruummeennttss)) 33..9977 yyeeaarrss
AAvveerraaggee PPoorrttffoolliioo MMaattuurriittyy 55..7722 yyeeaarrss ((ootthheerr tthhaann eeqquuiittyy iinnvveessttmmeennttss))
+ Industry Classification as recommended by AMFI
MMooddiiffiieedd DDuurraattiioonn ((DDeebbtt IInnssttrruummeennttss)) 11..5522 yyeeaarrss
AAvveerraaggee PPoorrttffoolliioo MMaattuurriittyy 22..1188 yyeeaarrss ((ootthheerr tthhaann eeqquuiittyy iinnvveessttmmeennttss))
^̂PPaasstt PPeerrffoorrmmaannccee mmaayy oorr mmaayy nnoott bbee ssuussttaaiinneedd iinn tthhee ffuuttuurreePerformance of the Dividend Option for the investor would be net of Distribution Tax as applicable* Absolute Returns ** Compounded Annualised Returns #Crisil MIP Blended Index
NNAAVV (as at April 29, 2009) NAV per Unit (Rs.)
Growth Option 14.1620Monthly Dividend Option 10.3646Quarterly Dividend Option 10.6225
DDaattee PPeerriioodd NNAAVV RReettuurrnnss BBeenncchhmmaarrkkppeerr UUnniitt ((RRss..)) ((%%))^̂ RReettuurrnnss ((%%))##
Oct 29, 08 Last Six Months (182 days) 12.8937 9.84* 13.18*Apr 29, 08 Last 1 Year (365 days) 13.7491 3.00* 3.54*Apr 28, 06 Last 3 Years (1097 days) 12.5470 4.11** 6.83**Apr 29, 04 Last 5 Years (1826 days) 10.4580 6.25** 6.90**Dec 26, 03 Since Inception (1951 days) 10.0000 6.73** 6.78**
Relative Performance^(Growth Option)
^̂PPaasstt PPeerrffoorrmmaannccee mmaayy oorr mmaayy nnoott bbee ssuussttaaiinneedd iinn tthhee ffuuttuurreePerformance of the Dividend Option for the investor would be net of Distribution Tax as applicable* Absolute Returns ** Compounded Annualised Returns #Crisil MIP Blended Index
DDaattee PPeerriioodd NNAAVV RReettuurrnnss BBeenncchhmmaarrkkppeerr UUnniitt ((RRss..)) ((%%))^̂ RReettuurrnnss ((%%))##
Oct 29, 08 Last Six Months (182 days) 14.5800 17.99* 13.18*Apr 29, 08 Last 1 Year (365 days) 16.4011 4.89* 3.54*Apr 28, 06 Last 3 Years (1097 days) 13.7660 7.70** 6.83**Apr 29, 04 Last 5 Years (1826 days) 10.5750 10.22** 6.90**Dec 26, 03 Since Inception (1951 days) 10.0000 10.68** 6.78**
Relative Performance^(Growth Option)
NNAAVV (as at April 29, 2009) NAV per Unit (Rs.)
Growth Option 17.2035Monthly Dividend Option 10.9516Quarterly Dividend Option 11.2397
HDFC MF MIP - Short Term Plan
An open-ended income scheme. Monthly income is not assured and is subject to availability of distributable surplus
HDFC MF MIP - Long Term Plan
An open-ended income scheme. Monthly income is not assured and is subject to availability of distributable surplus
April 2009 19Intouchmutually
hdfc-dt.qxd 5/7/2009 8:22 PM Page 1
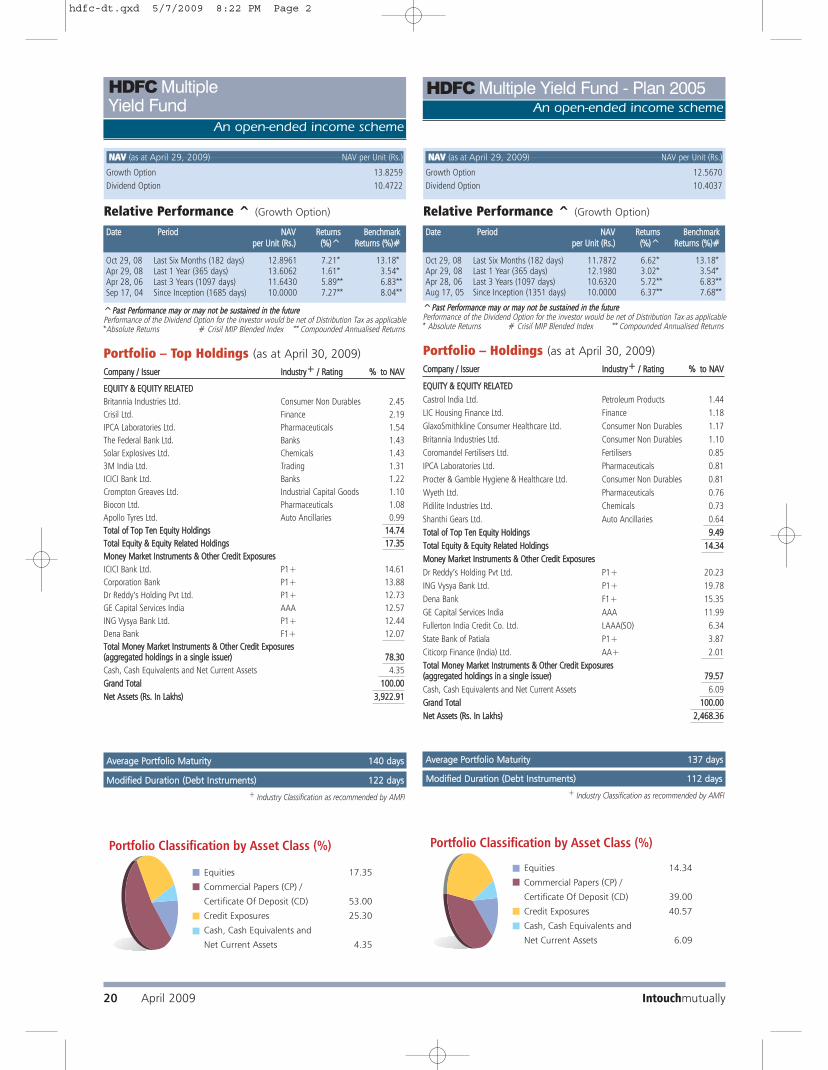
NNAAVV (as at April 29, 2009) NAV per Unit (Rs.)
Growth Option 13.8259
Dividend Option 10.4722
HDFC Multiple Yield Fund
An open-ended income scheme
^̂PPaasstt PPeerrffoorrmmaannccee mmaayy oorr mmaayy nnoott bbee ssuussttaaiinneedd iinn tthhee ffuuttuurreePerformance of the Dividend Option for the investor would be net of Distribution Tax as applicable*Absolute Returns # Crisil MIP Blended Index ** Compounded Annualised Returns
+ Industry Classification as recommended by AMFI+ Industry Classification as recommended by AMFI
DDaattee PPeerriioodd NNAAVV RReettuurrnnss BBeenncchhmmaarrkkppeerr UUnniitt ((RRss..)) ((%%))^̂ RReettuurrnnss ((%%))##
Relative Performance ^ (Growth Option)
Oct 29, 08 Last Six Months (182 days) 12.8961 7.21* 13.18*Apr 29, 08 Last 1 Year (365 days) 13.6062 1.61* 3.54*Apr 28, 06 Last 3 Years (1097 days) 11.6430 5.89** 6.83**Sep 17, 04 Since Inception (1685 days) 10.0000 7.27** 8.04**
NNAAVV (as at April 29, 2009) NAV per Unit (Rs.)
Growth Option 12.5670
Dividend Option 10.4037
HDFC Multiple Yield Fund - Plan 2005An open-ended income scheme
DDaattee PPeerriioodd NNAAVV RReettuurrnnss BBeenncchhmmaarrkkppeerr UUnniitt ((RRss..)) ((%%))^̂ RReettuurrnnss ((%%))##
Relative Performance ^ (Growth Option)
MMooddiiffiieedd DDuurraattiioonn ((DDeebbtt IInnssttrruummeennttss)) 112222 ddaayyss
AAvveerraaggee PPoorrttffoolliioo MMaattuurriittyy 114400 ddaayyss AAvveerraaggee PPoorrttffoolliioo MMaattuurriittyy 113377 ddaayyss
CCoommppaannyy // IIssssuueerr IInndduussttrryy++ // RRaattiinngg %% ttoo NNAAVV
EEQQUUIITTYY && EEQQUUIITTYY RREELLAATTEEDD
Castrol India Ltd. Petroleum Products 1.44
LIC Housing Finance Ltd. Finance 1.18
GlaxoSmithkline Consumer Healthcare Ltd. Consumer Non Durables 1.17
Britannia Industries Ltd. Consumer Non Durables 1.10
Coromandel Fertilisers Ltd. Fertilisers 0.85
IPCA Laboratories Ltd. Pharmaceuticals 0.81
Procter & Gamble Hygiene & Healthcare Ltd. Consumer Non Durables 0.81
Wyeth Ltd. Pharmaceuticals 0.76
Pidilite Industries Ltd. Chemicals 0.73
Shanthi Gears Ltd. Auto Ancillaries 0.64
TToottaall ooff TToopp TTeenn EEqquuiittyy HHoollddiinnggss 99..4499
TToottaall EEqquuiittyy && EEqquuiittyy RReellaatteedd HHoollddiinnggss 1144..3344
MMoonneeyy MMaarrkkeett IInnssttrruummeennttss && OOtthheerr CCrreeddiitt EExxppoossuurreess
Dr Reddy’s Holding Pvt Ltd. P1+ 20.23
ING Vysya Bank Ltd. P1+ 19.78
Dena Bank F1+ 15.35
GE Capital Services India AAA 11.99
Fullerton India Credit Co. Ltd. LAAA(SO) 6.34
State Bank of Patiala P1+ 3.87
Citicorp Finance (India) Ltd. AA+ 2.01
TToottaall MMoonneeyy MMaarrkkeett IInnssttrruummeennttss && OOtthheerr CCrreeddiitt EExxppoossuurreess((aaggggrreeggaatteedd hhoollddiinnggss iinn aa ssiinnggllee iissssuueerr)) 7799..5577
Cash, Cash Equivalents and Net Current Assets 6.09
GGrraanndd TToottaall 110000..0000
NNeett AAsssseettss ((RRss.. IInn LLaakkhhss)) 22,,446688..3366
Portfolio – Holdings (as at April 30, 2009)
MMooddiiffiieedd DDuurraattiioonn ((DDeebbtt IInnssttrruummeennttss)) 111122 ddaayyss
Oct 29, 08 Last Six Months (182 days) 11.7872 6.62* 13.18*Apr 29, 08 Last 1 Year (365 days) 12.1980 3.02* 3.54*Apr 28, 06 Last 3 Years (1097 days) 10.6320 5.72** 6.83**Aug 17, 05 Since Inception (1351 days) 10.0000 6.37** 7.68**
^̂PPaasstt PPeerrffoorrmmaannccee mmaayy oorr mmaayy nnoott bbee ssuussttaaiinneedd iinn tthhee ffuuttuurreePerformance of the Dividend Option for the investor would be net of Distribution Tax as applicable* Absolute Returns # Crisil MIP Blended Index ** Compounded Annualised Returns
CCoommppaannyy // IIssssuueerr IInndduussttrryy++ // RRaattiinngg %% ttoo NNAAVV
EEQQUUIITTYY && EEQQUUIITTYY RREELLAATTEEDD
Britannia Industries Ltd. Consumer Non Durables 2.45
Crisil Ltd. Finance 2.19
IPCA Laboratories Ltd. Pharmaceuticals 1.54
The Federal Bank Ltd. Banks 1.43
Solar Explosives Ltd. Chemicals 1.43
3M India Ltd. Trading 1.31
ICICI Bank Ltd. Banks 1.22
Crompton Greaves Ltd. Industrial Capital Goods 1.10
Biocon Ltd. Pharmaceuticals 1.08
Apollo Tyres Ltd. Auto Ancillaries 0.99
TToottaall ooff TToopp TTeenn EEqquuiittyy HHoollddiinnggss 1144..7744
TToottaall EEqquuiittyy && EEqquuiittyy RReellaatteedd HHoollddiinnggss 1177..3355
MMoonneeyy MMaarrkkeett IInnssttrruummeennttss && OOtthheerr CCrreeddiitt EExxppoossuurreess
ICICI Bank Ltd. P1+ 14.61
Corporation Bank P1+ 13.88
Dr Reddy’s Holding Pvt Ltd. P1+ 12.73
GE Capital Services India AAA 12.57
ING Vysya Bank Ltd. P1+ 12.44
Dena Bank F1+ 12.07
TToottaall MMoonneeyy MMaarrkkeett IInnssttrruummeennttss && OOtthheerr CCrreeddiitt EExxppoossuurreess((aaggggrreeggaatteedd hhoollddiinnggss iinn aa ssiinnggllee iissssuueerr)) 7788..3300
Cash, Cash Equivalents and Net Current Assets 4.35
GGrraanndd TToottaall 110000..0000
NNeett AAsssseettss ((RRss.. IInn LLaakkhhss)) 33,,992222..9911
Portfolio – Top Holdings (as at April 30, 2009)
Intouchmutually20 April 2009
hdfc-dt.qxd 5/7/2009 8:22 PM Page 2

NNAAVV (as at April 29, 2009) NAV per Unit (Rs.)
Growth Option 21.0165
Dividend Option 11.1785
NNAAVV (as at April 29, 2009) NAV per Unit (Rs.)
Growth Plan 30.5698
Quarterly Dividend Option 11.3939
Half-Yearly Dividend Option 11.1025
Yearly Dividend Option 11.6399
HDFC Income FundAn open-ended income scheme
^̂PPaasstt PPeerrffoorrmmaannccee mmaayy oorr mmaayy nnoott bbee ssuussttaaiinneedd iinn tthhee ffuuttuurreePerformance of the Dividend Option for the investor would be net of Distribution Tax as applicable* Absolute Returns ** Compounded Annualised Returns# Crisil Composite Bond Fund Index N.A. Not Available
$ Sponsor
DDaattee PPeerriioodd NNAAVV RReettuurrnnss BBeenncchhmmaarrkkppeerr UUnniitt ((RRss..)) ((%%))^̂ RReettuurrnnss ((%%))##
Oct 29, 08 Last Six Months (182 days) 17.9602 17.02* 9.80*Apr 29, 08 Last 1 Year (365 days) 18.0756 16.27* 10.23*Apr 28, 06 Last 3 Years (1097 days) 16.2487 8.94** 7.15**Apr 29, 04 Last 5 Years (1826 days) 15.8332 5.82** 5.04**Sep 11, 00 Since Inception (3152 days) 10.0000 8.98** N.A.
Relative Performance^(Growth Option)
MMooddiiffiieedd DDuurraattiioonn 66..0066 yyeeaarrss
AAvveerraaggee PPoorrttffoolliioo MMaattuurriittyy 99..3399 yyeeaarrssAAvveerraaggee PPoorrttffoolliioo MMaattuurriittyy 99..6633 yyeeaarrss
HDFC High Interest FundAn open-ended income scheme
^̂PPaasstt PPeerrffoorrmmaannccee mmaayy oorr mmaayy nnoott bbee ssuussttaaiinneedd iinn tthhee ffuuttuurreePerformance of the Dividend Option for the investor would be net of Distribution Tax as applicable* Absolute Returns ** Compounded Annualised Returns #CRISIL Composite Bond Fund Index N.A. Not Available
DDaattee PPeerriioodd NNAAVV RReettuurrnnss BBeenncchhmmaarrkkppeerr UUnniitt ((RRss..)) ((%%))^̂ RReettuurrnnss ((%%))##
Oct 29, 08 Last Six Months (182 days) 26.8162 14.00* 9.80*Apr 29, 08 Last 1 Year (365 days) 26.5830 15.00* 10.23*Apr 28, 06 Last 3 Years (1097 days) 23.8708 8.58** 7.15**Apr 29, 04 Last 5 Years (1826 days) 23.2678 5.61** 5.04**Apr 29, 99 Last 10 Years (3653 days) 12.8216 9.07** N.A.Apr 28, 97 Since Inception (4384 days) 10.0000 9.75** N.A.
Relative Performance ^ (Growth Plan)
MMooddiiffiieedd DDuurraattiioonn 55..7799 yyeeaarrss
IIssssuueerr RRaattiinngg %% ttoo NNAAVV
MMOONNEEYY MMAARRKKEETT IINNSSTTRRUUMMEENNTT && OOTTHHEERR CCRREEDDIITT EEXXPPOOSSUURREESS // GGOOVVEERRNNMMEENNTT SSEECCUURRIITTIIEESS
Government Securities SOV 24.12
State Bank of India AAA 11.94
Indian Railways Finance Corporation Ltd. AAA 9.95
Power Finance Corporation Ltd. AAA 9.40
Indian Oil Corporation Ltd. LAA+ 6.44
HDFC Bank Ltd. AAA 6.10
Rural Electrification Corporation Ltd. AAA 5.82
National Bank for Agriculture & Rural Development AAA 4.12
Power Grid Corporation of India Ltd. AAA 3.25
National Housing Bank AAA 2.45
TToottaall ooff TToopp TTeenn MMoonneeyy MMaarrkkeett IInnssttrruummeennttss && OOtthheerr CCrreeddiitt EExxppoossuurreess //
GGoovveerrnnmmeenntt SSeeccuurriittiieess
((aaggggrreeggaatteedd hhoollddiinnggss iinn aa ssiinnggllee iissssuueerr)) 8833..5599
TToottaall MMoonneeyy MMaarrkkeett IInnssttrruummeennttss && OOtthheerr CCrreeddiitt EExxppoossuurreess // GGoovveerrnnmmeenntt SSeeccuurriittiieess 9900..3344
Cash, Cash Equivalents and Net Current Assets 9.66 GGrraanndd TToottaall 110000..0000NNeett AAsssseettss ((RRss.. IInn LLaakkhhss)) 114488,,331188..1155
Portfolio – Top 10 Holdings (as at April 30, 2009)
IIssssuueerr RRaattiinngg %% ttoo NNAAVV
MMOONNEEYY MMAARRKKEETT IINNSSTTRRUUMMEENNTT && OOTTHHEERR CCRREEDDIITT EEXXPPOOSSUURREESS // GGOOVVEERRNNMMEENNTT SSEECCUURRIITTIIEESS
Government Securities SOV 28.66 Indian Oil Corporation Ltd. LAA+ 13.40 State Bank of India AAA 8.55 Power Grid Corporation of India Ltd. AAA 8.38 HDFC Bank Ltd. AAA 6.34 National Bank for Agriculture & Rural Development AAA 5.57 Indian Railways Finance Corporation Ltd. AAA 4.17 Housing Development Finance Corporation Ltd.$ AAA 3.63 National Housing Bank AAA 3.51 NTPC Ltd. AAA 3.05 TToottaall ooff TToopp TTeenn MMoonneeyy MMaarrkkeett IInnssttrruummeennttss && OOtthheerr CCrreeddiitt EExxppoossuurreess //GGoovveerrnnmmeenntt SSeeccuurriittiieess((aaggggrreeggaatteedd hhoollddiinnggss iinn aa ssiinnggllee iissssuueerr)) 8855..2266TToottaall MMoonneeyy MMaarrkkeett IInnssttrruummeennttss && OOtthheerr CCrreeddiitt EExxppoossuurreess // GGoovveerrnnmmeenntt SSeeccuurriittiieess 9922..0055
Cash, Cash Equivalents and Net Current Assets 7.95 GGrraanndd TToottaall 110000..0000NNeett AAsssseettss ((RRss.. IInn LLaakkhhss)) 5500,,445500..2299
Portfolio – Holdings (as at April 30, 2009)
Intouchmutually April 2009 21
hdfc-dt.qxd 5/7/2009 8:22 PM Page 3
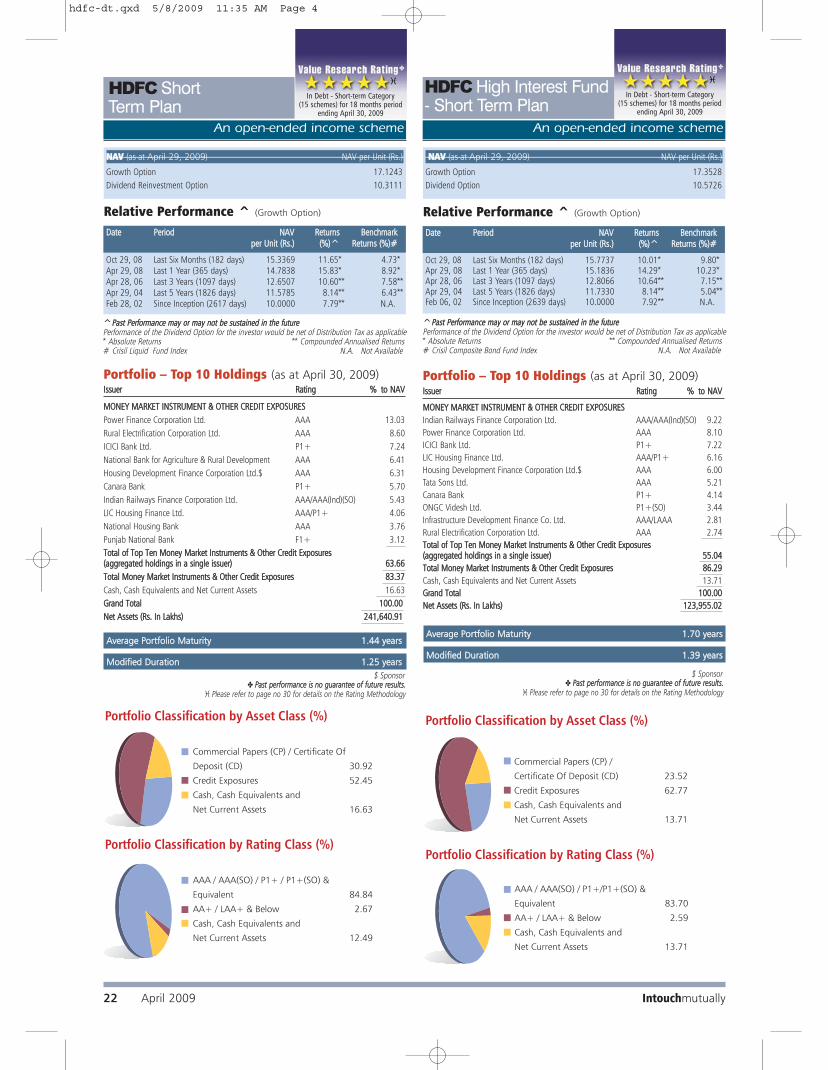
NNAAVV (as at April 29, 2009) NAV per Unit (Rs.)
Growth Option 17.1243
Dividend Reinvestment Option 10.3111
NNAAVV (as at April 29, 2009) NAV per Unit (Rs.)
Growth Option 17.3528
Dividend Option 10.5726
HDFC Short Term Plan
An open-ended income scheme
^̂PPaasstt PPeerrffoorrmmaannccee mmaayy oorr mmaayy nnoott bbee ssuussttaaiinneedd iinn tthhee ffuuttuurreePerformance of the Dividend Option for the investor would be net of Distribution Tax as applicable* Absolute Returns ** Compounded Annualised Returns # Crisil Liquid Fund Index N.A. Not Available
DDaattee PPeerriioodd NNAAVV RReettuurrnnss BBeenncchhmmaarrkkppeerr UUnniitt ((RRss..)) ((%%))^̂ RReettuurrnnss ((%%))##
Oct 29, 08 Last Six Months (182 days) 15.3369 11.65* 4.73*Apr 29, 08 Last 1 Year (365 days) 14.7838 15.83* 8.92*Apr 28, 06 Last 3 Years (1097 days) 12.6507 10.60** 7.58**Apr 29, 04 Last 5 Years (1826 days) 11.5785 8.14** 6.43**Feb 28, 02 Since Inception (2617 days) 10.0000 7.79** N.A.
Relative Performance ^ (Growth Option)
HDFC High Interest Fund - Short Term Plan
An open-ended income scheme
^̂PPaasstt PPeerrffoorrmmaannccee mmaayy oorr mmaayy nnoott bbee ssuussttaaiinneedd iinn tthhee ffuuttuurreePerformance of the Dividend Option for the investor would be net of Distribution Tax as applicable* Absolute Returns ** Compounded Annualised Returns# Crisil Composite Bond Fund Index N.A. Not Available
DDaattee PPeerriioodd NNAAVV RReettuurrnnss BBeenncchhmmaarrkkppeerr UUnniitt ((RRss..)) ((%%))^̂ RReettuurrnnss ((%%))##
Oct 29, 08 Last Six Months (182 days) 15.7737 10.01* 9.80*Apr 29, 08 Last 1 Year (365 days) 15.1836 14.29* 10.23*Apr 28, 06 Last 3 Years (1097 days) 12.8066 10.64** 7.15**Apr 29, 04 Last 5 Years (1826 days) 11.7330 8.14** 5.04**Feb 06, 02 Since Inception (2639 days) 10.0000 7.92** N.A.
Relative Performance ^ (Growth Option)
MMooddiiffiieedd DDuurraattiioonn 11..2255 yyeeaarrss
AAvveerraaggee PPoorrttffoolliioo MMaattuurriittyy 11..4444 yyeeaarrss
MMooddiiffiieedd DDuurraattiioonn 11..3399 yyeeaarrss
AAvveerraaggee PPoorrttffoolliioo MMaattuurriittyy 11..7700 yyeeaarrss
Portfolio – Top 10 Holdings (as at April 30, 2009)
IIssssuueerr RRaattiinngg %% ttoo NNAAVV
MMOONNEEYY MMAARRKKEETT IINNSSTTRRUUMMEENNTT && OOTTHHEERR CCRREEDDIITT EEXXPPOOSSUURREESS
Indian Railways Finance Corporation Ltd. AAA/AAA(Ind)(SO) 9.22
Power Finance Corporation Ltd. AAA 8.10
ICICI Bank Ltd. P1+ 7.22
LIC Housing Finance Ltd. AAA/P1+ 6.16
Housing Development Finance Corporation Ltd.$ AAA 6.00
Tata Sons Ltd. AAA 5.21
Canara Bank P1+ 4.14
ONGC Videsh Ltd. P1+(SO) 3.44
Infrastructure Development Finance Co. Ltd. AAA/LAAA 2.81
Rural Electrification Corporation Ltd. AAA 2.74
TToottaall ooff TToopp TTeenn MMoonneeyy MMaarrkkeett IInnssttrruummeennttss && OOtthheerr CCrreeddiitt EExxppoossuurreess ((aaggggrreeggaatteedd hhoollddiinnggss iinn aa ssiinnggllee iissssuueerr)) 5555..0044
TToottaall MMoonneeyy MMaarrkkeett IInnssttrruummeennttss && OOtthheerr CCrreeddiitt EExxppoossuurreess 8866..2299
Cash, Cash Equivalents and Net Current Assets 13.71
GGrraanndd TToottaall 110000..0000
NNeett AAsssseettss ((RRss.. IInn LLaakkhhss)) 112233,,995555..0022
Portfolio – Top 10 Holdings (as at April 30, 2009)IIssssuueerr RRaattiinngg %% ttoo NNAAVV
MMOONNEEYY MMAARRKKEETT IINNSSTTRRUUMMEENNTT && OOTTHHEERR CCRREEDDIITT EEXXPPOOSSUURREESS
Power Finance Corporation Ltd. AAA 13.03
Rural Electrification Corporation Ltd. AAA 8.60
ICICI Bank Ltd. P1+ 7.24
National Bank for Agriculture & Rural Development AAA 6.41
Housing Development Finance Corporation Ltd.$ AAA 6.31
Canara Bank P1+ 5.70
Indian Railways Finance Corporation Ltd. AAA/AAA(Ind)(SO) 5.43
LIC Housing Finance Ltd. AAA/P1+ 4.06
National Housing Bank AAA 3.76
Punjab National Bank F1+ 3.12
TToottaall ooff TToopp TTeenn MMoonneeyy MMaarrkkeett IInnssttrruummeennttss && OOtthheerr CCrreeddiitt EExxppoossuurreess((aaggggrreeggaatteedd hhoollddiinnggss iinn aa ssiinnggllee iissssuueerr)) 6633..6666
TToottaall MMoonneeyy MMaarrkkeett IInnssttrruummeennttss && OOtthheerr CCrreeddiitt EExxppoossuurreess 8833..3377
Cash, Cash Equivalents and Net Current Assets 16.63
GGrraanndd TToottaall 110000..0000
NNeett AAsssseettss ((RRss.. IInn LLaakkhhss)) 224411,,664400..9911
$ Sponsor✤ PPaasstt ppeerrffoorrmmaannccee iiss nnoo gguuaarraanntteeee ooff ffuuttuurree rreessuullttss..
� Please refer to page no 30 for details on the Rating Methodology
In Debt - Short-term Category(15 schemes) for 18 months period
ending April 30, 2009
In Debt - Short-term Category(15 schemes) for 18 months period
ending April 30, 2009
$ Sponsor✤ PPaasstt ppeerrffoorrmmaannccee iiss nnoo gguuaarraanntteeee ooff ffuuttuurree rreessuullttss..
� Please refer to page no 30 for details on the Rating Methodology
Intouchmutually22 April 2009
hdfc-dt.qxd 5/8/2009 11:35 AM Page 4

An open-ended income scheme
^̂PPaasstt PPeerrffoorrmmaannccee mmaayy oorr mmaayy nnoott bbee ssuussttaaiinneedd iinn tthhee ffuuttuurreePerformance of the Dividend Option for the investor would be net of Distribution Tax as applicable* Absolute Returns ** Compounded Annualised Returns#I-Sec Si-Bex N.A. Not Available
DDaattee PPeerriioodd NNAAVV RReettuurrnnss BBeenncchhmmaarrkkppeerr UUnniitt ((RRss..)) ((%%))^̂ RReettuurrnnss ((%%))##
Oct 29, 08 Last Six Months (182 days) 15.0575 3.72* 8.57*Apr 29, 08 Last 1 Year (365 days) 14.5663 7.22* 14.72*Apr 28, 06 Last 3 Years (1097 days) 13.1474 5.90** 9.60**Apr 29, 04 Last 5 Years (1826 days) 12.2237 5.02** 7.53**Jul 25, 01 Since Inception (2835 days) 10.0000 5.91** N.A.
Relative Performance^(Growth Option)
HDFC Gilt Fund
Short Term Plan
^̂PPaasstt PPeerrffoorrmmaannccee mmaayy oorr mmaayy nnoott bbee ssuussttaaiinneedd iinn tthhee ffuuttuurreePerformance of the Dividend Option for the investor would be net of Distribution Tax as applicable* Absolute Returns ** Compounded Annualised Returns#I-Sec Li-Bex N.A. Not Available
DDaattee PPeerriioodd NNAAVV RReettuurrnnss BBeenncchhmmaarrkkppeerr UUnniitt ((RRss..)) ((%%))^̂ RReettuurrnnss ((%%))##
Oct 29, 08 Last Six Months (182 days) 17.2916 9.28* 11.47*Apr 29, 08 Last 1 Year (365 days) 16.7166 13.04* 21.84*Apr 28, 06 Last 3 Years (1097 days) 15.3219 7.23** 11.20**Apr 29, 04 Last 5 Years (1826 days) 15.4299 4.14** 7.12**Jul 25, 01 Since Inception (2835 days) 10.0000 8.54** N.A.
Relative Performance^(Growth Option)
Long Term Plan
MMooddiiffiieedd DDuurraattiioonn 11..3344 yyeeaarrss MMooddiiffiieedd DDuurraattiioonn 66..6699 yyeeaarrss
AAvveerraaggee PPoorrttffoolliioo MMaattuurriittyy 11..6666 yyeeaarrss AAvveerraaggee PPoorrttffoolliioo MMaattuurriittyy 1111..3322 yyeeaarrss
IIssssuueerr RRaattiinngg %% ttoo NNAAVV
GGOOVVEERRNNMMEENNTT SSEECCUURRIITTEESS // TTRREEAASSUURRYY BBIILLLLSS
5.48% GOI 2009 SOV 41.05
7.56% GOI 2014 SOV 14.60
7.27% GOI 2013 SOV 14.34
9.39% GOI 2011 SOV 7.44
TToottaall GGoovveerrnnmmeenntt SSeeccuurriitteess // TTrreeaassuurryy BBiillllss 7777..4433
Cash, Cash Equivalents and Net Current Assets 22.57
GGrraanndd TToottaall 110000..0000
NNeett AAsssseettss ((RRss.. IInn LLaakkhhss)) 33,,666622..9922
Portfolio – Holdings (as at April 30, 2009)IIssssuueerr RRaattiinngg %% ttoo NNAAVV
GGOOVVEERRNNMMEENNTT SSEECCUURRIITTIIEESS // TTRREEAASSUURRYY BBIILLLLSS
6.05% GOI FEB 2019 SOV 42.58
7.95% GOI 2032 SOV 12.32
7.56% GOI 2014 SOV 12.30
8.24% GOI 2018 SOV 6.39
7.46% GOI 2017 SOV 6.08
7.50% GOI 2034 SOV 5.91
8.33% GOI 2036 SOV 3.21
9.39% GOI 2011 SOV 3.14
TToottaall GGoovveerrnnmmeenntt SSeeccuurriitteess // TTrreeaassuurryy BBiillllss 9911..9933
Cash, Cash Equivalents and Net Current Assets 8.07
GGrraanndd TToottaall 110000..0000
NNeett AAsssseettss ((RRss.. IInn LLaakkhhss)) 88,,669933..9999
Portfolio – Holdings (as at April 30, 2009)
NNAAVV (as at April 29, 2009) NAV per Unit (Rs.)
Growth Option 15.6178
Dividend Option 10.7480
NNAAVV (as at April 29, 2009) NAV per Unit (Rs.)
Growth Option 18.8971
Dividend Option 10.7865
Intouchmutually April 2009 23
hdfc-dt.qxd 5/7/2009 8:22 PM Page 5
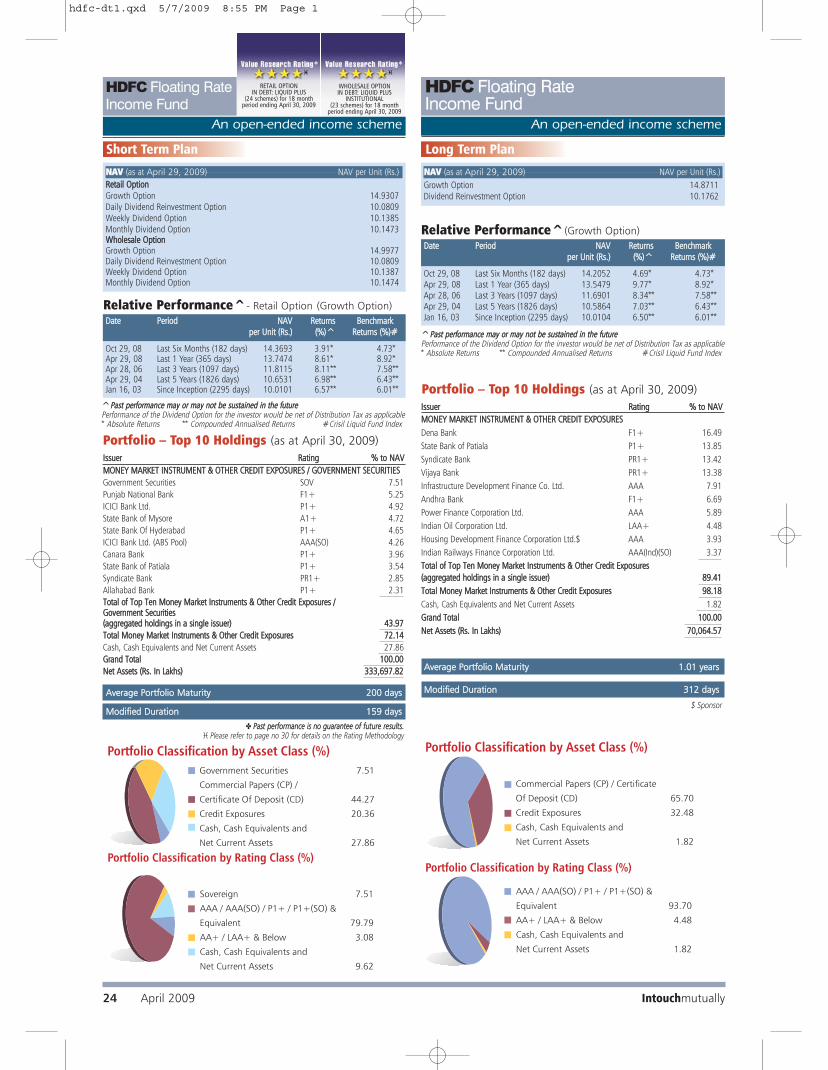
^̂PPaasstt ppeerrffoorrmmaannccee mmaayy oorr mmaayy nnoott bbee ssuussttaaiinneedd iinn tthhee ffuuttuurreePerformance of the Dividend Option for the investor would be net of Distribution Tax as applicable* Absolute Returns ** Compounded Annualised Returns #Crisil Liquid Fund Index
DDaattee PPeerriioodd NNAAVV RReettuurrnnss BBeenncchhmmaarrkkppeerr UUnniitt ((RRss..)) ((%%))^̂ RReettuurrnnss ((%%))##
Oct 29, 08 Last Six Months (182 days) 14.3693 3.91* 4.73*Apr 29, 08 Last 1 Year (365 days) 13.7474 8.61* 8.92*Apr 28, 06 Last 3 Years (1097 days) 11.8115 8.11** 7.58**Apr 29, 04 Last 5 Years (1826 days) 10.6531 6.98** 6.43**Jan 16, 03 Since Inception (2295 days) 10.0101 6.57** 6.01**
Relative Performance^- Retail Option (Growth Option)
MMooddiiffiieedd DDuurraattiioonn 115599 ddaayyss$ Sponsor
Short Term Plan
MMOONNEEYY MMAARRKKEETT IINNSSTTRRUUMMEENNTT && OOTTHHEERR CCRREEDDIITT EEXXPPOOSSUURREESS // GGOOVVEERRNNMMEENNTT SSEECCUURRIITTIIEESS
Government Securities SOV 7.51
Punjab National Bank F1+ 5.25
ICICI Bank Ltd. P1+ 4.92
State Bank of Mysore A1+ 4.72
State Bank Of Hyderabad P1+ 4.65
ICICI Bank Ltd. (ABS Pool) AAA(SO) 4.26
Canara Bank P1+ 3.96
State Bank of Patiala P1+ 3.54
Syndicate Bank PR1+ 2.85
Allahabad Bank P1+ 2.31
TToottaall ooff TToopp TTeenn MMoonneeyy MMaarrkkeett IInnssttrruummeennttss && OOtthheerr CCrreeddiitt EExxppoossuurreess // GGoovveerrnnmmeenntt SSeeccuurriittiieess((aaggggrreeggaatteedd hhoollddiinnggss iinn aa ssiinnggllee iissssuueerr)) 4433..9977
TToottaall MMoonneeyy MMaarrkkeett IInnssttrruummeennttss && OOtthheerr CCrreeddiitt EExxppoossuurreess 7722..1144
Cash, Cash Equivalents and Net Current Assets 27.86
GGrraanndd TToottaall 110000..0000
NNeett AAsssseettss ((RRss.. IInn LLaakkhhss)) 333333,,669977..8822
Portfolio – Top 10 Holdings (as at April 30, 2009)
IIssssuueerr RRaattiinngg %% ttoo NNAAVV
MMOONNEEYY MMAARRKKEETT IINNSSTTRRUUMMEENNTT && OOTTHHEERR CCRREEDDIITT EEXXPPOOSSUURREESS
Dena Bank F1+ 16.49
State Bank of Patiala P1+ 13.85
Syndicate Bank PR1+ 13.42
Vijaya Bank PR1+ 13.38
Infrastructure Development Finance Co. Ltd. AAA 7.91
Andhra Bank F1+ 6.69
Power Finance Corporation Ltd. AAA 5.89
Indian Oil Corporation Ltd. LAA+ 4.48
Housing Development Finance Corporation Ltd.$ AAA 3.93
Indian Railways Finance Corporation Ltd. AAA(Ind)(SO) 3.37
TToottaall ooff TToopp TTeenn MMoonneeyy MMaarrkkeett IInnssttrruummeennttss && OOtthheerr CCrreeddiitt EExxppoossuurreess
((aaggggrreeggaatteedd hhoollddiinnggss iinn aa ssiinnggllee iissssuueerr)) 8899..4411
TToottaall MMoonneeyy MMaarrkkeett IInnssttrruummeennttss && OOtthheerr CCrreeddiitt EExxppoossuurreess 9988..1188
Cash, Cash Equivalents and Net Current Assets 1.82
GGrraanndd TToottaall 110000..0000
NNeett AAsssseettss ((RRss.. IInn LLaakkhhss)) 7700,,006644..5577
Portfolio – Top 10 Holdings (as at April 30, 2009)
IIssssuueerr RRaattiinngg %% ttoo NNAAVV
HDFC Floating Rate Income Fund
An open-ended income scheme
HDFC Floating Rate Income Fund
An open-ended income scheme
^̂PPaasstt ppeerrffoorrmmaannccee mmaayy oorr mmaayy nnoott bbee ssuussttaaiinneedd iinn tthhee ffuuttuurreePerformance of the Dividend Option for the investor would be net of Distribution Tax as applicable* Absolute Returns ** Compounded Annualised Returns #Crisil Liquid Fund Index
DDaattee PPeerriioodd NNAAVV RReettuurrnnss BBeenncchhmmaarrkkppeerr UUnniitt ((RRss..)) ((%%))^̂ RReettuurrnnss ((%%))##
Oct 29, 08 Last Six Months (182 days) 14.2052 4.69* 4.73*Apr 29, 08 Last 1 Year (365 days) 13.5479 9.77* 8.92*Apr 28, 06 Last 3 Years (1097 days) 11.6901 8.34** 7.58**Apr 29, 04 Last 5 Years (1826 days) 10.5864 7.03** 6.43**Jan 16, 03 Since Inception (2295 days) 10.0104 6.50** 6.01**
Relative Performance^(Growth Option)
Long Term Plan
MMooddiiffiieedd DDuurraattiioonn 331122 ddaayyssAAvveerraaggee PPoorrttffoolliioo MMaattuurriittyy 220000 ddaayyss
AAvveerraaggee PPoorrttffoolliioo MMaattuurriittyy 11..0011 yyeeaarrss
NNAAVV (as at April 29, 2009) NAV per Unit (Rs.)
RReettaaiill OOppttiioonnGrowth Option 14.9307Daily Dividend Reinvestment Option 10.0809Weekly Dividend Option 10.1385Monthly Dividend Option 10.1473WWhhoolleessaallee OOppttiioonnGrowth Option 14.9977Daily Dividend Reinvestment Option 10.0809Weekly Dividend Option 10.1387Monthly Dividend Option 10.1474
NNAAVV (as at April 29, 2009) NAV per Unit (Rs.)
Growth Option 14.8711Dividend Reinvestment Option 10.1762
✤ PPaasstt ppeerrffoorrmmaannccee iiss nnoo gguuaarraanntteeee ooff ffuuttuurree rreessuullttss.. � Please refer to page no 30 for details on the Rating Methodology
WHOLESALE OPTION IN DEBT: LIQUID PLUS
INSTITUTIONAL(23 schemes) for 18 month
period ending April 30, 2009
RETAIL OPTION IN DEBT: LIQUID PLUS
(24 schemes) for 18 month period ending April 30, 2009
Intouchmutually24 April 2009
hdfc-dt1.qxd 5/7/2009 8:55 PM Page 1

DDaattee PPeerriioodd NNAAVV RReettuurrnnss BBeenncchhmmaarrkkppeerr UUnniitt ((RRss..)) ((%%))^̂ RReettuurrnnss ((%%))##
LLiiqquuiidd FFuunnddApr 22, 09 Last 7 days 17.5232 0.11* 0.06*Apr 13, 09 Last 16 days 17.4999 0.24* 0.34*Mar 27, 09 Last 1 Month (33 days) 17.4505 0.52* 0.88*Jan 29, 09 Last 3 Months (90 days) 17.2687 1.58* 2.07*Oct 29, 08 Last 6 Months (182 days) 16.9220 3.66* 4.73*Apr 29, 08 Last 1 Year (365 days) 16.1911 8.34* 8.92*Apr 28, 06 Last 3 Years (1097 days) 13.9458 7.93** 7.58**Apr 29, 04 Last 5 Years (1826 days) 12.6270 6.79** 6.43**Oct 17, 00 Since Inception (3116 days) 10.0000 6.80** N.A.
Relative Performance^(Growth Option)
^̂PPaasstt ppeerrffoorrmmaannccee mmaayy oorr mmaayy nnoott bbee ssuussttaaiinneedd iinn tthhee ffuuttuurree N.A. Not AvailablePerformance of the Dividend Option for the investor would be net of Distribution Tax as applicable* Absolute Returns ** Compounded Annualised Returns # Crisil Liquid Fund Index
Portfolio – Top 10 Holdings (as at April 30, 2009)IIssssuueerr RRaattiinngg %% ttoo NNAAVV
HDFC
Liquid Fund
An open-ended liquid income scheme
HDFCCashManagement Fund
An open-ended high liquidity income scheme
PREMIUM PLAN - IN DEBT: ULTRA SHORT-TERM INSTITUTIONAL
(46 schemes) for 18 month period ending April 30, 2009
IN DEBT: ULTRA SHORT-TERM CATEGORY(40 schemes) for 18 month period
ending April 30, 2009
$ Sponsor✤ PPaasstt ppeerrffoorrmmaannccee iiss nnoo gguuaarraanntteeee ooff ffuuttuurree rreessuullttss..
� Please refer to page no 30 for details on the Rating Methodology
AAvveerraaggee PPoorrttffoolliioo MMaattuurriittyy 112255 ddaayyss
AAvveerraaggee PPoorrttffoolliioo MMaattuurriittyy 114411 ddaayyss
MMooddiiffiieedd DDuurraattiioonn 111133 ddaayyss
MMooddiiffiieedd DDuurraattiioonn 111111 ddaayyss
IN DEBT: ULTRA SHORT-TERM CATEGORY(40 schemes) for 18 month period
ending April 30, 2009
Portfolio – Top 10 Holdings (as at April 30, 2009)
IIssssuueerr RRaattiinngg %% ttoo NNAAVV
Savings Plan
DDaattee PPeerriioodd NNAAVV RReettuurrnnss BBeenncchhmmaarrkkppeerr UUnniitt ((RRss..)) ((%%))^̂$$$$ RReettuurrnnss ((%%))##
Relative Performance^(Growth Option)
Apr 22, 09 Last 7 days 18.4505 0.11* 0.06*Apr 13, 09 Last 16 days 18.4249 0.24* 0.34*Mar 27, 09 Last 1 Month (33 days) 18.3709 0.54* 0.88*Jan 29, 09 Last 3 Months (90 days) 18.1725 1.64* 2.07*Oct 29, 08 Last 6 Months (182 days) 17.7985 3.77* 4.73*Apr 29, 08 Last 1 Year (365 days) 17.0205 8.52* 8.92*Apr 28, 06 Last 3 Years (1097 days) 14.6342 8.05** 7.58**Apr 29, 04 Last 5 Years (1826 days) 13.2039 6.94** 6.43**Nov 18, 99 Since Inception (3450 days) 10.0000 6.75** N.A.
^̂PPaasstt ppeerrffoorrmmaannccee mmaayy oorr mmaayy nnoott bbee ssuussttaaiinneedd iinn tthhee ffuuttuurreePerformance of the Dividend Option for the investor would be net of Distribution Tax as applicable* Absolute Returns ** Compounded Annualised Returns #Crisil Liquid Fund Index$$ Adjusted for the dividends declared under the scheme prior to its splitting into the Dividendand Growth Plans N.A. Not Available
NNAAVV (as at April 29, 2009) NAV per Unit (Rs.)
Growth Option 18.4699
Daily Dividend Reinvestment Option 10.6364
Weekly Dividend Option 10.6327
NNAAVV (as at April 29, 2009) NAV per Unit (Rs.)
HHDDFFCC LLiiqquuiidd FFuunnddGrowth Option 17.5419Daily Dividend Reinvestment Option 10.1982Weekly Dividend Option 10.3132Monthly Dividend Option 10.2659HHDDFFCC LLiiqquuiidd FFuunndd -- PPrreemmiiuumm PPllaannGrowth Option 17.7097Daily Dividend Reinvestment Option 12.2598HHDDFFCC LLiiqquuiidd FFuunndd -- PPrreemmiiuumm PPlluuss PPllaannGrowth Option 17.7467Weekly Dividend Option 12.4214
MMOONNEEYY MMAARRKKEETT IINNSSTTRRUUMMEENNTT && OOTTHHEERR CCRREEDDIITT EEXXPPOOSSUURREESS
Corporation Bank P1+ 6.17
Punjab National Bank F1+ 6.05
State Bank of Patiala P1+ 5.20
State Bank of Mysore A1+ 5.10
Housing Development Finance Corporation Ltd.$ AAA 4.65
IDBI Bank Ltd. A1+/AA+ 3.88
State Bank Of Hyderabad P1+ 3.46
Union Bank of India A1+ 3.37
Allahabad Bank P1+ 3.04
Axis Bank Ltd. P1+ 2.96
TToottaall ooff TToopp TTeenn MMoonneeyy MMaarrkkeett IInnssttrruummeennttss && OOtthheerr CCrreeddiitt EExxppoossuurreess
((aaggggrreeggaatteedd hhoollddiinnggss iinn aa ssiinnggllee iissssuueerr)) 4433..8888
TToottaall MMoonneeyy MMaarrkkeett IInnssttrruummeennttss && OOtthheerr CCrreeddiitt EExxppoossuurreess 6677..1133
Cash, Cash Equivalents and Net Current Assets 32.87
GGrraanndd TToottaall 110000..0000
NNeett AAsssseettss ((RRss.. IInn LLaakkhhss)) 556622,,444411..8899
✤ PPaasstt ppeerrffoorrmmaannccee iiss nnoo gguuaarraanntteeee ooff ffuuttuurree rreessuullttss.. � Please refer to page no 30 for details on the Rating Methodology
MMOONNEEYY MMAARRKKEETT IINNSSTTRRUUMMEENNTT && OOTTHHEERR CCRREEDDIITT EEXXPPOOSSUURREESS
ICICI Bank Ltd. AAA/P1+ 4.92
UCO Bank P1+ 3.68
Union Bank of India A1+ 3.49
Allahabad Bank P1+ 3.46
Corporation Bank P1+ 3.41
Punjab National Bank F1+ 3.40
Bank of India A1+ 2.98
The Federal Bank Ltd. P1+ 2.90
State Bank Of Hyderabad P1+ 2.78
State Bank of Mysore A1+ 2.75
TToottaall ooff TToopp TTeenn MMoonneeyy MMaarrkkeett IInnssttrruummeennttss && OOtthheerr CCrreeddiitt EExxppoossuurreess
((aaggggrreeggaatteedd hhoollddiinnggss iinn aa ssiinnggllee iissssuueerr)) 3333..7777
TToottaall MMoonneeyy MMaarrkkeett IInnssttrruummeennttss && OOtthheerr CCrreeddiitt EExxppoossuurreess 7733..3322
Cash, Cash Equivalents and Net Current Assets 26.68
GGrraanndd TToottaall 110000..0000
NNeett AAsssseettss ((RRss.. IInn LLaakkhhss)) 11,,006633,,005566..5533
Intouchmutually April 2009 25
hdfc-dt1.qxd 5/7/2009 8:55 PM Page 2

Portfolio – Top 10 Holdings (as at April 30, 2009)
AAvveerraaggee PPoorrttffoolliioo MMaattuurriittyy 3311 ddaayyss
MMooddiiffiieedd DDuurraattiioonn 1111 ddaayyss
HDFC Cash Management Fund HDFC Cash Management Fund
DDaattee PPeerriioodd NNAAVV RReettuurrnnss BBeenncchhmmaarrkkppeerr UUnniitt ((RRss..)) ((%%))^̂ RReettuurrnnss ((%%))##
Relative Performance^(Growth Option)
Call Plan
NNoottee ffoorr AAllll OOppeenn--EEnnddeedd SScchheemmeess ((aass aatt AApprriill 3300,, 22000099))i) Total NPAs provided for and its percentage to NAV : Nilii) Investment in ADR/GDR/Foreign Securities : Niliii) Total outstanding exposure in derivative instruments (Gross Notional) :
a) Equity : HDFC Growth Fund (Nifty NSE May 2009 Futures) Rs. 4,876.34 lakhsHDFC Capital Builder Fund (Nifty NSE May 2009 Futures) Rs. 435.39 lakhsHDFC Long Term Advantage Fund (Nifty NSE May 2009 Futures) Rs. 609.54 lakhs
TToottaall RRss.. 5,921.27 llaakkhhss
b) Debt : Interest Rates Swaps / Forward Rate AgreementHDFC Children’s Gift Fund - Investment Plan (Interest Rate Swaps) Rs. 500.00 lakhs
TToottaall RRss.. 500.00 llaakkhhss
DDaattee PPeerriioodd NNAAVV RReettuurrnnss BBeenncchhmmaarrkkppeerr UUnniitt ((RRss..)) ((%%))^̂ RReettuurrnnss ((%%))##
Relative Performance^- Retail Plan (Growth Option)
Treasury Advantage Plan*
Apr 22, 09 Last 7 days 14.8390 0.10* 0.06*Apr 13, 09 Last 16 days 14.8217 0.21* 0.34*Mar 27, 09 Last 1 Month (33 days) 14.7919 0.42* 0.88*Jan 29, 09 Last 3 Months (90 days) 14.6987 1.05* 2.07*Oct 29, 08 Last 6 Months (182 days) 14.4944 2.48* 4.73*Apr 29, 08 Last 1 Year (365 days) 13.9060 6.81* 8.92*Apr 28, 06 Last 3 Years (1097 days) 12.1322 6.96** 7.58**Apr 29, 04 Last 5 Years (1826 days) 11.0724 6.05** 6.43**Feb 06, 02 Since Inception (2639 days) 10.0000 5.62** N.A.
An open-ended income scheme An open-ended high liquidity income scheme
^̂PPaasstt ppeerrffoorrmmaannccee mmaayy oorr mmaayy nnoott bbee ssuussttaaiinneedd iinn tthhee ffuuttuurree N.A. Not AvailablePerformance of the Dividend Option for the investor would be net of Distribution Tax as applicable* Absolute Returns ** Compounded Annualised Returns #Crisil Liquid Fund Index
Oct 29, 08 Last Six Months (182 days) 18.4804 3.73* 4.73*Apr 29, 08 Last 1 Year (365 days) 17.7005 8.30* 8.92*Apr 28, 06 Last 3 Years (1097 days) 15.2162 7.99** 7.58**Apr 29, 04 Last 5 Years (1826 days) 13.7432 6.88** 6.43**Nov 18, 99 Since Inception (3450 days) 10.0000 7.13** N.A.
^̂PPaasstt ppeerrffoorrmmaannccee mmaayy oorr mmaayy nnoott bbee ssuussttaaiinneedd iinn tthhee ffuuttuurree N.A. Not AvailablePerformance of the Dividend Option for the investor would be net of Distribution Tax as applicable* Absolute Returns ** Compounded Annualised Returns #Crisil Liquid Fund Index
AAvveerraaggee PPoorrttffoolliioo MMaattuurriittyy 117744 ddaayyss
MMooddiiffiieedd DDuurraattiioonn 113311 ddaayyss
IIssssuueerr RRaattiinngg %% ttoo NNAAVV
Portfolio – Holdings (as at April 30, 2009)IIssssuueerr RRaattiinngg %% ttoo NNAAVV
NNAAVV (as at April 29, 2009) NAV per Unit (Rs.)
RReettaaiill OOppttiioonnGrowth Option 19.1696Daily Dividend Reinvestment Option 10.0315Weekly Dividend Option 10.0189Monthly Dividend Option 10.0429WWhhoolleessaallee OOppttiioonnGrowth Option 19.3091Daily Dividend Reinvestment Option 10.0315Weekly Dividend Option 10.0191Monthly Dividend Option 10.0531
NNAAVV (as at April 29, 2009) NAV per Unit (Rs.)
Growth Option 14.8533Daily Dividend Reinvestment Option 10.4266
MMOONNEEYY MMAARRKKEETT IINNSSTTRRUUMMEENNTTSS && OOTTHHEERR CCRREEDDIITT EEXXPPOOSSUURREESS
Tata Sons Ltd. AAA 5.33
TToottaall MMoonneeyy MMaarrkkeett IInnssttrruummeennttss && OOtthheerr CCrreeddiitt EExxppoossuurreess 55..3333
Cash, Cash Equivalents and Net Current Assets 94.67 GGrraanndd TToottaall 110000..0000NNeett AAsssseettss ((RRss.. IInn LLaakkhhss)) 33,,774499..8800
$ Sponsor
MMOONNEEYY MMAARRKKEETT IINNSSTTRRUUMMEENNTTSS && OOTTHHEERR CCRREEDDIITT EEXXPPOOSSUURREESS
ICICI Bank Ltd. P1+ 4.46
Punjab National Bank F1+ 3.87
Housing Development Finance Corporation Ltd.$ AAA 3.77
State Bank of Mysore A1+ 3.39
Canara Bank P1+ 3.15
91 Days T-Bill Sovereign 2.82
Andhra Bank F1+ 2.70
Bharat Petroleum Corpn. Ltd. A1+ (SO)/AAA/P1+ (SO) 2.24
Government Securities Sovereign 2.20
Power Finance Corporation Ltd. AAA/AAA (SO) 1.48TToottaall ooff TToopp TTeenn MMoonneeyy MMaarrkkeett IInnssttrruummeennttss && OOtthheerr CCrreeddiitt EExxppoossuurreess((aaggggrreeggaatteedd hhoollddiinnggss iinn aa ssiinnggllee iissssuueerr)) 3300..0088
TToottaall MMoonneeyy MMaarrkkeett IInnssttrruummeennttss && OOtthheerr CCrreeddiitt EExxppoossuurreess 7700..2233
Cash, Cash Equivalents and Net Current Assets 29.77
GGrraanndd TToottaall 110000..0000
NNeett AAsssseettss ((RRss.. IInn LLaakkhhss)) 22,,225577,,554411..5511
* erstwhile HDFC Cash Management Fund - Savings Plus Plan
26 April 2009 Intouchmutually
hdfc-dt1.qxd 5/7/2009 8:55 PM Page 3
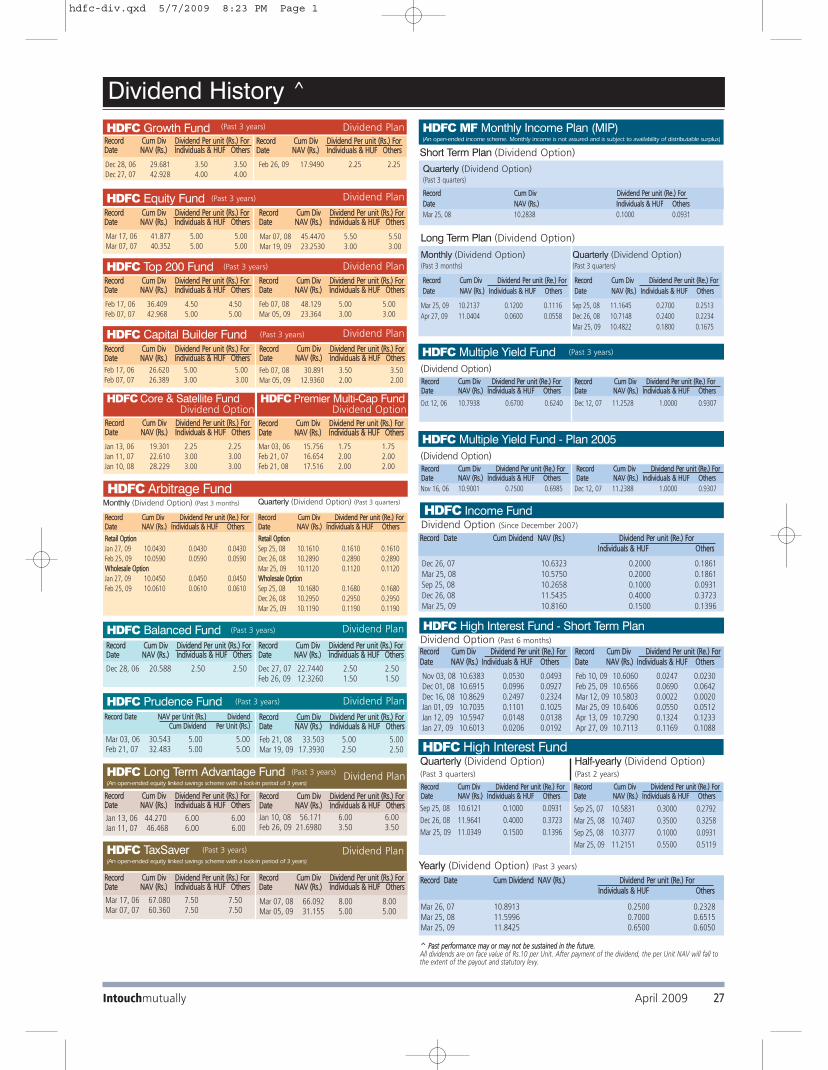
Nov 03, 08 10.6383 0.0530 0.0493Dec 01, 08 10.6915 0.0996 0.0927Dec 16, 08 10.8629 0.2497 0.2324Jan 01, 09 10.7035 0.1101 0.1025Jan 12, 09 10.5947 0.0148 0.0138Jan 27, 09 10.6013 0.0206 0.0192
Feb 10, 09 10.6060 0.0247 0.0230Feb 25, 09 10.6566 0.0690 0.0642Mar 12, 09 10.5803 0.0022 0.0020Mar 25, 09 10.6406 0.0550 0.0512Apr 13, 09 10.7290 0.1324 0.1233Apr 27, 09 10.7113 0.1169 0.1088
RReeccoorrdd CCuumm DDiivv DDiivviiddeenndd PPeerr uunniitt ((RRee..)) FFoorr DDaattee NNAAVV ((RRss..)) IInnddiivviidduuaallss && HHUUFF OOtthheerrss
RReeccoorrdd CCuumm DDiivv DDiivviiddeenndd PPeerr uunniitt ((RRee..)) FFoorr DDaattee NNAAVV ((RRss..)) IInnddiivviidduuaallss && HHUUFF OOtthheerrss
Dividend Option (Past 6 months)
HDFC High Interest Fund - Short Term Plan
HDFC High Interest Fund
Sep 25, 08 10.6121 0.1000 0.0931
Dec 26, 08 11.9641 0.4000 0.3723
Mar 25, 09 11.0349 0.1500 0.1396
Sep 25, 07 10.5831 0.3000 0.2792
Mar 25, 08 10.7407 0.3500 0.3258
Sep 25, 08 10.3777 0.1000 0.0931
Mar 25, 09 11.2151 0.5500 0.5119
RReeccoorrdd CCuumm DDiivv DDiivviiddeenndd PPeerr uunniitt ((RRee..)) FFoorr DDaattee NNAAVV ((RRss..)) IInnddiivviidduuaallss && HHUUFF OOtthheerrss
RReeccoorrdd CCuumm DDiivv DDiivviiddeenndd PPeerr uunniitt ((RRee..)) FFoorr DDaattee NNAAVV ((RRss..)) IInnddiivviidduuaallss && HHUUFF OOtthheerrss
Quarterly (Dividend Option)(Past 3 quarters)
Half-yearly (Dividend Option)(Past 2 years)
Yearly (Dividend Option) (Past 3 years)
Dec 26, 07 10.6323 0.2000 0.1861
Mar 25, 08 10.5750 0.2000 0.1861
Sep 25, 08 10.2658 0.1000 0.0931
Dec 26, 08 11.5435 0.4000 0.3723
Mar 25, 09 10.8160 0.1500 0.1396
RReeccoorrdd DDaattee CCuumm DDiivviiddeenndd NNAAVV ((RRss..)) DDiivviiddeenndd PPeerr uunniitt ((RRee..)) FFoorr IInnddiivviidduuaallss && HHUUFF OOtthheerrss
Dividend Option (Since December 2007)
Mar 26, 07 10.8913 0.2500 0.2328Mar 25, 08 11.5996 0.7000 0.6515Mar 25, 09 11.8425 0.6500 0.6050
RReeccoorrdd DDaattee CCuumm DDiivviiddeenndd NNAAVV ((RRss..)) DDiivviiddeenndd PPeerr uunniitt ((RRee..)) FFoorr IInnddiivviidduuaallss && HHUUFF OOtthheerrss
HDFC Income Fund
Short Term Plan (Dividend Option)
HDFC MF Monthly Income Plan (MIP)(An open-ended income scheme. Monthly income is not assured and is subject to availability of distributable surplus)
Long Term Plan (Dividend Option)
Quarterly (Dividend Option)(Past 3 quarters)
RReeccoorrdd CCuumm DDiivv DDiivviiddeenndd PPeerr uunniitt ((RRee..)) FFoorr
DDaattee NNAAVV ((RRss..)) IInnddiivviidduuaallss && HHUUFF OOtthheerrss
Mar 25, 08 10.2838 0.1000 0.0931
Monthly (Dividend Option) (Past 3 months)
RReeccoorrdd CCuumm DDiivv DDiivviiddeenndd PPeerr uunniitt ((RRee..)) FFoorr
DDaattee NNAAVV ((RRss..)) IInnddiivviidduuaallss && HHUUFF OOtthheerrss
Mar 25, 09 10.2137 0.1200 0.1116
Apr 27, 09 11.0404 0.0600 0.0558
Quarterly (Dividend Option)(Past 3 quarters)
RReeccoorrdd CCuumm DDiivv DDiivviiddeenndd PPeerr uunniitt ((RRee..)) FFoorr
DDaattee NNAAVV ((RRss..)) IInnddiivviidduuaallss && HHUUFF OOtthheerrss
Sep 25, 08 11.1645 0.2700 0.2513
Dec 26, 08 10.7148 0.2400 0.2234
Mar 25, 09 10.4822 0.1800 0.1675
HDFC Multiple Yield Fund (Past 3 years)
Oct 12, 06 10.7938 0.6700 0.6240 Dec 12, 07 11.2528 1.0000 0.9307
RReeccoorrdd CCuumm DDiivv DDiivviiddeenndd PPeerr uunniitt ((RRee..)) FFoorr DDaattee NNAAVV ((RRss..)) IInnddiivviidduuaallss && HHUUFF OOtthheerrss
RReeccoorrdd CCuumm DDiivv DDiivviiddeenndd PPeerr uunniitt ((RRee..)) FFoorr DDaattee NNAAVV ((RRss..)) IInnddiivviidduuaallss && HHUUFF OOtthheerrss
(Dividend Option)
HDFC Multiple Yield Fund - Plan 2005
Nov 16, 06 10.9001 0.7500 0.6985 Dec 12, 07 11.2388 1.0000 0.9307
RReeccoorrdd CCuumm DDiivv DDiivviiddeenndd PPeerr uunniitt ((RRee..)) FFoorr DDaattee NNAAVV ((RRss..)) IInnddiivviidduuaallss && HHUUFF OOtthheerrss
RReeccoorrdd CCuumm DDiivv DDiivviiddeenndd PPeerr uunniitt ((RRee..)) FFoorr DDaattee NNAAVV ((RRss..)) IInnddiivviidduuaallss && HHUUFF OOtthheerrss
(Dividend Option)
^̂ PPaasstt ppeerrffoorrmmaannccee mmaayy oorr mmaayy nnoott bbee ssuussttaaiinneedd iinn tthhee ffuuttuurree.. All dividends are on face value of Rs.10 per Unit. After payment of the dividend, the per Unit NAV will fall tothe extent of the payout and statutory levy.
Dividend History ^
April 2009 2277Intouchmutually
Jan 13, 06 19.301 2.25 2.25
Jan 11, 07 22.610 3.00 3.00
Jan 10, 08 28.229 3.00 3.00
RReeccoorrdd CCuumm DDiivv DDiivviiddeenndd PPeerr uunniitt ((RRss..)) FFoorr DDaattee NNAAVV ((RRss..)) IInnddiivviidduuaallss && HHUUFF OOtthheerrss
HDFC Core & Satellite Fund
Mar 17, 06 41.877 5.00 5.00
Mar 07, 07 40.352 5.00 5.00
RReeccoorrdd CCuumm DDiivv DDiivviiddeenndd PPeerr uunniitt ((RRss..)) FFoorr DDaattee NNAAVV ((RRss..)) IInnddiivviidduuaallss && HHUUFF OOtthheerrss
RReeccoorrdd CCuumm DDiivv DDiivviiddeenndd PPeerr uunniitt ((RRss..)) FFoorr DDaattee NNAAVV ((RRss..)) IInnddiivviidduuaallss && HHUUFF OOtthheerrss
HDFC Equity Fund (Past 3 years)
Feb 17, 06 36.409 4.50 4.50
Feb 07, 07 42.968 5.00 5.00
Feb 07, 08 48.129 5.00 5.00
Mar 05, 09 23.364 3.00 3.00
RReeccoorrdd CCuumm DDiivv DDiivviiddeenndd PPeerr uunniitt ((RRss..)) FFoorr DDaattee NNAAVV ((RRss..)) IInnddiivviidduuaallss && HHUUFF OOtthheerrss
RReeccoorrdd CCuumm DDiivv DDiivviiddeenndd PPeerr uunniitt ((RRss..)) FFoorr DDaattee NNAAVV ((RRss..)) IInnddiivviidduuaallss && HHUUFF OOtthheerrss
HDFC Top 200 Fund (Past 3 years)
Feb 17, 06 26.620 5.00 5.00
Feb 07, 07 26.389 3.00 3.00
RReeccoorrdd CCuumm DDiivv DDiivviiddeenndd PPeerr uunniitt ((RRss..)) FFoorr DDaattee NNAAVV ((RRss..)) IInnddiivviidduuaallss && HHUUFF OOtthheerrss
HDFC Capital Builder Fund (Past 3 years)
Dec 28, 06 29.681 3.50 3.50
Dec 27, 07 42.928 4.00 4.00
Feb 26, 09 17.9490 2.25 2.25
RReeccoorrdd CCuumm DDiivv DDiivviiddeenndd PPeerr uunniitt ((RRss..)) FFoorr DDaattee NNAAVV ((RRss..)) IInnddiivviidduuaallss && HHUUFF OOtthheerrss
HDFC Growth Fund
Mar 07, 08 45.4470 5.50 5.50
Mar 19, 09 23.2530 3.00 3.00
RReeccoorrdd CCuumm DDiivv DDiivviiddeenndd PPeerr uunniitt ((RRss..)) FFoorr DDaattee NNAAVV ((RRss..)) IInnddiivviidduuaallss && HHUUFF OOtthheerrss
Feb 07, 08 30.891 3.50 3.50
Mar 05, 09 12.9360 2.00 2.00
HDFC Balanced Fund (Past 3 years)
RReeccoorrdd CCuumm DDiivv DDiivviiddeenndd PPeerr uunniitt ((RRss..)) FFoorr DDaattee NNAAVV ((RRss..)) IInnddiivviidduuaallss && HHUUFF OOtthheerrss
Dec 28, 06 20.588 2.50 2.50
RReeccoorrdd CCuumm DDiivv DDiivviiddeenndd PPeerr uunniitt ((RRss..)) FFoorr DDaattee NNAAVV ((RRss..)) IInnddiivviidduuaallss && HHUUFF OOtthheerrss
Dec 27, 07 22.7440 2.50 2.50Feb 26, 09 12.3260 1.50 1.50
Mar 03, 06 30.543 5.00 5.00Feb 21, 07 32.483 5.00 5.00
RReeccoorrdd DDaattee NNAAVV ppeerr UUnniitt ((RRss..)) DDiivviiddeennddCCuumm DDiivviiddeenndd PPeerr UUnniitt ((RRss..))
RReeccoorrdd CCuumm DDiivv DDiivviiddeenndd PPeerr uunniitt ((RRss..)) FFoorr DDaattee NNAAVV ((RRss..)) IInnddiivviidduuaallss && HHUUFF OOtthheerrss
HDFC Prudence Fund (Past 3 years)
Feb 21, 08 33.503 5.00 5.00Mar 19, 09 17.3930 2.50 2.50
RReeccoorrdd CCuumm DDiivv DDiivviiddeenndd PPeerr uunniitt ((RRss..)) FFoorr DDaattee NNAAVV ((RRss..)) IInnddiivviidduuaallss && HHUUFF OOtthheerrss
Dividend Plan
Dividend Plan
Dividend Plan
Dividend Plan
Dividend Plan
Dividend Plan
Dividend Option HDFC Premier Multi-Cap Fund
Dividend Option
Mar 03, 06 15.756 1.75 1.75
Feb 21, 07 16.654 2.00 2.00
Feb 21, 08 17.516 2.00 2.00
RReeccoorrdd CCuumm DDiivv DDiivviiddeenndd PPeerr uunniitt ((RRss..)) FFoorr DDaattee NNAAVV ((RRss..)) IInnddiivviidduuaallss && HHUUFF OOtthheerrss
(Past 3 years)
Jan 13, 06 44.270 6.00 6.00Jan 11, 07 46.468 6.00 6.00
RReeccoorrdd CCuumm DDiivv DDiivviiddeenndd PPeerr uunniitt ((RRss..)) FFoorr DDaattee NNAAVV ((RRss..)) IInnddiivviidduuaallss && HHUUFF OOtthheerrss
HDFC Long Term Advantage Fund (Past 3 years)
(An open-ended equity linked savings scheme with a lock-in period of 3 years)
RReeccoorrdd CCuumm DDiivv DDiivviiddeenndd PPeerr uunniitt ((RRss..)) FFoorr DDaattee NNAAVV ((RRss..)) IInnddiivviidduuaallss && HHUUFF OOtthheerrss
Jan 10, 08 56.171 6.00 6.00Feb 26, 09 21.6980 3.50 3.50
Dividend Plan
Mar 17, 06 67.080 7.50 7.50Mar 07, 07 60.360 7.50 7.50
RReeccoorrdd CCuumm DDiivv DDiivviiddeenndd PPeerr uunniitt ((RRss..)) FFoorr DDaattee NNAAVV ((RRss..)) IInnddiivviidduuaallss && HHUUFF OOtthheerrss
RReeccoorrdd CCuumm DDiivv DDiivviiddeenndd PPeerr uunniitt ((RRss..)) FFoorr DDaattee NNAAVV ((RRss..)) IInnddiivviidduuaallss && HHUUFF OOtthheerrss
HDFC TaxSaver (Past 3 years)
(An open-ended equity linked savings scheme with a lock-in period of 3 years)
Mar 07, 08 66.092 8.00 8.00Mar 05, 09 31.155 5.00 5.00
Dividend Plan
HDFC Arbitrage Fund
RReettaaiill OOppttiioonn
Jan 27, 09 10.0430 0.0430 0.0430
Feb 25, 09 10.0590 0.0590 0.0590
WWhhoolleessaallee OOppttiioonn
Jan 27, 09 10.0450 0.0450 0.0450
Feb 25, 09 10.0610 0.0610 0.0610
RReettaaiill OOppttiioonn
Sep 25, 08 10.1610 0.1610 0.1610
Dec 26, 08 10.2890 0.2890 0.2890
Mar 25, 09 10.1120 0.1120 0.1120
WWhhoolleessaallee OOppttiioonn
Sep 25, 08 10.1680 0.1680 0.1680
Dec 26, 08 10.2950 0.2950 0.2950
Mar 25, 09 10.1190 0.1190 0.1190
RReeccoorrdd CCuumm DDiivv DDiivviiddeenndd PPeerr uunniitt ((RRee..)) FFoorr DDaattee NNAAVV ((RRss..)) IInnddiivviidduuaallss && HHUUFF OOtthheerrss
RReeccoorrdd CCuumm DDiivv DDiivviiddeenndd PPeerr uunniitt ((RRee..)) FFoorr DDaattee NNAAVV ((RRss..)) IInnddiivviidduuaallss && HHUUFF OOtthheerrss
Monthly (Dividend Option) (Past 3 months) Quarterly (Dividend Option) (Past 3 quarters)
hdfc-div.qxd 5/7/2009 8:23 PM Page 1

Dividend History ^
HDFC Cash Management Fund
RReettaaiill PPllaann
Nov 03, 08 10.0312 0.0150 0.0140
Nov 10, 08 10.0311 0.0149 0.0139
Nov 17, 08 10.0309 0.0148 0.0138
Nov 24, 08 10.0309 0.0148 0.0138
Dec 01, 08 10.0303 0.0142 0.0132
Dec 08, 08 10.0300 0.0141 0.0131
Dec 15, 08 10.0294 0.0135 0.0125
Dec 22, 08 10.0301 0.0141 0.0131
Dec 29, 08 10.0294 0.0135 0.0125
Jan 05, 09 10.0301 0.0132 0.0123
Jan 12, 09 10.0299 0.0116 0.0108
Jan 19, 09 10.0310 0.0145 0.0135
Jan 27, 09 10.0301 0.0136 0.0126
Feb 02, 09 10.0264 0.0100 0.0093
Feb 09, 09 10.0283 0.0117 0.0109
Feb 16, 09 10.0283 0.0117 0.0109
Feb 24, 09 10.0302 0.0129 0.0120
Mar 02, 09 10.0268 0.0102 0.0095
Mar 09, 09 10.0279 0.0113 0.0105
Mar 16, 09 10.0269 0.0105 0.0097
Mar 23, 09 10.0268 0.0094 0.0088
Mar 30, 09 10.0298 0.0121 0.0112
Apr 06, 09 10.0301 0.0123 0.0115
Apr 13, 09 10.0265 0.0092 0.0085
Apr 20, 09 10.0263 0.0090 0.0084
Apr 27, 09 10.0263 0.0090 0.0084
WWhhoolleessaallee PPllaann
Nov 03, 08 10.0320 0.0157 0.0147
Nov 10, 08 10.0318 0.0156 0.0145
Nov 17, 08 10.0316 0.0155 0.0144
Nov 24, 08 10.0316 0.0155 0.0144
Dec 01, 08 10.0310 0.0149 0.0138
Dec 08, 08 10.0308 0.0147 0.0137
Dec 15, 08 10.0302 0.0141 0.0132
Dec 22, 08 10.0309 0.0148 0.0137
Dec 29, 08 10.0302 0.0142 0.0132
Jan 05, 09 10.0308 0.0147 0.0137
Jan 12, 09 10.0295 0.0136 0.0127
Jan 19, 09 10.0290 0.0131 0.0122
Jan 27, 09 10.0306 0.0145 0.0135
Feb 02, 09 10.0264 0.0100 0.0093
Feb 09, 09 10.0292 0.0124 0.0116
Feb 16, 09 10.0291 0.0123 0.0115
Feb 24, 09 10.0311 0.0141 0.0131
Mar 02, 09 10.0270 0.0105 0.0098
Mar 09, 09 10.0285 0.0118 0.0110
Mar 16, 09 10.0277 0.0111 0.0104
Mar 23, 09 10.0275 0.0101 0.0094
Mar 30, 09 10.0305 0.0127 0.0119
Apr 06, 09 10.0308 0.0130 0.0121
Apr 13, 09 10.0272 0.0098 0.0092
Apr 20, 09 10.0270 0.0096 0.0090
Apr 27, 09 10.0271 0.0097 0.0090
RReeccoorrdd CCuumm DDiivv DDiivviiddeenndd PPeerr uunniitt ((RRee..)) FFoorr DDaattee NNAAVV ((RRss..)) IInnddiivviidduuaallss && HHUUFF OOtthheerrss
RReeccoorrdd CCuumm DDiivv DDiivviiddeenndd PPeerr uunniitt ((RRee..)) FFoorr DDaattee NNAAVV ((RRss..)) IInnddiivviidduuaallss && HHUUFF OOtthheerrss
WWeeeekkllyy DDiivviiddeenndd OOppttiioonn (Past 6 months)
MMoonntthhllyy DDiivviiddeenndd OOppttiioonn (Past 3 months)
^̂ PPaasstt ppeerrffoorrmmaannccee mmaayy oorr mmaayy nnoott bbee ssuussttaaiinneedd iinn tthhee ffuuttuurree.. All dividends are on face value of Rs.10 per Unit. After payment of the dividend, the per Unit NAV will fall tothe extent of the payout and statutory levy.
Treasury Advantage (Daily Dividend Option) (Past 6 months)
HDFC Cash Management FundSavings Plan (Daily Dividend Reinvestment Option) (Past 6 months)
HDFC Cash Management Fund (Call Plan)
MMoonntthh RReeccoorrdd DDaattee EExx--ddiivviiddeenndd NNAAVV ppeerr UUnniitt ((RRss..)) AAggggrreeggaattee DDiivviiddeenndd PPeerr UUnniitt ((RRee..)) ffoorr tthhee mmoonntthh IInnddiivviidduuaallss && HHUUFF OOtthheerrss
WWeeeekkllyy DDiivviiddeenndd OOppttiioonn (Past 6 months)
Nov 07, 08 10.6430 0.0143 0.0143
Nov 14, 08 10.6431 0.0143 0.0143
Nov 21, 08 10.6426 0.0140 0.0140
Nov 28, 08 10.6417 0.0133 0.0133
Dec 05, 08 10.6421 0.0136 0.0136
Dec 12, 08 10.6411 0.0128 0.0128
Dec 19, 08 10.6412 0.0128 0.0128
Dec 26, 08 10.6417 0.0132 0.0132
Jan 02, 09 10.6415 0.0131 0.0131
Jan 09, 09 10.6412 0.0129 0.0129
Jan 16, 09 10.6398 0.0118 0.0118
Jan 23, 09 10.6401 0.0120 0.0120
Jan 30, 09 10.6398 0.0118 0.0118
Feb 06, 09 10.6398 0.0117 0.0117
Feb 13, 09 10.6397 0.0117 0.0117
Feb 24, 09 10.6476 0.0179 0.0179
Feb 27, 09 10.6308 0.0047 0.0047
Mar 06, 09 10.6387 0.0109 0.0109
Mar 13, 09 10.6384 0.0107 0.0107
Mar 20, 09 10.6381 0.0104 0.0104
Mar 30, 09 10.6435 0.0147 0.0147
Apr 06, 09 10.6392 0.0113 0.0113
Apr 13, 09 10.6359 0.0087 0.0087
Apr 17, 09 10.6312 0.0051 0.0051
Apr 24, 09 10.6362 0.0089 0.0089
RReeccoorrdd CCuumm DDiivv DDiivviiddeenndd PPeerr uunniitt ((RRee....)) FFoorr DDaattee NNAAVV ((RRss..)) IInnddiivviidduuaallss && HHUUFF OOtthheerrss
RReeccoorrdd CCuumm DDiivv DDiivviiddeenndd PPeerr uunniitt ((RRee..)) FFoorr DDaattee NNAAVV ((RRss..)) IInnddiivviidduuaallss && HHUUFF OOtthheerrss
November 2008 Daily 10.6364 0.0575 0.0575December 2008 Daily 10.6364 0.0578 0.0578January 2009 Daily 10.6364 0.0539 0.0539February 2009 Daily 10.6364 0.0458 0.0458March 2009 Daily 10.6364 0.0472 0.0472April 2009 Daily 10.6364 0.0391 0.0391
MMoonntthh RReeccoorrdd DDaattee EExx--ddiivviiddeenndd NNAAVV ppeerr UUnniitt ((RRss..)) AAggggrreeggaattee DDiivviiddeenndd PPeerr UUnniitt ((RRee..)) ffoorr tthhee mmoonntthh IInnddiivviidduuaallss && HHUUFF OOtthheerrss
RReettaaiill OOppttiioonn
November 2008 Daily 10.0315 0.0588 0.0547December 2008 Daily 10.0315 0.0611 0.0570January 2009 Daily 10.0315 0.0576 0.0538February 2009 Daily 10.0315 0.0467 0.0437March 2009 Daily 10.0315 0.0913 0.0849April 2009 Daily 10.0315 0.0364 0.0339
WWhhoolleessaallee OOppttiioonn
November 2008 Daily 10.0315 0.0617 0.0571December 2008 Daily 10.0315 0.0637 0.0598January 2009 Daily 10.0315 0.0608 0.0565February 2009 Daily 10.0315 0.0497 0.0460March 2009 Daily 10.0315 0.0486 0.0453April 2009 Daily 10.0315 0.0392 0.0362
November 08 Daily 10.4266 0.0415 0.0415December 08 Daily 10.4266 0.0383 0.0383January 09 Daily 10.4266 0.0269 0.0269February 09 Daily 10.4266 0.0231 0.0231March 09 Daily 10.4266 0.0316 0.0316April 09 Daily 10.4266 0.0308 0.0308
MMoonntthh RReeccoorrdd DDaattee EExx--ddiivviiddeenndd NNAAVV ppeerr UUnniitt ((RRss..)) AAggggrreeggaattee DDiivviiddeenndd PPeerr UUnniitt ((RRee..)) ffoorr tthhee mmoonntthh IInnddiivviidduuaallss && HHUUFF OOtthheerrss
RReeccoorrdd CCuumm DDiivv DDiivviiddeenndd PPeerr uunniitt ((RRee..)) FFoorr
DDaattee NNAAVV ((RRss..)) IInnddiivviidduuaallss && HHUUFF OOtthheerrss
RReettaaiill OOppttiioonn
February 24, 09 10.0738 0.0384 0.0357
March 30, 09 10.0918 0.0454 0.0422
April 27, 09 10.0853 0.0397 0.0369
WWhhoolleessaallee OOppttiioonn
February 24, 09 10.0870 0.0411 0.0383
March 30, 09 10.1056 0.0487 0.0453
April 27, 09 10.0985 0.0425 0.0396
DDaaiillyy DDiivviiddeenndd RReeiinnvveessttmmeenntt OOppttiioonn (Past 6 months)
Feb 24, 09 10.3185 0.0432 0.0432Mar 30, 09 10.3245 0.0479 0.0479Apr 27, 09 10.3080 0.0351 0.0351
RReeccoorrdd DDaattee CCuumm DDiivviiddeenndd NNAAVV ((RRss..)) DDiivviiddeenndd PPeerr uunniitt ((RRee..)) FFoorr IInnddiivviidduuaallss && HHUUFF OOtthheerrss
Monthly Dividend Option (Past 3 months)
HDFC Liquid Fund
November 2008 Daily 10.1982 0.0534 0.0534December 2008 Daily 10.1982 0.0537 0.0537January 2009 Daily 10.1982 0.0509 0.0509February 2009 Daily 10.1982 0.0427 0.0427March 2009 Daily 10.1982 0.0435 0.0435April 2009 Daily 10.1982 0.0363 0.0363
MMoonntthh RReeccoorrdd DDaattee EExx--ddiivviiddeenndd NNAAVV ppeerr UUnniitt ((RRss..)) AAggggrreeggaattee DDiivviiddeenndd PPeerr UUnniitt ((RRee..)) ffoorr tthhee mmoonntthh IInnddiivviidduuaallss && HHUUFF OOtthheerrss
(Daily Dividend Reinvestment Option) (Past 6 months)
HDFC Liquid Fund
November 2008 Daily 12.2598 0.0661 0.0661December 2008 Daily 12.2598 0.0667 0.0667January 2009 Daily 12.2598 0.0632 0.0632February 2009 Daily 12.2598 0.0532 0.0532March 2009 Daily 12.2598 0.0539 0.0539April 2009 Daily 12.2598 0.0455 0.0455
MMoonntthh RReeccoorrdd DDaattee EExx--ddiivviiddeenndd NNAAVV ppeerr UUnniitt ((RRss..)) AAggggrreeggaattee DDiivviiddeenndd PPeerr UUnniitt ((RRee..)) ffoorr tthhee mmoonntthh IInnddiivviidduuaallss && HHUUFF OOtthheerrss
(Daily Dividend Option) (Past 6 months)
HDFC Liquid Fund - Premium Plan
28 April 2009 Intouchmutually
hdfc-div.qxd 5/7/2009 8:23 PM Page 2
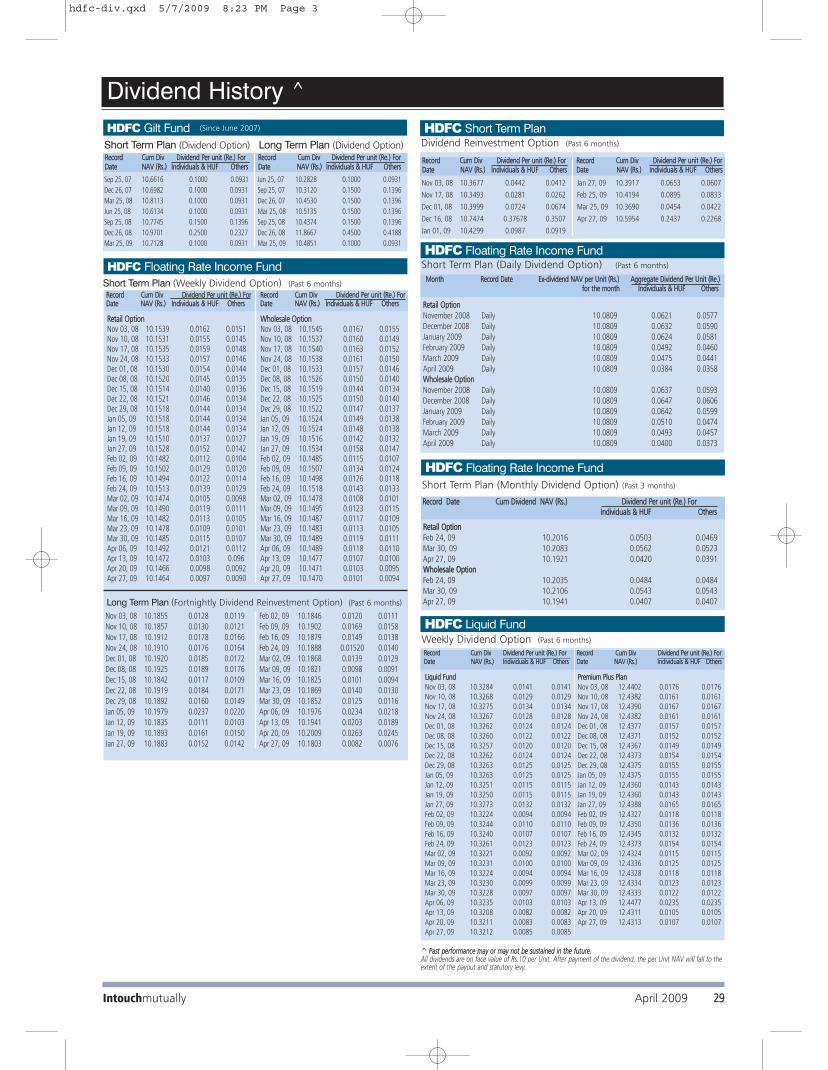
Dividend History ^
^̂ PPaasstt ppeerrffoorrmmaannccee mmaayy oorr mmaayy nnoott bbee ssuussttaaiinneedd iinn tthhee ffuuttuurree.. All dividends are on face value of Rs.10 per Unit. After payment of the dividend, the per Unit NAV will fall to theextent of the payout and statutory levy.
HDFC Liquid Fund
Weekly Dividend Option (Past 6 months)
RReeccoorrdd CCuumm DDiivv DDiivviiddeenndd PPeerr uunniitt ((RRee..)) FFoorr RReeccoorrdd CCuumm DDiivv DDiivviiddeenndd PPeerr uunniitt ((RRee..)) FFoorr DDaattee NNAAVV ((RRss..)) IInnddiivviidduuaallss && HHUUFF OOtthheerrss DDaattee NNAAVV ((RRss..)) IInnddiivviidduuaallss && HHUUFF OOtthheerrss
LLiiqquuiidd FFuunndd PPrreemmiiuumm PPlluuss PPllaann
Nov 03, 08 10.3284 0.0141 0.0141 Nov 03, 08 12.4402 0.0176 0.0176
Nov 10, 08 10.3268 0.0129 0.0129 Nov 10, 08 12.4382 0.0161 0.0161
Nov 17, 08 10.3275 0.0134 0.0134 Nov 17, 08 12.4390 0.0167 0.0167
Nov 24, 08 10.3267 0.0128 0.0128 Nov 24, 08 12.4382 0.0161 0.0161
Dec 01, 08 10.3262 0.0124 0.0124 Dec 01, 08 12.4377 0.0157 0.0157
Dec 08, 08 10.3260 0.0122 0.0122 Dec 08, 08 12.4371 0.0152 0.0152
Dec 15, 08 10.3257 0.0120 0.0120 Dec 15, 08 12.4367 0.0149 0.0149
Dec 22, 08 10.3262 0.0124 0.0124 Dec 22, 08 12.4373 0.0154 0.0154
Dec 29, 08 10.3263 0.0125 0.0125 Dec 29, 08 12.4375 0.0155 0.0155
Jan 05, 09 10.3263 0.0125 0.0125 Jan 05, 09 12.4375 0.0155 0.0155
Jan 12, 09 10.3251 0.0115 0.0115 Jan 12, 09 12.4360 0.0143 0.0143
Jan 19, 09 10.3250 0.0115 0.0115 Jan 19, 09 12.4360 0.0143 0.0143
Jan 27, 09 10.3273 0.0132 0.0132 Jan 27, 09 12.4388 0.0165 0.0165
Feb 02, 09 10.3224 0.0094 0.0094 Feb 02, 09 12.4327 0.0118 0.0118
Feb 09, 09 10.3244 0.0110 0.0110 Feb 09, 09 12.4350 0.0136 0.0136
Feb 16, 09 10.3240 0.0107 0.0107 Feb 16, 09 12.4345 0.0132 0.0132
Feb 24, 09 10.3261 0.0123 0.0123 Feb 24, 09 12.4373 0.0154 0.0154
Mar 02, 09 10.3221 0.0092 0.0092 Mar 02, 09 12.4324 0.0115 0.0115
Mar 09, 09 10.3231 0.0100 0.0100 Mar 09, 09 12.4336 0.0125 0.0125
Mar 16, 09 10.3224 0.0094 0.0094 Mar 16, 09 12.4328 0.0118 0.0118
Mar 23, 09 10.3230 0.0099 0.0099 Mar 23, 09 12.4334 0.0123 0.0123
Mar 30, 09 10.3228 0.0097 0.0097 Mar 30, 09 12.4333 0.0122 0.0122
Apr 06, 09 10.3235 0.0103 0.0103 Apr 13, 09 12.4477 0.0235 0.0235
Apr 13, 09 10.3208 0.0082 0.0082 Apr 20, 09 12.4311 0.0105 0.0105
Apr 20, 09 10.3211 0.0083 0.0083 Apr 27, 09 12.4313 0.0107 0.0107
Apr 27, 09 10.3212 0.0085 0.0085
RReettaaiill OOppttiioonnNov 03, 08 10.1539 0.0162 0.0151Nov 10, 08 10.1531 0.0155 0.0145Nov 17, 08 10.1535 0.0159 0.0148Nov 24, 08 10.1533 0.0157 0.0146Dec 01, 08 10.1530 0.0154 0.0144Dec 08, 08 10.1520 0.0145 0.0135Dec 15, 08 10.1514 0.0140 0.0136Dec 22, 08 10.1521 0.0146 0.0134Dec 29, 08 10.1518 0.0144 0.0134Jan 05, 09 10.1518 0.0144 0.0134Jan 12, 09 10.1518 0.0144 0.0134Jan 19, 09 10.1510 0.0137 0.0127Jan 27, 09 10.1528 0.0152 0.0142Feb 02, 09 10.1482 0.0112 0.0104Feb 09, 09 10.1502 0.0129 0.0120Feb 16, 09 10.1494 0.0122 0.0114Feb 24, 09 10.1513 0.0139 0.0129Mar 02, 09 10.1474 0.0105 0.0098Mar 09, 09 10.1490 0.0119 0.0111Mar 16, 09 10.1482 0.0113 0.0105Mar 23, 09 10.1478 0.0109 0.0101Mar 30, 09 10.1485 0.0115 0.0107Apr 06, 09 10.1492 0.0121 0.0112Apr 13, 09 10.1472 0.0103 0.096Apr 20, 09 10.1466 0.0098 0.0092Apr 27, 09 10.1464 0.0097 0.0090
WWhhoolleessaallee OOppttiioonnNov 03, 08 10.1545 0.0167 0.0155Nov 10, 08 10.1537 0.0160 0.0149Nov 17, 08 10.1540 0.0163 0.0152Nov 24, 08 10.1538 0.0161 0.0150Dec 01, 08 10.1533 0.0157 0.0146Dec 08, 08 10.1526 0.0150 0.0140Dec 15, 08 10.1519 0.0144 0.0134Dec 22, 08 10.1525 0.0150 0.0140Dec 29, 08 10.1522 0.0147 0.0137Jan 05, 09 10.1524 0.0149 0.0138Jan 12, 09 10.1524 0.0148 0.0138Jan 19, 09 10.1516 0.0142 0.0132Jan 27, 09 10.1534 0.0158 0.0147Feb 02, 09 10.1485 0.0115 0.0107Feb 09, 09 10.1507 0.0134 0.0124Feb 16, 09 10.1498 0.0126 0.0118Feb 24, 09 10.1518 0.0143 0.0133Mar 02, 09 10.1478 0.0108 0.0101Mar 09, 09 10.1495 0.0123 0.0115Mar 16, 09 10.1487 0.0117 0.0109Mar 23, 09 10.1483 0.0113 0.0105Mar 30, 09 10.1489 0.0119 0.0111Apr 06, 09 10.1489 0.0118 0.0110Apr 13, 09 10.1477 0.0107 0.0100Apr 20, 09 10.1471 0.0103 0.0095Apr 27, 09 10.1470 0.0101 0.0094
RReeccoorrdd CCuumm DDiivv DDiivviiddeenndd PPeerr uunniitt ((RRee..)) FFoorr DDaattee NNAAVV ((RRss..)) IInnddiivviidduuaallss && HHUUFF OOtthheerrss
RReeccoorrdd CCuumm DDiivv DDiivviiddeenndd PPeerr uunniitt ((RRee..)) FFoorr DDaattee NNAAVV ((RRss..)) IInnddiivviidduuaallss && HHUUFF OOtthheerrss
Short Term Plan (Weekly Dividend Option) (Past 6 months)
HDFC Floating Rate Income Fund
Nov 03, 08 10.1855 0.0128 0.0119
Nov 10, 08 10.1857 0.0130 0.0121
Nov 17, 08 10.1912 0.0178 0.0166
Nov 24, 08 10.1910 0.0176 0.0164
Dec 01, 08 10.1920 0.0185 0.0172
Dec 08, 08 10.1925 0.0189 0.0176
Dec 15, 08 10.1842 0.0117 0.0109
Dec 22, 08 10.1919 0.0184 0.0171
Dec 29, 08 10.1892 0.0160 0.0149
Jan 05, 09 10.1979 0.0237 0.0220
Jan 12, 09 10.1835 0.0111 0.0103
Jan 19, 09 10.1893 0.0161 0.0150
Jan 27, 09 10.1883 0.0152 0.0142
Feb 02, 09 10.1846 0.0120 0.0111
Feb 09, 09 10.1902 0.0169 0.0158
Feb 16, 09 10.1879 0.0149 0.0138
Feb 24, 09 10.1888 0.01520 0.0140
Mar 02, 09 10.1868 0.0139 0.0129
Mar 09, 09 10.1821 0.0098 0.0091
Mar 16, 09 10.1825 0.0101 0.0094
Mar 23, 09 10.1869 0.0140 0.0130
Mar 30, 09 10.1852 0.0125 0.0116
Apr 06, 09 10.1976 0.0234 0.0218
Apr 13, 09 10.1941 0.0203 0.0189
Apr 20, 09 10.2009 0.0263 0.0245
Apr 27, 09 10.1803 0.0082 0.0076
Long Term Plan (Fortnightly Dividend Reinvestment Option) (Past 6 months)
RReettaaiill OOppttiioonn
Feb 24, 09 10.2016 0.0503 0.0469
Mar 30, 09 10.2083 0.0562 0.0523
Apr 27, 09 10.1921 0.0420 0.0391
WWhhoolleessaallee OOppttiioonn
Feb 24, 09 10.2035 0.0484 0.0484
Mar 30, 09 10.2106 0.0543 0.0543
Apr 27, 09 10.1941 0.0407 0.0407
RReeccoorrdd DDaattee CCuumm DDiivviiddeenndd NNAAVV ((RRss..)) DDiivviiddeenndd PPeerr uunniitt ((RRee..)) FFoorr IInnddiivviidduuaallss && HHUUFF OOtthheerrss
Short Term Plan (Monthly Dividend Option) (Past 3 months)
HDFC Floating Rate Income Fund
RReettaaiill OOppttiioonn
November 2008 Daily 10.0809 0.0621 0.0577December 2008 Daily 10.0809 0.0632 0.0590January 2009 Daily 10.0809 0.0624 0.0581February 2009 Daily 10.0809 0.0492 0.0460March 2009 Daily 10.0809 0.0475 0.0441April 2009 Daily 10.0809 0.0384 0.0358WWhhoolleessaallee OOppttiioonn
November 2008 Daily 10.0809 0.0637 0.0593December 2008 Daily 10.0809 0.0647 0.0606January 2009 Daily 10.0809 0.0642 0.0599February 2009 Daily 10.0809 0.0510 0.0474March 2009 Daily 10.0809 0.0493 0.0457April 2009 Daily 10.0809 0.0400 0.0373
MMoonntthh RReeccoorrdd DDaattee EExx--ddiivviiddeenndd NNAAVV ppeerr UUnniitt ((RRss..)) AAggggrreeggaattee DDiivviiddeenndd PPeerr UUnniitt ((RRee..)) ffoorr tthhee mmoonntthh IInnddiivviidduuaallss && HHUUFF OOtthheerrss
Short Term Plan (Daily Dividend Option) (Past 6 months)
HDFC Floating Rate Income Fund
HDFC Short Term PlanDividend Reinvestment Option (Past 6 months)
RReeccoorrdd CCuumm DDiivv DDiivviiddeenndd PPeerr uunniitt ((RRee..)) FFoorr DDaattee NNAAVV ((RRss..)) IInnddiivviidduuaallss && HHUUFF OOtthheerrss
RReeccoorrdd CCuumm DDiivv DDiivviiddeenndd PPeerr uunniitt ((RRee..)) FFoorr DDaattee NNAAVV ((RRss..)) IInnddiivviidduuaallss && HHUUFF OOtthheerrss
Nov 03, 08 10.3677 0.0442 0.0412
Nov 17, 08 10.3493 0.0281 0.0262
Dec 01, 08 10.3999 0.0724 0.0674
Dec 16, 08 10.7474 0.37678 0.3507
Jan 01, 09 10.4299 0.0987 0.0919
Jan 27, 09 10.3917 0.0653 0.0607
Feb 25, 09 10.4194 0.0895 0.0833
Mar 25, 09 10.3690 0.0454 0.0422
Apr 27, 09 10.5954 0.2437 0.2268
HDFC Gilt Fund (Since June 2007)
Sep 25, 07 10.6616 0.1000 0.0931
Dec 26, 07 10.6982 0.1000 0.0931
Mar 25, 08 10.8113 0.1000 0.0931
Jun 25, 08 10.6134 0.1000 0.0931
Sep 25, 08 10.7745 0.1500 0.1396
Dec 26, 08 10.9701 0.2500 0.2327
Mar 25, 09 10.7128 0.1000 0.0931
Jun 25, 07 10.2828 0.1000 0.0931
Sep 25, 07 10.3120 0.1500 0.1396
Dec 26, 07 10.4530 0.1500 0.1396
Mar 25, 08 10.5135 0.1500 0.1396
Sep 25, 08 10.4374 0.1500 0.1396
Dec 26, 08 11.8667 0.4500 0.4188
Mar 25, 09 10.4851 0.1000 0.0931
RReeccoorrdd CCuumm DDiivv DDiivviiddeenndd PPeerr uunniitt ((RRee..)) FFoorr DDaattee NNAAVV ((RRss..)) IInnddiivviidduuaallss && HHUUFF OOtthheerrss
RReeccoorrdd CCuumm DDiivv DDiivviiddeenndd PPeerr uunniitt ((RRee..)) FFoorr DDaattee NNAAVV ((RRss..)) IInnddiivviidduuaallss && HHUUFF OOtthheerrss
Short Term Plan (Dividend Option) Long Term Plan (Dividend Option)
April 2009 2299Intouchmutually
hdfc-div.qxd 5/7/2009 8:23 PM Page 3

Methodology
Value Research Fund Ratings are a composite measure of historical risk-adjusted returns. In the case of equity and hybrid funds this rating is based on the weighted
average monthly returns for the last 3 and 5-year periods. In the case of debt funds this rating is based on the weighted average weekly returns for the last 18 months and
3-year periods and in case of short-term debt funds - weekly returns for the last 18 months. These ratings do not take into consideration any entry or exit load.
Five-stars indicate that a fund is in the top 10% of its category in terms of historical risk-adjusted returns. Four stars indicate that a fund is in the next 22.5%, middle 35%
receive three stars, the next 222.5% are assigned two stars while the bottom 10% receive one star. The number of schemes in each category is mentioned along side the
categories name. Equity Diversified (142), Equity : Index (17), Equity Tax Planning (23), Hybrid Equity Oriented (25), Hybrid: Monthly Income (32), Debt: Medium-term (40),
Gilt: Medium and Long-term (28), Gilt: Short-term (13), Debt: Ultra Short-term (40), Debt: Ultra Short-term Institutional (46), Debt: Short-term (15), Debt: Floating Rate
Short-term (15), Debt: Floating Rate Long-term (10), Hybrid: Debt-oriented (16), Debt: Liquid Plus: (24), Debt: Liquid Plus Institutional:(23). These Fund Ratings are as on
April 30, 2009.
The Value Research Ratings are published in Monthly Mutual Fund Performance Report and Mutual Fund Insight. The Ratings are subject to change every month. The Rating
is based on primary data provided by respective funds, Value Research does not guarantee the accuracy.
Value Research Ratings
Disclaimer:
The information contained herein should not be altered in any way, transmitted to, copied or distributed, in part or in whole, to any other person or to the media or repro-
duced in any form, without prior written consent of HDFC Asset Management Company Limited (HDFC AMC) or the relevant owner of the intellectual property, as the case may
be. All Intellectual property and intellectual property rights belong to the relevant owner of the intellectual property, and “Intouch Mutually” is a trademark of HDFC AMC.
Any information herein contained does not constitute and shall be deemed not to constitute an advice, an offer to sell/ purchase or as an invitation or solicitation to do so
for any securities of any entity, and further, HDFC AMC / its subsidiaries / affiliates / sponsors / trustee (HDFC AMC Group) or their officers, employees, personnel, directors may
be associated in a commercial, professional or personal capacity or may have a commercial interest including as proprietary traders in or with the securities and/ or companies
or issues or matters as contained in this publication and such commercial capacity or interest whether or not differing with or conflicting with this publication, shall not make or
render (HDFC AMC Group) liable in any manner whatsoever & (HDFC AMC Group) or any of their officers, employees, personnel, directors shall not be liable for any loss, dam-
age, liability whatsoever for any direct or indirect loss arising from the use or access of any information that may be displayed in this publication from time to time. Recipients
of the information contained herein should exercise due care and caution and read the offer documents (including if necessary, obtaining the advice of tax / legal / accounting /
financial / other professionals) prior to taking of any decision, acting or omitting to act, on the basis of the information contained herein. The printing and mailing cost of this
newsletter is charged to the respective schemes subject to Securities & Exchange Board of India (Mutual Funds) Regulations, 1996.
Editorial opinions expressed in Intouch Mutually (Page no. 3) are not necessarily those of HDFC AMC Group, or any of their officers, employees, personnel, directors and
HDFC AMC Group and their officers, employees, personnel, directors do not accept responsibility for the editorial content. HDFC AMC Group or any of their officers, employees,
personnel, directors make no representation as to the accuracy, completeness or reliability of the editorial content and hereby disclaim any liability with regard to the same.
HDFC Equity Fund, HDFC Capital Builder Fund, HDFC TaxSaver and HDFC Premier Multi-Cap Fund, which are benchmarked to S&P CNX 500 Index are not sponsored, endorsed,
sold or promoted by India Index Services & Products Limited (IISL). IISL is not responsible for any errors or omissions or the results obtained from the use of such index and in
no event shall IISL have any liability to any party for any damages of whatsoever nature (including lost profits) resulted to such party due to purchase or sale or otherwise of
such product benchmarked to such index.
# S&P CNX 500
Intouchmutually30 April 2009
hdfc-bk1.qxd 5/7/2009 9:12 PM Page 1

WANT TO HAVE THE LATEST INFORMATION ABOUT US ?
INVESTOR SERVICE CENTRES (ISCs)
Toll-free number : 1800 233 6767
Dedicated number : 60006767
AANNDDHHRRAA PPRRAADDEESSHHHDFC AMC Ltd., 6-3-883/7, 2nd Floor, Saphire Square, Somajiguda, HHyyddeerraabbaadd -- 500 282.Tel: 040 - 2341 7401-05, Fax: 040 - 2341 7407.HDFC AMC Ltd., 2nd Floor, Centurion Bank Complex, Near Benz Circle, M. G. Road, VViijjaayyaawwaaddaa - 520 010. Tel. No: (0866)-3988029.HDFC AMC Ltd., Ground Floor, Saigopal Arcade, Opp Waltair Club, Waltair Main Road, Siripuram,VViissaakkhhaappaattnnaamm - 530 003. Tel: 0891- 276 9636, Fax: 0891 - 255 0411.AASSSSAAMMHDFC AMC Ltd., Premises- 1C, 1st Floor, Ganpati Enclave, G.S.Road, GGuuwwaahhaattii -781 007. Tel No.: (0361)-2464759/60 Fax No.: (0361)-2464758. BBIIHHAARRHDFC AMC Ltd., Ishwari Complex, 1st Floor, Dr. Rajendra Prasad Road, BBhhaaggaallppuurr - 812 002. Tel No: (0641) 2300 390 Fax No: (0641) 2300391.HDFC AMC Ltd., C/o. Hera Enclave (adjacent to Sahara Unique Showroom), Mezzanine Floor, New Dak Bungalow Road,PPaattnnaa - 800 001. Tel: 0612 - 2230540. 3201439, 2200747, 9931770771 Fax: 0612 - 2200747.DDEELLHHIIHDFC AMC Ltd., 4th Floor, Mohan Dev Bldg., 13, Tolstoy Marg, Connaught Place, NNeeww DDeellhhii - 110 001. Tel: 011 - 6632 4000. Fax: 011 - 2335 1317. GGOOAAHDFC AMC Ltd., Ground Floor, G3 & G4 Jivottam, Minguel Miranda Road, Off. Abade Faria Road, MMaarrggaaoo - 403 601. Tel.No-0832 - 2737410 / 2737411,Fax No-0832-2736477.HDFC AMC Ltd., S1, Second Floor, Above Axis Bank, Edcon Centre, Angod, MMaappuussaa - 403 507, Bardez.Tel: 0832 - 2253 460 / 461, Fax: 0832 - 2253 465.HDFC AMC Ltd., A3, First Floor, Krishna Building, Opp. Education Dept, Behind Susheela Building, G.P. Road, PPaannaajjii -- 403 001. Tel: 0832 - 242 5609, 242 5610, Fax: 0832 - 242 5614.HDFC AMC Ltd., 6, Ground Floor, Pereira Chambers, Padre Jose Vaz Road, VVaassccoo - 403 802, Mormugao.Tel: 0832 - 2513 402 / 406, Fax: 0832 - 2513 448.GGUUJJAARRAATTHDFC AMC Ltd., 2nd Floor, Megha House, Besides Gruh House, Mithakhali Six Roads, AAhhmmeeddaabbaadd - 380 009. Tel: (B) 079 - 4005 0055/66 Telefax: 079 - 4005 0506.HDFC AMC Ltd., Maruti Sharanam, No.117, 1st Floor, Anand-Vidhyanagar Road, Opposite Nandbhumi Party Plot,AAnnaanndd - 388 001. Tel : (02692) - 398200 Fax : (02692) - 398222.HDFC AMC Ltd., 2nd Floor, Gangotri Plaza, Opposite Daxinamurty School, Waghawadi Road, BBhhaavvnnaaggaarr - 364 001. Tel : (0278) - 3988029 Fax : (0278) - 3984039.HDFC AMC Ltd., 2nd Floor, Keshav Complex, P N Marg, Opposite Dhanvantry, JJaammnnaaggaarr - 361 001. Tel : (0288) - 3988029 Fax : (0288) - 3982426.HDFC AMC Ltd., 2nd Floor, Shiv Darshan,Dr Radha Krishnan Road, 5, Jagnath Plot Corner, RRaajjkkoott - 360 001.Tel: 0281 552 4881/2.HDFC AMC Ltd., U1 - U3, Jolly Plaza, Opp Athwa Gate Police Station, Athwa Gate, SSuurraatt -- 395 001. Tel: 0261 - 246 0082 / 83. Fax: 0261 - 246 0091. HDFC AMC Ltd., Upper Ground Floor, Gokulesh, R C Dutt Road, VVaaddooddaarraa - 390 007. Tel: 0265 6621110, 6621120, Fax 0265 6621150.HDFC AMC Ltd., 5-B, 2nd Floor, Sapphire Building, Daulatnagar, Chala-Vapi Road, VVaappii - 396 191. Tel No: (0260) 3983900 Fax : (0260) 3983908.HHAARRYYAANNAAHDFC AMC. Ltd., TA - 12A, 15-18, Third Floor, Crown Plaza, Sector 15A, Mathura Road, FFaarriiddaabbaadd - 121001.Tel : (0129) 2221 338 / 339 / 341 / 342 / 343 Fax : (0129) 2221 340. HDFC AMC Ltd., Premises 102, 1st Floor, Vipul Agora, MG Road, GGuurrggaaoonn - 122 002. Tel No: (0124) 2560 450 - 54 Fax : (0124) 2560455. HDFC AMC Ltd., 1175 B Royal 1, 1st Floor, Adjoining Gurudawara, G.T Road, PPaanniippaatt -- 113322 110033..Tel: (0180) 3985400/ 01 Fax: (0180) 3985403. JJAAMMMMUU && KKAASSHHMMIIRRHDFC AMC Ltd., Hall No-102 A/2, South Block, Bahu Plaza, Gandhi Nagar, JJaammmmuu - 180 012. Tel No.: (0191)-2477911/12/13 (0191) 2474297/98/99. JJHHAARRKKHHAANNDDHDFC AMC Ltd., Vardhan Complex, 1st Floor, Opp. Sreeleathers Showroom, Bank More, DDhhaannbbaadd -- 826 001. Tel No.: (0326) 3205352, 2301756 Fax No.: (0326) 2300552. HDFC AMC Ltd., Gayatri Enclave, “K” Road, Bistupur, JJaammsshheeddppuurr - 831 001.Tel: 0657 - 2426730. Telefax: 0657 - 3291826. HDFC AMC Ltd., Pradhan Towers, 1st Floor, 5, Main Road, RRaanncchhii - 834 001. Tel No.: (0651) 6003358 Fax No.: (0651) 3242077. KKAARRNNAATTAAKKAAHDFC AMC Ltd., No.114, 1st Floor, Prestige Towers, 99 & 100, Residency Road, BBaannggaalloorree - 560 025. Tel: 080 - 6620 5300, Fax: 080 - 4112 5255.HDFC AMC Ltd., # 145,1st Floor, 60ft Road, 5th Block, Koramangala, BBaannggaalloorree -560034.Ph: 080-30922720, Fax: 080 - 30922728.HDFC AMC Ltd., Premises No. 4830 / B, First Floor, Dr. Ambedkar Road, Opp. Civil Medical College, BBeellggaauumm - 590 002.Tel No: (0831) 4206 915 / 916 / 918 Fax No: (0831) 4206919.HDFC AMC Ltd., # 63, Upper Ground Floor, Opposite Bellary Gas Agency, Anantapura Cross Road, BBeellllaarryy - 583 103. Tel:(08392) 276576 Fax: (08392) 276580.HDFC AMC Ltd., 190/3, 1st Floor, S.V.C. Plaza, Opposite Mothi Talkies, Gandhi Circle, DDaavvaannggeerree - 577 002. Tel No: (08192) 250 240 / 241 / 242 Fax No: (08192) 250243.HDFC AMC Ltd., Plot # 8 & 73, 3rd Floor, Rajesh Building, Super Market, Main Road, GGuullbbaarrggaa - 585 101. Tel: (08472) 399910 Fax: (08472) 271041.HDFC AMC Ltd., No. 1, First Floor, Revankar Comforts, Vivekanand Road, Court Circle, HHuubbllii - 580 029. Tel No.: (0836) 4252 294 / 95 Fax No: (0836) 4252 290.HDFC AMC Ltd., # 493,1st Floor, 4th Cross, 2nd Main, Sampige Road, Malleshwaram, BBaannggaalloorree - 560003. Ph: 080- 30922750, Fax: 080 - 30922753.HDFC AMC Ltd., UG - II, 6 & 7, Upper Ground Floor, Maximus Commercial Complex, Light House Hill Road, Opp. KMC, MMaannggaalloorree -- 575 001. Tel: 0824 428 5333 (B), 428 5337 (D) Fax: 0824 - 428 5336. HDFC AMC Ltd., No. 2918, CH 51 / 1 B, 1st Floor, Patel Mansion, Kantharaj Urs Road, Saraswathipuram, MMyyssoorree - 570 009. Tel No.: (0821) 4000 530 Fax No: (0821) 4000 535.KKEERRAALLAAHDFC AMC Ltd., 3rd Floor, City Mall, Opposite YMCA, Kannur Road, CCaalliiccuutt - 673 001.Tel: (0495) - 4099222 / 333, 3982310 Fax: (0495) - 3982330.HDFC AMC Ltd., Second Floor, Down Town Complex , Near Koyili Hospital, KKaannnnuurr - 670004. Ph: 0497-6450489, 2762045, 2762044, Fax: 0497-2762046.HDFC AMC Ltd., Ground Floor, Cinema Cum Commercial Complex, Behind Ravipuram Bus Stop, M.G. Road, KKoocchhii - 682 016. Tel: 0484 - 235 7707 / 08, 394 3058 / 059, 235 8462. Telefax: 0484 - 235 8462.HDFC AMC Ltd., 1st Floor Sofia Complex, Near Andamukkam Bus Stand, Beach Road, KKoollllaamm - 691001. Tel: 0474-2752070/71, Fax: 0474-2752073.HDFC AMC Ltd., 1st Floor, Kaniamparambil Arcade, G S Junction, Shasthri Road, KKoottttaayyaamm - 686001. Tel: 0481-2309759/60/61, Fax - 0481-2560128. HDFC AMC Ltd., 14/868, Ground Floor, Sri Krishna Complex, Coimbatore Road, PPaallgghhaatt - 678 001.Ph: 0491 2548302 / 6452188 / 6452185 / 86, Fax: 0491 2548303.HDFC AMC Ltd., 2nd Floor,E-Town Shopping, College Road, East Fort, TThhrriissssuurr - 680005.Ph: 0487-2441976, Fax: 0487-2441976.HDFC AMC Ltd., Ground Floor, Bhadra Tower, Cotton Hill Road, Vazhuthacaud, Thycaud PO,TTrriivvaannddrruumm - 695 014. Tel: 0471 - 3983 730 / 731 / 732, Fax: 0471 - 3983 738.
MMAADDHHYYAA PPRRAADDEESSHHHDFC AMC Ltd.,1st Floor, Ranjeet Tower, 8, Zone-II, M.P. Nagar, BBhhooppaall - 462 011.Tel: 0755 - 428 5385, 424 6995 Fax: 0755 - 405 8890. HDFC AMC Ltd., First Floor, Alakhnanda Towers, Shrimant Madhav Rao Scindia Marg, City Centre, GGwwaalliioorr - 474 001. Tel No.: (0751) - 4066060, 3988029 Fax No.: (0751) - 3982803. HDFC AMC Ltd., 15/3, Sterling Arcade, Race Course Rd., IInnddoorree - 452 001. Tel: 0731 - 424 5434 / 35 (B) Fax: 0731 - 424 5436.HDFC AMC Ltd., First Floor, Muthye Udyog Bhawan,1039, Wright Town, Opp. Telephone Exchange, JJaabbaallppuurr - 482 002. Tel No.: (0761) - 4049800, 3988029 Fax No.: (0761) - 4068814. MMAAHHAARRAASSHHTTRRAAHDFC AMC Ltd., 2nd Floor, Renuka Commercial Complex, Samarth Nagar, Nirala Bazar,Nageshwar Wadi Road, AAuurraannggaabbaadd - 431 001. Tel: (0240) - 3988029 Fax: (0240) - 3982068.HDFC AMC Ltd., 138, Ground Floor, Kavya Ratnavali Chowk, Omkareshwar Road, JJaallggaaoonn – 425 002. Tel. No.: (0257) 3982100/ 01 Fax : (0257) 3982114. HDFC AMC Ltd., Royal Prestige, C1/C9, 1st Floor, E - Ward, Sykes Extension, Rajarampuri Road, KKoollhhaappuurr - 416 008. Tel : (0231) - 3988029 Fax : (0231) - 3982060.HDFC AMC Ltd., Shop No. 3, Ground Floor, Abhishek Building,Irla Bridge, S.V. Road, Andheri (W), MMuummbbaaii - 400 058. Tel.: (022) 32157334/332 Fax: (022) 26241131HDFC AMC Ltd., Mistry Bhavan, 1st Flr, 122, Backbay Reclamation, Dinsha Vachha Road, Churchgate, MMuummbbaaii - 400 020. Tel: 022 - 6631 6300 Fax: 022 - 2282 1144.HDFC AMC Ltd., Shop # 7, Abhilasha Building, Punjabi Lane, Borivali (W), MMuummbbaaii - 400 092. Tel: (022) 32157268 / 342 Fax: (022) 32719222.HDFC AMC Ltd Shop No. 1 & 2, Ground Floor, Atlantic Tower, R B Mehta Road, Near Railway Station, Ghatkopar (East), MMuummbbaaii - 400 077. Tel: (022) 65253409/08/06/21 Fax: (022) 25116805. HDFC AMC Ltd., 106-110, Shriram Shyam Towers, 2nd Floor, Next to NIT Building, Kingsway, Sadar, NNaaggppuurr - 440 001. Tel: 0712 - 663 0301 / 02 / 04, Fax: 0712 - 663 0206. HDFC AMC Ltd., G-1 & G-2, Ground Floor, Suyojit Heights Opp. Rajiv Gandhi Bhavan, Sharanpur Road,NNaasshhiikk 422 002. Tel: 0253 - 661 1831/32 (B), 661 1835 (D) Fax: 0253 - 661 1836.HDFC AMC Ltd., HDFC House, 2nd Floor, Shivaji Nagar, University Road, PPuunnee - 411 005.Tel: 020 - 2552 1680 / 2552 1681, Fax: 020 - 2552 1683.HDFC AMC Ltd Shop No. 21/22, Ground Floor, Rajdeep CHS, Near Malhar Cinema, Gokhale Road, TThhaannee ((WWeesstt)) - 400 602. Tel: (022) 67124172/73/74/75/76 Fax: (022) 67124177 HDFC AMC Ltd., BSE 1, Tech Building, 109, A Wing, 1st Floor, Opposite Vashi railway station, Sector 30, VVaasshhii - 400 703. Tel: (022) - 39880299.OORRIISSSSAAHDFC AMC Ltd., Sri Jagannath Complex, 1st Floor, Opposite Hari - Omm Bhawan, BBaarrbbiill - 758 035. Tel No: 09238106515 / 09238106525 Fax No: (06767) 277565. HDFC AMC Ltd., 2nd Floor, Vinayak 96, Janpath, BBhhuubbaanneesshhwwaarr 751 001.Tel: 0674 - 645 0502, 645 1502, Telefax: 0674 - 253 1483.HDFC AMC Ltd., 1st Floor, Plot No. 2690 (P) Bajrakabati Road, Ranihat, CCuuttttaacckk – 753 001. Tel: (0671) 2323724/ 725 Fax: (0671) 2324741.HDFC AMC Ltd., Praful Tower, 1st Floor, Panposh Road, RRoouurrkkeellaa - 769 004. Tel No.: (0661) 3988029,3982060/70 Fax No.: (0661) 3982068. HDFC AMC Ltd., Kadambari Complex, 1st Floor, Unit - 4, Nayapara, Golbazar, SSaammbbaallppuurr - 768 001. Tel No: (0663) 2400 323 / 339 Fax No: (0663) 2400324. PPOONNDDIICCHHEERRRRYYHDFC AMC Ltd., No.17, I Floor, Sree Velayudham Complex, Near Indhira Gandhi Square, Natesan Nagar, PPoonnddiicchheerrrryy -605 005. Tel: (0413) 3043 293 / 500 / 600 Fax: (0413) 2206776.PPUUNNJJAABB HDFC AMC Ltd., SCO-28, 1st Floor, Taneja Towers, District Shopping Complex, Ranjit Avenue, AAmmrriittssaarr -- 143 001. Tel: (0183) 3988029 / 2570 Fax: (0183) 3982599. HDFC AMC Ltd., SCO 375-376, Ground Floor, Sector 35-B, CChhaannddiiggaarrhh -- 160 022.Tel: 0172 - 262 3397, 262 4497, Fax: 0172 - 301 3839. HDFC AMC Ltd., 2nd Floor, Above ING Vysya Bank, Adjacent to Sekhon Grand Hotel, Namdev Chowk, G T Road, JJaallaannddhhaarr CCiittyy -- 144 001. Tel: (0181) 3988029 / 970 Fax: (0181) 3982966. HDFC AMC Ltd., SCO 122, Feroze Gandhi Market, LLuuddhhiiaannaa - 141 001.Tel: 0161 - 277 4321, 501 4321, Fax: 0161 - 301 3838.
RRAAJJAASSTTHHAANNHDFC AMC Ltd., Moondhra Bhavan, 3 Ajmer Rd, JJaaiippuurr - 302 001.Tel: 0141 - 511 1125, 237 4968, Fax: 0141 - 511 1126.HDFC AMC Ltd., Gulab Singh Building, 11, Chopasani Road, JJooddhhppuurr -- 342 003.Tel: (0291) - 510 1927, 510 1937. Fax: 0291 - 5105919HDFC AMC Ltd., 1st Floor, Gowardhan Plaza, 25, Trench Colony, Opposite Lok Kalamandal, UUddaaiippuurr - 313 001. Tel: (0294) 3988029 Fax: (0294) 3982000TTAAMMIILL NNAADDUUHDFC AMC Ltd., ITC Centre, 1st Floor, 760 Anna Salai, CChheennnnaaii -- 600 002.Tel: 044 - 4397 9797, Fax: 044 - 2841 5855. HDFC AMC Ltd., 1st Floor, No1 Bhimsena Garden Street, Royapettah High Road, Mylapore, CChheennnnaaii – 600 004. Tel:(044) 30913060 Fax: (044) 30913082. HDFC AMC Ltd., 1371A, Ground Floor, Nadar Building Trichy Road, CCooiimmbbaattoorree - 641 018.Tel: 0422 - 439 1861 / 62 / 63, Fax: 0422 - 439 1714. HDFC AMC Ltd., Investor Service Centre No 127C/3 East Veli Street, MMaadduurraaii.. Tel: 0452 - 3988029.HDFC AMC Ltd., First floor, Ram Complex, No. 454/3, Meyanoor Main Road, SSaalleemm - 636 009. Tel : (0427) 3982680/700 Fax : (0427) 233361. HDFC AMC Ltd., No. 60, Sri Krishna Arcade, First Floor, Tennur High Road, Tennur, TTrriicchhyy -- 662200 001177.. Tel: (0431) 3982830 Fax: (0431) 3982835. UUTTTTAARRAANNCCHHAALLHDFC AMC Ld., 76, Rajpur Road, Near RTO, DDeehhrraadduunn -- 224488 000011.. Tel: (0135) 3988029/ 7434 Fax: (0135) 3987444.UUTTTTAARR PPRRAADDEESSHHHDFC AMC Ltd., B2, 1st Floor, 9/4, Shankar Point, Sanjay Place, AAggrraa - 282 002. Tel: (0562) 3984761-73 Fax: (0562) 3984777 HDFC AMC Ltd., 146 Civil Lines, 1st Floor, Gupta Complex, Near Circuit House Chouraha, BBaarreeiillllyy - 243 001. Tel: (0581) 2510 749 / 759 Fax: (0581) 2510709.HDFC AMC Ltd., D-2, 1st Floor, Raj Nagar District Centre, Raj Nagar, GGhhaazziiaabbaadd - 201010. Tel No - 0120 - 3010635, Fax No - 0120 - 3010636.HDFC AMC Ltd., 1st Floor, 16/80 D, Behind SBI Main, Civil Lines, KKaannppuurr - 208 001.Tel: 0512 - 233 1484-87, Fax: 0512 - 233 1487.HDFC AMC Ltd., 4 Shahnajaf Road, LLuucckknnooww -- 226 001. Tel: 0522 - 220 7591, 220 0163, Fax: 0522 - 223 0408. HDFC AMC Ltd., Parsvnath Plaza-II, UGF Hall No.4, Delhi Road, MMoorraaddaabbaadd - 244 001 Tel No.: (0591) 3988029 / 3982131 Fax No.: (0591) 3982137. HDFC AMC Ltd., K-24/25, Premises No. 36 & 37, Pearl Plaza, Sector-18, NNooiiddaa - 201 301. Tel No.: (0120) 3988029 Fax No.: (0120) 3980610.HDFC AMC Ltd., D-64/127, 4th Floor, Arihant Complex, Sigra, VVaarraannaassii - 221010. Tel: 9935177068, 9935147068.WWEESSTT BBEENNGGAALLHDFC AMC Ltd., City Plaza, City Centre, 1st Floor, DDuurrggaappuurr - 713 216. Tel: (0343) 3982150 Fax: (0343) 3982153.HDFC AMC Ltd., Menaka Estate, 1st Floor, 3 Red Cross Place, KKoollkkaattaa - 700 001. Tel. 033 - 2242 7849/53/56/59. Fax: 033 - 2243 9582.HDFC AMC Ltd., Gitanjali Complex, 2nd Floor, Above Corporation Bank, Sevoke Road, SSiilliigguurrii - 734 001. Tel No.: (0353) - 6453474 Fax No.: (0353) 2545270.
RReeggiisstteerreedd OOffffiiccee:: Ramon House, 3rd Floor, H.T. Parekh Marg, 169, Backbay Reclamation, Churchgate, Mumbai 400 020.RRiisskk FFaaccttoorrss:: Mutual Funds and securities investments are subject to market risks and there can be no assurance or guarantee that the Scheme(s) objectives will be achieved. As with any investment in securities, the Net Asset Value of Unitsissued under the Scheme(s) may go up or down depending on the various factors and forces affecting the capital markets. Past performance of the Sponsors and their affiliates/AMC/Mutual Fund and its Scheme(s) do not indicate the futureperformance of the Scheme(s) of the Mutual Fund. The Sponsors are not responsible or liable for any loss or shortfall resulting from the operations of the Scheme(s) beyond the contribution of Rs.1 lakh each made by them towards the cor-pus of the Mutual Fund. The names of the Scheme(s) of the HDFC Mutual Fund do not in any manner indicate either the quality of the Scheme(s) or their future prospects and returns. “Standard & Poor’s® and “S&P® are trademarks of TheMcGraw-Hill Companies, Inc. and have been licensed for use by India Index Services & Products Limited (IISL), which has sublicensed such marks to the HDFC Asset Management Company Limited. The S&P CNX Nifty is not compiled, calculat-ed or distributed by Standard & Poor’s and Standard & Poor’s and IISL make no representation regarding the advisability of investing in products that utilize any such Index as a component. All rights in the SENSEX vest in Bombay Stock ExchangeLtd. (“BSE”). BSE and SENSEX are trademarks of BSE and are used by HDFC Asset Management Company Limited under license. BSE shall not be liable in any manner whatsoever (including in negligence) for any loss arising to any personwhosoever out of use of or reliance on the SENSEX by any person. IInnvveessttoorrss iinn tthhee SScchheemmee((ss)) aarree nnoott bbeeiinngg ooffffeerreedd aannyy gguuaarraanntteeeedd//aassssuurreedd rreettuurrnnss.. Please read the respective Offer Documents carefully before investing. In view of the individ-ual nature of tax consequences, each investor is advised to consult his/her professional tax advisor. Applications would be accepted at Investor Service Centres (ISCs) and on-going Redemptions ((ssuubbjjeecctt ttoo ccoommpplleettiioonn ooff LLoocckk--iinn--PPeerriioodd,, iiff aannyy))can be made at the ISCs on all Business Days.The AMC will calculate and publish NAVs on all Business Days. This monthly newsletter contains unaudited figures. SSttaattuuttoorryy DDeettaaiillss:: HDFC Mutual Fund has been set up as a trust sponsored byHousing Development Finance Corporation Limited and Standard Life Investments Limited (liability restricted to their contribution of Rs 1 lakh each to the corpus) with HDFC Trustee Company Limited as the Trustee (Trustee under the IndianTrusts Act, 1882) and with HDFC Asset Management Company Limited as the Investment Manager.
For any query or suggestions:-
Investors may contact us at: [email protected]
Distributors may contact us at: [email protected]
SMS: HDFCMF to 56767
Published and printed by Shailendra Sharad Kalelkar for and on behalf of Business Standard Limited from H4, Paragon Condominium, Opposite Century Mills, P B Marg, Worli, Mumbai 400013, and printed at Print House India Private Limited, 6, Datta Mandir Road, Bhandup (W), Mumbai 400 078. Editor: Bhupesh Bhandari.
Telephone Services
Visit us at www.hdfcfund.com
April 2009 3311Intouchmutually
hdfc-bk.qxd 5/7/2009 8:26 PM Page 1

Intouchmutually, April 2009, RNI Regd. No. MAHENG/2003/10804
hdfc-bk-ad.qxd 5/7/2009 8:24 PM Page 2
Recommended