Hay Fertility Management
Adapted from Brie Menjoulet’s Presentation
Agronomy Specialist
Hermitage, MO
We Will Look At…
• Soil properties and nutrient retention
• Soil testing and nutrient buildup
• Nutrient removal rates
• Legumes as an nitrogen source
• Fertilizer sources
• Fertilizer application
• Liming
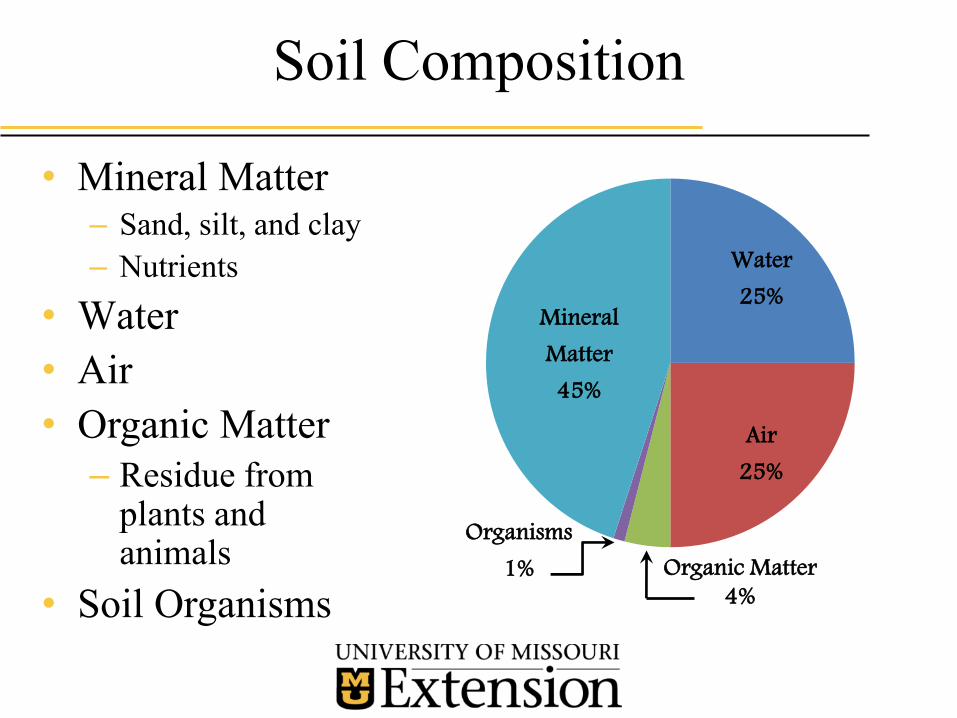
Soil Composition
• Mineral Matter– Sand, silt, and clay
– Nutrients
• Water
• Air
• Organic Matter
– Residue from plants and animals
• Soil Organisms
Water25%
Air25%
Organisms1%
Mineral Matter45%
Organic Matter4%
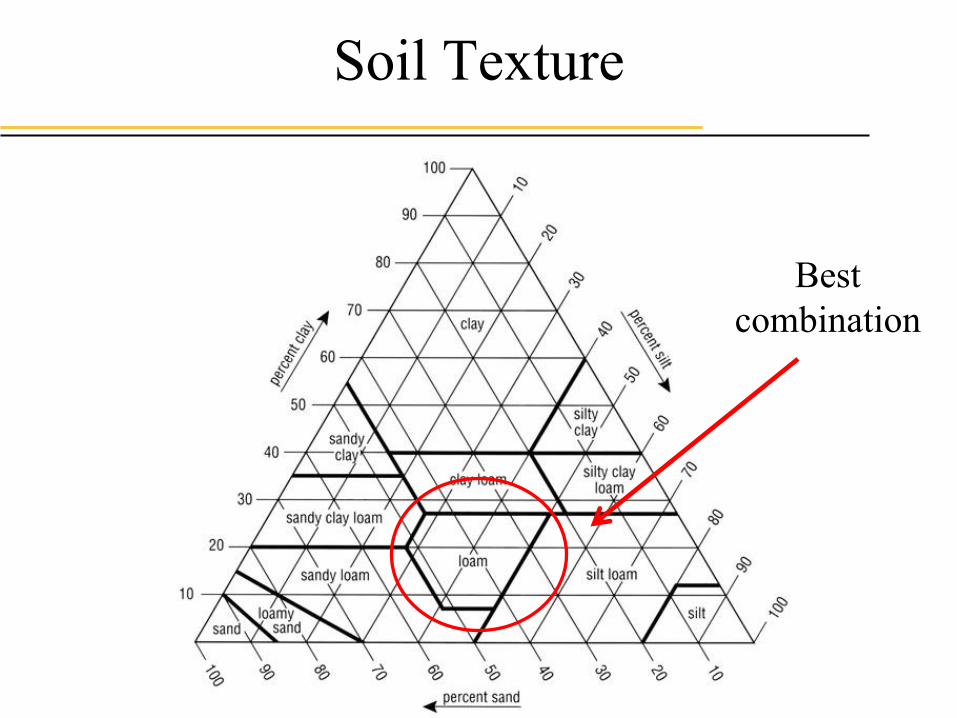
Soil Texture
Best
combination
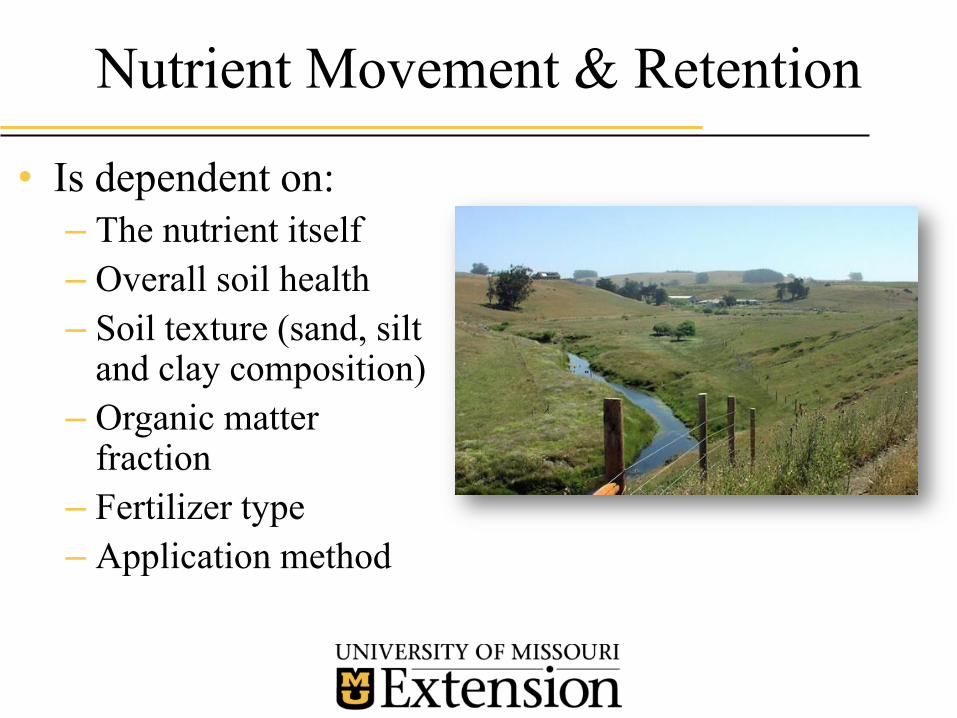
Nutrient Movement & Retention
• Is dependent on:
– The nutrient itself
– Overall soil health
– Soil texture (sand, silt and clay composition)
– Organic matter fraction
– Fertilizer type
– Application method
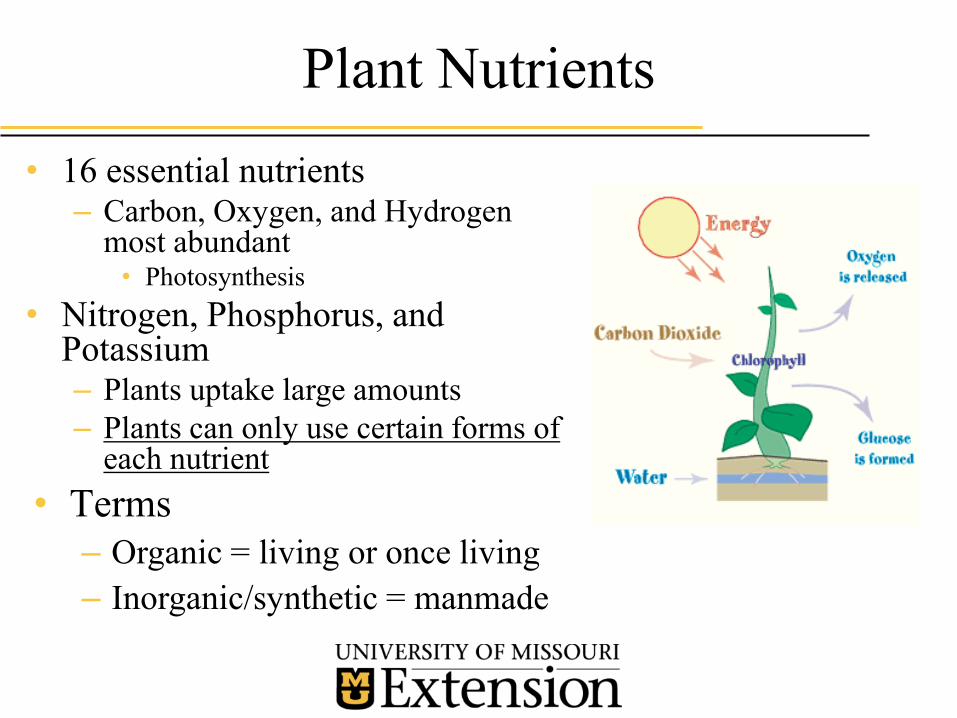
Plant Nutrients
• 16 essential nutrients– Carbon, Oxygen, and Hydrogen
most abundant• Photosynthesis
• Nitrogen, Phosphorus, and Potassium– Plants uptake large amounts
– Plants can only use certain forms of each nutrient
• Terms
– Organic = living or once living
– Inorganic/synthetic = manmade
Phosphorus (P) and Potassium (K)
• Chemical forms change in soil
• Plants uptake:
– Phosphorus as phosphate - P2O5
– Potassium as potash - K2O
• Not prone to leaching
• Clings to soil particle and organic matter
• Can be built up in the soil over time
Nitrogen (N)
• Complex cycle!
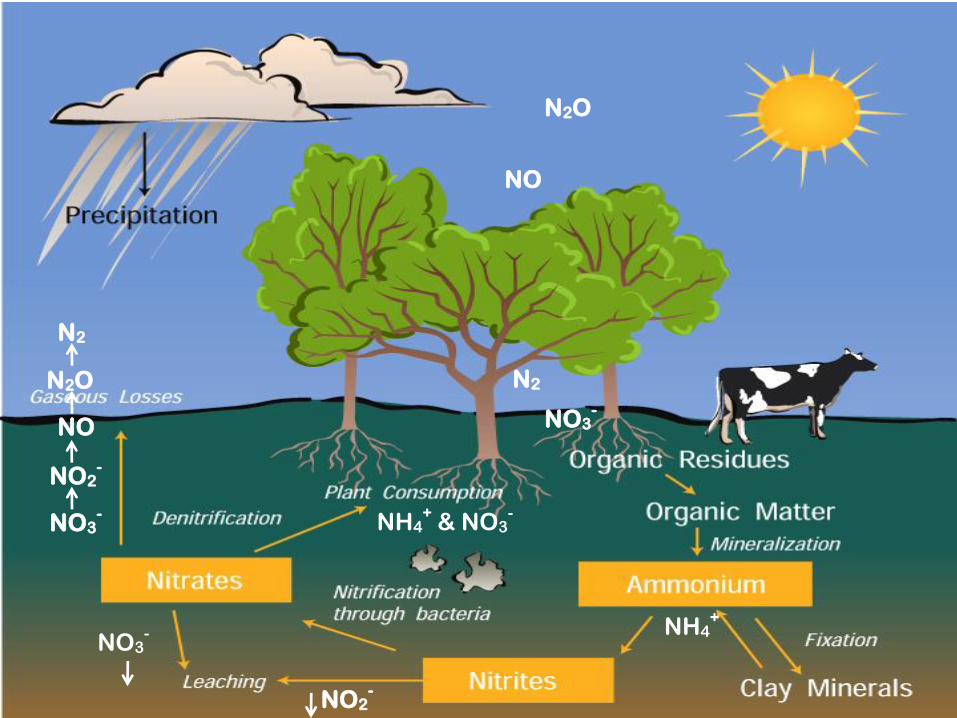
NH4+
& NO3-
NO3-
N2
NO
NO3-
NO2-
NH4+
NO2-
NO
N2O N2
NO3-
N2O
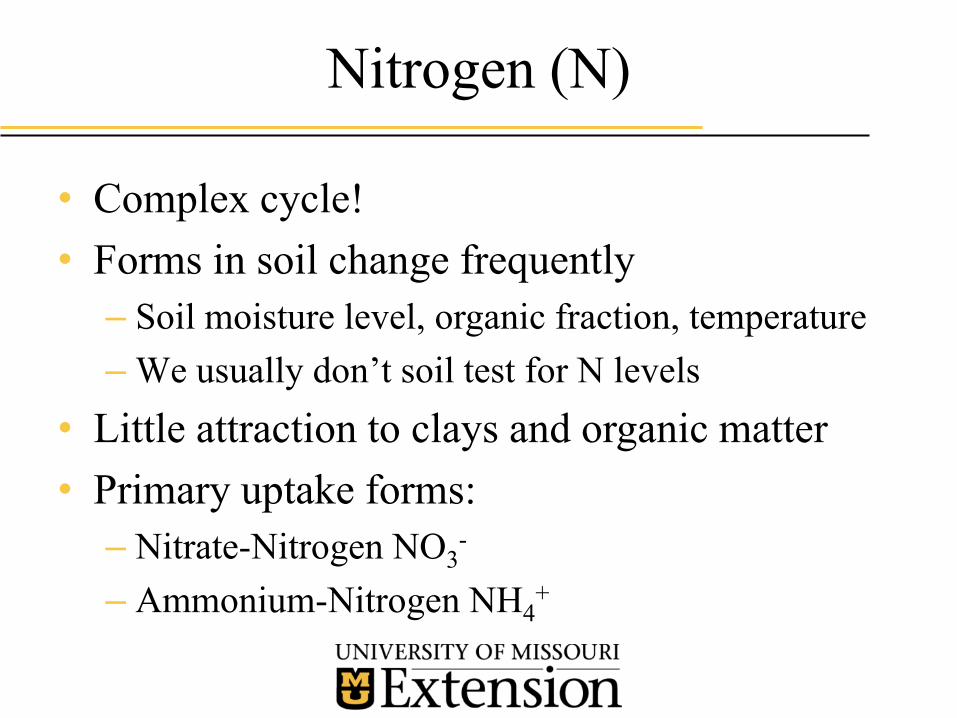
Nitrogen (N)
• Complex cycle!
• Forms in soil change frequently
– Soil moisture level, organic fraction, temperature
– We usually don’t soil test for N levels
• Little attraction to clays and organic matter
• Primary uptake forms:
– Nitrate-Nitrogen NO3-
– Ammonium-Nitrogen NH4+
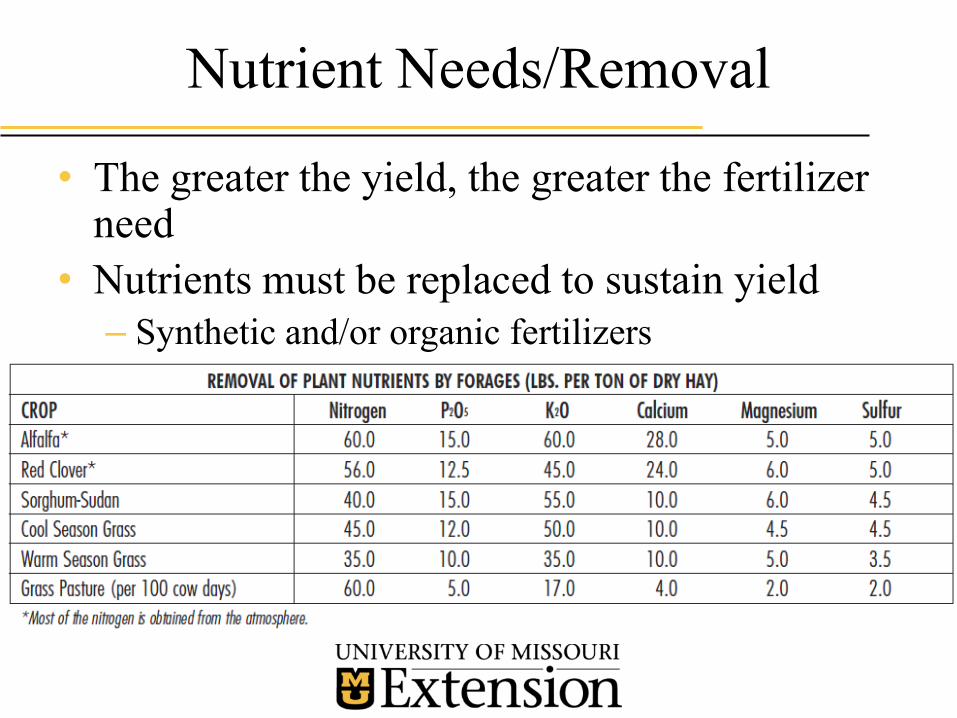
Nutrient Needs/Removal
• The greater the yield, the greater the fertilizer need
• Nutrients must be replaced to sustain yield
– Synthetic and/or organic fertilizers
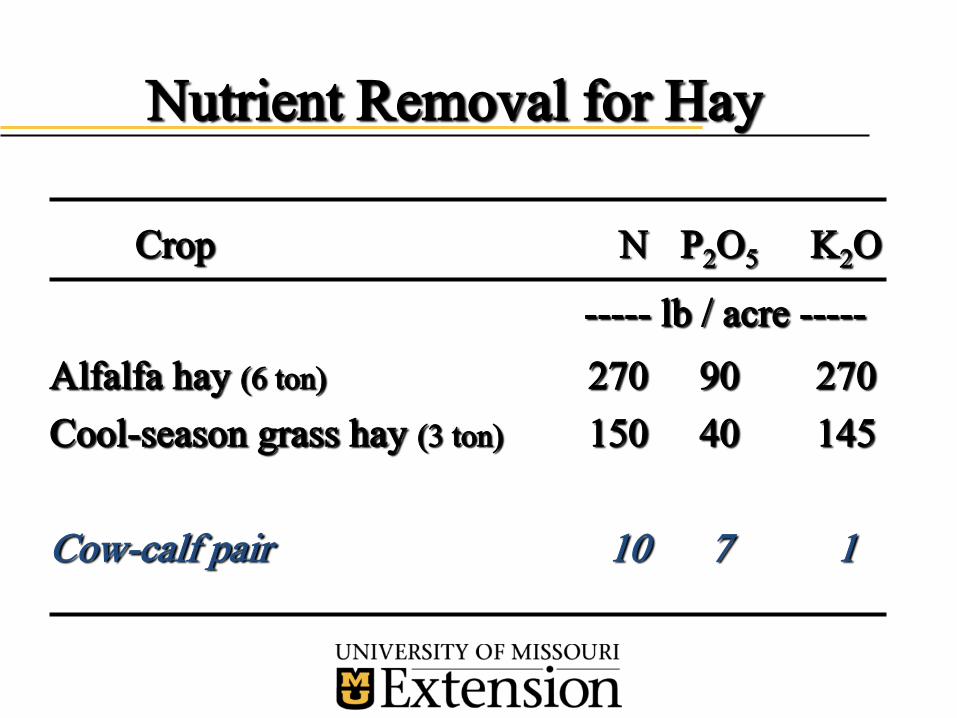
Nutrient Removal for Hay
Crop N P2O5 K2O
----- lb / acre -----
Alfalfa hay (6 ton) 270 90 270
Cool-season grass hay (3 ton) 150 40 145
Cow-calf pair 10 7 1
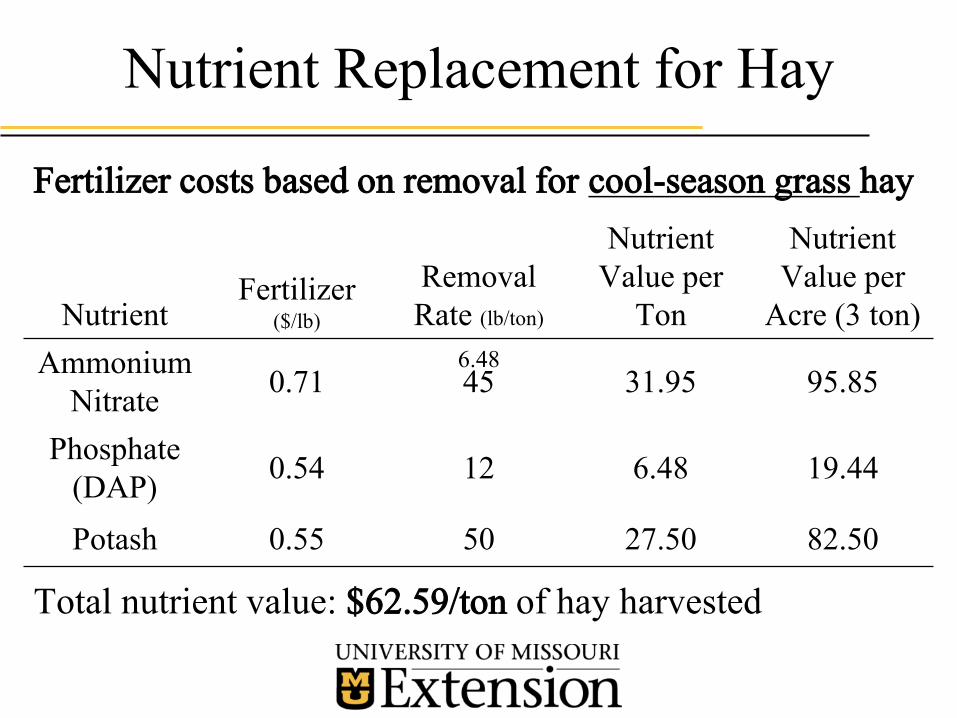
Nutrient Replacement for Hay
NutrientFertilizer
($/lb)
Removal
Rate (lb/ton)
Nutrient
Value per
Ton
Nutrient
Value per
Acre (3 ton)
Ammonium
Nitrate0.71 45 31.95 95.85
Phosphate
(DAP)0.54 12 6.48 19.44
Potash 0.55 50 27.50 82.50
Fertilizer costs based on removal for cool-season grass hay
Total nutrient value: $62.59/ton of hay harvested
6.48
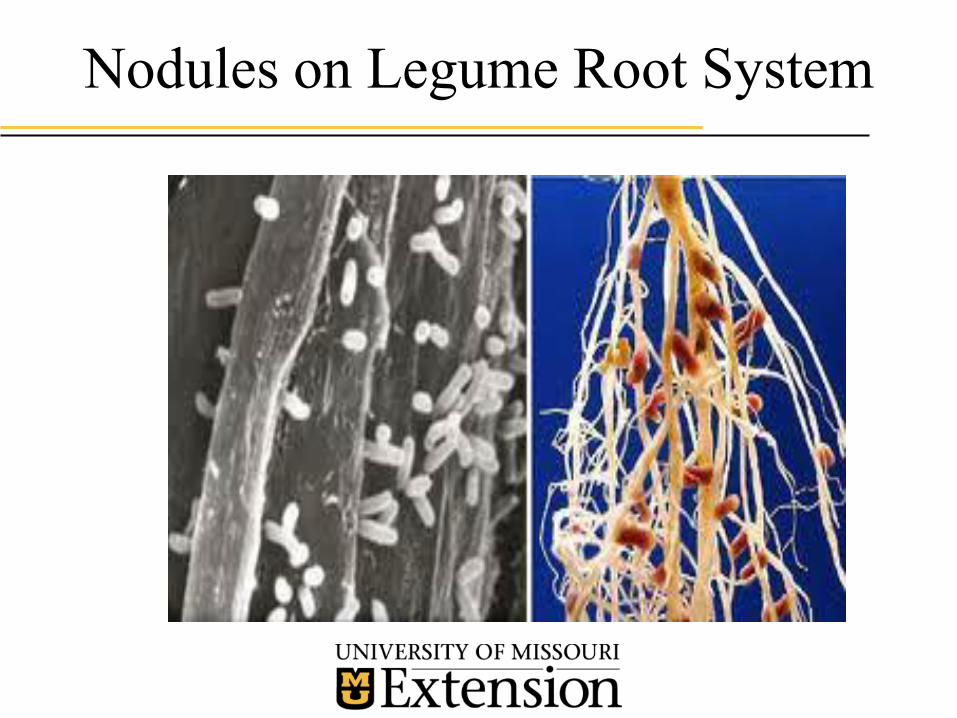
Legumes
• ~ 80% of atmosphere is N-gas (N2)
– Remember the uptake forms
• Nodules are home to nitrogen-fixing bacteria
– Bacteria convert N2 to NH3
• Most fixed N goes to host plant
• They will save you $$$$$$
– Dilution and lessening of fescue endophyte
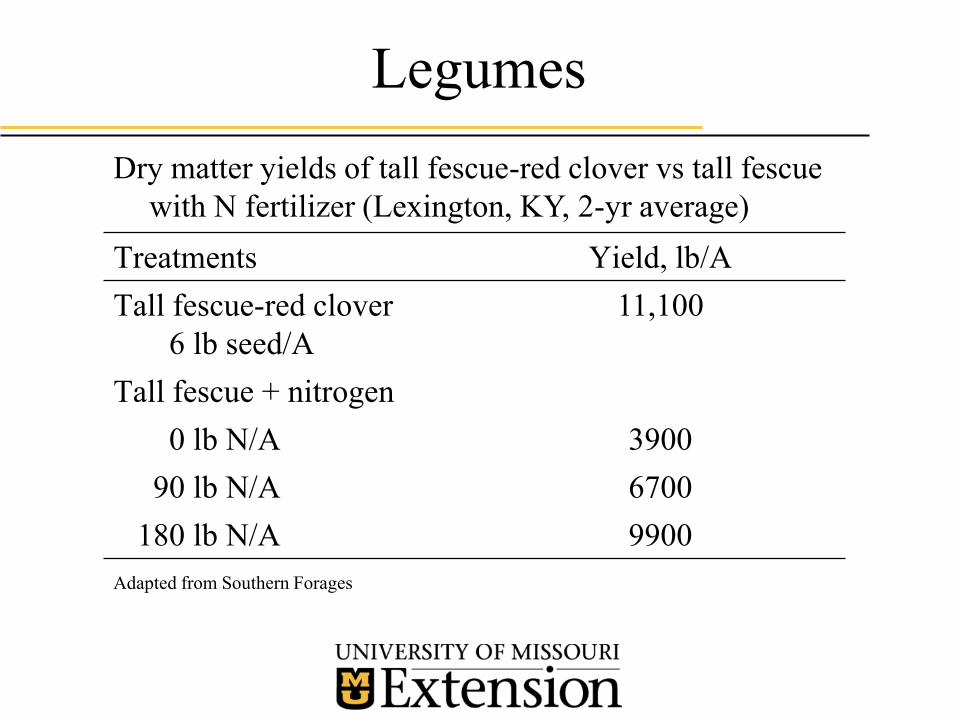
Legumes
Treatments Yield, lb/A
Tall fescue-red clover
6 lb seed/A
11,100
Tall fescue + nitrogen
0 lb N/A 3900
90 lb N/A 6700
180 lb N/A 9900
Dry matter yields of tall fescue-red clover vs tall fescue
with N fertilizer (Lexington, KY, 2-yr average)
Adapted from Southern Forages
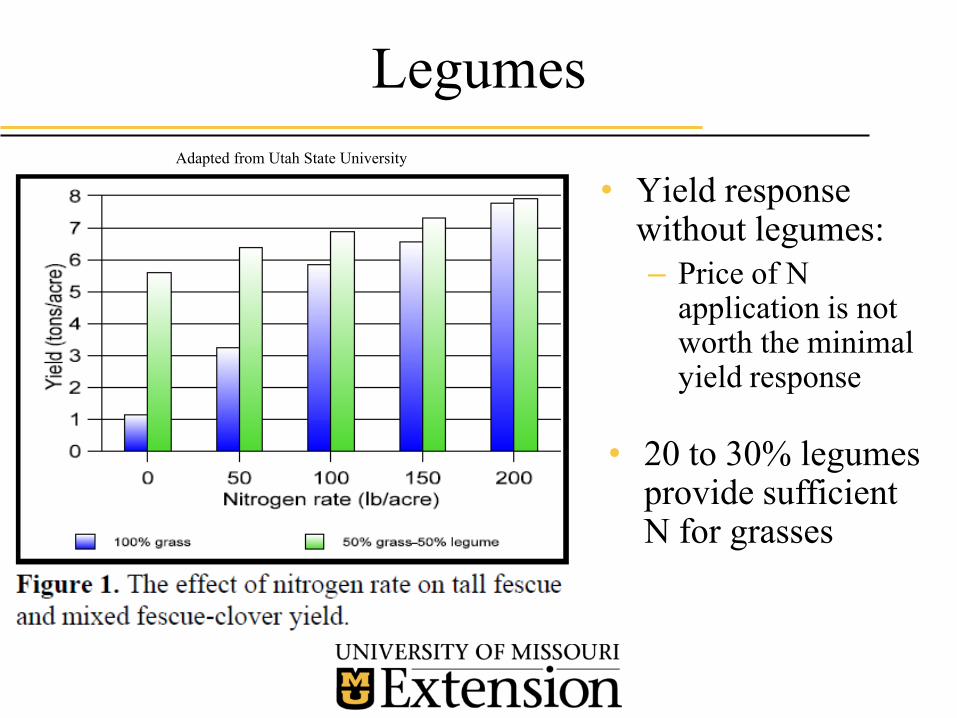
Legumes
Adapted from Utah State University
• Yield response without legumes:
– Price of N application is not worth the minimal yield response
• 20 to 30% legumes provide sufficient N for grasses
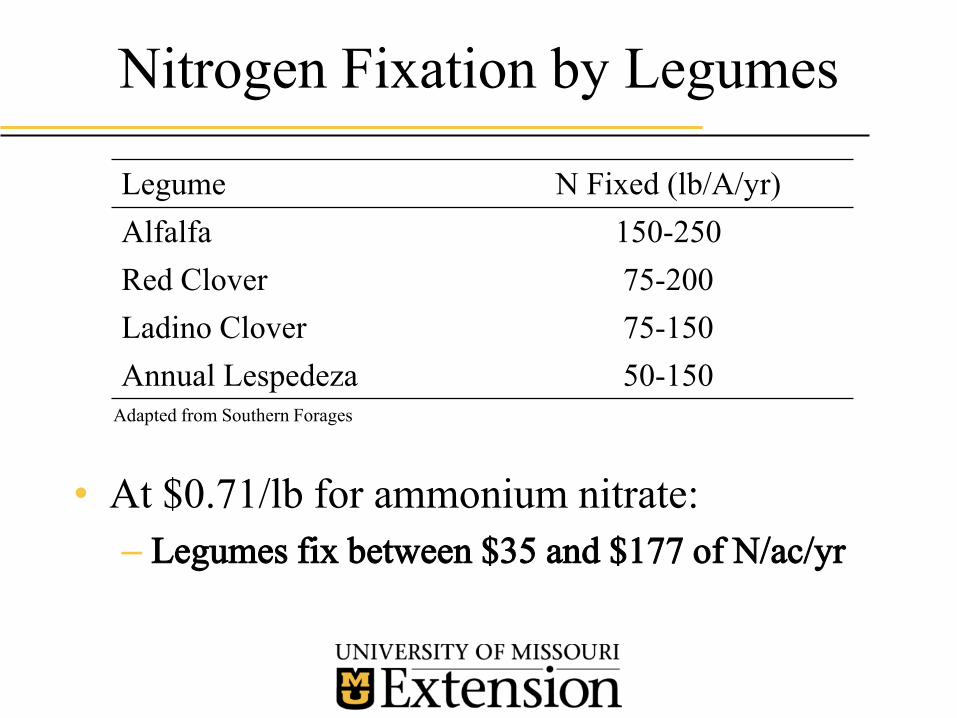
Nitrogen Fixation by Legumes
• At $0.71/lb for ammonium nitrate:
– Legumes fix between $35 and $177 of N/ac/yr
Legume N Fixed (lb/A/yr)
Alfalfa 150-250
Red Clover 75-200
Ladino Clover 75-150
Annual Lespedeza 50-150Adapted from Southern Forages
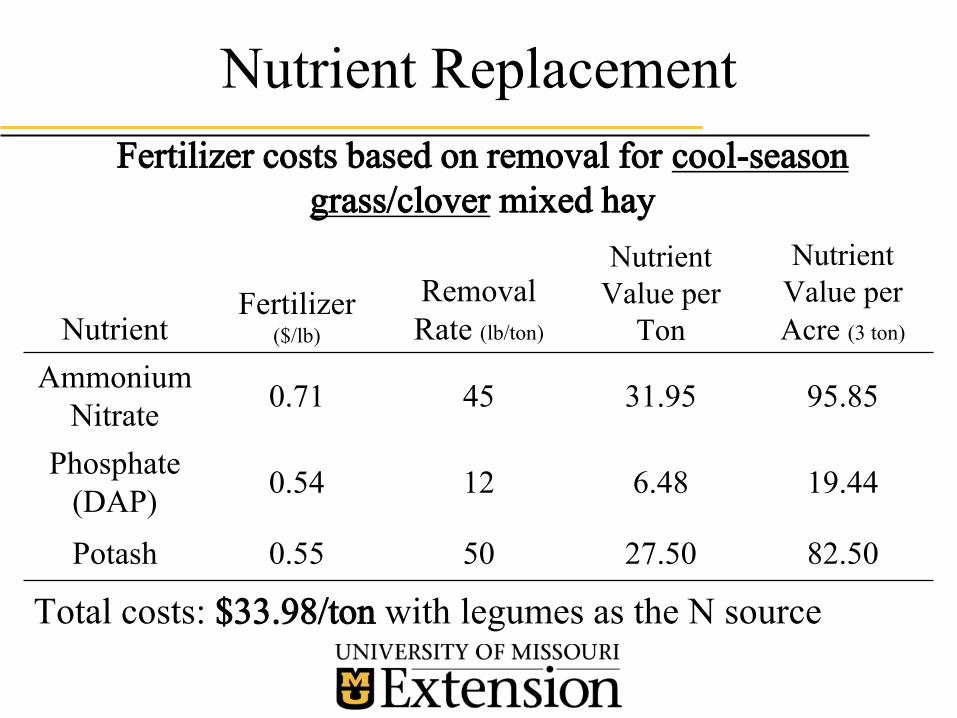
Nutrient Replacement
NutrientFertilizer
($/lb)
Removal
Rate (lb/ton)
Nutrient
Value per
Ton
Nutrient
Value per
Acre (3 ton)
Ammonium
Nitrate0.71 45 31.95 95.85
Phosphate
(DAP)0.54 12 6.48 19.44
Potash 0.55 50 27.50 82.50
Total costs: $33.98/ton with legumes as the N source
Fertilizer costs based on removal for cool-season
grass/clover mixed hay
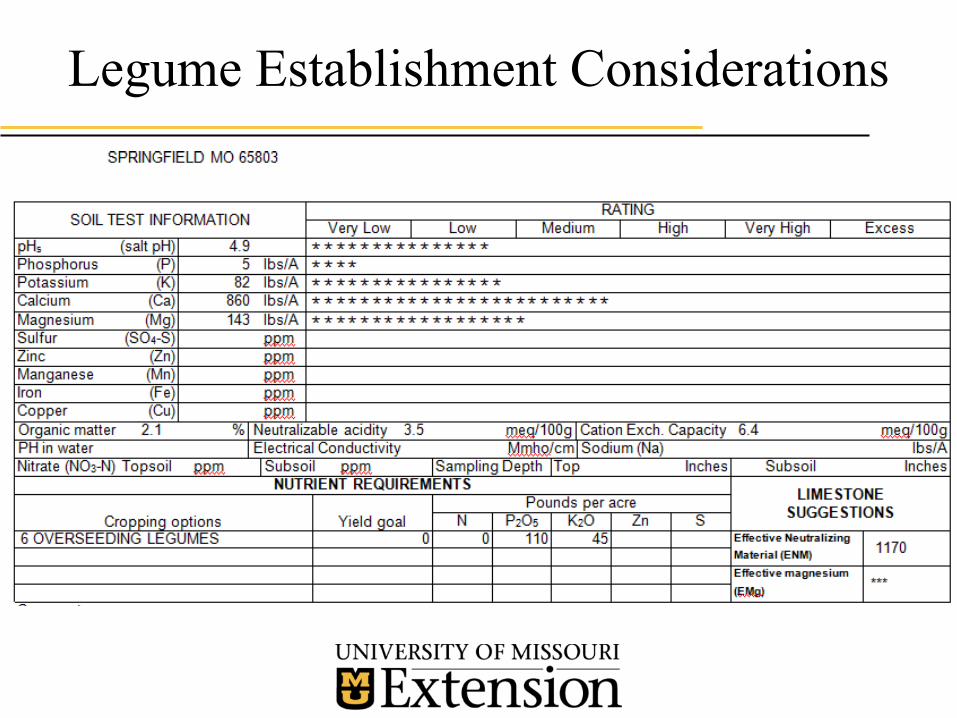
Legume Establishment Considerations
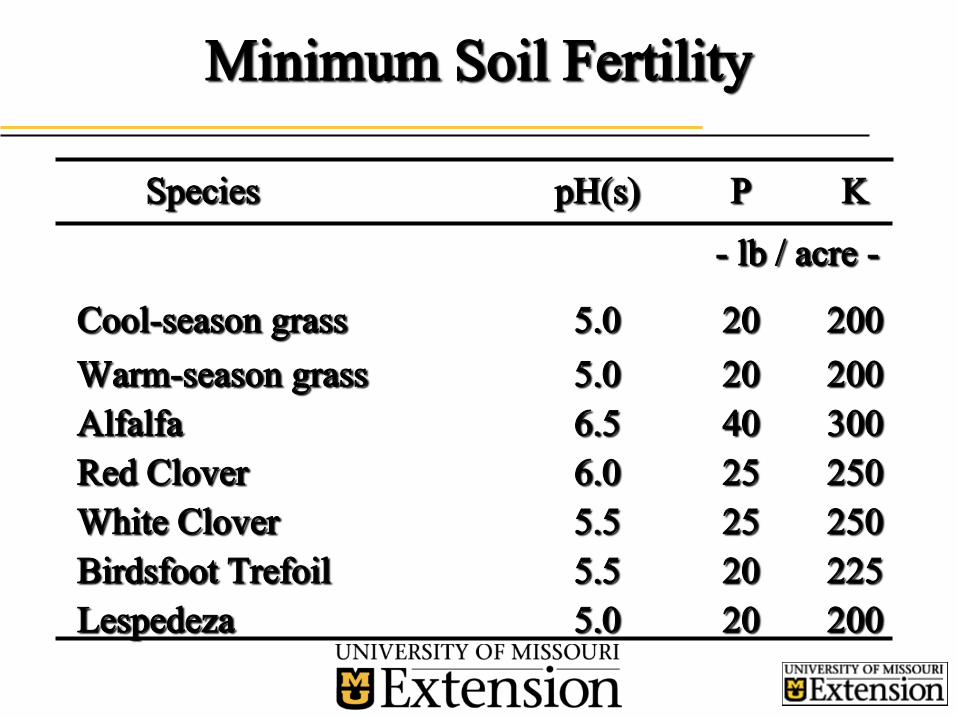
Minimum Soil Fertility
Species pH(s) P K
- lb / acre -
Cool-season grass 5.0 20 200
Warm-season grass 5.0 20 200
Alfalfa 6.5 40 300
Red Clover 6.0 25 250
White Clover 5.5 25 250
Birdsfoot Trefoil 5.5 20 225
Lespedeza 5.0 20 200
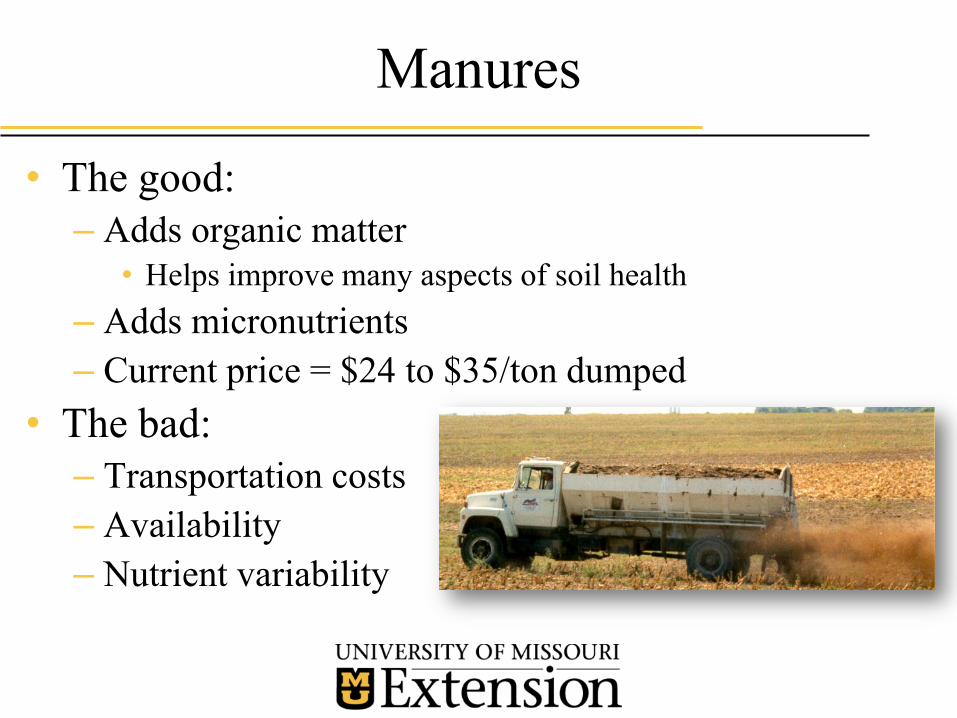
Manures
• The good:
– Adds organic matter• Helps improve many aspects of soil health
– Adds micronutrients
– Current price = $24 to $35/ton dumped
• The bad:
– Transportation costs
– Availability
– Nutrient variability
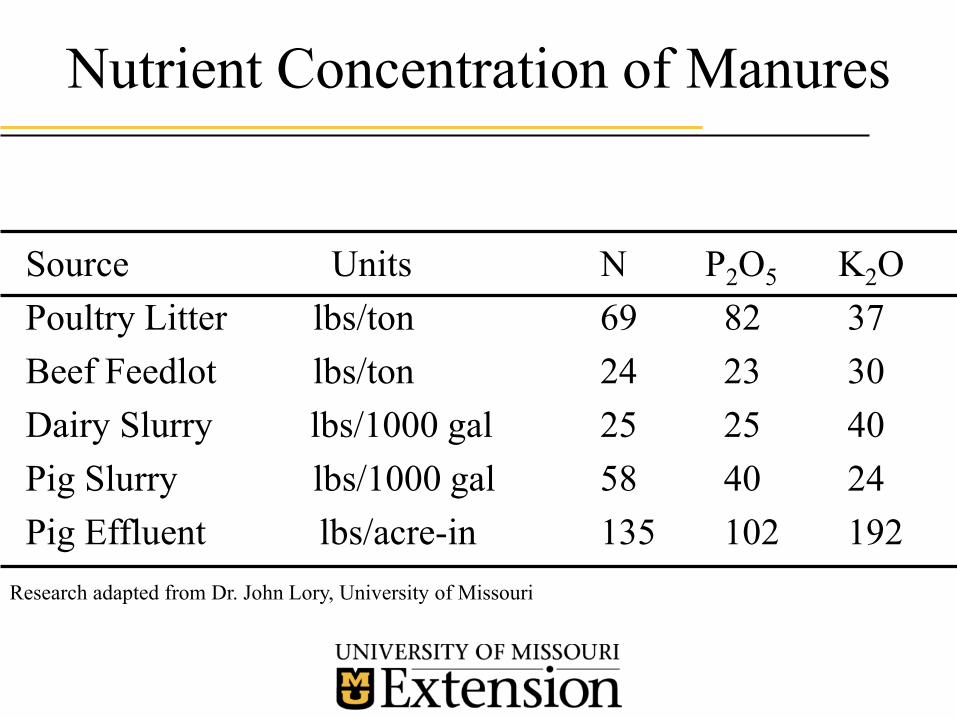
Nutrient Concentration of Manures
Research adapted from Dr. John Lory, University of Missouri
Source Units N P2O5 K2O
Poultry Litter lbs/ton 69 82 37
Beef Feedlot lbs/ton 24 23 30
Dairy Slurry lbs/1000 gal 25 25 40
Pig Slurry lbs/1000 gal 58 40 24
Pig Effluent lbs/acre-in 135 102 192
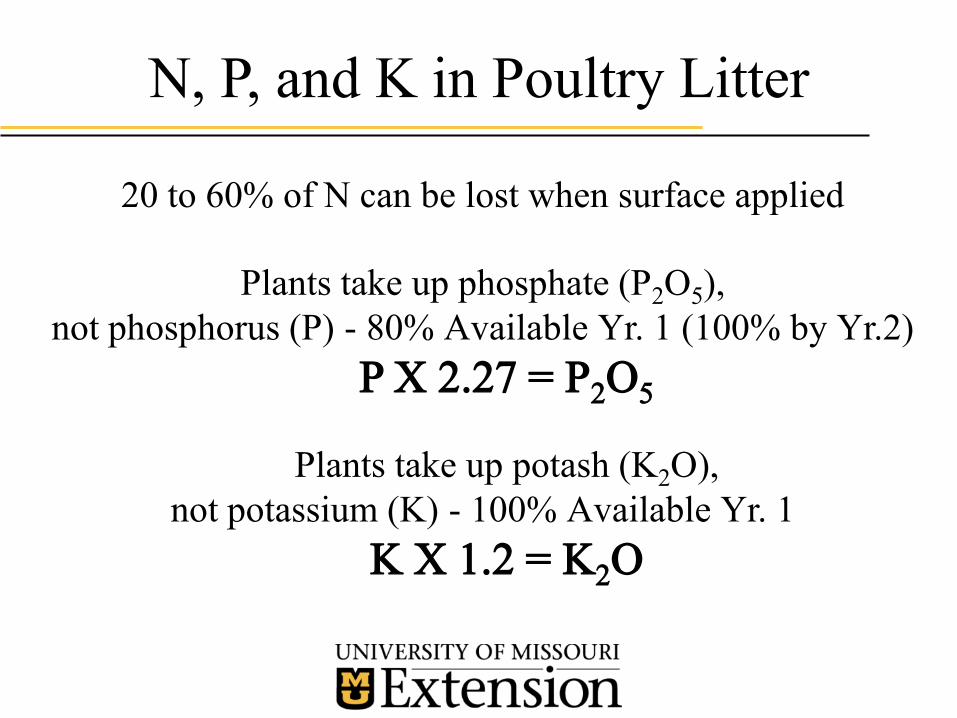
N, P, and K in Poultry Litter
20 to 60% of N can be lost when surface applied
Plants take up phosphate (P2O5),
not phosphorus (P) - 80% Available Yr. 1 (100% by Yr.2)
P X 2.27 = P2O5
Plants take up potash (K2O),
not potassium (K) - 100% Available Yr. 1
K X 1.2 = K2O
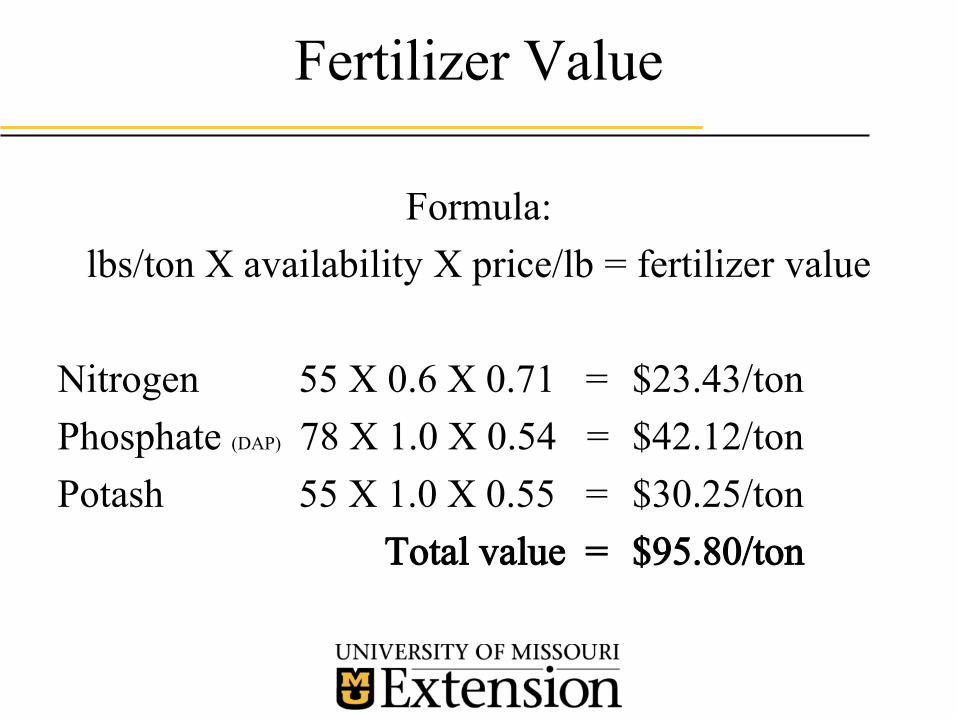
Fertilizer Value
Formula:
lbs/ton X availability X price/lb = fertilizer value
Nitrogen 55 X 0.6 X 0.71 = $23.43/ton
Phosphate (DAP) 78 X 1.0 X 0.54 = $42.12/ton
Potash 55 X 1.0 X 0.55 = $30.25/ton
Total value = $95.80/ton
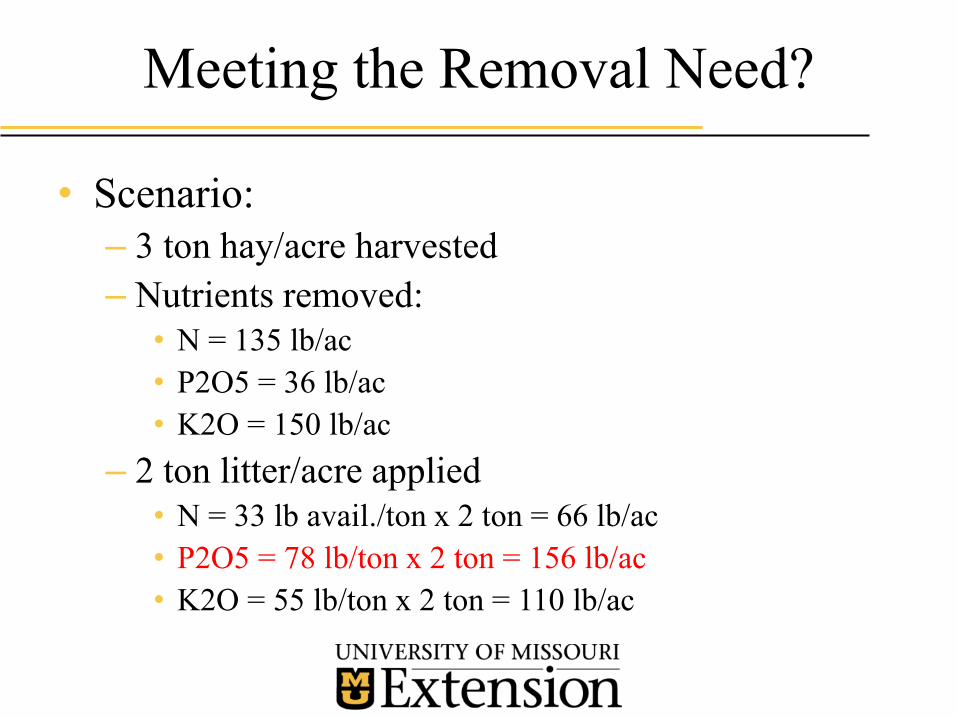
Meeting the Removal Need?
• Scenario:
– 3 ton hay/acre harvested
– Nutrients removed: • N = 135 lb/ac
• P2O5 = 36 lb/ac
• K2O = 150 lb/ac
– 2 ton litter/acre applied• N = 33 lb avail./ton x 2 ton = 66 lb/ac
• P2O5 = 78 lb/ton x 2 ton = 156 lb/ac
• K2O = 55 lb/ton x 2 ton = 110 lb/ac
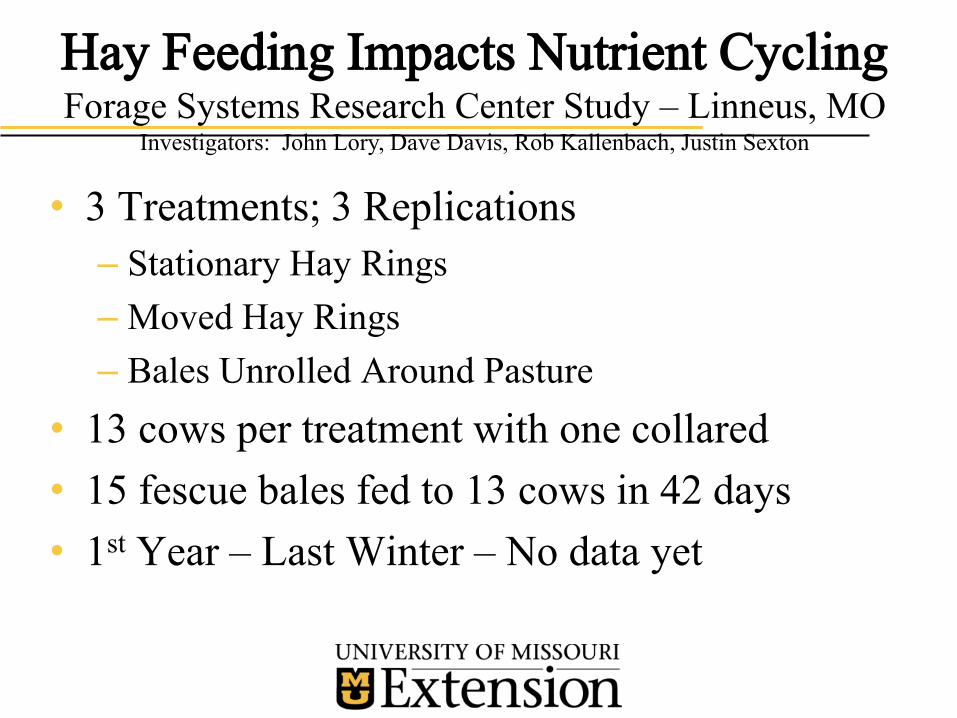
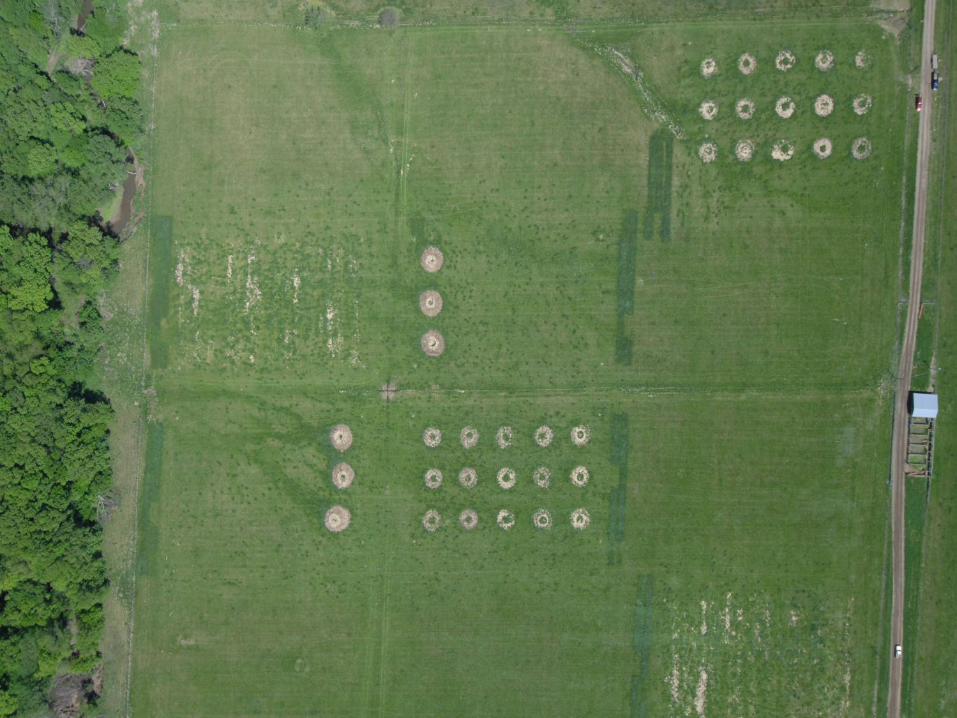
Hay Feeding Impacts Nutrient CyclingForage Systems Research Center Study – Linneus, MO
Investigators: John Lory, Dave Davis, Rob Kallenbach, Justin Sexton
• 3 Treatments; 3 Replications
– Stationary Hay Rings
– Moved Hay Rings
– Bales Unrolled Around Pasture
• 13 cows per treatment with one collared
• 15 fescue bales fed to 13 cows in 42 days
• 1st Year – Last Winter – No data yet
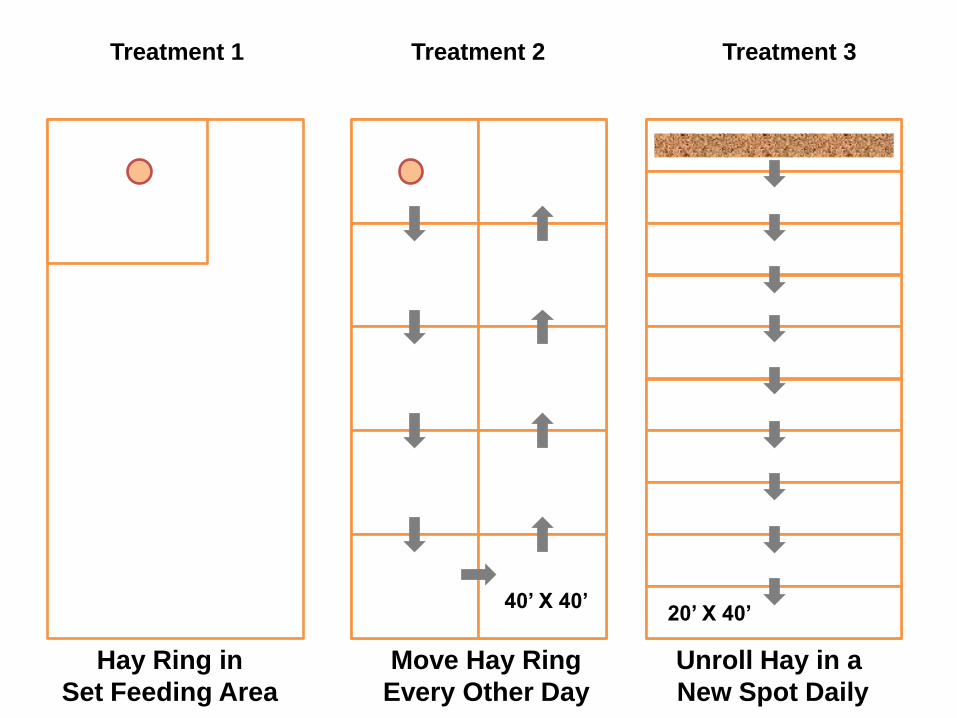
Treatment 1 Treatment 2 Treatment 3
Hay Ring in
Set Feeding Area
Move Hay Ring
Every Other Day
Unroll Hay in a
New Spot Daily
40’ X 40’20’ X 40’
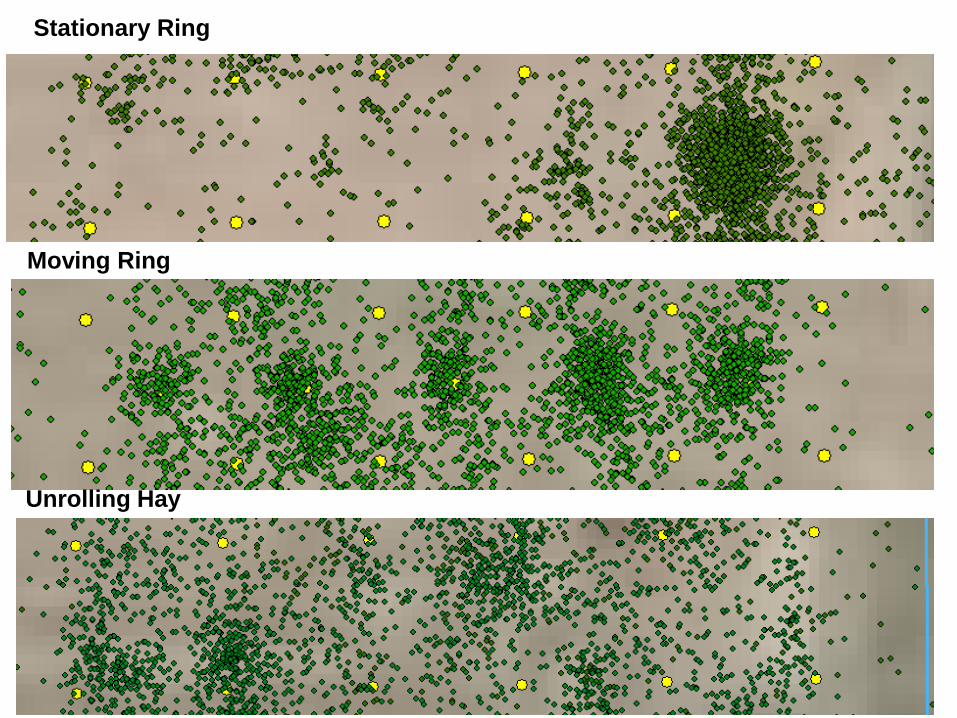
Stationary Ring
Moving Ring
Unrolling Hay
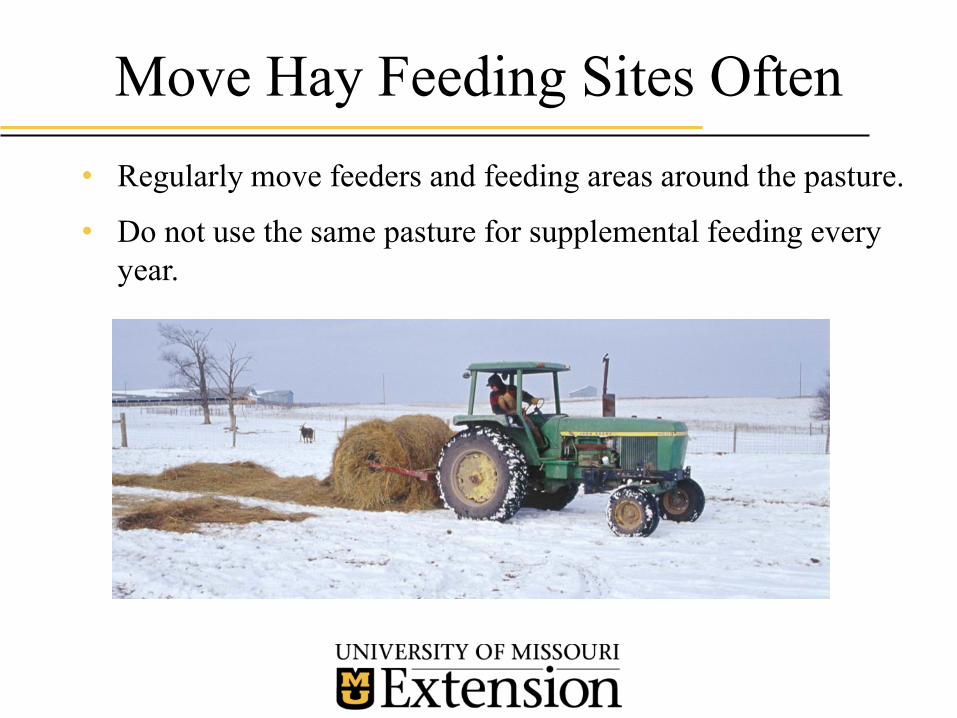
Move Hay Feeding Sites Often
• Regularly move feeders and feeding areas around the pasture.
• Do not use the same pasture for supplemental feeding every
year.
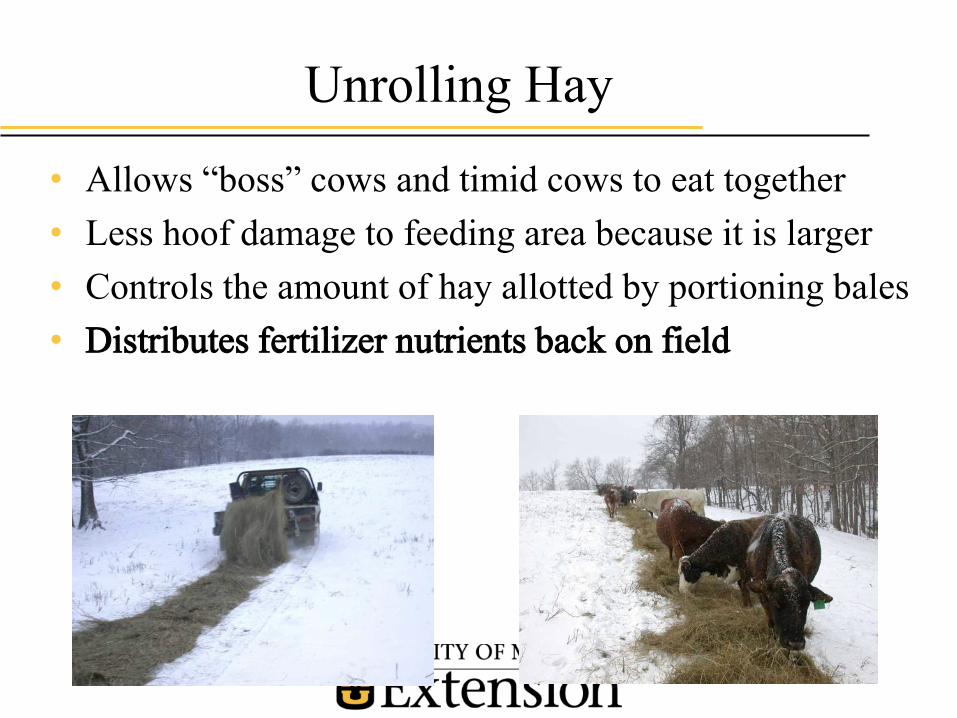
Unrolling Hay
• Allows “boss” cows and timid cows to eat together
• Less hoof damage to feeding area because it is larger
• Controls the amount of hay allotted by portioning bales
• Distributes fertilizer nutrients back on field
Liming
“The poor man’s fertilizer”
• For cool-season grass:
– 5.5 to 7.0
• For legumes:
– 6.0 to 7.5
• Limit application to 2 to 3 ton/acre/year
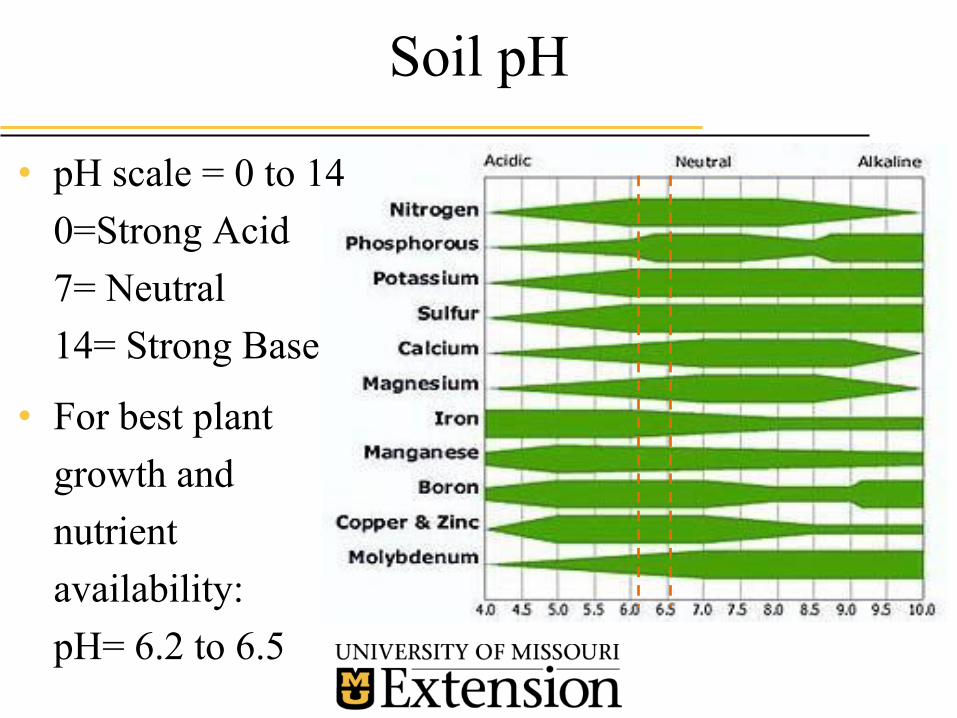
Soil pH
• pH scale = 0 to 14
0=Strong Acid
7= Neutral
14= Strong Base
• For best plant
growth and
nutrient
availability:
pH= 6.2 to 6.5
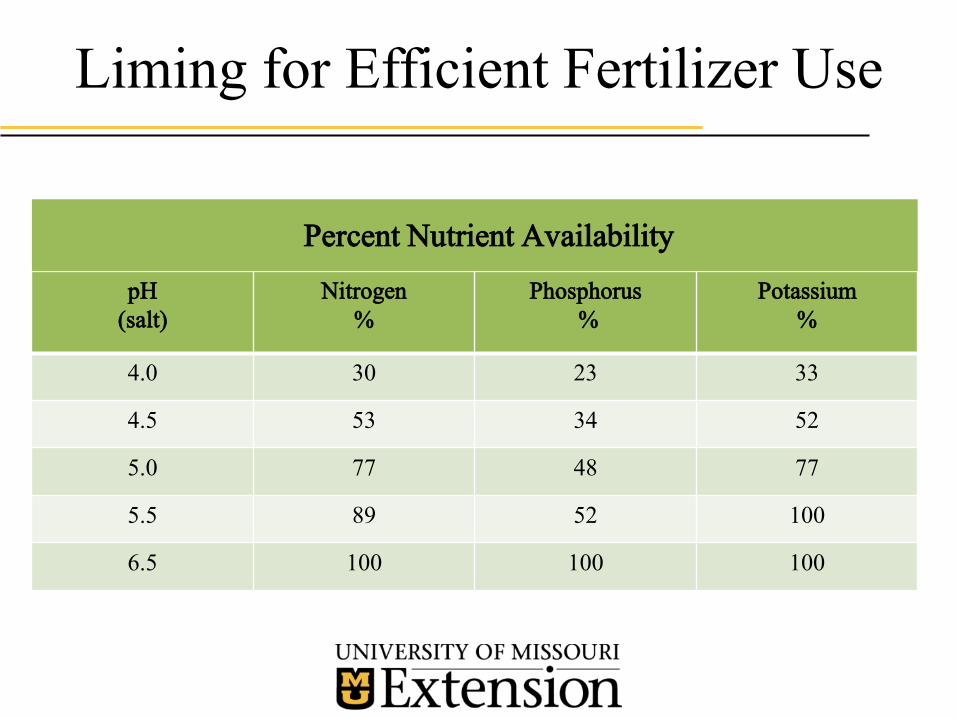
Liming for Efficient Fertilizer Use
pH
(salt)
Nitrogen
%
Phosphorus
%
Potassium
%
4.0 30 23 33
4.5 53 34 52
5.0 77 48 77
5.5 89 52 100
6.5 100 100 100
Percent Nutrient AvailabilityPercent Nutrient Availability
Application Timing
• P, K, and lime take time to work into the root zone
• N doesn’t stick around
• Are there legumes present?
• How low are your current levels?
• Availability and price of fertilizer
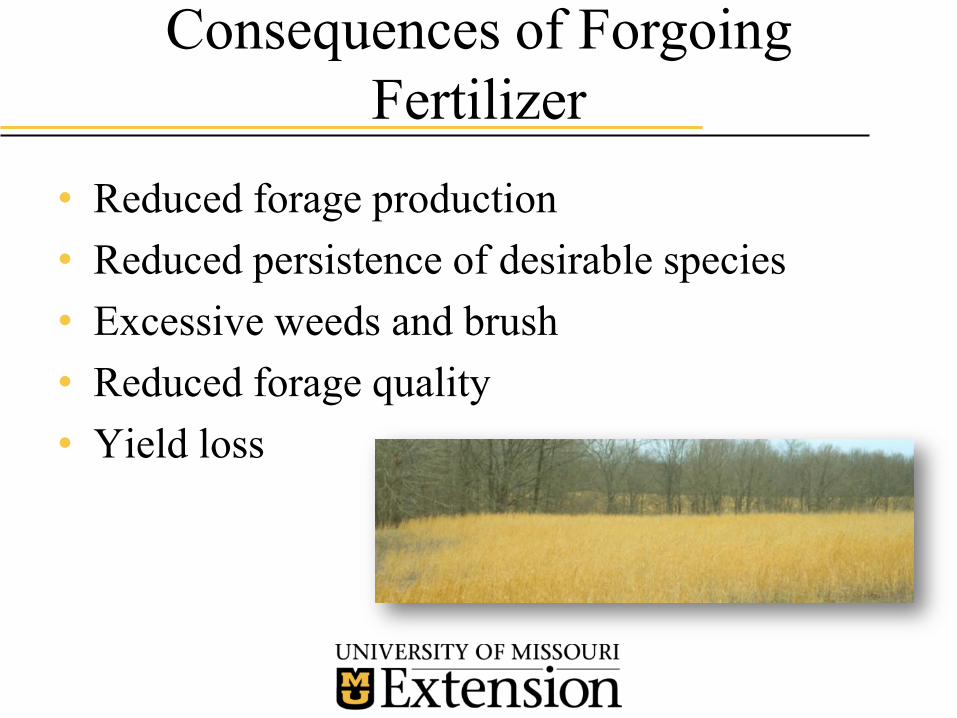
Consequences of Forgoing
Fertilizer
• Reduced forage production
• Reduced persistence of desirable species
• Excessive weeds and brush
• Reduced forage quality
• Yield loss
Quality Sampling
• BE CONSISTENT
– Sample every 3 to 5 years
– Sample at the same time every year
– Depth
• Avoid sampling soon after applying fertilizer, lime, compost or manure
–Best to wait 1 year (at least 4-6 months)
• Avoid sampling hot spots
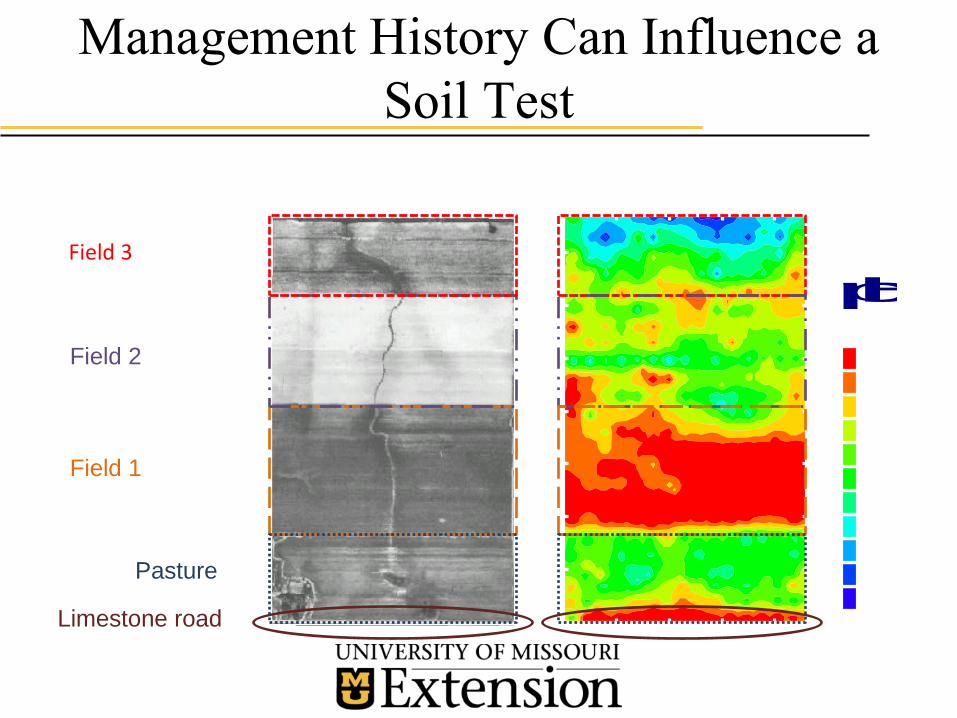
Management History Can Influence a
Soil Test
4.6
4.8
5.0
5.2
5.4
5.6
5.8
6.0
6.2
6.4
6.6
pH
Limestone road
Pasture
Field 1
Field 2
Field 3
4.6
4.8
5.0
5.2
5.4
5.6
5.8
6.0
6.2
6.4
6.6
pH
Take Home Points:
• Get to know your soil
– Take soil tests
– Set realistic goals
• Nitrogen is not easily retained in the soil and should be added just before times of greatest need
• P and K levels can be built up in the soil
• Nutrients must be replaced
• Legumes can save you N fertilizer costs
– Weed control should be considered prior to overseeding
Take Home Points:
• Manures are a good source of fertilizer and
organic matter
– Be cautious of excessive P levels
– Nutrient levels vary with different sources
– Help improve overall soil heath
The End
Recommended