HAVE UK EARNINGS DISTRIBUTIONS POLARISED?
Craig Holmes and Ken Mayhew
INET Oxford Working Paper no. 2015-02
Employment, Equity and Growth programme
Have UK earnings distributions polarised?
Craig Holmesa and Ken Mayhewb
a Pembroke College, University of Oxford.
b Department of Education, University of Oxford and Pembroke College, Oxford.
Abstract
The occupational structure of many labour markets has shifted away from middle
earning routine work (Goos and Manning, 2007). This polarisation phenomenon
raises the question about the consequences for earnings distributions – a polarised
workforce should be, all things being equal, increase the incidence of high pay and
low pay and raise earnings inequality. However, if the wage structure changes, the
implications are less clear. This paper examines earnings data in the UK between
1987 and 2012 and argues that recent occupational shifts do not necessarily lead to a
polarisation of earnings.
Keywords
Polarisation; occupational structure; earnings distributions; low pay; demand for high
skills
JEL classification
J31 - Wage Level and Structure; Wage Differentials;
J21 - Labor Force and Employment, Size, and Structure
J24 - Human Capital; Skills; Occupational Choice; Labor Productivity

Have UK earnings distributions polarised?
1 Introduction
This paper considers two widely discussed developments in the UK over the last three
decades. The relationship between the two of them is ill-understood and we attempt
to fill the gap. The first development concerns the dispersion of earnings. From the
mid-1970s until the mid-1990s there was a significant widening of this dispersion.
The period since then has seen the bottom and top deciles improve their positions
relative to the median but relatively little change other than that. The second
development concerns the alleged polarisation or “hollowing out” of the labour
market – the growth of top-end and bottom-end occupations at the expense of the
middle.
The first point to emphasise is that in demonstrating the hollowing out phenomena, a
wide number of studies have followed a similar methodology whereby they rank
occupations by their relative median or mean earnings at the beginning of the period
under consideration and assume that this ranking remained unchanged. We show that
if the wage structure – that is, the distribution of earnings associated with particular
characteristics – could be held constant in this way, then changes in the occupational
composition of the labour force would have pushed workers away from the middle of
the distribution towards the upper and lower tails. Moreover, other compositional
changes, such as the increase in educational attainment or the decline of union
membership, would similarly lead to a polarisation within wage distributions and a
rise in earnings inequality.

However, we then show that changes in the wage structure – both in terms of the
relative pay conditions of different groups of workers and the variance of earnings
within these groups – have tended to act against this. In particular since the middle of
the 1990s, this second effect has entirely offset compositional changes, the
consequence being that wage dispersion and inequality has varied little since this
point. Hence, our analysis points to a breakdown in the relationship between
hollowing out in terms of occupational change and hollowing out in terms of pay
outcomes.
The paper is set out as follows. In section 2 we review the literature on hollowing out,
and discuss the theoretical connection between occupational structure and wage
distributions. Section 3 presents a decomposition of UK earnings distributions since
1987, based on an approach suggested by Firpo, Fortin and Lemeiux (2009). In
section 4, we illustrate what these changes have meant for wages within the growing
non-routine occupations, particularly at the top end. UK skills policy is centred on the
notion that there remains “room at the top” (HM Government, 2011), where the
growing employment shares of good non-routine jobs offers opportunities for
increasingly well-educated new labour market entrants and those existing workers
who improve their human capital through returning to education and training. Our
analysis shows this is not the case – many well qualified individuals in good, non-
routine jobs experience wages much closer to the middle of the earnings distribution,
particularly over the past decade. Section 5 concludes.
2 Polarisation and wage distributions
Technological change has long been thought of as a key driver of occupational change
and earnings inequality. Proponents of skill-based technical change (SBTC) have

argued that as the level of technology improves, demand will increase for high skilled
labour and fall for low skilled labour. The routinisation hypothesis, attributed to
Autor, Levy and Murnane (2003), is a refinement of this idea. It argues that while
demand for skills has increased on average during the past few decades, technology
was related to the particular tasks performed by workers, rather than directly the skill
levels of those workers. Jobs which predominantly performed routine tasks were
replaced by new technology whilst those which performed non-routine task were not
and in many cases were complementary to new technology. This is known as task-
biased technical change. Non-routine work falls into two categories – high wage, high
skilled (or “lovely”) jobs, where the tasks performed could largely be classified as
non-routine abstract or creative, or low wage, low skill (or “lousy”) jobs, where the
tasks could be considered non-routine manual or service (Goos and Manning, 2007).
Routine jobs, by contrast, tended to be middle wage, such as process operatives in
manufacturing and some administrative jobs.
To illustrate this shift in the occupational structure, Goos and Manning examined
changes in employment shares between 1979 and 1999 in the UK for jobs – defined
as occupation-industry pairs – ranked by their initial median wage in 1979 as a
measure of the each job's quality or skill level. They find that there has been
employment growth for jobs at the top and bottom of this pay spectrum and sizeable
falls around the middle. Similar falls in the employment share of middle-ranked jobs
has been found in numerous other countries, including the US (Autor, Katz and
Kearney, 2006; Caranci and Jones, 2011) Germany (Spitz-Oener, 2006; Oesch and
Rodríguez Menés, 2011), Spain and Switzerland (Oesch and Rodríguez Menés, 2011)
and across Europe (Goos, Manning and Salomons, 2009). Goos and Manning called
this “polarisation”, while others have referred to this as the development of the

hourglass labour market (Nolan, 2004; Anderson, 2009). The idea has subsequently
been taken seriously by policymakers (BIS, 2013).
As work shifts away from routine occupations to non-routine occupations, we would
expect there to be an effect on earnings distribution. Figure 2.1 shows the distribution
of gross hourly earnings in the 1987 FES data. It also shows how these earnings are
distributed amongst routine and the two non-routine groups, weighted to reflect their
relative size. Holding everything else constant, the pure compositional change from
routine to non-routine work would lead to a decline in work around the middle
(particularly in the region around the median earning of £3.44/hour) and an increase
of both low-paid and high paid work as the weighting of the non-routine distributions
on the overall distribution increased. As a result, earnings dispersion should increase. 1
FIGURE 2.1 AROUND HERE
In the UK (prior to the 2008 recession), there have been two distinct periods of
changes to earnings dispersion – the period from the late 1970s to the mid-1990s,
where wage inequality increased across the entire distribution, and the period since
the mid 1990s, where wage inequality mostly plateaued (ONS, 2012), except for
higher wage growth in the lowest-paying jobs and the very top of the distribution.2
This has led to a change in the proportion of people in low, middle and high paying
jobs, as shown in table 2.1. The majority of the change happens between the early
1980s and the mid 1990s.
1 It is common to define a low-‐paid job relative to the current median wage – typically, low-‐paid work is any job earning below two-‐thirds of the median wage (Lloyd, Mason and Mayhew, 2008). Therefore, if the gap between the median and lower percentiles grows, more of the distribution will fall into this category. Similarly, we could define high-‐paid work as a multiple of the median wage. Again, if earnings above the median move away from the median, more of the distribution would be classified as high-‐wage. 2 This pattern continued after 2007, albeit with all percentiles experiencing a fall in real wages except for those at the extremes of the distribution.
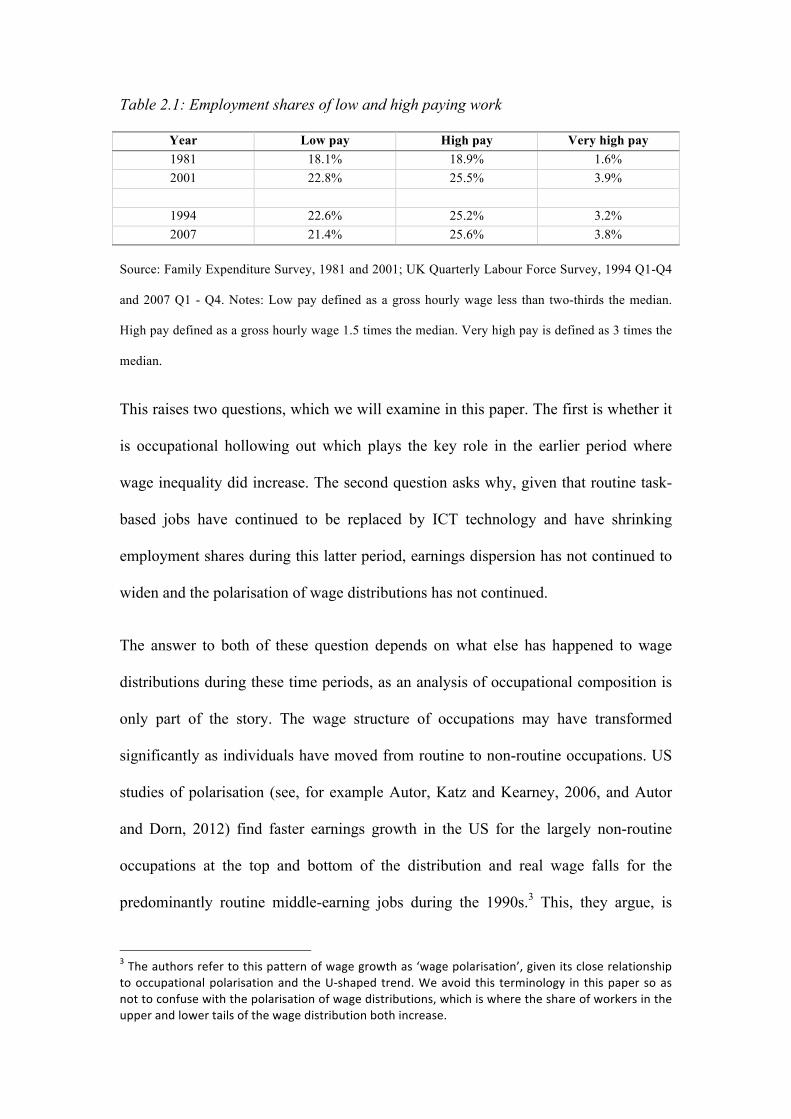
Table 2.1: Employment shares of low and high paying work
Year Low pay High pay Very high pay 1981 18.1% 18.9% 1.6% 2001 22.8% 25.5% 3.9%
1994 22.6% 25.2% 3.2% 2007 21.4% 25.6% 3.8%
Source: Family Expenditure Survey, 1981 and 2001; UK Quarterly Labour Force Survey, 1994 Q1-Q4
and 2007 Q1 - Q4. Notes: Low pay defined as a gross hourly wage less than two-thirds the median.
High pay defined as a gross hourly wage 1.5 times the median. Very high pay is defined as 3 times the
median.
This raises two questions, which we will examine in this paper. The first is whether it
is occupational hollowing out which plays the key role in the earlier period where
wage inequality did increase. The second question asks why, given that routine task-
based jobs have continued to be replaced by ICT technology and have shrinking
employment shares during this latter period, earnings dispersion has not continued to
widen and the polarisation of wage distributions has not continued.
The answer to both of these question depends on what else has happened to wage
distributions during these time periods, as an analysis of occupational composition is
only part of the story. The wage structure of occupations may have transformed
significantly as individuals have moved from routine to non-routine occupations. US
studies of polarisation (see, for example Autor, Katz and Kearney, 2006, and Autor
and Dorn, 2012) find faster earnings growth in the US for the largely non-routine
occupations at the top and bottom of the distribution and real wage falls for the
predominantly routine middle-earning jobs during the 1990s.3 This, they argue, is
3 The authors refer to this pattern of wage growth as ‘wage polarisation’, given its close relationship to occupational polarisation and the U-‐shaped trend. We avoid this terminology in this paper so as not to confuse with the polarisation of wage distributions, which is where the share of workers in the upper and lower tails of the wage distribution both increase.
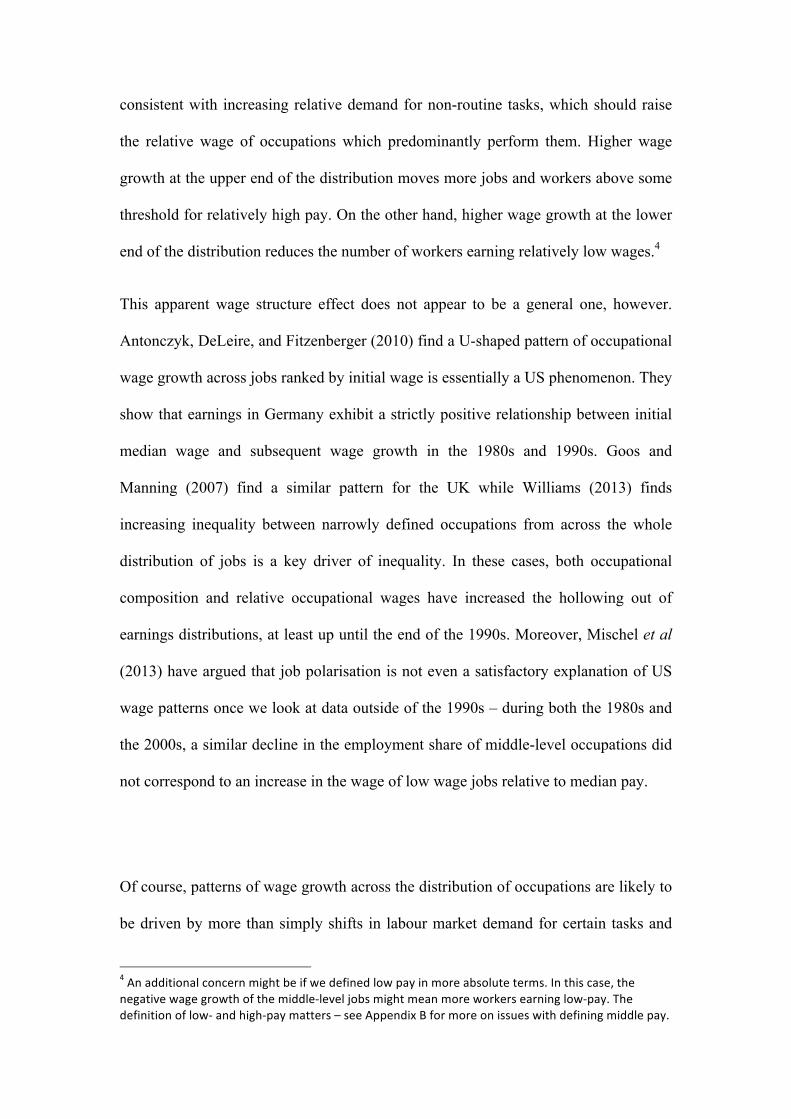
consistent with increasing relative demand for non-routine tasks, which should raise
the relative wage of occupations which predominantly perform them. Higher wage
growth at the upper end of the distribution moves more jobs and workers above some
threshold for relatively high pay. On the other hand, higher wage growth at the lower
end of the distribution reduces the number of workers earning relatively low wages.4
This apparent wage structure effect does not appear to be a general one, however.
Antonczyk, DeLeire, and Fitzenberger (2010) find a U-shaped pattern of occupational
wage growth across jobs ranked by initial wage is essentially a US phenomenon. They
show that earnings in Germany exhibit a strictly positive relationship between initial
median wage and subsequent wage growth in the 1980s and 1990s. Goos and
Manning (2007) find a similar pattern for the UK while Williams (2013) finds
increasing inequality between narrowly defined occupations from across the whole
distribution of jobs is a key driver of inequality. In these cases, both occupational
composition and relative occupational wages have increased the hollowing out of
earnings distributions, at least up until the end of the 1990s. Moreover, Mischel et al
(2013) have argued that job polarisation is not even a satisfactory explanation of US
wage patterns once we look at data outside of the 1990s – during both the 1980s and
the 2000s, a similar decline in the employment share of middle-level occupations did
not correspond to an increase in the wage of low wage jobs relative to median pay.
Of course, patterns of wage growth across the distribution of occupations are likely to
be driven by more than simply shifts in labour market demand for certain tasks and
4 An additional concern might be if we defined low pay in more absolute terms. In this case, the negative wage growth of the middle-‐level jobs might mean more workers earning low-‐pay. The definition of low-‐ and high-‐pay matters – see Appendix B for more on issues with defining middle pay.

occupations. Therefore, even if it were true that changes in demand for different tasks
and occupations alters the relative wages of routine and non-routine jobs in a similar
way across countries or over time, observed occupational pay is also determined by a
long list of other factors. Some factors relate to the characteristics of the workers in
these different occupations, and the way these alter over time. For example, the falling
relative wages of middle-level jobs in the US could be equally well explained by
diminishing union power if collective bargaining was largely related to middle-skilled
occupations – as membership stabilises at the new lower levels, observed fall in the
relative wage of middle skilled occupations wages should be less pronounced.
Similarly, occupations may experience faster wage growth if educational attainment
increases and workers have extra skills which can be deployed. Goos and Manning
(2007) suggest that lower levels of education and skills of UK workers might explain
why low-end jobs there did not experience rising wages like the US did in the 1990s.
An alternative hypothesis could suppose that skills demands, rather than skill
supplies, within similarly-classified occupations may vary between different countries
depending on how employers design these jobs.5
We also need to consider the way different individual characteristics correspond to
pay over time. Decreasing gender-pay gaps should, everything else being equal,
reduce the number of low-paid workers and (potentially) increase the number of high
paid workers, as females begin to receive wages equivalent to their male counterparts.
Measured wage premia to skills have remained relatively constant over the past two
decades, despite a rising supply of well-qualified workers (Walker and Zhu, 2008),
however, there is evidence of increasing heterogeneity in these returns, with the 5 Some evidence for this was found in Gautié and Schmitt (2010), where Danish food process operatives appeared to have much more highly skilled jobs than their counterparts in the UK, the US or Germany. However, across many occupations there was little variation in job design across similarly categorised low-‐paying jobs.

bottom deciles of the graduate workforce experiencing falling premia and the very
upper end experiencing rising premia (Green and Zhou, 2010). The effect here would
be to reduce the wages of those we would have expected to be higher paid (based on
their education), which should reduce polarisation in the earnings distribution.
We also need to consider the possibility that the content of occupations changes over
time, and not always in a way consistent with the notion of upgrading. Brown, Lauder
and Ashton (2011) have recently discussed how the market for skilled labour,
particularly graduates, has been affected by a number of demand-side phenomena.
Firstly, many jobs that would have previously described as high skilled and non-
routine have, given changes in technology, become deskilled and routinised (a process
they call “digital Taylorism”). This allows employers to relocate jobs with relative
ease so as to take advantage of the huge increase in the global supply of graduates.
Deskilling and increased competition will both tend to lower skill premia. In many
cases this has happened at the same time as the proportion of graduates in these jobs
has increased. The implication of this is that earnings are being shaped by
characteristics of the job, rather than the individual’s observable human capital.6
The last aspect we need to consider is the policy environment. A range of policies
may affect the distribution of wages directly, including low-wage protection
legislation. The UK only implemented a minimum wage at the end of the 1990s,
whereas state and federal minimum wages have existed in the US for a far longer
period of time, the alteration of which should have an impact on wage growth for the
lowest earners.
6 In this sense, it is closely related to Thurow’s (1975) job queue model, where pay is determined by the design and characteristics of a job, and education acts to allocate individuals into training places for that job.

To consider this large array of possible effects, we present a decomposition of
changes in UK earnings distributions drawing upon a methodology employed by
Firpo, Fortin and Lemieux (2009). This paper aims to illustrate the effect that job
polarisation has had on earnings distributions in the UK separate from other factors
that have helped to shaped them over the past three decades. In doing so, it looks to
understand why wage inequality plateaued from the mid-1990s onwards, despite the
continued decline of middle-level jobs.
3 UK earnings distributions: a decomposition
3.1 Methodology
This section describes our approaching to analysing the UK’s distribution of earnings.
We employ the unconditional quantile regression approach described by Firpo, Fortin
and Lemieux (2009). Standard quantile regression techniques estimate the particular
point of a distribution conditional on an array of explanatory variables. However,
while OLS regressions can be aggregated to produce an unconditional measure of the
population mean (which can then be decomposed in the standard Blinder-Oaxaca
way), conditional quantile regressions do not have this same property. Consequently,
there is no easy way of looking at how the distribution of a given explanatory variable
affects the overall shape of a distribution, hence the need for more sophisticated
techniques. Firpo, Fortin and Lemieux’s decomposition has previously been applied
to US earnings data (Firpo, Fortin and Lemieux, 2011). To our knowledge, this
decomposition has not previously been applied to UK earnings distributions.
We provide a brief overview of the approach below. Firstly, we estimate a
counterfactual distribution where the composition of the labour force changes as it
would have in the final distribution but the wage structure remains the same as in the
initial distribution. This is achieved by reweighting the initial period earnings data to
reflect how each possible combination of the wage drivers – education, occupation,
union status, and so on - changed over that time.
If T = {0, 1} indicates whether an observation comes from the initial or final
distribution, X is the set of explanatory variables and YT is the set of wages observed
in period T then, the counterfactual distribution function is estimated as:
( ) ( ) ( )( )⎟
⎟⎠
⎞⎜⎜⎝
⎛
−=<=
XpXpxXyYIEyFC 1
|0 (1)
where p(x) = Pr (T = 1|X = x), which is estimated by a logistic regression of T on the
explanatory variables X. For example, if there are ten people in initial distribution
with a set of characteristics, x, where two of those people have a wage less than y, and
if there are twenty people with the same characteristics in final distribution, then we
would expect four of them to have a wage less than y. Thus, each observation from
initial distribution where the individuals have the set of characteristics x and an
income less than y is reweighted by 20/10. Following the process for all possible
incomes and characteristics defines the counterfactual distribution.
We are then interested in estimating particular points on each of our distributions. The
change of a distributional statistics of a distribution F, v(F), can be expressed:
( ) ( ) ( ) ( )CW
CC
vvFvFvFvFvv
Δ+Δ=
−+−=Δ 01 (2)
where the subscripts on the distributions denote the final, counterfactual and initial
distributions respectively, and ΔvW and ΔvC are the wage and compositional effect. To
decompose the overall compositional and wage effects, we use recentered influence
functions (RIF), which measure the robustness of distributional statistics to each

particular observation, y. A RIF value is calculated for each observation in the dataset,
for each percentile we would like to analyse.7 These can be then approximated as a
linear combination of the explanatory variables using a simple OLS regression, giving
a set of coefficients γT.
Firpo, Fortin and Lemeiux then show that the expectation of a recentered influence
function for a given set of data equals the underlying distributional statistic, meaning
than the each percentile can be expressed as a linear combination of the mean values
of the explanatory variables (where each mean value is multiplied by the
corresponding coefficient in the set γT). From this point, the analysis is identical to
the Blinder-Oaxaca decomposition of the mean. In particular, these coefficients can
be used to decompose the wage and composition effects:
( )( )CW TXEv γγ −==Δ 11| (3)
( ) ( ) 00|1| γγ =−==Δ TXETXEv CC (4)
Moreover, if the conditional expectation of the RIFs is truly linear, rather than just as
an approximation, then γ0 = γC, which simplifies equation (6):
(5)
The two terms now resembles the composition and wage structure effects in the
Blinder-Oaxaca decomposition of the mean.
7 The RIF of a percentile τ for an observation y is defined as:
)(
)(100);(
τ
τ
ττ
τ
qf
qyqqyRIF
<−+=
I
( ) ( )( ) 00|1| γ=−==Δ TXETXEvC

3.2 Data
For this analysis, we use two UK wage and employment datasets to analyse changes
to earnings distributions between 1987 and 2012: the Family Expenditure Survey
(FES) and the UK Quarterly Labour Force Survey (LFS). We break the LFS data
down into the period 1995-2007 and 2007-2012 and predominantly focus our analysis
on the pre-recession period. However, at the end of this section we briefly discuss
changes in wage distributions during the Great Recession and subsequent recovery.
The FES survey has data on earnings going back as far as 1958. However, we use data
between 1987 (as the first to include detailed occupational information) and 2001,
when the survey was retired. The survey covered around 10,000 respondents each
year. Hourly wages are calculated from usual gross pay and usual hours of work.
Educational attainment is measured using the age when last in full time education.
Following Gosling, Machin and Meghir (2000), we divide this into four groups, based
on typical leaving ages – degree (or higher), post-compulsory schooling, completed
compulsory schooling and no education/qualification . Union membership came from
the accompanying household income data in the FES – individuals who reported a
deduction for union dues as counted as members. This likely underreports actual
membership as workers may pay membership fees in other ways, and patterns of
payment method may change over time. Bell and Pitt (1998) have discussed this
previously and conclude that the measure is reliable and that any biases should be
small.
The LFS collects data (annually until 1992, then quarterly) from a large sample of UK
households. Participant households remain in the survey for five quarters. Earnings
questions were only introduced into the LFS in 1992, and initially household were

only asked for their wages in the final quarter. In more recent studies, they are asked
in their first and last survey. Gross hourly pay is directly reported in the data. We
combine four quarters of wage data from each of 1994 and 2007. Educational
attainment is measured by highest qualification achieved. We divide this into 6 groups
– degree (or higher), other higher education, post-compulsory school qualifications,
completed compulsory schooling qualifications, other qualifications (typically low
level certificates such as Key Skills) and no qualifications. Union membership is
directly reported in the LFS.
3.3 Job classifications
In Goos and Manning’s analysis, jobs were defined as pairs of an occupation and an
industry. As we are unable to use the larger New Earnings Survey (NES) and Annual
Survey of Hours and Earnings (ASHE) data that they use – largely because it does not
include key explanatory variables such as educational attainment – such a fine-
grained analysis of jobs would be impossible. Instead, we focus purely on
occupations. Occupations are recorded using the available occupational coding in
each survey. One problem with doing this over a long period of time is that the system
of coding occupations has changed three times since 1980. Occupational data from
the 1980s uses the KOS (Key Occupations for Statistical Purposes) system of job title
classification, which categorises occupations within the 18 CODOT (Classification of
Occupation and Directory of Occupational Titles) major groups, while data from the
1990s uses SOC90 and data from the past decade uses SOC the SOC2000
classification. The SOC2000 coding system of occupations has a four level
classification system, from major group (first digit) to unit group (fourth digit).
To make data from the 1980s comparable between years, a conversion system was
derived between KOS and SOC2000 codes, using the descriptions of occupations
provided for each group. A similar conversion was created between SOC90 and
SOC2000, although there was far more overlap in terms of the descriptions of each
category than between KOS and SOC. A conversion was made from each KOS or
SOC90 occupation to a 4-digit SOC2000 category, where descriptions were on a
similar level of aggregation. These were then reduced into 3-digit categories which
are used in the analysis.
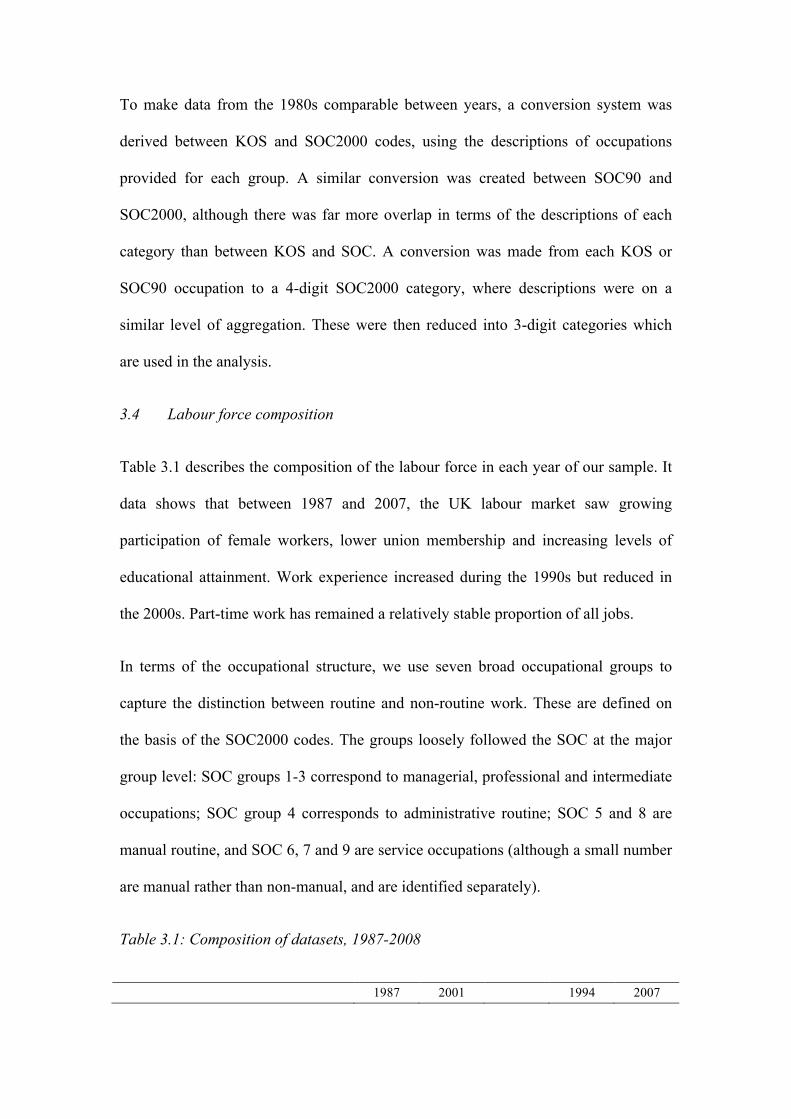
3.4 Labour force composition
Table 3.1 describes the composition of the labour force in each year of our sample. It
data shows that between 1987 and 2007, the UK labour market saw growing
participation of female workers, lower union membership and increasing levels of
educational attainment. Work experience increased during the 1990s but reduced in
the 2000s. Part-time work has remained a relatively stable proportion of all jobs.
In terms of the occupational structure, we use seven broad occupational groups to
capture the distinction between routine and non-routine work. These are defined on
the basis of the SOC2000 codes. The groups loosely followed the SOC at the major
group level: SOC groups 1-3 correspond to managerial, professional and intermediate
occupations; SOC group 4 corresponds to administrative routine; SOC 5 and 8 are
manual routine, and SOC 6, 7 and 9 are service occupations (although a small number
are manual rather than non-manual, and are identified separately).
Table 3.1: Composition of datasets, 1987-2008
1987 2001 1994 2007

Female 47.3% 50.3% 50.7% 52.1% Union membership 29.0% 15.3% 36.9% 31.5% Works part-time 23.6% 23.3% 26.3% 26.6% University graduates 9.4% 16.9% 13.4% 23.4% No qualifications 36.1% 18.6% 17.2% 8.3% Experience < 5 years 11.9% 9.4% 7.7% 8.2% Experience > 20 years 49.1% 53.5% 57.8% 53.8% Professional 11.2% 12.8% 11.9% 14.4% Managerial 7.3% 11.7% 12.5% 14.9% Intermediate 10.1% 13.7% 14.0% 15.8% Manual Routine 36.1% 26.4% 26.9% 19.9%
12.2% Admin Routine 19.7% 15.2% 14.7% Manual Non-routine 1.8% 0.8% 0.9% 1.1% Service 13.8% 19.4% 17.9% 21.7%
N 7253 5908 32355 54098 Source: Family Expenditure Survey, 1987 and 2001; UK Quarterly Labour Force Survey, 1994 Q1- Q4 and 2007 Q1 – Q4. Note: FES records year of leaving full time education rather than qualification. Qualification level is inferred from this information. Part-time is defined as typically working less than 30 hours per week in the FES data, and is self-reported in the LFS data. Experience is defined as age minus year left full-time education
Some jobs within each major SOC group did not quite fit with others in terms of their
changing employment share or level of earnings, and were reallocated to different
occupational groups. For example, based on LFS employment data between 1981 and
2008, draughtsmen – a SOC group 3 occupation – had a falling employment share.8
Similarly, administrators in government – a SOC group 4 occupation – has grown in
employment share since 1981 and typically commanded a median wage far above that
observed for other administrative workers. The final groupings are shown in the table
in the Data Appendix.
3.5 Aggregate composition and wage structure effects
We now present the results of the decomposition of the two distributions. We first
estimate the counterfactual distribution by reweighting the initial distributions (1987
8 The O*NET database shows that architectural drafters score highly on a number of routine task categories, such as manual dexterity and arm-hand steadiness. It might be that computer-aided design technology has reduced the need for these tasks to be performed by labour.

and 1994), as in equation (1). Figure 3.1 and 3.2 show the total decomposition given
by equation (2) for each distribution.
FIGURES 3.1 AND 3.2 AROUND HERE.
This analysis shows that changes in the composition of the workforce increased wage
inequality across both time periods. There is effectively a positive relationship
between percentile and wage growth, meaning that compositional shifts also acted to
increase low wage and high wage work. In terms of the polarisation of these
distributions, Table 3.1 shows how the proportion of high and low-wage workers
changed in our data across the three distributions. Between 1987 and 2001, the
incidence of middle wage work fell by around 5.0% as both low-paying work and
high paying work grew. However, the compositional effects alone account for an
increase of 7.5%, meaning changes in the wage structure have reduced the extent of
polarisation. This is even starker when looking at the LFS data. Composition effects
alone would have reduced middle-wage work by 4.7%. During this time, particularly
due to a slight fall in low-wage work, middle-wage jobs actually increased by 0.6%.
Figures 3.1 and 3.2 show why this is the case – changes in the wage structure over
these time periods have compressed earnings distributions. This effect is relatively
mild during the 1987-2001 period, but is much more strongly observable between
1994 and 2007.
Table 3.1: Incidence of low paying and high paying work
Year Jobs earning below 2/3 * median hourly wage
Jobs earning above 1.5* median hourly wage
Initial (1987) 20.2% 23.4% Counterfactual (composition effects only) 24.0% 27.1% Final (2001) 23.0% 25.6% Initial (1994) 22.6% 25.2% Counterfactual (composition effects only) 25.2% 27.3%

Final (2007) 21.3% 25.9%
Source: Family Expenditure Survey, 1987 and 2001; UK Quarterly Labour Force Survey, 1994 Q1-Q4
and 2007 Q1 - Q4.
3.6 Influence of individual covariates
The second stage of the decomposition estimates the contribution to change in the
earnings distribution that can be attributed to each explanatory variable. We estimate
a RIF regression, as discussed above, for each vigintile and use equation (5) to
calculate the individual covariate composition effects. Figures 3.3 and 3.4 show this
for the FES and LFS data respectively.
FIGURES 3.3 AND 3.4 AROUND HERE.
The Figures show that the increasing inequality and polarisation that could be
attributed to compositional changes are not solely due to the shift in the occupational
structure. The increase in educational attainment and the decline in union membership
(given the initial return on education and the union wage premium) have also acted to
push workers away from the middle. Using the change in the 90-10 ratio, Table 3.2
shows that the shift toward non-routine occupations account for around 25-40% of the
increase in inequality and polarisation in the counterfactual distributions. Increasing
educational attainment and the decline of unions also play a role, although union
density makes little difference using the LFS data. Other included factors, such as
gender, part-time work and labour market experience, complete this breakdown but
have a relatively minor effect.
Table 3.2: Change in wage dispersion by compositional effects
1987-2001 1994-2007 Education 5.7% 6.6%

Occupation 6.3% 3.4% Union 2.7% 0.7% Other 0.7% 1.3% Total 15.4% 12.1%
Source: Family Expenditure Survey, 1987 and 2001; UK Quarterly Labour Force Survey, 1994 Q1-Q4
and 2007 Q1 - Q4.
Next, we turn to the wage structure effects, and in particular, we want to know why
these changes have partial or fully lowered inequality and reduced polarisation. These
are given in Figures 3.5 and 3.6.
FIGURES 3.5 AND 3.6 AROUND HERE
The Figures show that occupational group and gender wage differences have had
sizeable effects on the change in the earnings distribution. In both periods, there has
been a reduction in male-female wage differentials (holding everything else constant),
particularly affecting lower earners, which has lead to faster wage growth within the
low to middle end of the distribution relative to the top. In contrast, differences in
wages between the occupational groups have largely acted to increase wage
dispersion. Figure 3.7 and 3.8 further decomposes the occupation wage structure line
into separate occupational groups in each time period.
FIGURES 3.7 AND 3.8 AROUND HERE
Increasing wage differences between non-routine occupations and the administrative
routine reference group pushed more individuals into higher pay and increased
earnings inequality in both periods. At the lower end, the picture is less clear in the
FES data, however, the LFS data shows higher wage growth at the low end can be
attributed to occupation wage differences – in particular, the increasing relative wages
for low-skill non-routine service occupations. What this means is that when we look

at occupations separately, we are able to find evidence consistent with the U-shaped
occupational earnings growth that some earlier studies point to in the US (Autor, Katz
and Kearney, 2006; Autor and Dorn, 2012). In those studies, the U-shaped pattern of
earnings growth was observed at the aggregate level, leading the authors to conclude
that increased demand for non-routine occupations at both ends of the distribution was
the main driver. This has been previously thought of as a US-only phenomena, as
most other countries have tended not to have U-shaped patterns of wage growth.
Using the RIF decomposition approach, we are able to show that increasing relative
wages in non-routine occupations at both ends of the distribution have been a feature
of the UK labour market since the 1990s, but that this effect has been concealed at the
aggregate level by all the other factors that affect the overall distribution of wages.
By comparison, the parts of the wage structure that relate to education and union
membership have a much smaller effect in changing earnings patterns over either time
period overall. This decomposition does allow us to examine how wage differences
between different educational levels have filtered through into the earnings
distribution. As these are defined relative to a particular level of education (those
completing compulsory schooling), there are parallels between these distributional
effects and conventional education earnings premia that reflect differences in mean
earnings. Figures 3.9 and 3.10 show the changes in the wage structure of university
graduates and non-graduates with post-compulsory education and schooling.
FIGURES 3.9 AND 3.10 AROUND HERE
During the period from 1987 to 2001, the only real change in relative graduate
earnings was observed at the very top. It is worth noting that the FES educational data
is based on years of schooling and is consequently a noisy proxy for educational
attainment. In the LFS data, which uses specific qualification measures, an interesting
picture emerges. Relative pay of those with some form of post-compulsory education
drives up wages of the better paid compared to those lower down the distribution –
this is consistent with a straightforward increasing demand for skilled labour story.
However, we do not find the same pattern for graduates – instead, there has been
falling relative wages of many graduates pulling down the overall earnings
distribution around the middle to upper part of the distribution. This means that as the
number of graduates has increased, a larger proportion received more middling levels
of pay than we would have previously expected based on the earlier distribution of
graduate outcomes. This is consistent with other evidence that the “graduate
premium” in the UK is becoming more variable (for example, Green and Zhou, 2010)
None of these relative wage effects really explain why earnings inequality has not
increased by as much as we might have expected based on the composition changes
within the labour force – gender pay gaps and the increased relative pay of service
occupations do to a limited extent, but educational and occupational pay differentials
act in the opposite direction and have pushed towards increasing inequality and
greater polarisation within wage distributions. Figure 3.5 and 3.6 show that it is
changes in the constant term of each RIF regression that most accounts for higher
wage growth at the low end and lower wage growth (or wage falls) for the top end,
compressing the earnings distribution. This pattern is somewhat more volatile in the
FES data, but in the LFS data, it appears to be the main driver the negative
relationship between percentile and wage structure effect.9
9 A regression of the total wage structure effect on the change in the constant term has a R2 = 0.661. Including the occupational wage effect explains 91.2% of the variation in the total wage structure effect. Education, union and gender do not add any statistically significant explanatory power.

The constant terms picks up any and all changes in elements of the wage structure that
apply to the different characteristics of the reference group, against which all other
effects are estimated in relation to. For our regressions, this group consisted of non-
union males who had completed compulsory education only, worked for between 5-
10 years and were currently employed in an administrative routine occupation. Policy
shifts could also be observed in changes to the constant term, so one factor that almost
certainly played a role here in increasing wage growth for the lowest parts of the
distribution is the introduction of the National Minimum Wage in 1999. Increases in
total factor productivity (rather than specific increases in productivity associated with
more skills or the performance of occupational tasks) also comes in here, and would
represent a uniform shifting out of the distribution.
We believe that changes in the constant term can be most sensibly thought of
correcting over or under predictions of wage growth coming from elsewhere in the
analysis. In the case of the UK between 1994 and 2007, it shows that once we have
allowed for changes in the relative earnings of different groups of workers, the overall
level of pay is not as high as we might have expected it to be on the basis of the new
composition of the workforce. In particular, characteristics which tend to lead to
higher pay end up being less rewarding than they had previously been, compressing
pay at the top of the distribution and reducing inequality.
We illustrate this with a plausible, simplified example. Suppose, that there was an
increase in the proportion of graduates in the labour market, but that these graduates
simply displaced non-graduates in existing jobs, leaving the overall distribution of
wages unchanged. Compositional effects on their own would predict rising inequality
as historically graduate earnings distributions have a greater spread. Wage structure

effects relating to having a degree might not change all that much – new graduates
earn systematically lower as they go into non-graduate occupations, but they displace
non-graduates to presumably lower paying jobs, so the differential between the two
groups is maintained. However, the distribution of absolute wages of the reference
group (and hence all other groups whose pay is compared to them) have shifted and
compressed downwards, which would be picked up by the constant term in our
regressions. This essentially ‘corrects’ what would otherwise be the prediction in the
model that an increase in the number of graduates increases inequality.
Obviously, our results cannot be interpreted as saying that this is actually the process
underlying the distributional outcomes we have observed. However, they certainly
have more in common with this sort of story than with the typical policy narrative
around increasing skills and education being key to reducing inequalities by increase
access and competition in the best paying parts of the labour market. If this were the
case, we would expect to see the wage structure effects related to education or higher
skill occupations increasing wage growth around the middle relative to the top.
Instead we see the opposite where both occupational and educational wage
differentials contribute towards rising wages at the top relative to the middle
(everything else being equal).
4 Further results
In this section we first apply the same approach discussed in the previous section to
different subsamples of the LFS data – we consider males and female outcomes and
then graduates. We do this instead of including a large number of interaction terms in
the earlier regressions. We focus only on the later time period due to the smaller
sample size of the FES data. Following on from that, we include variables for

industrial composition. Finally, we consider what has happened since the start of the
global financial crisis in 2007 and during the subsequent recession and recovery.
4.1 Gender
Thus far, we have only considered gender effects on wage distributions as a
standalone variable. The compositional effects related to gender – i.e. increased
female participation – have a negative effect on wage inequality, while the wage
effect – i.e. the narrowing of gender pay gaps – have a more positive effect as they
appear to have narrowed more in the lower to middle part of the distribution. In this
section we look at female and male earnings distributions separately to see whether
there are important interactions between gender and the other variables that affect
earnings distributions.
FIGURE 4.1 AROUND HERE
Figure 4.1 shows that overall wage growth for women was higher than for men over
this time period, particularly in the middle 90% of the distribution. Figure 4.2 then
shows that compositional effects run in the same direction for both men and women –
the shift in occupations, education and other factors have acted to increase pay
differentials and the polarisation of wage. However, the magnitude of these effects on
wage growth is larger for women at all points of the distribution, suggesting
compositional shifts have been less towards aspects of work which lead to low pay
and more towards factors which have a significant benefit to pay levels. In particular,
the shift towards low-skill service occupations for women is more muted than it is for
men, while the historic return on possessing higher qualifications is larger.
FIGURE 4.2 AROUND HERE

Figure 4.2 also shows the wage structure effects, and here the patterns are different. In
particular, while women have the downward sloping, inequality reducing effect we
saw for the labour force as a whole, for men the line flattens and begins to increase
again, suggesting wage structure effects have increased rather than decreased
inequality and the polarisation of wages within the male labour market.
Given our earlier interpretation of a downward wage structure effect line implying
that characteristics that typically lead to higher pay levels are less well rewarded at the
end of the period we had previously thought, this suggests that women have been
more adversely affected by this than men. Further evidence for this comes from
looking at individual wage structure effects for men and women associated with
having a professional or managerial occupation or possessing a degree, as shown in
Figure 4.3 For women, changes in the wage returns to these characteristics (relative to
the reference group) are zero or negative across most of the distribution, ticking
upwards slightly only for the top earning women. For men, the wage payoffs for
possessing these characteristics are larger and are positive for a wider range of
workers. Most notably, the falling “graduate premia” found in section 3 appears to
apply only to women.
Overall, women have benefitted from shifting towards higher skill occupations or
spending longer in education across the distribution as a whole – during this time
period the proportion of women in low-wage work fell from 30.0% to 29.9%, while
the proportions in high pay increased from 17.5% to 20.7%. Despite this, in the upper
part of the distribution they have not been as well rewarded relative to their male
counterparts. This supports previous studies which find a ‘glass ceiling’ effect for

women in the UK and other European countries (Arulampalam et al, 2007;
Christofidesa et al, 2013).
FIGURE 4.3 AROUND HERE
4.2 Graduate labour markets
The analysis in section 3 suggested that the shift towards greater graduate shares of
employment has accompanied an increase in wage inequality with the graduate labour
market. In this sub-section we explore a couple of reasons why graduate earnings this
might be the case. Figure 4.4 shows how the composition of graduate work in terms a
type of occupation has predictably widened the range of graduate wage outcomes. In
particular, the increase in the relative share of graduates in low skilled service
occupations as the share of graduates in professional occupations has fallen would
have, everything else being equal, lead to drop in wages of between 5 and 7% for the
bottom half of the graduate workforce.
FIGURE 4.4 AROUND HERE
Graduate wages have also become more variable due to changes within occupations,
as shown in Figure 4.5. In particular, the higher skilled occupations – professionals,
managers, associate professionals and technicians – have become increasingly
segmented. Specifically, wages for the bottom third of graduates have been
significantly lowered owing to changes in the wage structure of the higher skilled
occupations, while relative pay in those same occupations have pushed up wages for
the top two thirds.
FIGURE 4.5 AROUND HERE

4.3 Industrial composition
In this subsection we included variables into the analysis from section 3 for industry
of employment. Industries can affect wages between occupations where the firms
operating in one sector or product market are, for a wide variety of reasons, more
productive or more profitable, so including them should improve the model.
Moreover, some occupations are much more likely to be found within particular
industries, meaning that part of the occupational effects found so far may in fact be
linked to industrial composition and earnings differences. We use the 1992 Standard
Industrial Classification of Economic Activities (SIC92) to group workers into sectors
– these are given in table 4.1.
FIGURE 4.6 AROUND HERE
Table 4.1: Employment by industry, 1994-2007
Employment share 1994 2007 A - Agriculture, hunting and forestry 1.1% 0.8% B - Fishing 0.0% 0.0% C - Mining and Quarrying 0.4% 0.4% D - Manufacturing 20.7% 13.7% E - Electricity, gas and water supply 1.0% 0.9% F - Construction 4.3% 5.4% G - Wholesale and Retail Trade including Repairs 15.5% 14.3% H - Hotels and restaurants 4.0% 4.0% I - Transport, storage and distribution 6.1% 6.5% J - Financial intermediation 5.0% 4.6% K - Real estate, renting and business activities 8.1% 10.8% L - Public administration and defence, social security 7.7% 8.6% M - Education 8.8% 11.1% N - Health and social work 11.9% 13.9% O - Other community, social and personal service activities 4.8% 4.7%

Figure 4.6 confirms that adding in industry has little effect on our existing
decomposition – compositional effects related to a shift away from sectors like
manufacturing towards construction, real estate and business activities, health and
education play little role in the distribution of earnings. Looking at changes in the
wage structure across industries reveals some interesting effects, as shown in Figure
4.7 (some industries were omitted as the wage effects were small. Wages in
construction have largely been increasing (relative to manufacturing, the reference
industry), which has had a positive effect on earnings particularly in the middle of the
distribution. Therefore, the success of construction industry over the past two decades
up to 2007 helped reduce wage inequality. Wages in education and public
administration also acted to reduce inequality, although in this case it was through
falling relative pay for those in these sectors at the top part of the distribution, with
little else changing across the rest of the distribution. Finally, wages in financial
intermediation, real estate and business services spike upwards at the top of the
distribution, suggesting these sectors have driven up inequality though higher pay
right at the top, which is consistent with earlier studies (see, for example, Bell and
Van Reenen, 2013).
FIGURE 4.7 AROUND HERE
4.4 Wage inequality after the financial crisis
In theory, we would like to extend the approach taken in this paper to understand
changes in the wage distribution since 2007. However, we face a particular problem
in the available data. In this paper we have used survey data on wages as they include
other variables which are useful for explaining earnings outcomes such as educational
attainment or union status. An alternative dataset for thinking about the distribution of
wages in the UK is the Annual Survey of Hours and Earnings (ASHE) – this is a
much larger administrative dataset which extracts information from tax returns.
ASHE is based on actual earnings (as reported to HMRC) self-reports, but
consequently does not include information on education as this is not needed for a tax
return, so we opt to use the LFS data instead.
The ASHE data can be used to check whether the patterns of self-reported earnings
described in the LFS data is representative. For earlier periods, this appears to be the
case. However, since 2007, the two datasets have shown different changes in the
earnings distribution, as shown in Figure 4.8. The LFS shows widening wage
inequality across the distribution, with wages at the bottom end falling by more than
the middle, which falls by more than those at the top. The story is similar at the low
end using the ASHE data but after the median the trends diverge, with the ASHE data
showing a 2 percentage point narrowing of pay between the median and the 90th
percentile.
FIGURE 4.8 AROUND HERE
This has been noted elsewhere (see Hills et al, 2015), but for some measures of
inequality like the 90-10 earnings ratio, the outcome is inconsistency in the data is
tiny – the LFS data would show an increase of 0.l percentage points, whereas the
ASHE data implies a fall of 0.1 percentage points. In terms of measuring the extent to
which there has been polarisation of earnings, however, the effect is more noticeable.
The LFS data would imply that the proportion of high paid jobs increased from 22.6%
to 23.3% of employees, while low wage work increased from 21.4% to 22.3% of
employees. This would mean a hollowing out of the wage distribution of 1.6% of the

workforce between 2007 and 2013. By contrast the ASHE data would imply no
further hollowing out during this time period, with a slight fall in high paid jobs and a
slight rise in low-paid jobs.
Assuming the ASHE data, as administrative rather than survey data, are more reliable,
then the labour market since the start of the recession has continued to exihibit the
same breakdown between occupational polarisation and polarisation of wage
distributions. Given than the same types of compositional changes experienced prior
to 2007 - declines of middle skill routine occupations, increases in educational
attainment, increase in female participation and so on – this would suggest that the
wage structure effects, in particular the skewing of wage returns to characteristics that
are associated with higher pay, are continuing to play an important role.
5 High skill occupations since the 1990s
The analysis in the final part of section 3 showed that changes in the wage structure
have counteracted compositional effects in the labour market in the fourteen years
leading up to the Great Recession, meaning that there are few additional high-paid
and low-paid jobs in the UK than there were in the early 1990s. In this section we
look to illustrate what these complex set of changes mean for wages in the high skill
non-routine occupations around which the UK’s high skill vision depends to provide
the labour market opportunities for highly qualified individuals to employ their skills.
The widening earnings dispersion associated with these jobs and education levels,
combined with the general trend towards wage compression picked up through the
intercept term mean that many of the newly created good non-routine jobs have much
more in common with middle-level jobs in terms of pay. Below we attempt to
quantify this phenomenon.

Table 5.1: Changes in pay level with occupations, 1994-2007
Professionals Managerial Intermediate
Manual routine
Admin routine Service
All Low pay 0.1% -2.3% -1.3% 0.6% -1.8% -1.4%
Middle pay 7.0% -2.8% 5.7% 1.2% 4.9% 2.3% High pay -7.1% 5.1% -4.5% -1.9% -3.1% -0.9%
Male Low pay 0.0% -1.4% -0.9% 2.3% -1.9% 3.4%
Middle pay 4.4% -1.2% 9.1% 0.7% 13.0% -1.5%
High pay -4.4% 2.6% -8.2% -3.0% -11.1% -1.8%
Female Low pay 0.3% -4.8% -1.6% 2.3% -2.1% -2.8%
Middle pay 9.3% -7.8% 2.1% -2.1% 3.3% 3.4% High pay -9.6% 12.5% -0.5% -0.2% -1.2% -0.6%
Degree Low pay 0.2% 0.5% -0.5% 10.6% -0.3% 1.8%
Middle pay 8.6% 3.6% 10.7% 1.8% 15.4% 2.1% High pay -8.8% -4.1% -10.2% -12.4% -15.1% -4.0% Non degree
Low pay 0.7% -2.7% -0.8% 0.2% -1.8% -0.9% Middle pay 7.9% -0.9% 8.5% 1.6% 5.0% 2.1% High pay -8.6% 3.6% -7.6% -1.7% -3.2% -1.2%
Source: UK Quarterly Labour Force Survey, 1994 Q1-Q4 and 2007 Q1 - Q4.
The top part of Table 5.1 shows how the proportion of high paid (>1.5 median wage),
low paid (< 2/3 median wage) and middle paid workers changed between 1994 and
2007 within occupations. The proportion of all professionals and intermediate
occupations receiving high pay fell during this time, while the proportion in the
middle pay category grew by roughly an equivalent amount. Managers, on the other
hand, shifted towards the higher end of the pay spectrum. Meanwhile, routine
occupations and low skill service occupations were increasing found in the middle
pay group. The table also shows how these changes differ by male and female

workers. Increasing pay for managerial work has a larger effect on women – this
reflects the fact that in 1994, nearly twice as many high-paid managers were male as
were female. At the same time, the growth of middle wage professional jobs was most
noticeable for females. Increased incidence of low-pay was more pronounced for
women in manual routine occupations, and for men in service occupations.
Figure 5.1 then takes into account the combined effect of changing employment
shares for each occupation and the distributional effects captured in Table 5.1. It
shows that the 5.3 percentage point fall in middle wage routine employment coincided
with a 4.1 percentage point increase in middle wage employment for good non-
routine jobs and a 2.2 percentage point increase in middle wage service occupations.
By comparison, there is only a 2.7 percentage points increase in good non-routine
jobs in the high-paid group.
FIGURE 5.1 AROUND HERE
What this means is that good non-routine jobs are increasingly found earning below
the existing average wage for the occupations. It is worth noting that at the same time,
a small proportion of individuals are earning far above them. The proportion of
workers earning more than 3 times the median wage rose from 3.2% to 3.8% of the
workforce between 1994 and 2007. This is largely related to the managerial group –
the share of these workers with very high pay rose from 11.6% to 13.0%. This
corresponds to the upward tick in wage growth from the top 5-10% of workers shown
in Figures 2.1 and 3.2, and to the previously observed increase in wage inequality at
the very top of the distribution (Bell and Van Reenen, 2013).
One possibility is that this divide reflects an increasing split between those good non-
routine jobs with the necessary qualifications and those with lower levels of education

and qualifications who have shifted towards these jobs in response to a decline in
middle-level routine work. In the previous section we did not allow for the possible
interaction between our main explanatory variables. However, occupations and
education are likely to be correlated if higher levels of educational achievement are a
pre-requisite for access into the top paying occupations. The widening of pay in the
upper part of the distribution that is separately attributed to occupations and education
could therefore be part of one phenomena – widening pay between the well qualified
individuals in the highest skilled jobs, and less qualified individuals in less demanding
jobs.
However, Table 5.1 shows that the same distributional patterns found across all good
non-routine jobs apply to both those who have completed higher education and those
that have not, with an increasing proportion of both degree and non-degree holders
in middle-paying good non-routine jobs. Graduate have also shifted towards middle-
paying managerial jobs, which is not true for the population as a whole. Table 4.1
points towards a widening divide between graduate earnings, even for those in highly
skilled jobs.
This is consistent with Williams (2013), who argued that differences in wage growth
rates of more narrowly-defined occupations (which we group together in our analysis)
– which have meant that good non-routine occupations have become more dispersed
across the pay spectrum – have only a weak relationship with changes in educational
achievement. Similarly, we find that increasing dispersion of wages in good non-
routine jobs is not related to the educational of the workers.
Williams also shows that there is little relationship with occupational wage changes
and union membership, demographics and sectoral change. He concludes it is

occupation-specific factors which largely explain changes to wage dispersion since
the 1970s. What these occupation-specific factors are, and what occupational earnings
difference capture, is beyond the scope of this paper. One step may be to investigate
differences in demand for specific non-routine tasks. These patterns are also
consistent with Brown, Lauder and Ashton (2011)’s model described in section 2,
particularly in the segmentation between a small proportion of high-earning
graduates, and increasing numbers of lower-earning graduates.
Finally, we replicate Figure 5.1 disaggregated between graduates and non-graduates.
As well as increasing numbers of non-routine jobs, there has also been a near
doubling of graduates in the UK labour force during this time period. The combined
effect on the total distribution of jobs is in Figure 5.2 (a), while the equivalent for the
falling numbers of non-graduates is in panel (b).
FIGURE 5.2 (a) and (b) AROUND HERE
This reveals a number of interesting patterns. Firstly, the decline in middle-paying
routine jobs was experienced almost entirely by the non-degree group, while the
growth in middle paying good non-routine jobs was experienced by the graduate
group. Salvatori (2014) has similarly concluded that occupational polarisation and
hollowing out was almost entirely a feature of the non-graduate segment of the labour
market. Our analysis adds to this to show that these jobs have been replaced almost
entirely in the wage distribution by graduates in jobs we would have typically thought
of as higher skilled and higher paying. Secondly, some of the additional graduates
have found employment in high-paying. However, with the exception of managers,
the Figure shows that this has been offset by a fall in highly paid skilled jobs

employing non-graduates. What this means is that many of these jobs may have
simply substituted between two types of labour.
5 Discussion and conclusion
In answer to the question asked in the title of this paper, we make four main
observations. Firstly, there is some evidence of work polarising in the late 1980s and
1990s, leading to increases in some measures of the incidence of low-wage and high
wage employment have increased. Secondly, these increases are not are great as we
might have expected given compositional shifts in the labour force. Thirdly, these
compositional shifts are not all due to occupational shifts, but are also related to
changes educational attainment and the power of wage-setting institutions. Finally, we
find limited evidence of a decline in middle-paying jobs between the mid 1990s and
late 2000s.
Our main argument is that purely focusing on compositional changes and holding the
wage structure of occupations constant does not adequately demonstrate the
polarisation of work into higher paying and lower paying jobs. In particular, changes
within the wage structure may mean that while workers have shifted towards
occupations which had in previous years commanded above- or below-average wages,
much of this growth in certain jobs may be closer to the middle of the distribution that
at the ends. This counteracts the shift away from middle-wage routine employment.
Regrettably, it is compositional changes which policymakers have largely focused on.
Our analysis suggest important caveats to the claims of policymakers that growing
employment shares of good non-routine jobs offers sufficient opportunities for
increasingly well-educated new labour market entrants and those existing workers
who improve their human capital through returning to education and training. Despite

the growth in jobs in the top occupational groupings, this paper offers evidence that
many of these jobs are increasingly dispersed in terms of wage and, by proxy, skill
use. This dispersion is masked by data on average earnings at the occupational and
qualification level, as a small proportion of these groups have experienced rapidly
increasing wages. We have suggested that this may be a consequence of what Brown,
Lauder and Ashton describe as “digital Taylorism” where employers are rationally
following deskilling and routinising strategies in many of these “good” jobs,
regardless of the human capital being supplied by the workforce. If this is the case,
supply side interventions are unlikely to have any particular impact.

References
Arulampalam, W, Booth, A, and Bryan, M, (2007), Is there a glass ceiling over
Europe? Exploring the gender pay gap across the wage distribution, Industrial and
Labor Relations Review, 60(2): 163-186
Anderson, P, (2009), Intermediate occupations and the conceptual and empirical
limitations of the hourglass economy thesis, Work, Employment and Society 23(1):
169-180.
Antonczyk, D, DeLeire, T, and Fitzenberger, B, (2010) Polarization and rising wage
inequality: comparing the U.S. and Germany, IZA Discussion Paper 4842.
Autor, D, and Dorn, D, (2012), The Growth of Low Skill Service Jobs and the
Polarization of the U.S. Labor Market, IZA Discussion paper 7068, accessed online
on August 1st 2013: http://ftp.iza.org/dp7068.pdf
Autor, D., Levy, F., and Murnane, R., (2003), The skill content of recent
technological change: an empirical exploration, Quarterly Journal of Economics,
118(4), 1279-1333.
Autor, D, Katz, L., and Kearney, M, (2006), The polarisation of the US labour
market, American Economic Review, 96(2), 189-194.
Bell, B. and Pitt, M, (1998), Trade union decline and the distribution of wages in the
UK: evidence from kernel density estimation, Oxford Bulletin of Economics and
Statistics, 60(4): 509-528.
Bell, B and Van Reenen, J, (2013) Extreme wage inequality: pay at the very top
American Economic Review 103 (3): 153-157.
BIS, (2013), Hollowing out and the future of the labour market, BIS Research Paper
no. 134.
Brown, P, Lauder, H and Ashton, D, (2011), The Global Auction, Oxford: OUP.
Caranci, B, and Jones, C, (2011), Caught in the middle: the polarization of skills in
the US labour market, special report, TD Economics.
Christofidesa, L, Polycarpoua, A, and Vrachimisa, K, (2013), Gender wage gaps,
‘sticky floors’ and ‘glass ceilings’ in Europe, Labour Economics 21: 86–102

Firpo, S., Fortin, N. and Lemieux, T, (2009), Unconditional quantile regressions,
Econometrica, 77 (3): 953-973.
Firpo, S., Fortin, N., and Lemieux, T., (2011), Occupational tasks and changes in the
wage structure, IZA Discussion paper 5542, accessed online on August 1st 2013:
http://ftp.iza.org/dp5542.pdf
Gautié, J, and Schmitt, J, (2010), Low wage work in the wealthy world, New York:
Russell Sage Foundation.
Goos, M, and Manning, A, (2007), Lousy jobs and lovely jobs: the rising polarization
of work in Britain, The Review of Economics and Statistics, 89(1), 118-133.
Goos, M, Manning, A, and Salomons, A, (2009), Job polarization in Europe,
American Economic Review: Papers and Proceedings, 99(2), 58–63.
Gosling, A., Machin, S. and Meghir, C, (2000) The changing distribution of male
wages, The Review of Economic Studies, 67 (4), 635-666.
Green, F, and Zhu, Y, (2010), Overqualification, job dissatisfaction, and increasing
dispersion in the returns to graduate education, Oxford Economic Papers 62, 740–763
Hills, J, Cunliffe, J, Obolenskaya, P, and Karagiannak, E, (2015), Falling behind,
getting ahead: the changing structure of inequality in the UK, 2007-2013, Social
Policy in Cold Climate Research Report no. 5, London: Centre for Analysis of Social
Exclusion, the London School of Economics, accessed online on July 2nd 2015:
http://sticerd.lse.ac.uk/dps/case/spcc/rr05.pdf.
HM Government, (2011), Opening doors, breaking barriers: a strategy for social
mobility, London: Cabinet Office.
Oesch, D, and Rodríguez Menés, J, (2011), Upgrading or polarization? Occupational
change in Britain, Germany, Spain and Switzerland, 1990-2008, Socio-economic
Review, 9(3), 503-531.
Mishel, L, Schmitt, J, and Shierholz, H, (2013), Assessing the job polarization
explanation of growing wage inequality, EPI working paper.
Nolan, P, (2003), Shaping the future: the political economy of work and employment,
Industrial Relations Journal 35(5), pp. 378–387.

ONS, (2012), Real wages up 62% on average over the past 25 years, accessed online
on September 23rd 2013: http://www.ons.gov.uk/ons/dcp171776_286266.pdf.
Salvatori, A, (2015), The anatomy of job polarisation in the UK, unpublished working
paper available online: https://sites.google.com/site/econsalvatori/polarisation
Spitz-Oener, A, (2006) Technical change, job tasks and rising educational demands:
looking outside the wage structure, Journal of Labour Economics, 24(2).
Walker, I and Zhou, Y, (2008), The College Wage Premium and the Expansion of
Higher Education in the UK, Scandinavian Journal of Economics, 110 (4), pp. 695-
709.
Whittaker, M, and Corlett, A, (2014), Low Pay Britain 2014, London: Resolution
Williams, M, (2013), Occupations and British wage inequality, 1970s-2000s.
European Sociological Review, 29 (4): 841-857.
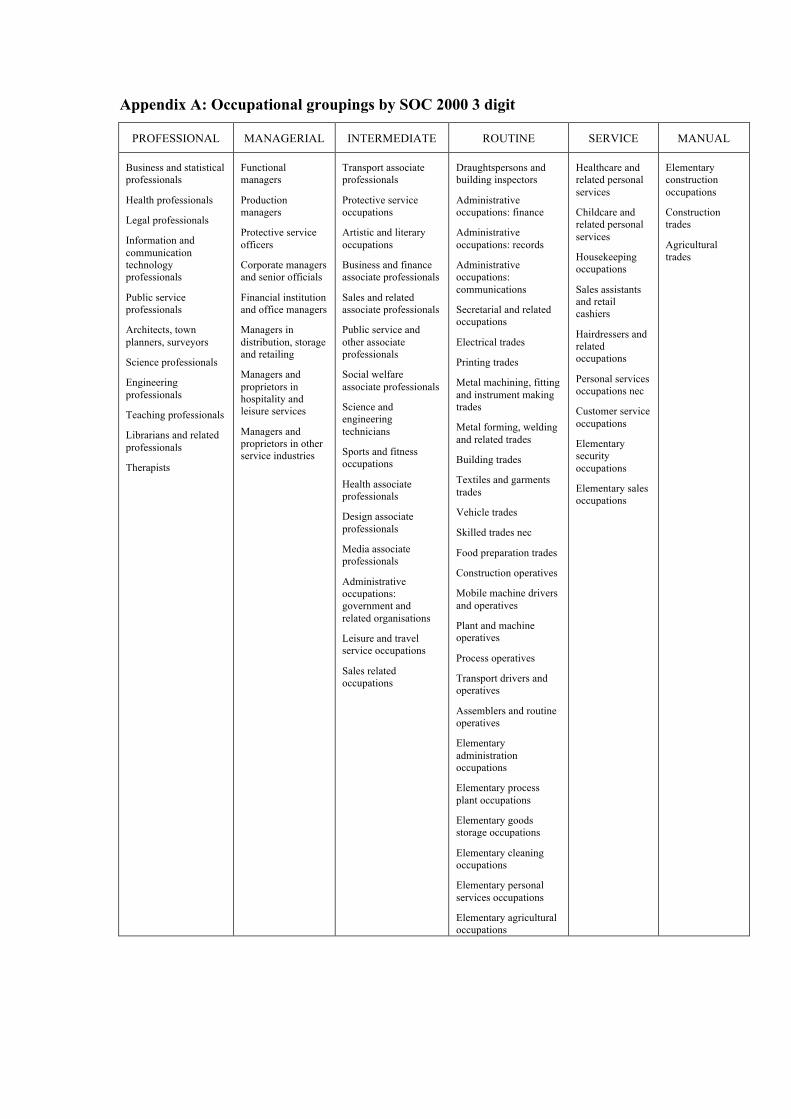
Appendix A: Occupational groupings by SOC 2000 3 digit
PROFESSIONAL MANAGERIAL INTERMEDIATE ROUTINE SERVICE MANUAL
Business and statistical professionals
Health professionals
Legal professionals
Information and communication technology professionals
Public service professionals
Architects, town planners, surveyors
Science professionals
Engineering professionals
Teaching professionals
Librarians and related professionals
Therapists
Functional managers
Production managers
Protective service officers
Corporate managers and senior officials
Financial institution and office managers
Managers in distribution, storage and retailing
Managers and proprietors in hospitality and leisure services
Managers and proprietors in other service industries
Transport associate professionals
Protective service occupations
Artistic and literary occupations
Business and finance associate professionals
Sales and related associate professionals
Public service and other associate professionals
Social welfare associate professionals
Science and engineering technicians
Sports and fitness occupations
Health associate professionals
Design associate professionals
Media associate professionals
Administrative occupations: government and related organisations
Leisure and travel service occupations
Sales related occupations
Draughtspersons and building inspectors
Administrative occupations: finance
Administrative occupations: records
Administrative occupations: communications
Secretarial and related occupations
Electrical trades
Printing trades
Metal machining, fitting and instrument making trades
Metal forming, welding and related trades
Building trades
Textiles and garments trades
Vehicle trades
Skilled trades nec
Food preparation trades
Construction operatives
Mobile machine drivers and operatives
Plant and machine operatives
Process operatives
Transport drivers and operatives
Assemblers and routine operatives
Elementary administration occupations
Elementary process plant occupations
Elementary goods storage occupations
Elementary cleaning occupations
Elementary personal services occupations
Elementary agricultural occupations
Healthcare and related personal services
Childcare and related personal services
Housekeeping occupations
Sales assistants and retail cashiers
Hairdressers and related occupations
Personal services occupations nec
Customer service occupations
Elementary security occupations
Elementary sales occupations
Elementary construction occupations
Construction trades
Agricultural trades

Appendix B: Defining middle pay
In this paper, we define middle paying jobs by defining cut-off points relative to the
median (typically above two-thirds and below 1.5 time median wages). However, it is
not immediately clear why a fixed definition of high- or low-pay is appropriate. A
figure of 150% of the median wage for example might make sense if the top
percentile was, for example, three times higher than the median, but less so if it were
twenty times higher than the median (or, for that matter, 1.5 times higher than the
median). Therefore, as the wage spectrum expands at the top, so might the threshold
for defining high- and low- pay.
This would change what was meant by the middle in situation where wage growth
patterns were not uniform across the distribution. To illustrate the issue, consider the
following simple situation where the expansion of good non-routine jobs means that
the upper half of the pay distribution experiences faster wage growth than the median.
However, suppose that this increase in the average relative wage of good routine jobs
is combined with increasing heterogeneity within the group, with those at the top of
the distribution enjoying a larger share of the increase in the average wage of these
jobs. This would follow on from a greater proportion of good non-routine jobs being
created lower down the distribution than elsewhere in the distribution, as we have
argued is the case in the UK. It could therefore be the case that while those workers
between (for example) the 5th and 7th deciles experience greater wage growth than at
the median – leading to increased numbers of high-paid workers using the fixed cut-
off definition – this group falls proportionately further behind those right at the top
than away from the middle. The result is that, when evaluated with reference to the
total spectrum of wages, a number of those in what were originally deemed good jobs
would instead look relatively closer to the middle of the distribution than the top.

Therefore, a pattern of wage growth that was steeper at the top and the bottom
indicates that jobs in what could be termed the ‘relative’ middle might not have
decreased even if other measures, such as those used within this paper indicate it has.
This is clearly relevant for earnings patterns in the UK, where the top deciles
experienced a particularly high wage growth rate compared to even other well-paid
workers.

Figures
Figure 2.1: Gross hourly earnings distribution, 1987, by occupational group
Figure 3.1: Aggregate changes in earnings distributions, 1987-2001
-‐0.05
0.00
0.05
0.10
0.15
0.20
0.25
0.30
0 2 4 6 8 10 12 14
Density
Gross hourly wage
All
Rouane
High skill non rouane
Low skill non rouane
-‐5.0%
0.0%
5.0%
10.0%
15.0%
20.0%
0.00 0.10 0.20 0.30 0.40 0.50 0.60 0.70 0.80 0.90 1.00
Wage grow
th, 1987-‐2001
Percen=le
Composiaon
Wage structure

Figure 3.2: Aggregate changes in earnings distributions, 1994-2007
Figure 3.3: Compositional effects on earnings distributions, 1987-2001
0.0%
5.0%
10.0%
15.0%
20.0%
25.0%
0.00 0.10 0.20 0.30 0.40 0.50 0.60 0.70 0.80 0.90 1.00
Wage grow
th, 1994-‐2007
Percen=le
Composiaon
Wage structure
-‐5.0%
0.0%
5.0%
10.0%
15.0%
20.0%
0.00 0.10 0.20 0.30 0.40 0.50 0.60 0.70 0.80 0.90 1.00
Wage grow
th, 1987-‐2001
Percen=le
Total esamated composiaon
Occupaaons
Educaaon
Unions
Female

Figure 3.4: Compositional effects on earnings distributions, 1994-2007
Figure 3.5: Wage structure effects on earnings distributions, 1987-2001
-‐2.0%
0.0%
2.0%
4.0%
6.0%
8.0%
10.0%
12.0%
14.0%
0.00 0.10 0.20 0.30 0.40 0.50 0.60 0.70 0.80 0.90 1.00
Wage grow
th, 1994-‐2007
Percen=le
Total esamated composiaon
Occupaaon
Educaaon
Unions
Female
-‐15.0%
-‐10.0%
-‐5.0%
0.0%
5.0%
10.0%
15.0%
20.0%
0.00 0.10 0.20 0.30 0.40 0.50 0.60 0.70 0.80 0.90 1.00
Wage grow
th, 1987-‐2001
Percen=le
Wage structure Occupaaons
Educaaon Unions
Female Constant

Figure 3.6: Wage structure effects on earnings distributions, 1994-2007
-‐15.0%
-‐10.0%
-‐5.0%
0.0%
5.0%
10.0%
15.0%
20.0%
25.0%
30.0%
0.00 0.10 0.20 0.30 0.40 0.50 0.60 0.70 0.80 0.90 1.00 Wage grow
th, 1994-‐2007
Percen=le
Wage structure Occupaaon
Educaaon Unions
Female Constant

Figure 3.7: Occupational wage structure effects on earnings distributions, 1987-2001
Figure 3.8: Occupational wage structure effects on earnings distributions, 1994-2007
-‐2.0%
-‐1.0%
0.0%
1.0%
2.0%
3.0%
4.0%
5.0%
0.00 0.10 0.20 0.30 0.40 0.50 0.60 0.70 0.80 0.90 1.00
Wage grow
th, 1987-‐2001
Percen=le
Professional Managerial Intermediate Rouane manual Service
-‐2.0%
-‐1.0%
0.0%
1.0%
2.0%
3.0%
4.0%
5.0%
0.00 0.10 0.20 0.30 0.40 0.50 0.60 0.70 0.80 0.90 1.00
Wage grow
th, 1994-‐2007
Percen=le
Professional Managerial Intermediate Rouane manual Service

Figure 3.9: Educational wage structure effects on earnings distributions, 1987-2001
Figure 3.10: Educational wage structure effects on earnings distributions, 1994-2007
-‐1.0%
-‐0.5%
0.0%
0.5%
1.0%
1.5%
2.0%
2.5%
3.0%
3.5%
4.0%
0.00 0.10 0.20 0.30 0.40 0.50 0.60 0.70 0.80 0.90 1.00
Wage grow
th, 1987-‐2001
Percen=le
Degree
Post compulsory
-‐3.0%
-‐2.0%
-‐1.0%
0.0%
1.0%
2.0%
3.0%
0.00 0.10 0.20 0.30 0.40 0.50 0.60 0.70 0.80 0.90 1.00
Wage grow
th, 1994-‐2007
Percen=le
Degree
Post compulsory

Figure 4.1: Aggregate changes in male and female earnings distributions, 1994-2007
Figure 4.2: Wage and compositional effects on male and female earnings distributions, 1994-2007
0.0%
5.0%
10.0%
15.0%
20.0%
25.0%
30.0%
35.0%
40.0%
0.00 0.20 0.40 0.60 0.80 1.00
Wage grow
th, 1994-‐2007
Percen=le
Male
Female
-‐5.0%
0.0%
5.0%
10.0%
15.0%
20.0%
25.0%
30.0%
0.00 0.10 0.20 0.30 0.40 0.50 0.60 0.70 0.80 0.90 1.00
Wage grow
th, 1994-‐2007
Percen=le
Composiaon -‐ Female Wage structure -‐ Female
Composiaon -‐ Male Wage structure -‐ Male

Figure 4.3: Selected wage structure effects, by gender, 1994-2007
(a) Male
(b) Female
-‐4.0%
-‐2.0%
0.0%
2.0%
4.0%
6.0%
8.0%
0.00 0.10 0.20 0.30 0.40 0.50 0.60 0.70 0.80 0.90 1.00 Wage grow
th, 1994-‐2007
Percen=le
Degree
Professional
Managerial
-‐6.0%
-‐4.0%
-‐2.0%
0.0%
2.0%
4.0%
6.0%
8.0%
0.00 0.10 0.20 0.30 0.40 0.50 0.60 0.70 0.80 0.90 1.00
Wage grow
th, 1994-‐2007
Percen=le
Degree
Professional
Managerial

Figure 4.4: Compositional effects on graduate earnings, 1994-2007
Figure 4.5: Occupational wage structure effects on graduate earnings, 1994-2007
-‐8.0%
-‐7.0%
-‐6.0%
-‐5.0%
-‐4.0%
-‐3.0%
-‐2.0%
-‐1.0%
0.0%
1.0%
2.0%
3.0%
0 0.1 0.2 0.3 0.4 0.5 0.6 0.7 0.8 0.9 1
Wage grow
th, 1994-‐2007
Percen=le
Occupaaon
Experience
Female
Union
-‐40.0%
-‐30.0%
-‐20.0%
-‐10.0%
0.0%
10.0%
20.0%
0 0.1 0.2 0.3 0.4 0.5 0.6 0.7 0.8 0.9 1
Wage grow
th, 1994-‐2007
Percen=le
Professional
Managerial
Intermediate
Rouane manual
Service

Figure 4.6: Compositional effects including industry variable, 1994-2007
-‐2.0%
0.0%
2.0%
4.0%
6.0%
8.0%
10.0%
0 0.2 0.4 0.6 0.8 1
Wage grow
th, 1994-‐2007
Percen=le
Occupaaon
Educaaon
Unions
Industry
Female

Figure 4.8: Aggregate changes in earnings distributions, 2007-2013
Source: LFS - own calculations, ASHE – Whittaker and Corlett (2014).
-‐7.0%
-‐6.0%
-‐5.0%
-‐4.0%
-‐3.0%
-‐2.0%
-‐1.0%
0.0% 0 10 20 30 40 50 60 70 80 90 100
Wage grow
th, 2007-‐2013
Percen5le
LFS
ASHE

Figure 5.1 Change in occupational structure by pay level, 1994-2007
-‐5.00%
-‐4.00%
-‐3.00%
-‐2.00%
-‐1.00%
0.00%
1.00%
2.00%
3.00%
Low pay Middle pay High pay
Chan
ge in employmen
t sha
re, 1994-‐2007
Professionals
Managerial
Intermediate
Manual rouJne
Admin rouJne
Service

Figure 5.2 Change in occupational structure by pay level and education, 1994-2007
(a) Degree holders
(b) Non degree holders
-‐5.00%
-‐4.00%
-‐3.00%
-‐2.00%
-‐1.00%
0.00%
1.00%
2.00%
Low pay Middle pay High pay
Chan
ge in employmen
t sha
re, 1994-‐2007
Professionals
Managerial
Intermediate
Manual rouJne
Admin rouJne
Service
-‐5.00%
-‐4.00%
-‐3.00%
-‐2.00%
-‐1.00%
0.00%
1.00%
2.00%
Low pay Middle pay High pay
Chan
ge in employmen
t sha
re, 1994-‐2007
Professionals
Managerial
Intermediate
Manual rouJne
Admin rouJne
Service

Figure 4.7: Industry wage structure effects, 1994-2007
-‐2.0%
-‐1.5%
-‐1.0%
-‐0.5%
0.0%
0.5%
1.0%
1.5%
2.0%
0 0.1 0.2 0.3 0.4 0.5 0.6 0.7 0.8 0.9 1
Wage grow
th, 1994-‐2007
Percen6le
F -‐ Construc8on G -‐ Wholesale and Retail Trade including Repairs H -‐ Hotels and restaurants I -‐ Transport, storage and distribu8on J -‐ Financial intermedia8on K -‐ Real estate, ren8ng and business ac8vi8es L -‐ Public administra8on and defence, social security M -‐ Educa8on N -‐ Health and social work
Recommended