DRAFT #1 – MAY 3 2010
Har
ewo
od
Co
mm
un
ity
Pro
file
20
10
2
Table of Contents
Section page Acknowledgements
1 Setting 4 1.1 Location and Physical Characteristics 4 1.2 Geology 6 1.3 Climate 7 1.4 Local Species 9 Flora 9 Fauna 10 1.5 Parks and Environmentally Sensitive Areas 11
2 History 13 Important Dates 14
3 People 16 3.1 Population 16 3.2 Marital Status 23 3.3 Households and Families 24 3.4 Income 25
3.5 Education 27 3.6 Labour Force 29 3.7 Seniors in Harewood 30
4 Infrastructure 32 4.1 Water 32 4.2 Sewer 32 4.3 Stormwater 34 4.4 Solid Waste 34
5 Agriculture and Food Security 36 6 Housing 41 6.1 Current Building Permits 41
6.2 Affordable Housing 42 6.3 BC Assessment 43 6.4 Real Estate Sales 44
7 Current Land Use Regulations 45 7.1 Plan Nanaimo 45
7.2 Zoning 48 8 Recreation 49 8.1 Inventory 49
8.2 Community Survey 51 9 Walkability 52
10 Sources 56
DRAFT #1 – MAY 3 2010
Har
ewo
od
Co
mm
un
ity
Pro
file
20
10
3
Maps Map 1: Boundaries of Harewood 4 Map 2: Census Tract Areas 16 Map 3: Comparison of Rental Housing 21 Map 4: Comparison of Income 26 Map 5: Comparison of Educational Attainment 28 Map 6: Affordable Housing 42 Map 7: Plan Nanaimo 47 Map 8: Parks and Trails 50
Figures
Figure 1: Climagraph of Nanaimo 7 Figure 2: Arbutus Tree 9 Figure 3: Colliery Dam Park 12 Figure 4: Buttertubs Marsh 12 Figure 5: Harewood Mine Workings 13 Figure 6: Vancouver Island University 15 Figure 7: Population Pyramid 17 Figure 8: Age Characteristics 18 Figure 9: Other Population Characteristics 19 Figure 10: Population 23 Figure 11: Marital Status 23 Figure 12: Marital Status Comparisons 23 Figure 13: Households 24 Figure 14: Families 24 Figure 15: Income 25 Figure 16: Education 27 Figure 17: Labour Force 29 Figure 18: Seniors in Harewood 30 Figure 19: Harewood Shopping 30 Figure 20: Activities for Seniors 31 Figure 21: Water Mains 33 Figure 22: Sewer Mains 33 Figure 23: Stormwater Mains 35 Figure 24: Permit Activity 41 Figure 25: Assessment 43 Figure 26: Real Estate Sales 44 Figure 27: Harewood Sub Area 44
DRAFT #1 – MAY 3 2010
Har
ewo
od
Co
mm
un
ity
Pro
file
20
10
4
HAREWOOD COMMUNITY PROFILE
Vancouver Island University’s Geography 342: Urban and Regional Planning would like to
thank the Good Neighbour’s Committee for inviting us to participate in the development of this
Community Profile.
Caitlan Akins
Arash Borhan
Herkamal Brar
Philippa Burn
Kelsey Chandler
James (Bucky) Chisholm
Alysha Harris
Jennifer Henderson
Sarah Lamb
Jon Lodge
Darren Lucas
Cody Naples
Angie Nielsen
Emily Pallard
Phil Perrin
Meagan Sandford
BJ Seatter
Jay Valeri
Mary Wunderlich
Pamela Shaw
DRAFT #1 – MAY 3 2010
Har
ewo
od
Co
mm
un
ity
Pro
file
20
10
5
SECTION 1 SETTING
1.1 Location and Physical Characteristics
The community of Harewood is
located in the City of Nanaimo
(the Harbour City) on the east
coast of Vancouver Island. The
City and the community of
Harewood are sited on lands
that are within the traditional
territory of the Snuneymuxw
First Nation, who have occupied
this area for thousands of years.
Harewood contains many of the
oldest buildings and structures
found within the City, and is
blessed with historic character
and style dating from before
the turn of the century.
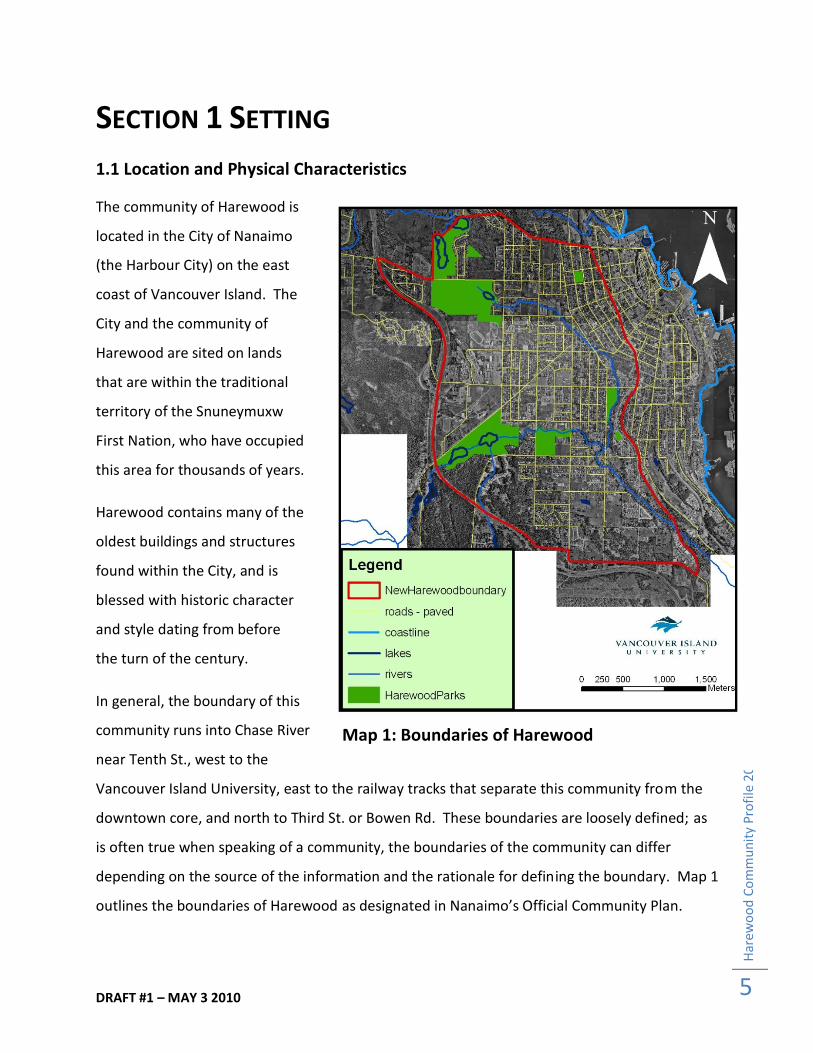
In general, the boundary of this
community runs into Chase River
near Tenth St., west to the
Vancouver Island University, east to the railway tracks that separate this community from the
downtown core, and north to Third St. or Bowen Rd. These boundaries are loosely defined; as
is often true when speaking of a community, the boundaries of the community can differ
depending on the source of the information and the rationale for defining the boundary. Map 1
outlines the boundaries of Harewood as designated in Nanaimo’s Official Community Plan.
Map 1: Boundaries of Harewood
DRAFT #1 – MAY 3 2010
Har
ewo
od
Co
mm
un
ity
Pro
file
20
10
6
Harewood is a bustling community located at 49° 8′ 0″ N, 123° 57′ 0″ W o 10U W430701
N5442712 and is home to numerous amenities. Some of these amenities include a growing
university with a progressive master plan, shopping, restaurants, pubs, a drug store, super
markets, the Nanaimo Ice Centre (NIC) and the Nanaimo Aquatic Centre (NAC), as well as new
areas of residential development. In addition to the urban or built environment, there are also
several parks and ecologically sensitive areas located within the community boundaries. The
presence of parks and green spaces encourages the residents of Harewood to get out and enjoy
the outdoors, while building a sense of community cohesiveness.
This community is also home to numerous schools. There is a range of facilities including
primary, secondary and post secondary institutions. In June 2008, Gordon Campbell granted
university status to four colleges in British Columbia; one of the schools was Malaspina
University-College. The University-College was renamed Vancouver Island University, also
known as VIU (a fitting name for a hillside educational facility). The new designation has led to
plans for growth, increased enrollment, and a wider range of available courses and services. In
addition, there has been an increased interest from community members, agency
representatives, and university staff and faculty in creating new bonds between VIU and
Harewood to support each other and add to each other’s success.
DRAFT #1 – MAY 3 2010
Har
ewo
od
Co
mm
un
ity
Pro
file
20
10
7
1.2 Geology
The geology of Vancouver Island can be explained with plate tectonics, the accretion of exotic
terranes, and fluvioglacial processes. Vancouver Island is part of the Wrengellia Terrane, which
is part of an ancient continent created during the breakup of the ancient supercontinents.
South Western British Columbia, Vancouver Island, and the Queen Charlotte islands have
geology that can be characterized by compressional tectonic stresses, associated
metamorphism and fracturing of old sea floor rocks and newer sedimentary units. Most of the
rocks in the Harewood area are between sixty-five and one hundred million years old. These
rocks include the Karmutsen and Quatsino formations (bedrock) and the Nanaimo Sediments,
which are composed of sandstones, other fine-grained sedimentary rocks, and conglomerates.
Fluvioglacial processes, as well as erosional deposition on submarine fans have deposited the
sedimentary rocks. Isostatic adjustments have caused many of these sedimentary deposits to
be exposed.
The Harewood Area also has a rich mining history. Coalmines, which operated in the area at the
turn of the century, provided a revenue base that allowed the community of Harewood to
flourish. Historic mine workings can be a cause for concern because of health risks and
challenges associated with development on the surface. One potentially useful application for
historic mine workings, known as geo-exchange, can be used to heat and cool new
developments in a sustainable, environmentally responsible manner. Subsidence must be
considered anytime surface developments are situated on top of historic mine workings. The
collapse historic coalmines, which often practiced full recovery mining (removing all the coal
without leaving any for support), can be devastating. These subsidence events may happen
after extended periods of inactivity, or they may be triggered by seismic events.
DRAFT #1 – MAY 3 2010
Har
ewo
od
Co
mm
un
ity
Pro
file
20
10
8
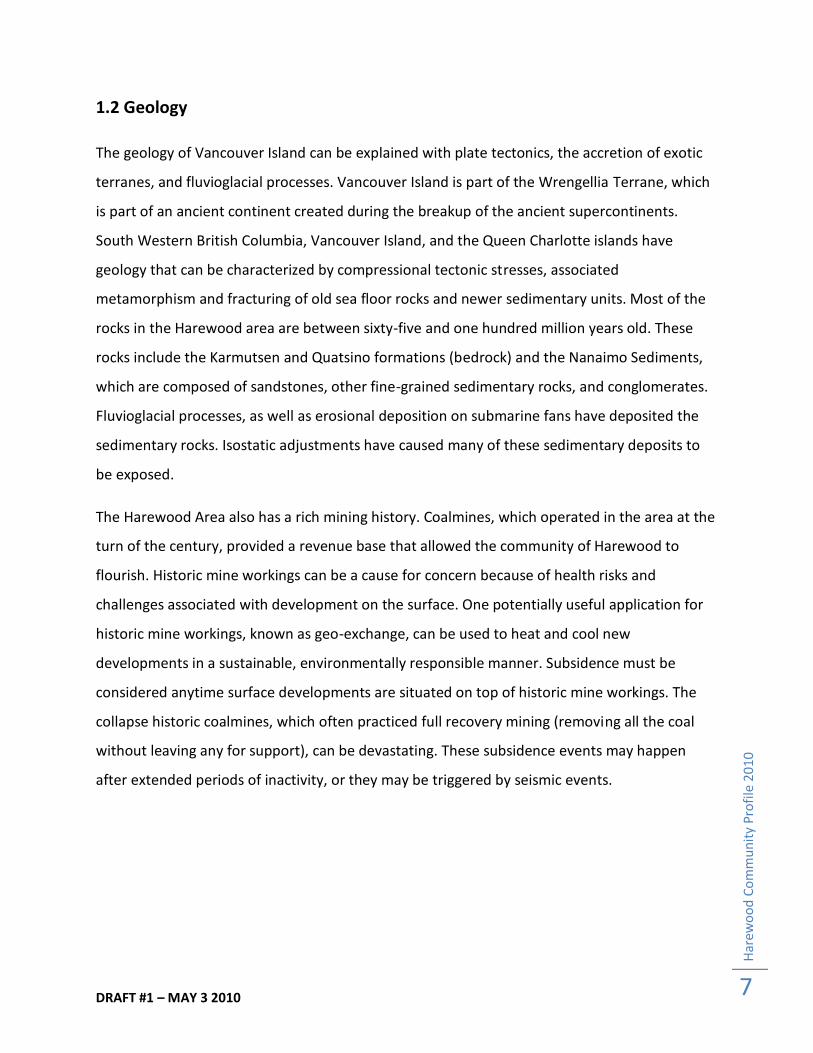
1.3 Climate
Climate refers to long-term
weather patterns. The Maritime
influenced climate on Vancouver
Island is moving towards a
Mediterranean designation with
cool wet winters, and warm dry
summers.
Nanaimo (and the community of
Harewood) is located in the
shadow of Mount Benson on the
east side of Vancouver Island. The Nanaimo area receives in excess of 1144mm of precipitation
each year, and is the mildest city in British Columbia. The annual temperature average for each
month is never below zero degrees Celsius, and the yearly temperature range is only fifteen
degrees. The lack of significant precipitation in the summer typically causes water shortages
near the end of the summer months. These patterns should be considered before any new
development, which utilizes large volumes of water, gets the go ahead in the Harewood area.
The hottest month of the Year in the Nanaimo area is August, and the coldest is January. The
average temperature in August is eighteen degrees Celsius, and the average temperature in
January is three degrees Celsius. These mild temperatures appeal to a wide demographic
making Nanaimo and Vancouver Island very desirable places to live and explore.
Several factors contribute to the climate patterns in and around the Nanaimo area. One
important factor is latitude. Nanaimo’s latitude is around forty-nine degrees north. This causes
the sun’s rays to strike the surface of the earth at an angle, decreasing insolation received at
the surface relative to the equatorial regions of the world. This lowers temperatures in the
Nanaimo area. The second contributing factor is the proximity of the ocean, which has both a
warming and a cooling effect. The high specific heat capacity of water allows the ocean to
remain warmer than land during the winter months and cooler in the summer. The presence of
Figure 1: Climagraph of Nanaimo (data averaged for 1990 to 2005)
DRAFT #1 – MAY 3 2010
Har
ewo
od
Co
mm
un
ity
Pro
file
20
10
9
saturated air masses and weather systems moving in from the pacific provide plenty of
moisture and variations in weather throughout the year.
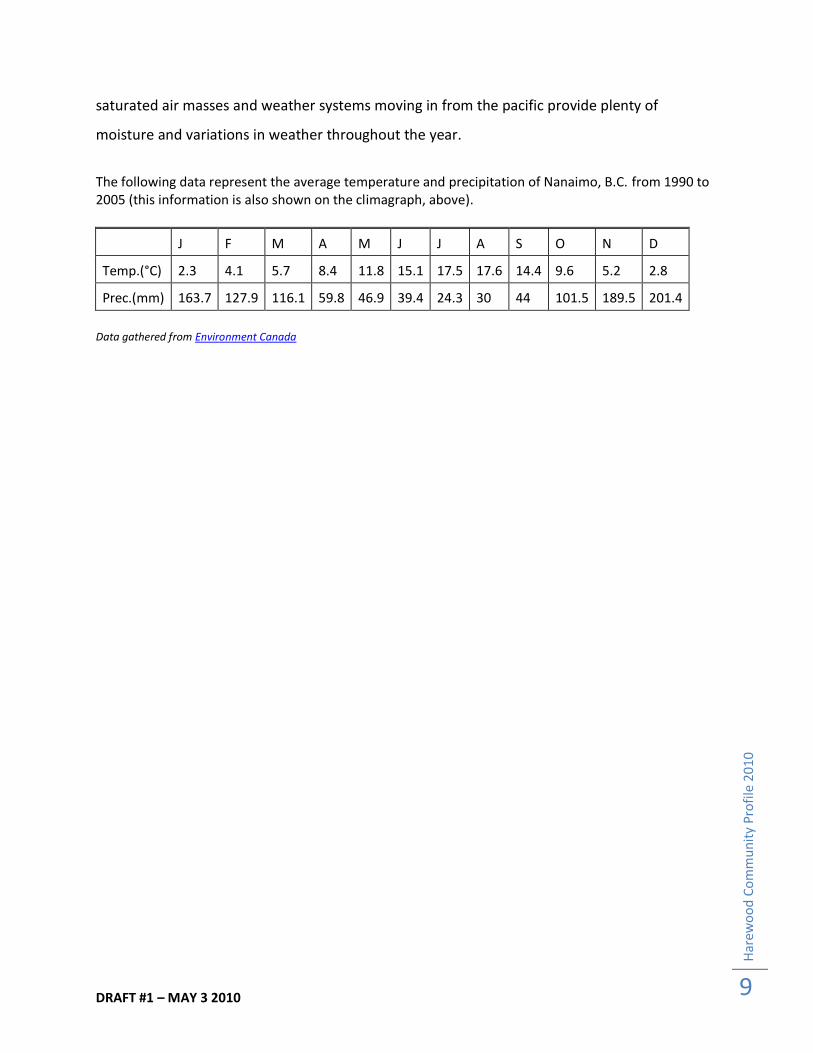
The following data represent the average temperature and precipitation of Nanaimo, B.C. from 1990 to 2005 (this information is also shown on the climagraph, above).
J F M A M J J A S O N D
Temp.(°C) 2.3 4.1 5.7 8.4 11.8 15.1 17.5 17.6 14.4 9.6 5.2 2.8
Prec.(mm) 163.7 127.9 116.1 59.8 46.9 39.4 24.3 30 44 101.5 189.5 201.4
Data gathered from Environment Canada
DRAFT #1 – MAY 3 2010
Har
ewo
od
Co
mm
un
ity
Pro
file
20
10
10
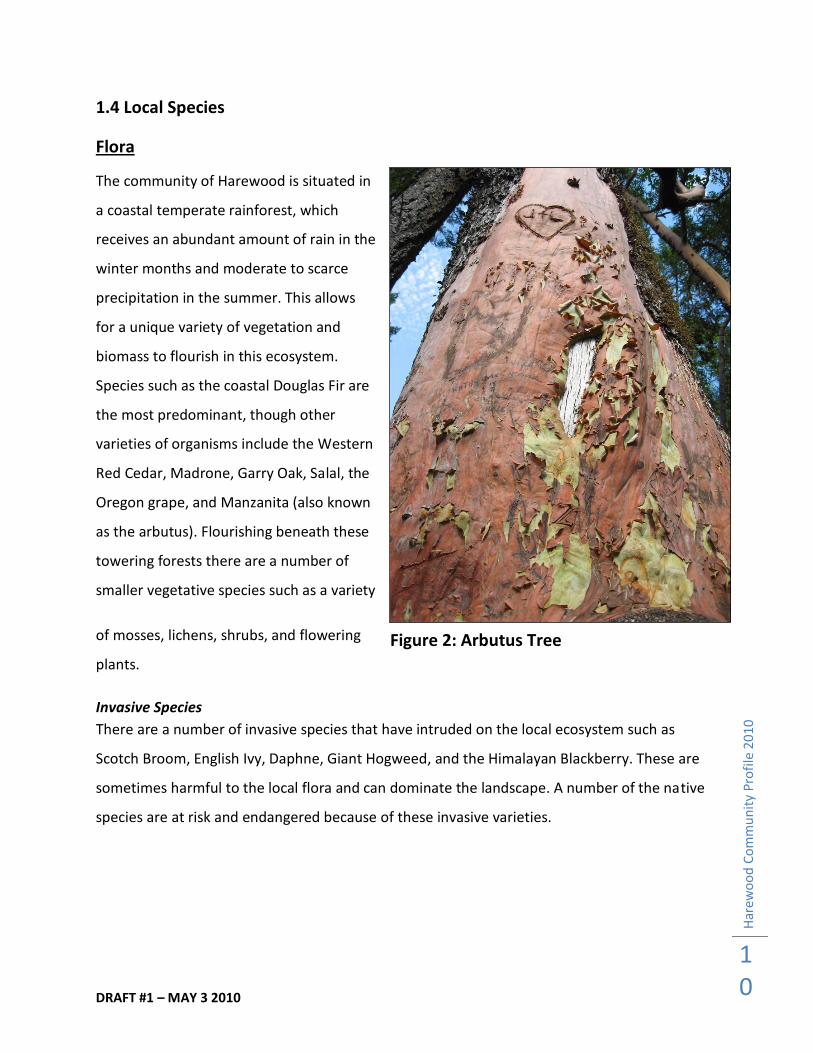
1.4 Local Species
Flora
The community of Harewood is situated in
a coastal temperate rainforest, which
receives an abundant amount of rain in the
winter months and moderate to scarce
precipitation in the summer. This allows
for a unique variety of vegetation and
biomass to flourish in this ecosystem.
Species such as the coastal Douglas Fir are
the most predominant, though other
varieties of organisms include the Western
Red Cedar, Madrone, Garry Oak, Salal, the
Oregon grape, and Manzanita (also known
as the arbutus). Flourishing beneath these
towering forests there are a number of
smaller vegetative species such as a variety
of mosses, lichens, shrubs, and flowering
plants.
Invasive Species
There are a number of invasive species that have intruded on the local ecosystem such as
Scotch Broom, English Ivy, Daphne, Giant Hogweed, and the Himalayan Blackberry. These are
sometimes harmful to the local flora and can dominate the landscape. A number of the native
species are at risk and endangered because of these invasive varieties.
Figure 2: Arbutus Tree
DRAFT #1 – MAY 3 2010
Har
ewo
od
Co
mm
un
ity
Pro
file
20
10
11
Fauna
In the vicinity of the Harewood community a number of species inhabit the wilderness such as
deer, raccoons, and other small mammals. On occasion a black bear or cougar can be seen, but
this is a relatively populated and urban area. A variety of bird species are attracted to
Buttertubs Marsh Nature Reserve like blue herons, mallards, Canada geese, Ring-neck ducks,
hooded Mergansers, and the American Widgeon. At certain times of the year, some varieties of
salmon may be visible in the smaller tributaries of the Harewood Area. Other aquatic species
that inhabit the water systems are trout and small organisms such as insects.
Invasive Species
A few invasive animals exist in the area that may disrupt the balance in local ecosystems
including the American bullfrog, Eastern Cottontail Rabbit, Eastern Grey Squirrel, European
Starling, House Sparrow, and Black slugs.
DRAFT #1 – MAY 3 2010
Har
ewo
od
Co
mm
un
ity
Pro
file
20
10
12
1.5 Parks and Environmentally Sensitive Areas
One of Nanaimo’s greatest assets is the many inner city green spaces and parks. These
preserved spaces allow for community enjoyment and enrich the space within the urban city
life. Most of these areas are designated around water features such as streams, rivers and
marshes. The Harewood Community has approximately 4-5 different designated park areas. In
fact, the city Nanaimo is known to be one of the cities with the most green-spaces in
comparison to urban development and population size in all of Canada.
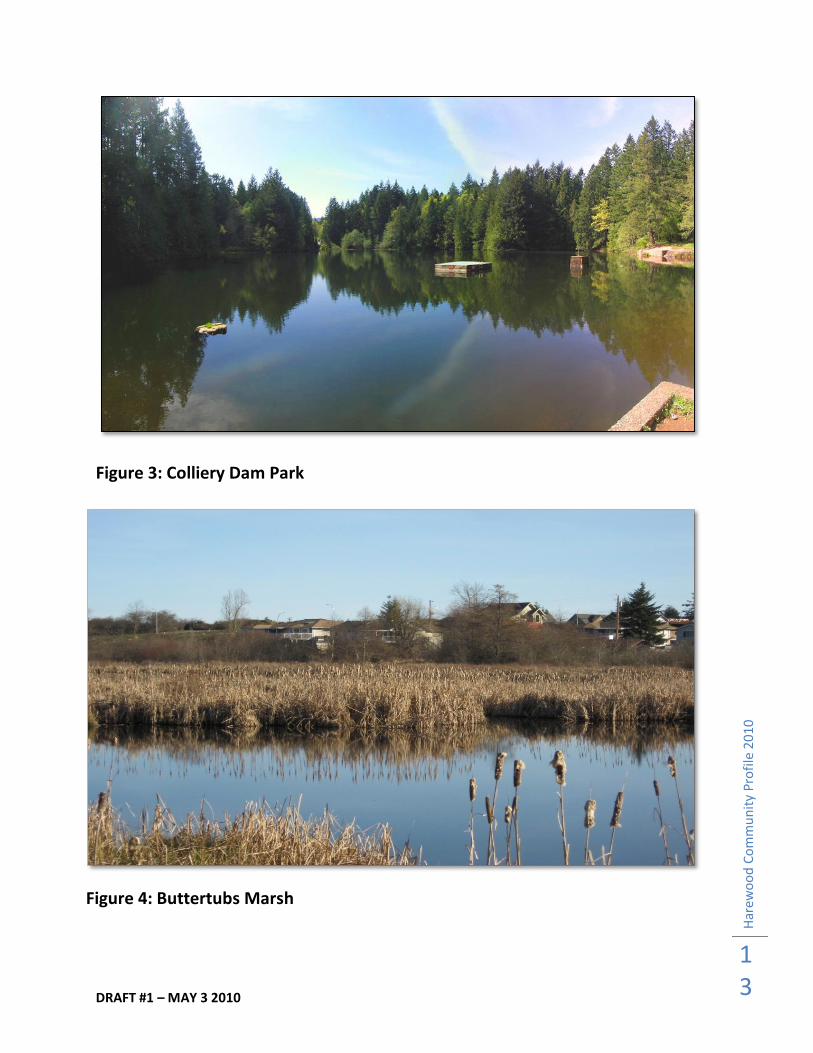
Colliery Dam Park
A central focus in the Harewood Community lays the Colliery Dam Park, full of various trails,
water features, and vegetation. This is a vital communal gathering space in all seasons for the
Harewood area. In the summer it is a crowded swimming and picnic spot, and is a perfect
running/bike trail all year round. Recreation fishing also takes place here. This is a man-made,
multi-level water passage that encompasses two lakes and three dams in total.
Third Street Recreational Area
This park area is located off of Third Street and is adjacent to Jingle Pot Road. It encompasses
the Nanaimo Ice Centre, the Nanaimo Aquatic Center, the Serauxmen Sports Fields and running
track, and an ecological preservation area in between connected with an informative trail.
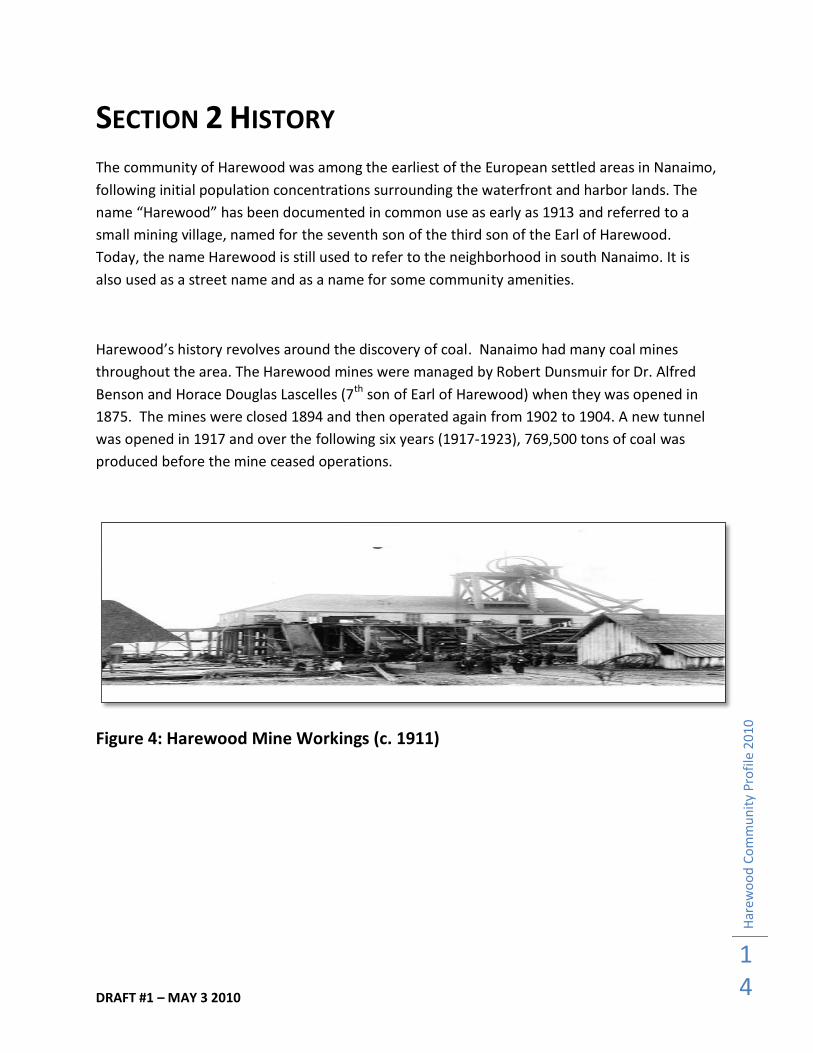
Buttertubs Marsh Conservation Area and Valley Oak Park
Buttertubs Marsh is a man-made park that is a designated bird sanctuary with a variety of bird
species. It is a 100-acre parcel of land with a 2.5 km loop trail that offers residents a forested
area that is like an oasis of nature within the city. At the present time, half of this wilderness
area is privately owned and could be subject to development if is not purchased and preserved
(NALT, 2006).
DRAFT #1 – MAY 3 2010
Har
ewo
od
Co
mm
un
ity
Pro
file
20
10
13
Figure 3: Colliery Dam Park
Figure 4: Buttertubs Marsh
DRAFT #1 – MAY 3 2010
Har
ewo
od
Co
mm
un
ity
Pro
file
20
10
14
SECTION 2 HISTORY
The community of Harewood was among the earliest of the European settled areas in Nanaimo,
following initial population concentrations surrounding the waterfront and harbor lands. The
name “Harewood” has been documented in common use as early as 1913 and referred to a
small mining village, named for the seventh son of the third son of the Earl of Harewood.
Today, the name Harewood is still used to refer to the neighborhood in south Nanaimo. It is
also used as a street name and as a name for some community amenities.
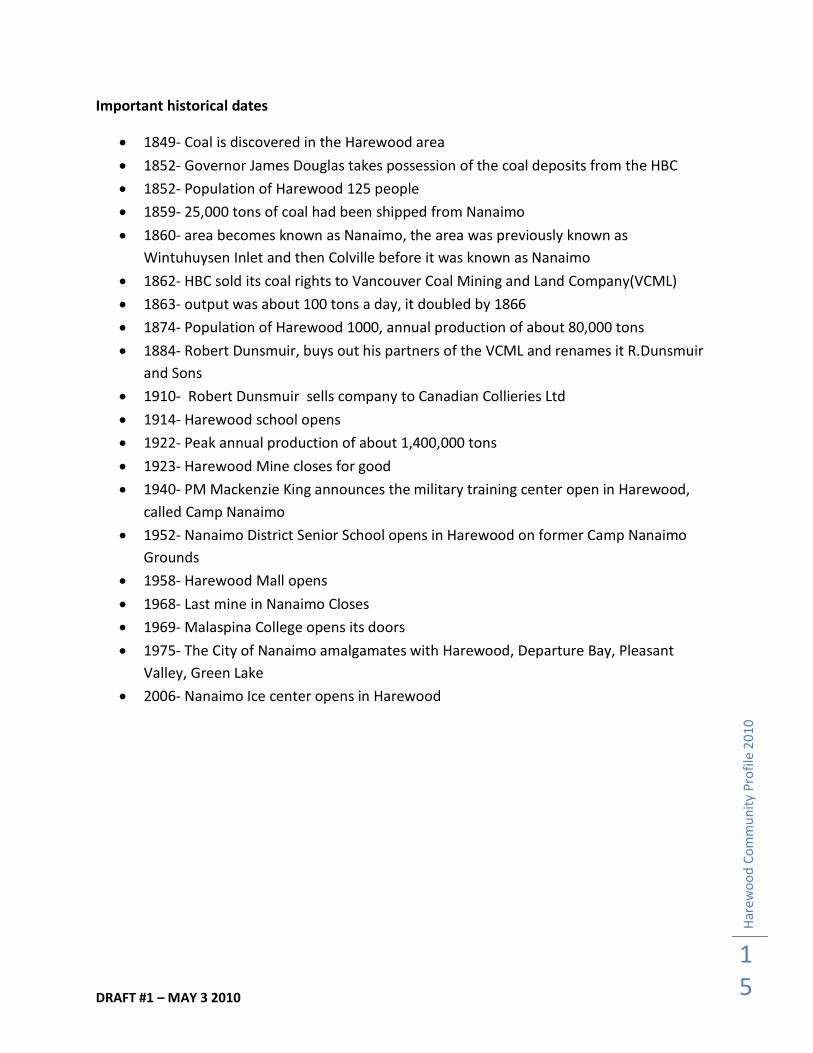
Harewood’s history revolves around the discovery of coal. Nanaimo had many coal mines
throughout the area. The Harewood mines were managed by Robert Dunsmuir for Dr. Alfred
Benson and Horace Douglas Lascelles (7th son of Earl of Harewood) when they was opened in
1875. The mines were closed 1894 and then operated again from 1902 to 1904. A new tunnel
was opened in 1917 and over the following six years (1917-1923), 769,500 tons of coal was
produced before the mine ceased operations.
Figure 4: Harewood Mine Workings (c. 1911)
DRAFT #1 – MAY 3 2010
Har
ewo
od
Co
mm
un
ity
Pro
file
20
10
15
Important historical dates
1849- Coal is discovered in the Harewood area
1852- Governor James Douglas takes possession of the coal deposits from the HBC
1852- Population of Harewood 125 people
1859- 25,000 tons of coal had been shipped from Nanaimo
1860- area becomes known as Nanaimo, the area was previously known as
Wintuhuysen Inlet and then Colville before it was known as Nanaimo
1862- HBC sold its coal rights to Vancouver Coal Mining and Land Company(VCML)
1863- output was about 100 tons a day, it doubled by 1866
1874- Population of Harewood 1000, annual production of about 80,000 tons
1884- Robert Dunsmuir, buys out his partners of the VCML and renames it R.Dunsmuir
and Sons
1910- Robert Dunsmuir sells company to Canadian Collieries Ltd
1914- Harewood school opens
1922- Peak annual production of about 1,400,000 tons
1923- Harewood Mine closes for good
1940- PM Mackenzie King announces the military training center open in Harewood,
called Camp Nanaimo
1952- Nanaimo District Senior School opens in Harewood on former Camp Nanaimo
Grounds
1958- Harewood Mall opens
1968- Last mine in Nanaimo Closes
1969- Malaspina College opens its doors
1975- The City of Nanaimo amalgamates with Harewood, Departure Bay, Pleasant
Valley, Green Lake
2006- Nanaimo Ice center opens in Harewood
DRAFT #1 – MAY 3 2010
Har
ewo
od
Co
mm
un
ity
Pro
file
20
10
16
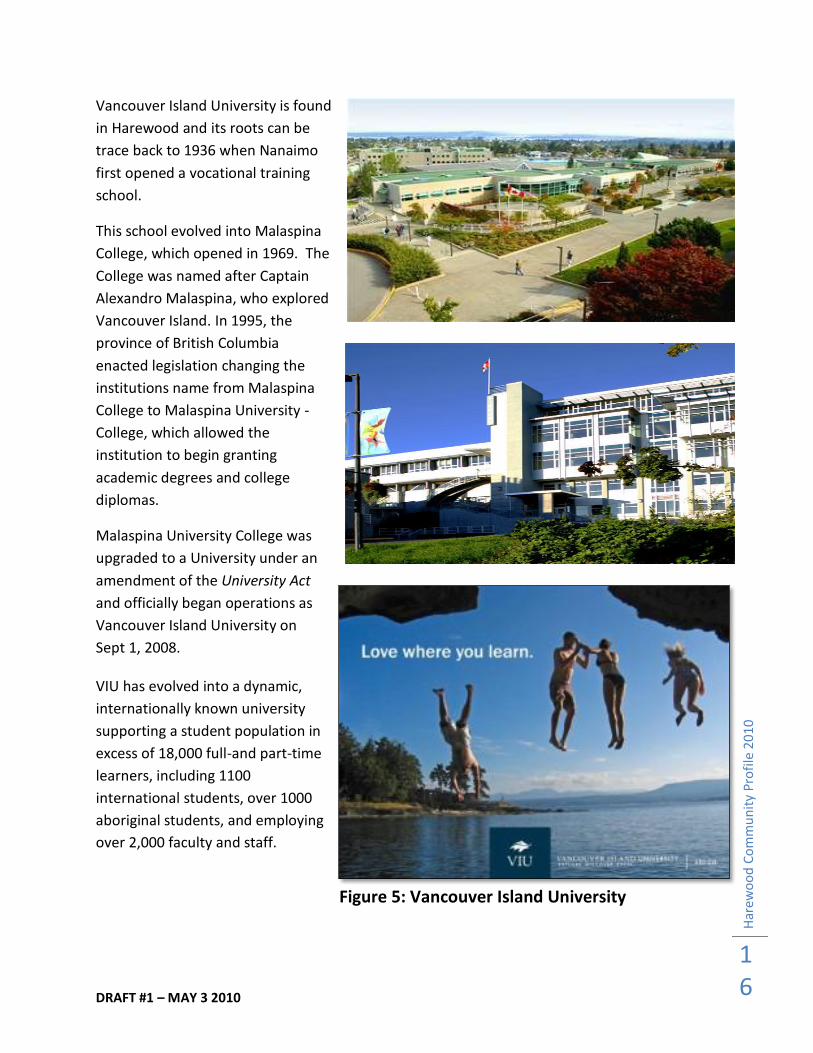
Vancouver Island University is found
in Harewood and its roots can be
trace back to 1936 when Nanaimo
first opened a vocational training
school.
This school evolved into Malaspina
College, which opened in 1969. The
College was named after Captain
Alexandro Malaspina, who explored
Vancouver Island. In 1995, the
province of British Columbia
enacted legislation changing the
institutions name from Malaspina
College to Malaspina University -
College, which allowed the
institution to begin granting
academic degrees and college
diplomas.
Malaspina University College was
upgraded to a University under an
amendment of the University Act
and officially began operations as
Vancouver Island University on
Sept 1, 2008.
VIU has evolved into a dynamic,
internationally known university
supporting a student population in
excess of 18,000 full-and part-time
learners, including 1100
international students, over 1000
aboriginal students, and employing
over 2,000 faculty and staff.
Figure 5: Vancouver Island University
DRAFT #1 – MAY 3 2010
Har
ewo
od
Co
mm
un
ity
Pro
file
20
10
17
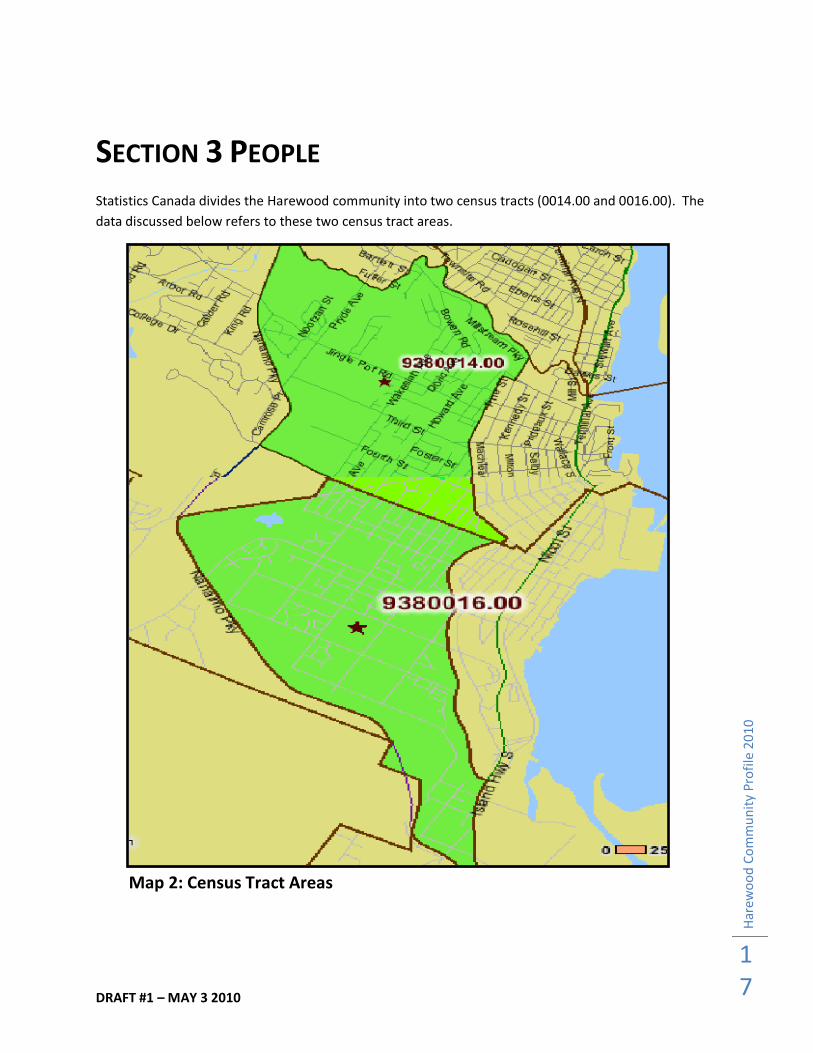
SECTION 3 PEOPLE Statistics Canada divides the Harewood community into two census tracts (0014.00 and 0016.00). The
data discussed below refers to these two census tract areas.
Map 2: Census Tract Areas
DRAFT #1 – MAY 3 2010
Har
ewo
od
Co
mm
un
ity
Pro
file
20
10
18
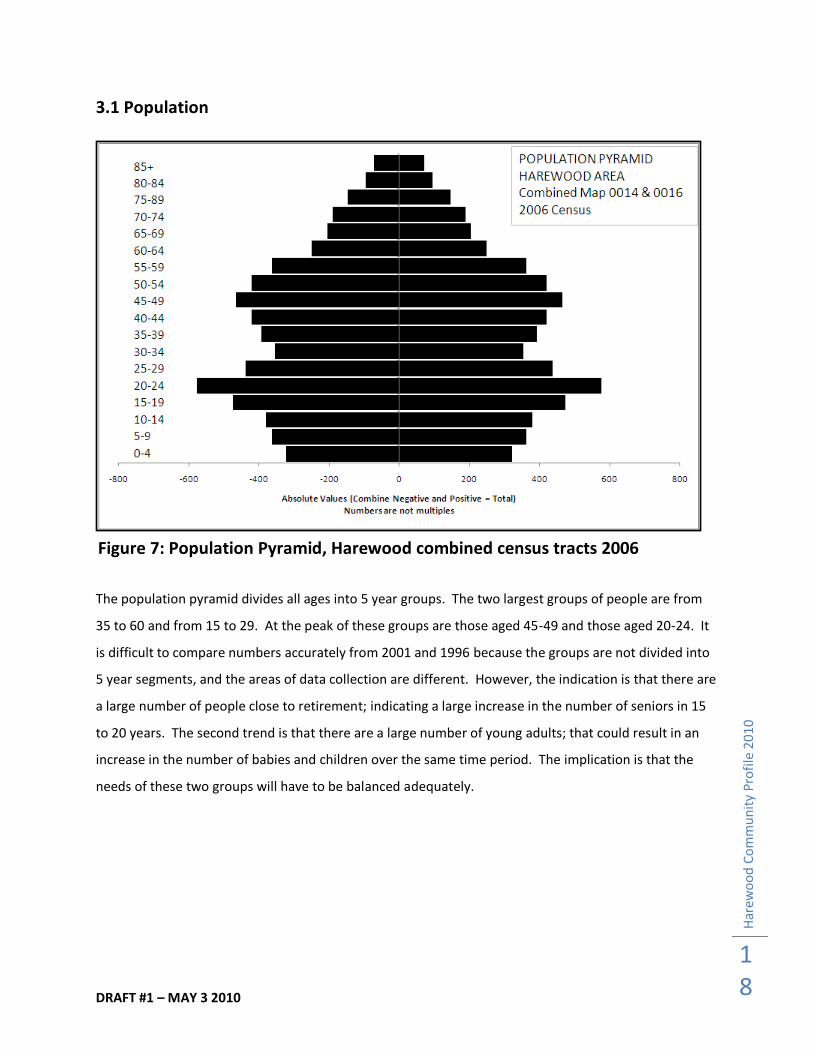
3.1 Population
The population pyramid divides all ages into 5 year groups. The two largest groups of people are from
35 to 60 and from 15 to 29. At the peak of these groups are those aged 45-49 and those aged 20-24. It
is difficult to compare numbers accurately from 2001 and 1996 because the groups are not divided into
5 year segments, and the areas of data collection are different. However, the indication is that there are
a large number of people close to retirement; indicating a large increase in the number of seniors in 15
to 20 years. The second trend is that there are a large number of young adults; that could result in an
increase in the number of babies and children over the same time period. The implication is that the
needs of these two groups will have to be balanced adequately.
Figure 7: Population Pyramid, Harewood combined census tracts 2006
DRAFT #1 – MAY 3 2010
Har
ewo
od
Co
mm
un
ity
Pro
file
20
10
19
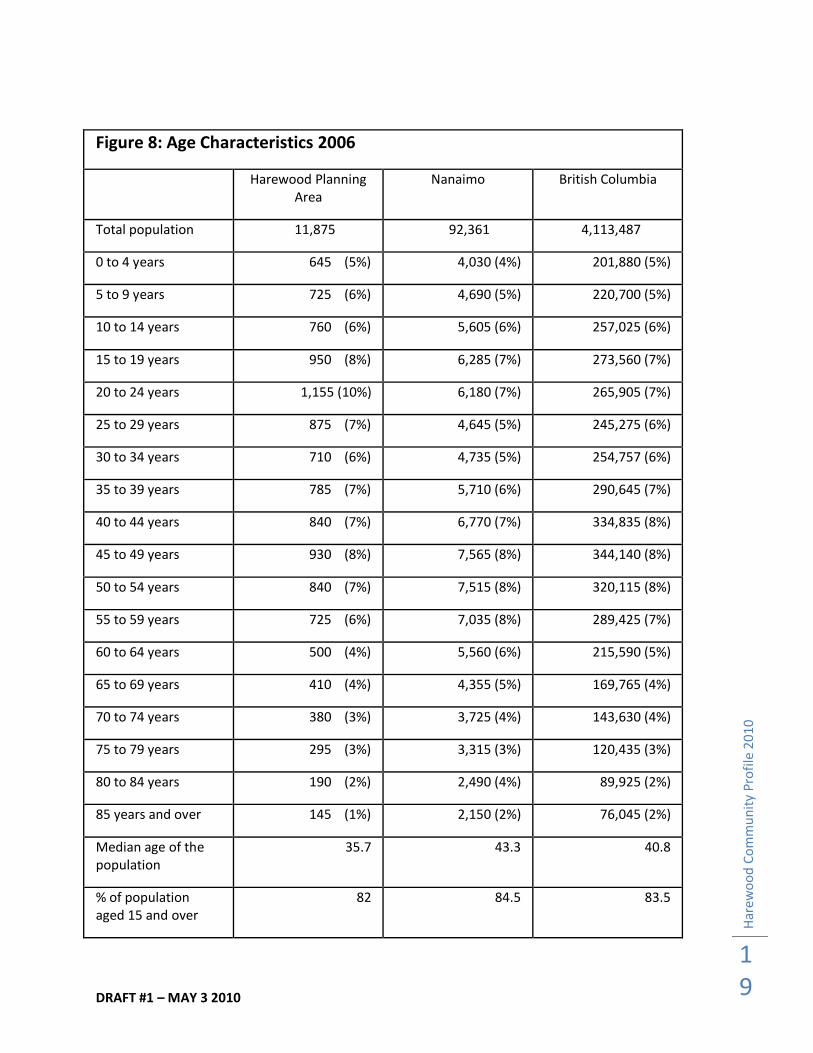
Figure 8: Age Characteristics 2006
Harewood Planning Area
Nanaimo British Columbia
Total population 11,875 92,361 4,113,487
0 to 4 years 645 (5%) 4,030 (4%) 201,880 (5%)
5 to 9 years 725 (6%) 4,690 (5%) 220,700 (5%)
10 to 14 years 760 (6%) 5,605 (6%) 257,025 (6%)
15 to 19 years 950 (8%) 6,285 (7%) 273,560 (7%)
20 to 24 years 1,155 (10%) 6,180 (7%) 265,905 (7%)
25 to 29 years 875 (7%) 4,645 (5%) 245,275 (6%)
30 to 34 years 710 (6%) 4,735 (5%) 254,757 (6%)
35 to 39 years 785 (7%) 5,710 (6%) 290,645 (7%)
40 to 44 years 840 (7%) 6,770 (7%) 334,835 (8%)
45 to 49 years 930 (8%) 7,565 (8%) 344,140 (8%)
50 to 54 years 840 (7%) 7,515 (8%) 320,115 (8%)
55 to 59 years 725 (6%) 7,035 (8%) 289,425 (7%)
60 to 64 years 500 (4%) 5,560 (6%) 215,590 (5%)
65 to 69 years 410 (4%) 4,355 (5%) 169,765 (4%)
70 to 74 years 380 (3%) 3,725 (4%) 143,630 (4%)
75 to 79 years 295 (3%) 3,315 (3%) 120,435 (3%)
80 to 84 years 190 (2%) 2,490 (4%) 89,925 (2%)
85 years and over 145 (1%) 2,150 (2%) 76,045 (2%)
Median age of the population
35.7 43.3 40.8
% of population aged 15 and over
82 84.5 83.5
DRAFT #1 – MAY 3 2010
Har
ewo
od
Co
mm
un
ity
Pro
file
20
10
20
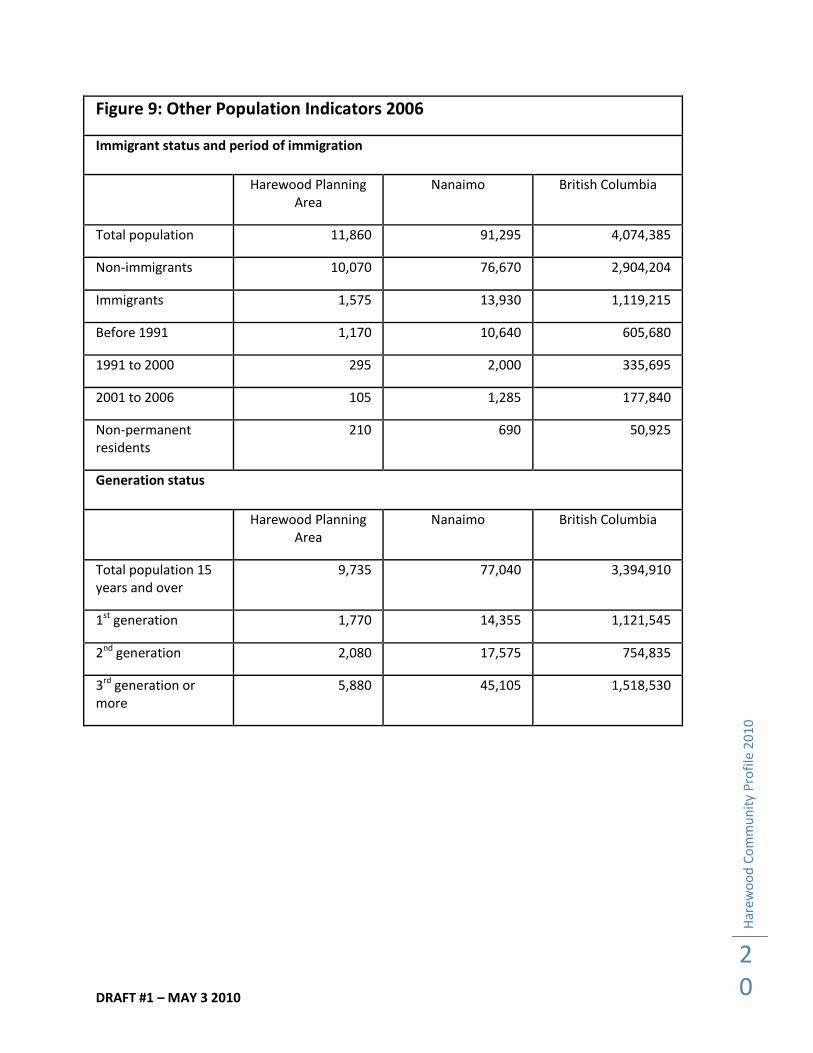
Figure 9: Other Population Indicators 2006
Immigrant status and period of immigration
Harewood Planning Area
Nanaimo British Columbia
Total population 11,860 91,295 4,074,385
Non-immigrants 10,070 76,670 2,904,204
Immigrants 1,575 13,930 1,119,215
Before 1991 1,170 10,640 605,680
1991 to 2000 295 2,000 335,695
2001 to 2006 105 1,285 177,840
Non-permanent residents
210 690 50,925
Generation status
Harewood Planning Area
Nanaimo British Columbia
Total population 15 years and over
9,735 77,040 3,394,910
1st generation 1,770 14,355 1,121,545
2nd generation 2,080 17,575 754,835
3rd generation or more
5,880 45,105 1,518,530
DRAFT #1 – MAY 3 2010
Har
ewo
od
Co
mm
un
ity
Pro
file
20
10
21
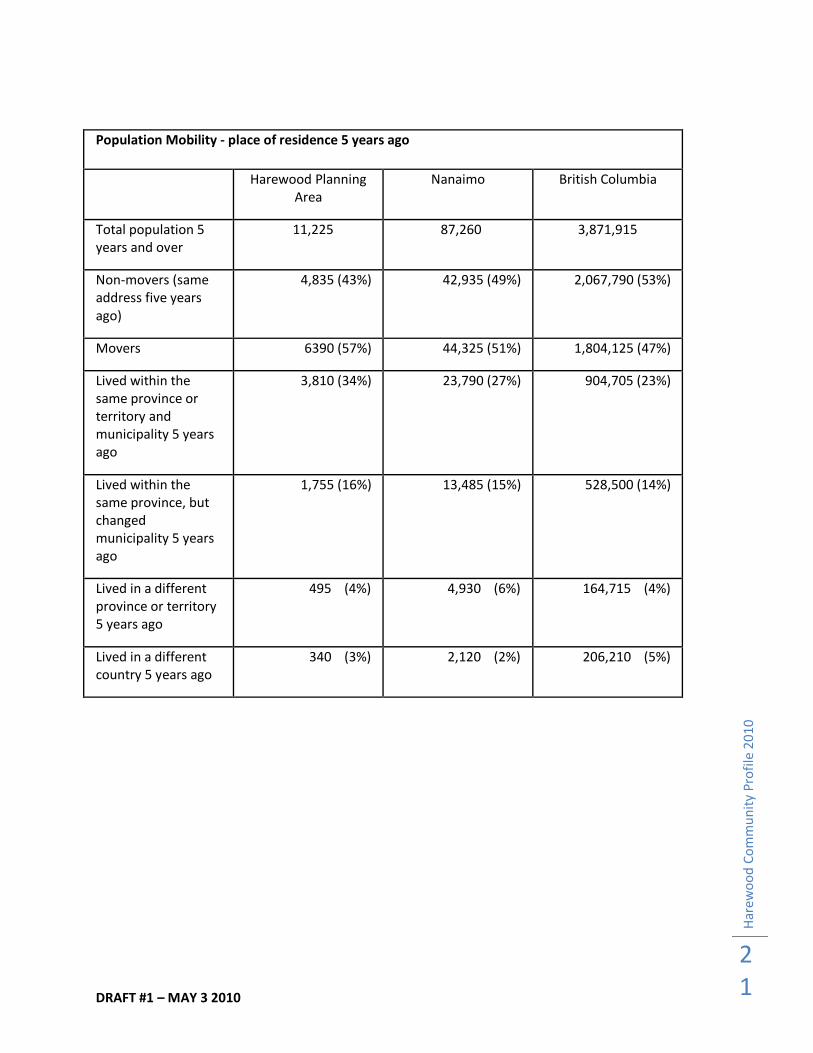
Population Mobility - place of residence 5 years ago
Harewood Planning Area
Nanaimo British Columbia
Total population 5 years and over
11,225 87,260 3,871,915
Non-movers (same address five years ago)
4,835 (43%) 42,935 (49%) 2,067,790 (53%)
Movers 6390 (57%) 44,325 (51%) 1,804,125 (47%)
Lived within the same province or territory and municipality 5 years ago
3,810 (34%) 23,790 (27%) 904,705 (23%)
Lived within the same province, but changed municipality 5 years ago
1,755 (16%) 13,485 (15%) 528,500 (14%)
Lived in a different province or territory 5 years ago
495 (4%) 4,930 (6%) 164,715 (4%)
Lived in a different country 5 years ago
340 (3%) 2,120 (2%) 206,210 (5%)
DRAFT #1 – MAY 3 2010
Har
ewo
od
Co
mm
un
ity
Pro
file
20
10
22
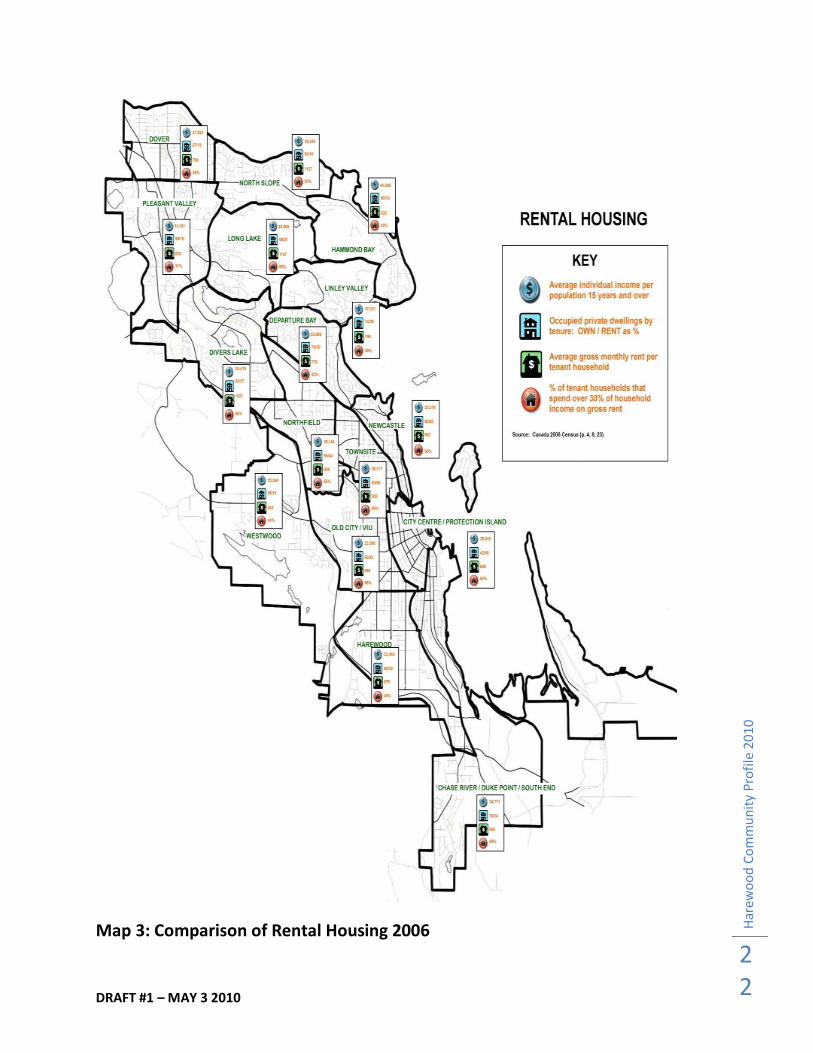
Map 3: Comparison of Rental Housing 2006
DRAFT #1 – MAY 3 2010
Har
ewo
od
Co
mm
un
ity
Pro
file
20
10
23
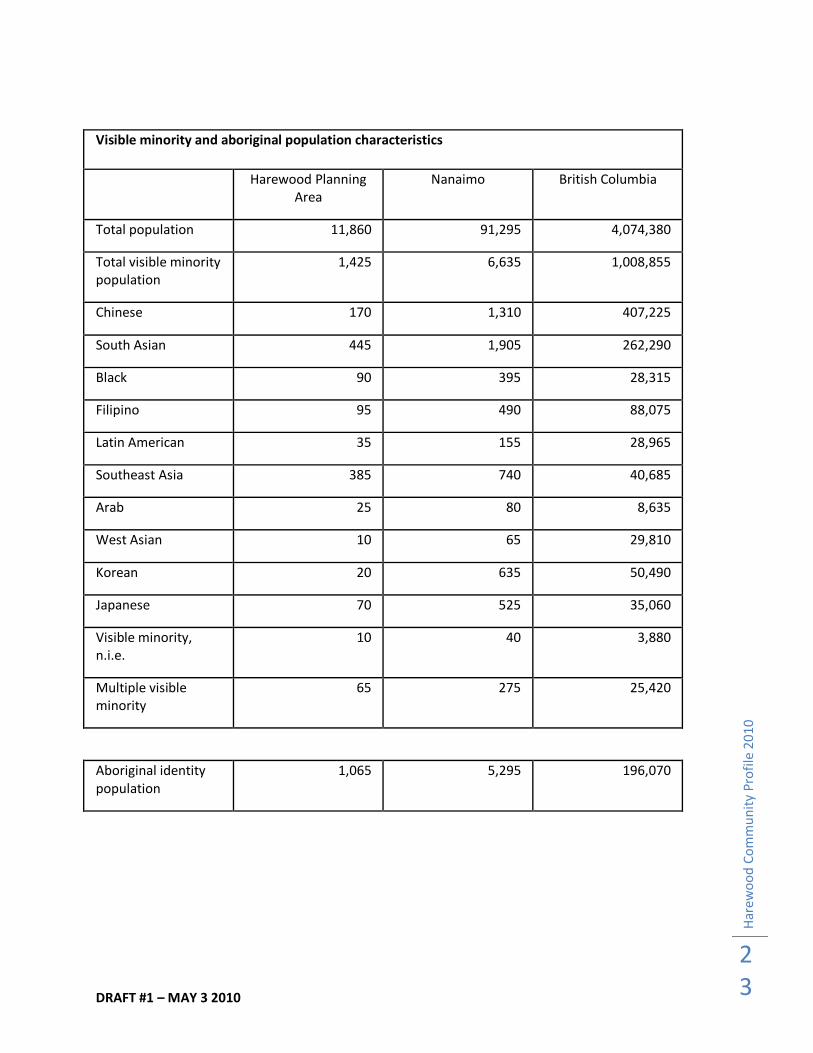
Visible minority and aboriginal population characteristics
Harewood Planning Area
Nanaimo British Columbia
Total population 11,860 91,295 4,074,380
Total visible minority population
1,425 6,635 1,008,855
Chinese 170 1,310 407,225
South Asian 445 1,905 262,290
Black 90 395 28,315
Filipino 95 490 88,075
Latin American 35 155 28,965
Southeast Asia 385 740 40,685
Arab 25 80 8,635
West Asian 10 65 29,810
Korean 20 635 50,490
Japanese 70 525 35,060
Visible minority, n.i.e.
10 40 3,880
Multiple visible minority
65 275 25,420
Aboriginal identity population
1,065 5,295 196,070
DRAFT #1 – MAY 3 2010
Har
ewo
od
Co
mm
un
ity
Pro
file
20
10
24
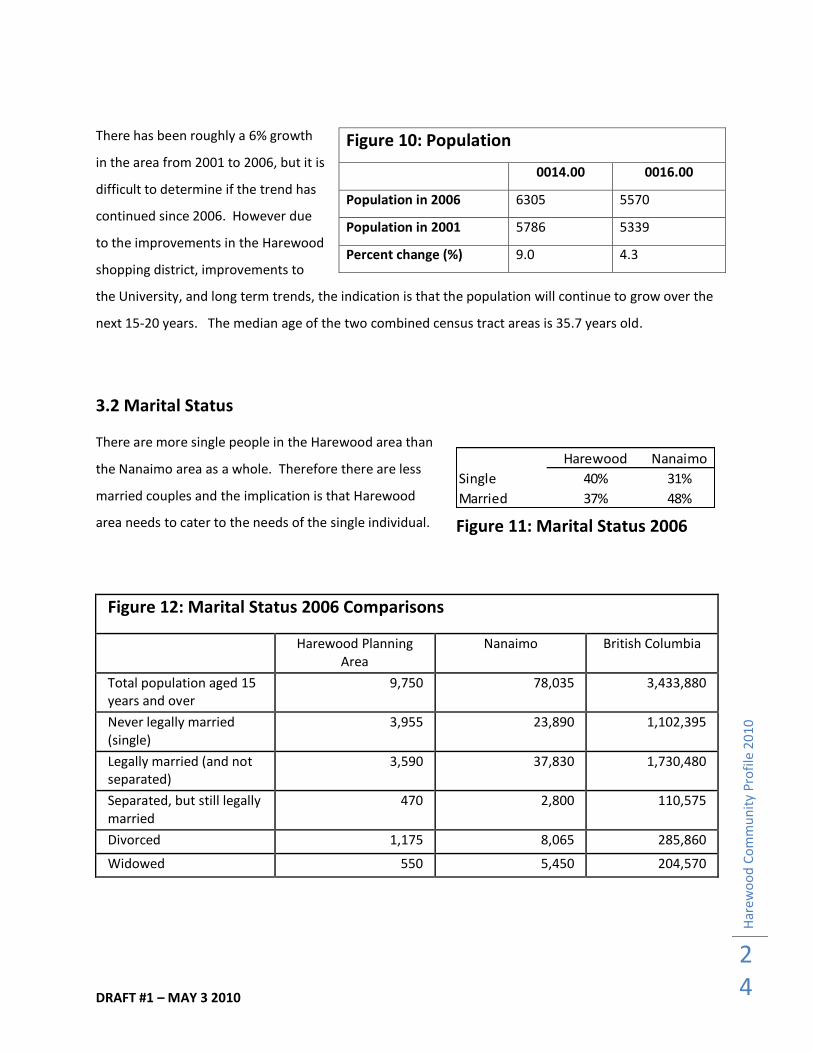
Harewood Nanaimo
Single 40% 31%
Married 37% 48%
There has been roughly a 6% growth
in the area from 2001 to 2006, but it is
difficult to determine if the trend has
continued since 2006. However due
to the improvements in the Harewood
shopping district, improvements to
the University, and long term trends, the indication is that the population will continue to grow over the
next 15-20 years. The median age of the two combined census tract areas is 35.7 years old.
3.2 Marital Status
There are more single people in the Harewood area than
the Nanaimo area as a whole. Therefore there are less
married couples and the implication is that Harewood
area needs to cater to the needs of the single individual.
Figure 12: Marital Status 2006 Comparisons
Harewood Planning Area
Nanaimo British Columbia
Total population aged 15 years and over
9,750 78,035 3,433,880
Never legally married (single)
3,955 23,890 1,102,395
Legally married (and not separated)
3,590 37,830 1,730,480
Separated, but still legally married
470 2,800 110,575
Divorced 1,175 8,065 285,860
Widowed 550 5,450 204,570
Figure 10: Population
0014.00 0016.00
Population in 2006 6305 5570
Population in 2001 5786 5339
Percent change (%) 9.0 4.3
Figure 11: Marital Status 2006
DRAFT #1 – MAY 3 2010
Har
ewo
od
Co
mm
un
ity
Pro
file
20
10
25
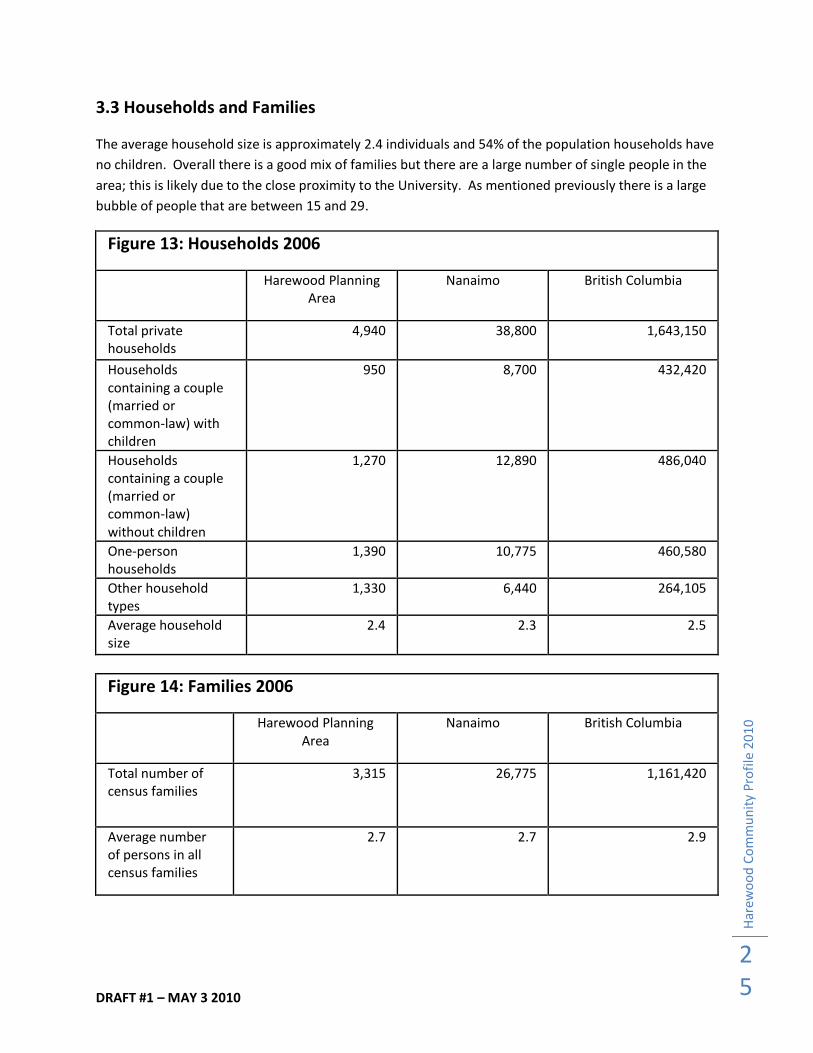
3.3 Households and Families
The average household size is approximately 2.4 individuals and 54% of the population households have
no children. Overall there is a good mix of families but there are a large number of single people in the
area; this is likely due to the close proximity to the University. As mentioned previously there is a large
bubble of people that are between 15 and 29.
Figure 13: Households 2006
Harewood Planning Area
Nanaimo British Columbia
Total private households
4,940 38,800 1,643,150
Households containing a couple (married or common-law) with children
950 8,700 432,420
Households containing a couple (married or common-law) without children
1,270 12,890 486,040
One-person households
1,390 10,775 460,580
Other household types
1,330 6,440 264,105
Average household size
2.4 2.3 2.5
Figure 14: Families 2006
Harewood Planning Area
Nanaimo British Columbia
Total number of census families
3,315
26,775 1,161,420
Average number of persons in all census families
2.7 2.7 2.9
DRAFT #1 – MAY 3 2010
Har
ewo
od
Co
mm
un
ity
Pro
file
20
10
26
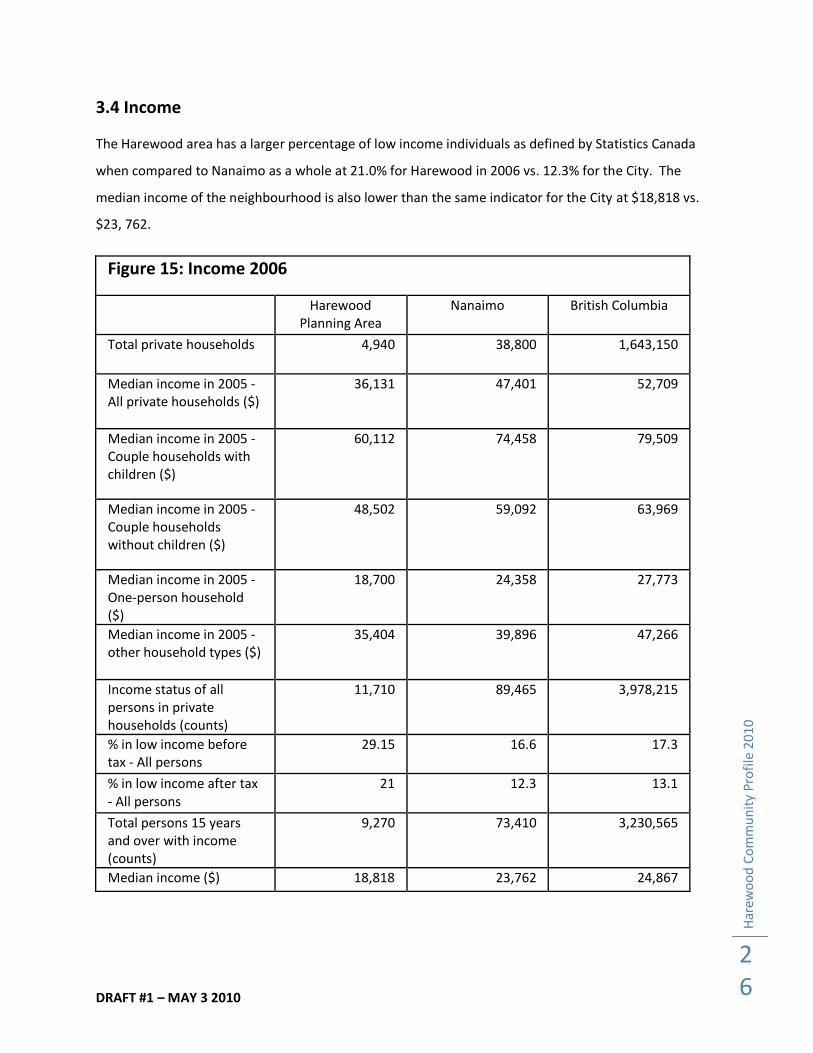
3.4 Income
The Harewood area has a larger percentage of low income individuals as defined by Statistics Canada
when compared to Nanaimo as a whole at 21.0% for Harewood in 2006 vs. 12.3% for the City. The
median income of the neighbourhood is also lower than the same indicator for the City at $18,818 vs.
$23, 762.
Figure 15: Income 2006
Harewood Planning Area
Nanaimo British Columbia
Total private households 4,940 38,800 1,643,150
Median income in 2005 - All private households ($)
36,131 47,401 52,709
Median income in 2005 - Couple households with children ($)
60,112 74,458 79,509
Median income in 2005 - Couple households without children ($)
48,502 59,092 63,969
Median income in 2005 - One-person household ($)
18,700 24,358 27,773
Median income in 2005 - other household types ($)
35,404 39,896 47,266
Income status of all persons in private households (counts)
11,710 89,465 3,978,215
% in low income before tax - All persons
29.15 16.6 17.3
% in low income after tax - All persons
21 12.3 13.1
Total persons 15 years and over with income (counts)
9,270 73,410 3,230,565
Median income ($) 18,818 23,762 24,867
DRAFT #1 – MAY 3 2010
Har
ewo
od
Co
mm
un
ity
Pro
file
20
10
27
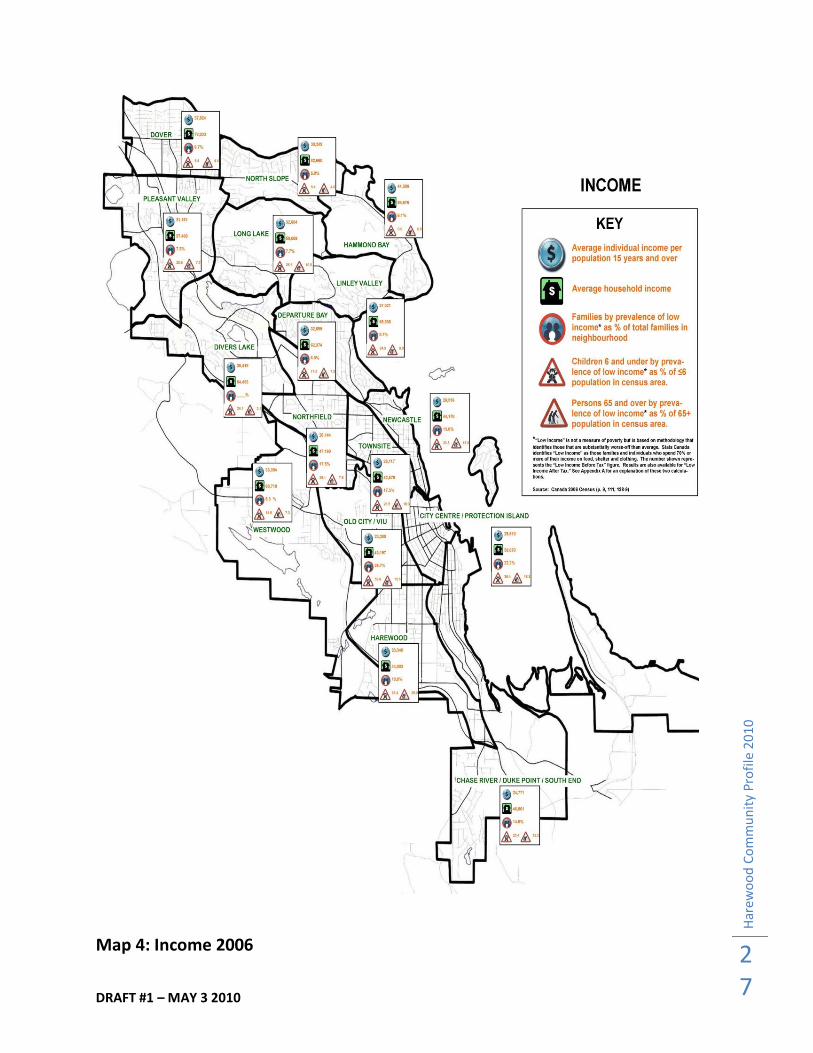
Map 4: Income 2006
DRAFT #1 – MAY 3 2010
Har
ewo
od
Co
mm
un
ity
Pro
file
20
10
28
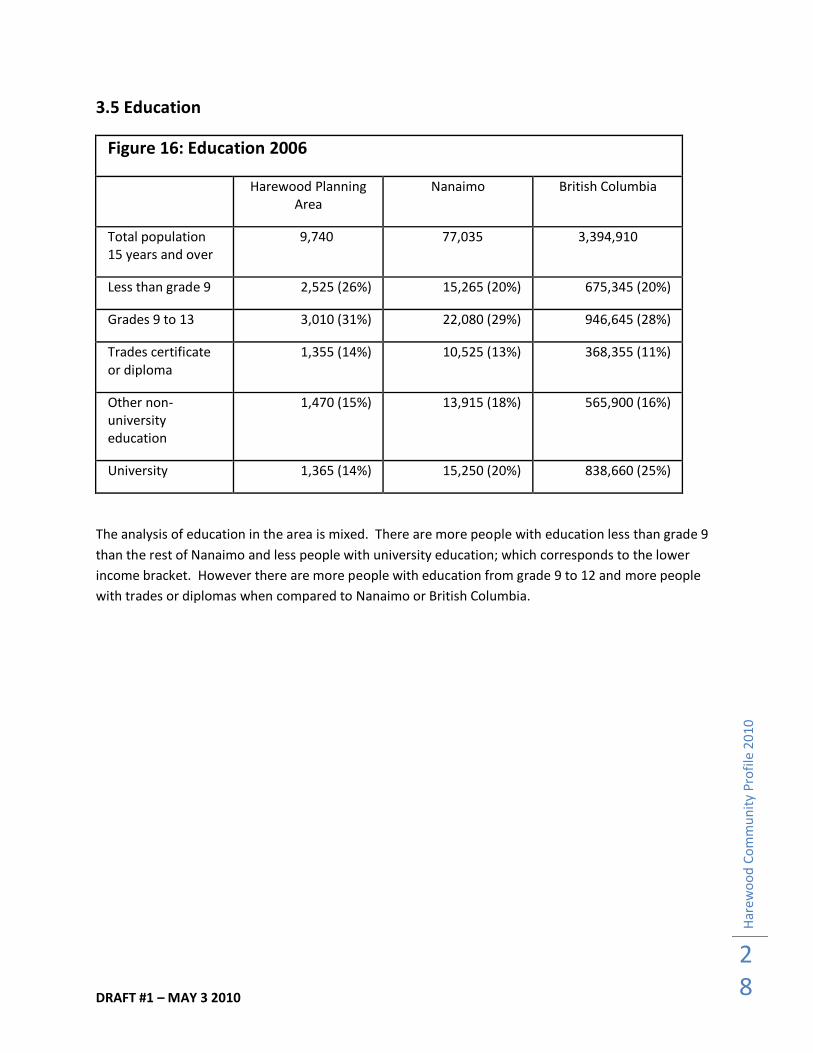
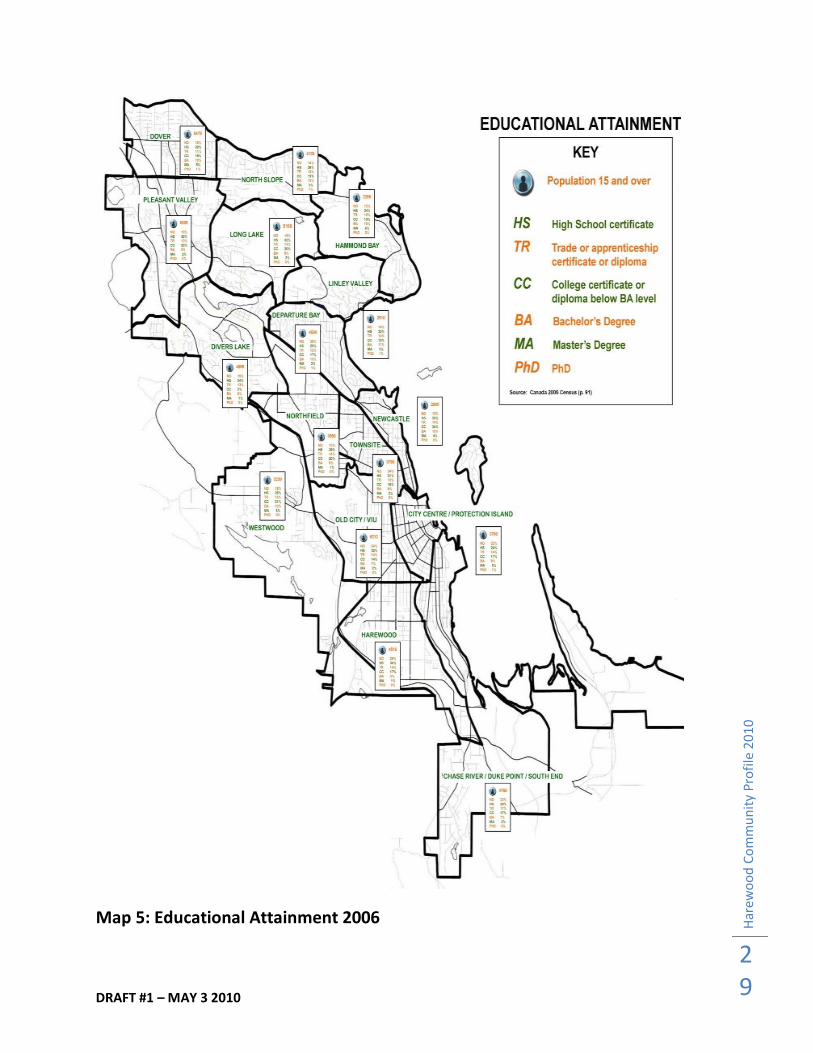
3.5 Education
Figure 16: Education 2006
Harewood Planning Area
Nanaimo British Columbia
Total population 15 years and over
9,740 77,035 3,394,910
Less than grade 9 2,525 (26%) 15,265 (20%) 675,345 (20%)
Grades 9 to 13 3,010 (31%) 22,080 (29%) 946,645 (28%)
Trades certificate or diploma
1,355 (14%) 10,525 (13%) 368,355 (11%)
Other non-university education
1,470 (15%) 13,915 (18%) 565,900 (16%)
University 1,365 (14%) 15,250 (20%) 838,660 (25%)
The analysis of education in the area is mixed. There are more people with education less than grade 9
than the rest of Nanaimo and less people with university education; which corresponds to the lower
income bracket. However there are more people with education from grade 9 to 12 and more people
with trades or diplomas when compared to Nanaimo or British Columbia.
DRAFT #1 – MAY 3 2010
Har
ewo
od
Co
mm
un
ity
Pro
file
20
10
29
Map 5: Educational Attainment 2006
DRAFT #1 – MAY 3 2010
Har
ewo
od
Co
mm
un
ity
Pro
file
20
10
30
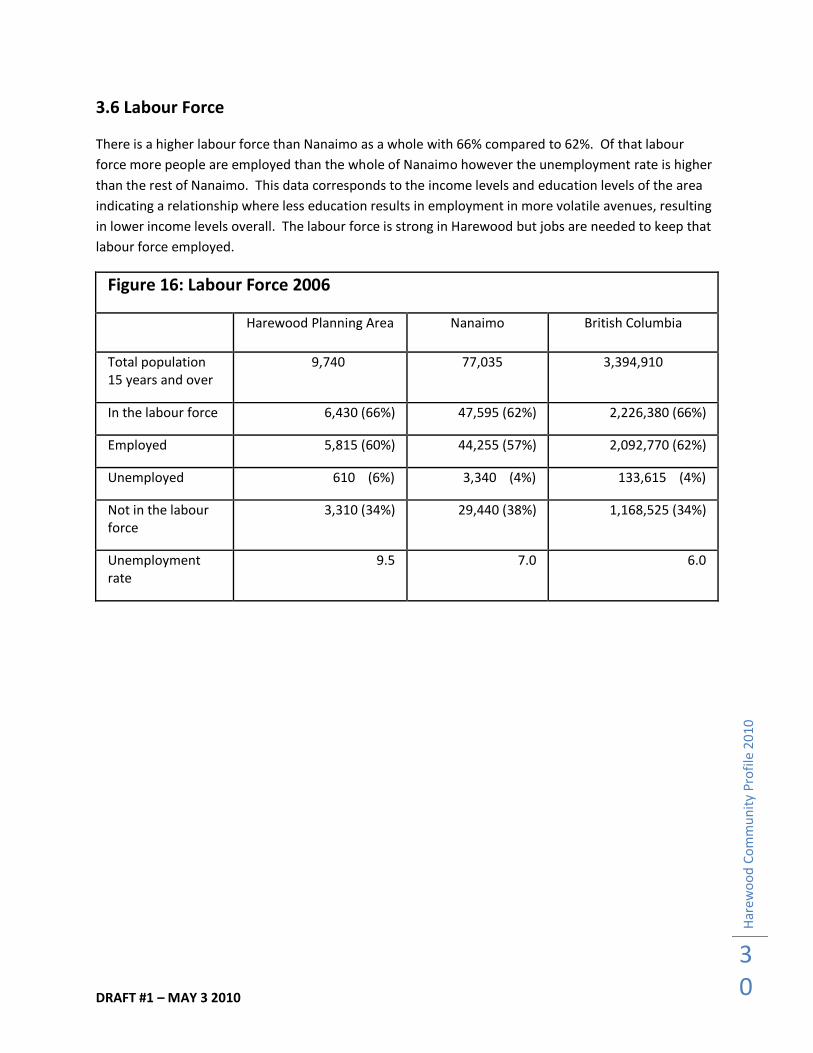
3.6 Labour Force
There is a higher labour force than Nanaimo as a whole with 66% compared to 62%. Of that labour
force more people are employed than the whole of Nanaimo however the unemployment rate is higher
than the rest of Nanaimo. This data corresponds to the income levels and education levels of the area
indicating a relationship where less education results in employment in more volatile avenues, resulting
in lower income levels overall. The labour force is strong in Harewood but jobs are needed to keep that
labour force employed.
Figure 16: Labour Force 2006
Harewood Planning Area Nanaimo British Columbia
Total population 15 years and over
9,740 77,035 3,394,910
In the labour force 6,430 (66%) 47,595 (62%) 2,226,380 (66%)
Employed 5,815 (60%) 44,255 (57%) 2,092,770 (62%)
Unemployed 610 (6%) 3,340 (4%) 133,615 (4%)
Not in the labour force
3,310 (34%) 29,440 (38%) 1,168,525 (34%)
Unemployment rate
9.5 7.0 6.0
DRAFT #1 – MAY 3 2010
Har
ewo
od
Co
mm
un
ity
Pro
file
20
10
31
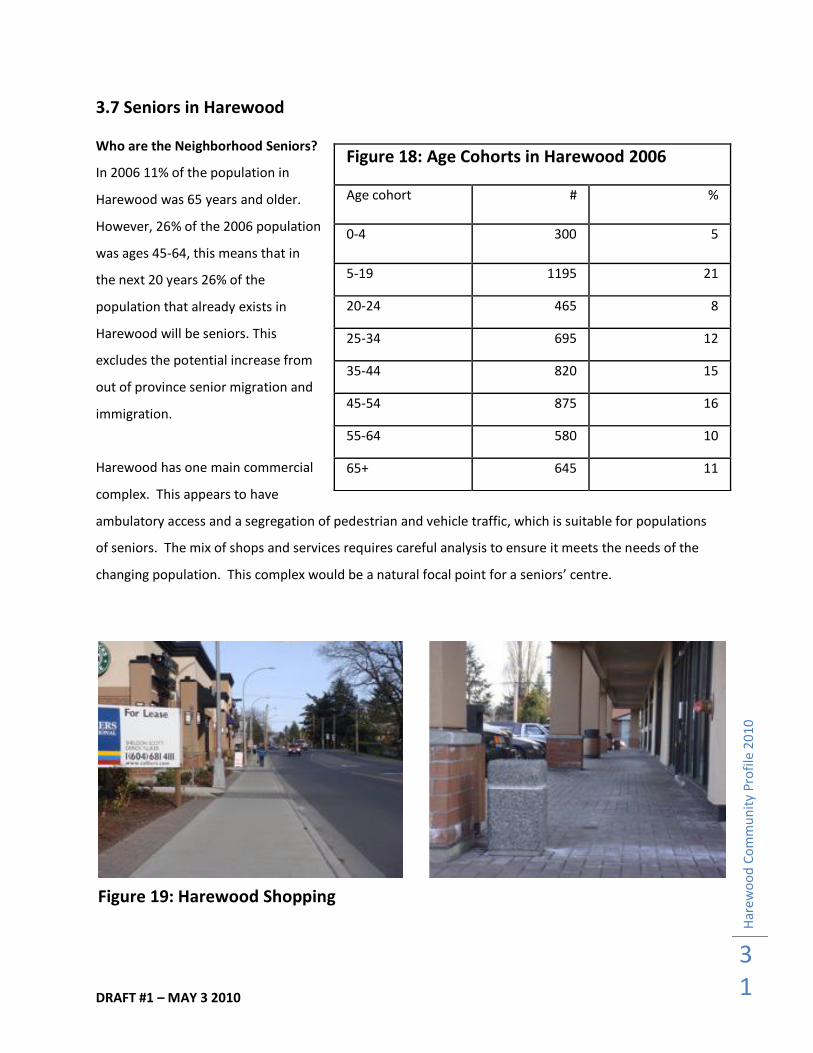
3.7 Seniors in Harewood
Who are the Neighborhood Seniors?
In 2006 11% of the population in
Harewood was 65 years and older.
However, 26% of the 2006 population
was ages 45-64, this means that in
the next 20 years 26% of the
population that already exists in
Harewood will be seniors. This
excludes the potential increase from
out of province senior migration and
immigration.
Harewood has one main commercial
complex. This appears to have
ambulatory access and a segregation of pedestrian and vehicle traffic, which is suitable for populations
of seniors. The mix of shops and services requires careful analysis to ensure it meets the needs of the
changing population. This complex would be a natural focal point for a seniors’ centre.
Figure 18: Age Cohorts in Harewood 2006
Age cohort # %
0-4 300 5
5-19 1195 21
20-24 465 8
25-34 695 12
35-44 820 15
45-54 875 16
55-64 580 10
65+ 645 11
Figure 19: Harewood Shopping
DRAFT #1 – MAY 3 2010
Har
ewo
od
Co
mm
un
ity
Pro
file
20
10
32
Public transit will also be an issue for the neighbourhood in the coming years. Handi Dart exists on a
fairly limited basis. Traditional public transit (a bus once an hour) is not always the most practical
solution for the growing number of senior citizens. A senior’s transit service that is specially equipped
should be considered for this neighbourhood.
Harewood contains mostly single family dwellings, as well as a few scattered sections of town homes as
multi-family dwellings. Housing targeted specifically for seniors will be required in the coming years.
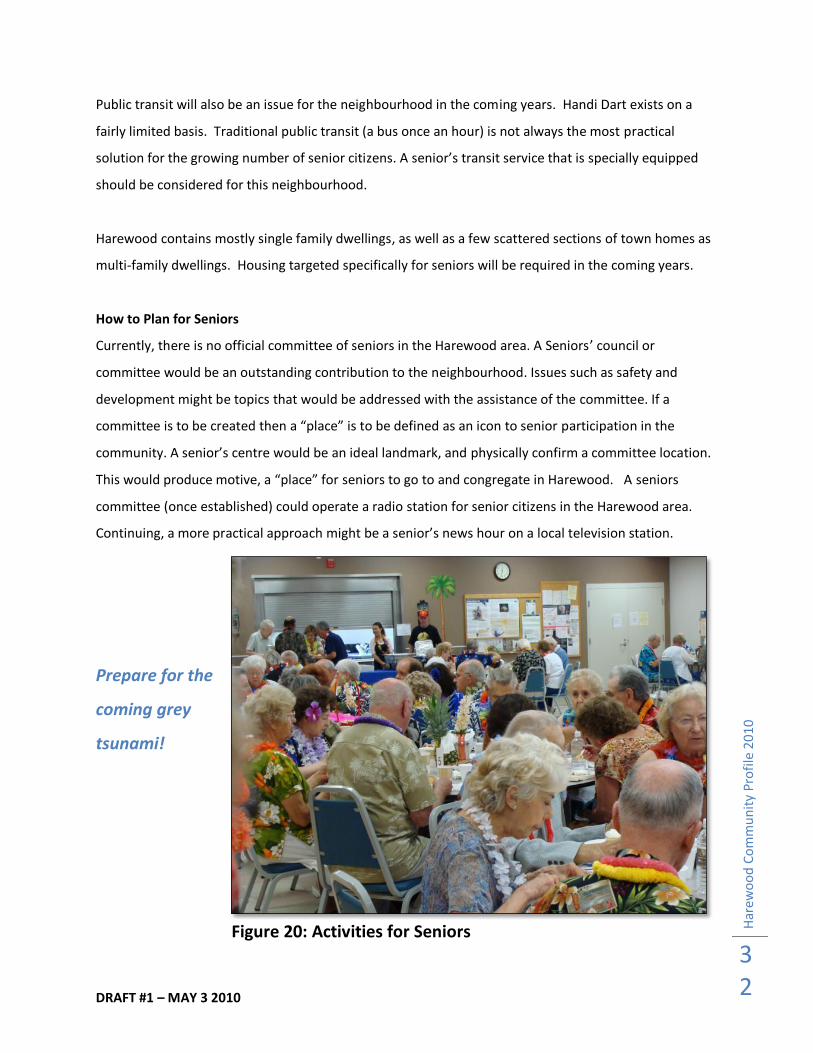
How to Plan for Seniors
Currently, there is no official committee of seniors in the Harewood area. A Seniors’ council or
committee would be an outstanding contribution to the neighbourhood. Issues such as safety and
development might be topics that would be addressed with the assistance of the committee. If a
committee is to be created then a “place” is to be defined as an icon to senior participation in the
community. A senior’s centre would be an ideal landmark, and physically confirm a committee location.
This would produce motive, a “place” for seniors to go to and congregate in Harewood. A seniors
committee (once established) could operate a radio station for senior citizens in the Harewood area.
Continuing, a more practical approach might be a senior’s news hour on a local television station.
Prepare for the
coming grey
tsunami!
Figure 20: Activities for Seniors
DRAFT #1 – MAY 3 2010
Har
ewo
od
Co
mm
un
ity
Pro
file
20
10
33
SECTION 4 INFRASTRUCTURE
4.1 Water
The residents within the Harewood community are provided water by the South Nanaimo Rider
Watershed. As well, under the City of Nanaimo, Harewood residents are included in the Water
Supply Strategic Plan.
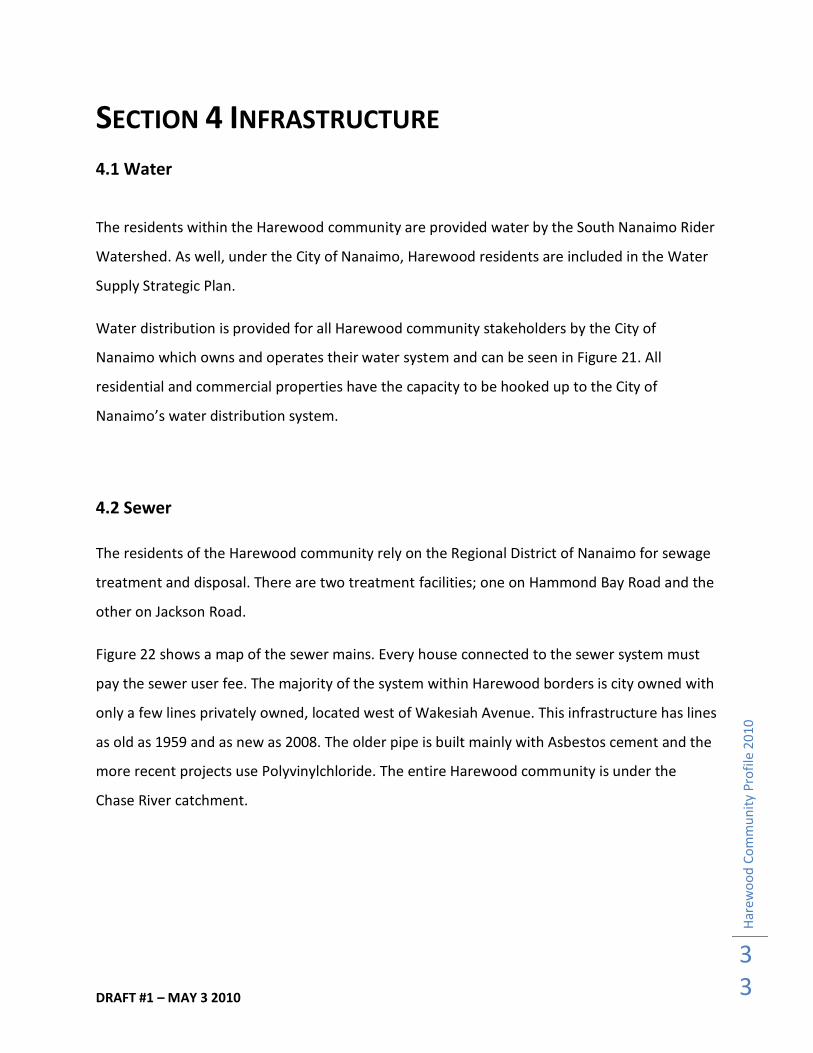
Water distribution is provided for all Harewood community stakeholders by the City of
Nanaimo which owns and operates their water system and can be seen in Figure 21. All
residential and commercial properties have the capacity to be hooked up to the City of
Nanaimo’s water distribution system.
4.2 Sewer
The residents of the Harewood community rely on the Regional District of Nanaimo for sewage
treatment and disposal. There are two treatment facilities; one on Hammond Bay Road and the
other on Jackson Road.
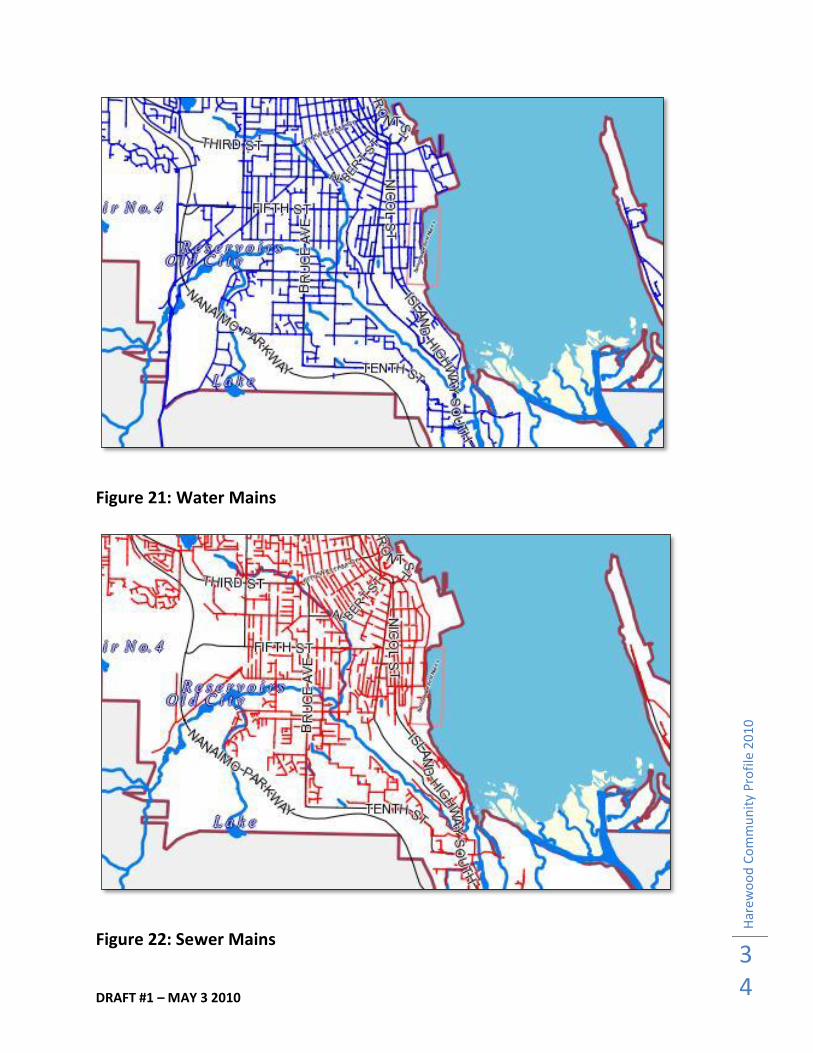
Figure 22 shows a map of the sewer mains. Every house connected to the sewer system must
pay the sewer user fee. The majority of the system within Harewood borders is city owned with
only a few lines privately owned, located west of Wakesiah Avenue. This infrastructure has lines
as old as 1959 and as new as 2008. The older pipe is built mainly with Asbestos cement and the
more recent projects use Polyvinylchloride. The entire Harewood community is under the
Chase River catchment.
DRAFT #1 – MAY 3 2010
Har
ewo
od
Co
mm
un
ity
Pro
file
20
10
34
Figure 21: Water Mains
Figure 22: Sewer Mains
DRAFT #1 – MAY 3 2010
Har
ewo
od
Co
mm
un
ity
Pro
file
20
10
35
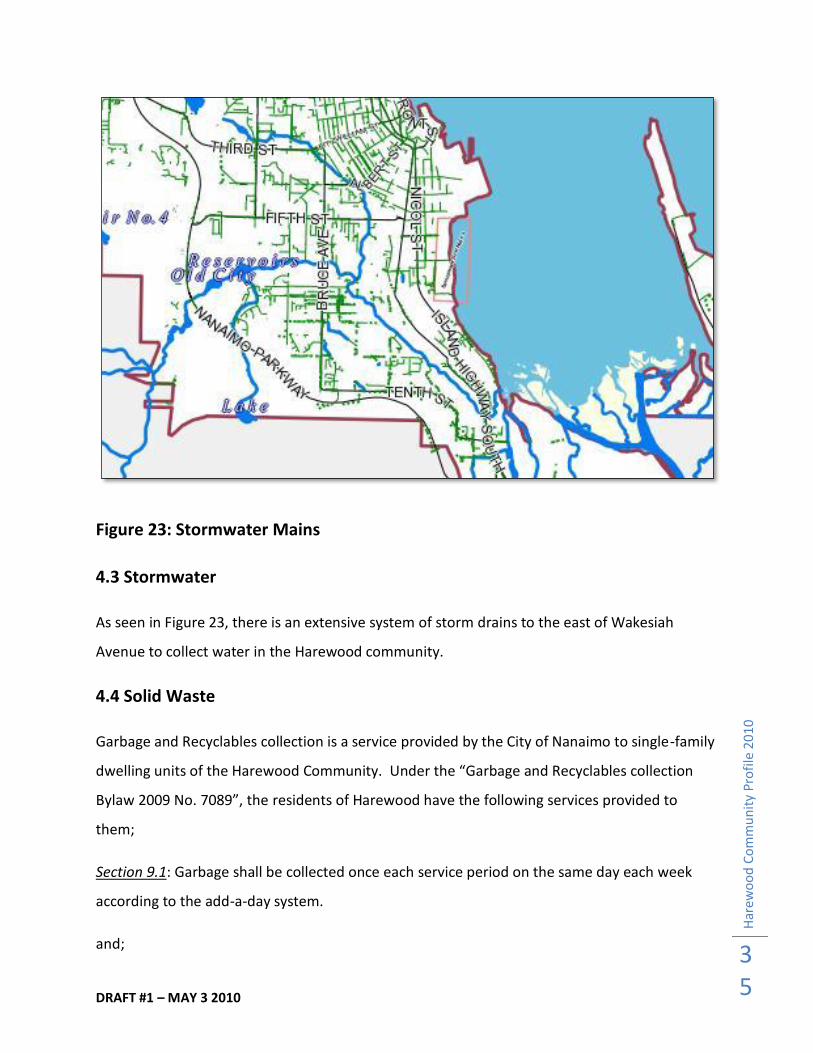
Figure 23: Stormwater Mains
4.3 Stormwater
As seen in Figure 23, there is an extensive system of storm drains to the east of Wakesiah
Avenue to collect water in the Harewood community.
4.4 Solid Waste
Garbage and Recyclables collection is a service provided by the City of Nanaimo to single-family
dwelling units of the Harewood Community. Under the “Garbage and Recyclables collection
Bylaw 2009 No. 7089”, the residents of Harewood have the following services provided to
them;
Section 9.1: Garbage shall be collected once each service period on the same day each week
according to the add-a-day system.
and;
DRAFT #1 – MAY 3 2010
Har
ewo
od
Co
mm
un
ity
Pro
file
20
10
36
Section 10.1: Recyclable materials shall be collected once every second scheduled garbage
collection during and on the same day as the scheduled garbage collection.
The residents of Harewood can receive a garbage and recyclable collection schedule by visiting
the City of Nanaimo website. Residential property owners must pay for basic garbage collection
and recycling services. Private businesses in the Harewood community must arrange and pay to
have their garbage and recycling collected or can choose to self-haul.
The Nanaimo Regional District operates a landfill site located south of the city at 1105 Cedar
Road, Nanaimo, B.C.

DRAFT #1 – MAY 3 2010
Har
ewo
od
Co
mm
un
ity
Pro
file
20
10
37
SECTION 5 AGRICULTURE AND FOOD SECURITY
The Harewood area has little to no agriculture land at present, although it does have many
different food security organizations and groups that are continually working towards
improving the neighborhood through sustainable food solutions. Some of these organizations
include:
Nanaimo Food Share
Nanaimo Community Gardens
Nanaimo Community Kitchens
Food Link Nanaimo
7 to 10 Club
Loaves and Fishes
All of these organizations are working together to create a community that will thrive together
through food security.
Nanaimo Food Share
Nanaimo Food Share is an organization that helps all people in the community from all age
groups. They are a group committed to help people develop the skills they need to increase
food security, build community, and be self-sufficient. Through their programs, workshops, and
community networks, their aim is to educate and empower by sharing not just food -- but also
information, resources, workloads, and new opportunities. Some of the programs that are
offered by Food Share are:
Good Food Box is a once a month produce box that helps the community stretch their
food dollar.
Gleaning is a program that matches those with excess produce with those who can
make good use of it.

DRAFT #1 – MAY 3 2010
Har
ewo
od
Co
mm
un
ity
Pro
file
20
10
38
Growin on up! Is a weekly drop-in nutrition and food/life skills program aimed at young
moms and their children.
HomeGrown is a 30-week program designed to provide youth with the skills, tools, and
support they need to gain hands-on work experience in the small scale agriculture,
horticulture, and local food sectors.
Scratch is a valuable 8 week food/cooking skills program for youth in grades 8-10.
Kids Get Cooking is an after school and summertime hands-in healthy cooking program
aimed at city kids.
Summer Lunch Munch Provides nutritious lunches and nutritional information to kids at
inner city parks during the holidays.
WeFeast is the "Woman's Entrepreneurial Food Enterprise and Skills Training" program.
Supports low-income women to develop micro-enterprises in the food industry.
The Nanaimo Food Share is located at:
Food Share Center, 271 Pine St.
Nanaimo Community Gardens
The Nanaimo Community Gardens Society (NCGS) recognizes that a sustainable food system is
the foundation of a healthy community. To work with people to grow more food in the region
because growing food locally is vital to a healthy community and environment. Their programs
and services get individuals and families active in growing, sharing, buying and eating local
foods. They envision our community abundant in food, and our culture and economy respectful
of our dependence on the earth’s resources for survival.
The Community Gardens work in collaboration with individuals, agencies and government to
get more food grown, shared, and purchased locally. And recognizes that sustainable food
production is a vital part of creating a healthy community in which all people have access to
DRAFT #1 – MAY 3 2010
Har
ewo
od
Co
mm
un
ity
Pro
file
20
10
39
nutritious food, clean water, pure air and bio-diverse green spaces. Some of the Programs that
the Nanaimo Community Gardens have are:
Gleaning
Learn to grow
Sharing Backyards
Many Workshops for all ages
They are located at:
Food Share Center, 271 Pine St.
Nanaimo Community Kitchens
Nanaimo Community Kitchens became a Society in 1993. It is a place where participants build
skills, knowledge, friendships, and self-esteem while preparing low-cost healthy meals. A
community kitchen is a place where a group of people can get together on a regular basis to
cook healthy, nutritious, meals. It is a place where everyone participates. Within the groups,
participants have a great time, get to create new friendships, and learn the tools to stretch their
food dollars. The quantity of food that is prepared is divided among group members to take
home. The Community Kitchens are participant driven, with each group deciding how their
kitchen operates. They believe that food has always had the power to bring people together.
Some of the programs that the Nanaimo Community Kitchens have are:
Bellies to Babies and Beyond: 10 week cooking and skill building program for pregnant
women and parents of infants. Child minding provided.
Cooking Out Of The Box: Cooking session based upon contents of monthly Good Food
Box of fruits and vegetables. Three locations.
Community Kitchen Cooking Groups: Nanaimo Community Kitchens offers to facilitate
groups of 3-5 individuals to meet regularly to prepare meals to feed their families.
Participants pay a yearly membership fee of $1 and learn how to stretch their food

DRAFT #1 – MAY 3 2010
Har
ewo
od
Co
mm
un
ity
Pro
file
20
10
40
dollar, try new recipes, and meet new people.
All of the programs are offered at one for their three locations:
Food Share Center, 271 Pine St
Women's Center, 285 Selby St
Princess Royal Family Center, 360 Irwin St
Food Link Nanaimo
Food Link Nanaimo Society is a non-profit networking agency that provides communication
support for local food organizations and growers, businesses, educational institutions,
governments, and the local community. They are one of five VIHA Food Security Hubs on
Vancouver Island, and are connected to provincial and national food networks through BC Food
Systems Network and Food Secure Canada.
With the industrialization of our food supply, food issues are becoming increasingly important.
This is why Food Link believes that food sovereignty is foundational to building healthy
communities. The goal for this organization is to create meaningful opportunities to improve
access to a healthy, sustainable, and equitable food supply. Food Link Nanaimo focuses on
engaging the community in dialogue and increasing collaboration, reflection, and action. They
recognize that everyone in the Harewood community and beyond, including consumers, food
producers, and policy makers, want to get involved with food and sustainability issues.
Food Link covers Nanaimo and the surrounding area, from Port Alberni to Yellow Point. They
have created a place for our community to connect with local food resources, encourage
networking and collaboration, and celebrate all the great work we are doing to live locally and
sustainably.
DRAFT #1 – MAY 3 2010
Har
ewo
od
Co
mm
un
ity
Pro
file
20
10
41
Working Towards
Support the development of a local and regional food charter and a land and food
systems strategy
Explore the possibility of a food policy council
Facilitate education of new leadership in the broader community, and develop an
educational model to increase individual community capacity
7-10 Club Society Nanaimo
The Nanaimo 7-10 Club Society was started in 1985 by a group of 12 people from differing faith
backgrounds who came together to feed hungry children in the city. Since then, the 7-10 Club
has served more than one million meals, not only to children, but also to anyone in need. Their
goal is “to feed the hungry and increase access to food for those in need”. The 7 to 10 club in
Nanaimo takes place at 205 - 285 Prideaux Street. it is a n organizations that brings the low
income community a hot nutritious breakfast, homemade soup, plus a brown bag lunch to go
that is served by community volunteers to those in need at no charge.
Loaves and Fishes
An organization devoted to bringing non perishables and other foods to those community
members that need it the most. They work with many other organizations to collect donations
throughout the community. Many school groups ranging from elementary to high school as
well as groups such as the Lions and even grocery and retail stores are involved with Loaves and
Fishes.
DRAFT #1 – MAY 3 2010
Har
ewo
od
Co
mm
un
ity
Pro
file
20
10
42
SECTION 6 HOUSING
Most of the Harewood community is residential. According to the Harewood Planning Area
Profile (2006), almost 40% of houses were built between 1971-1990. An additional 32% of the
housing stock was built within the last twenty years. The remaining 30% of housing was built
prior to 1970. Looking at these numbers, it indicates that the housing stock is becoming newer,
as there still remains land to develop and as old houses are being torn down.
The purpose of this section is to briefly give an overview of the current situation of housing
stock within the Harewood Community. Topics that will be considered include current building
permits, affordable housing options, BC Assessment sales and real estate sales.
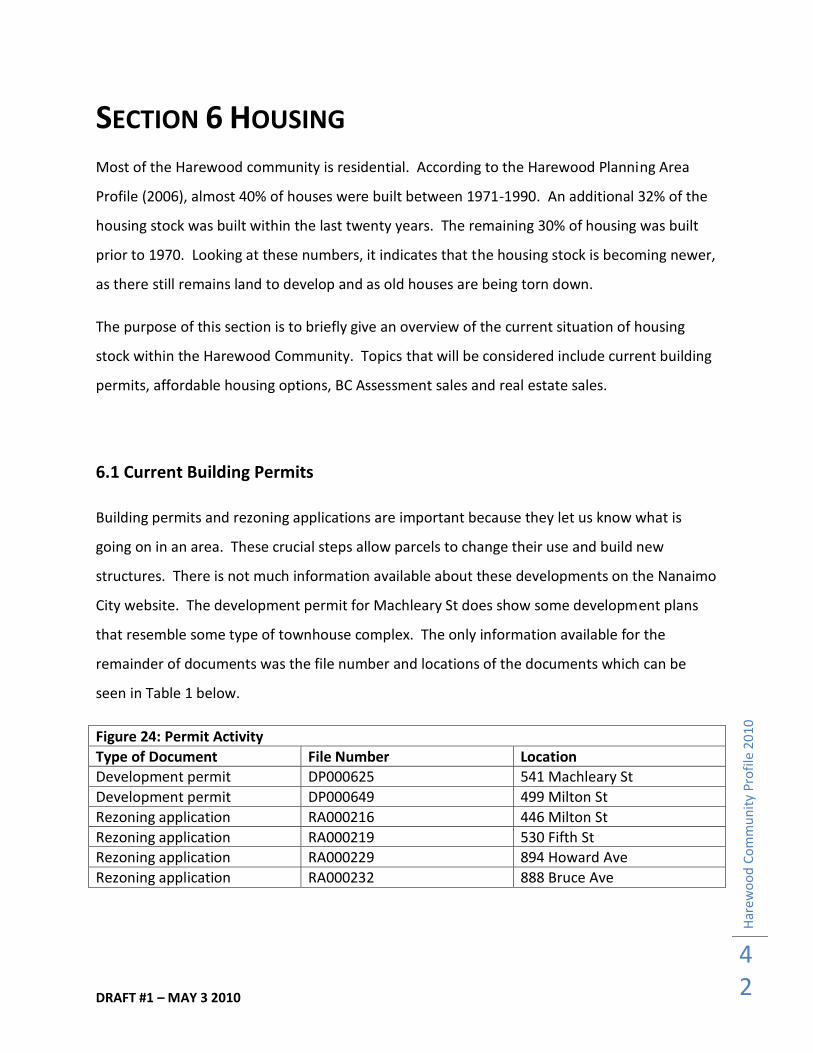
6.1 Current Building Permits
Building permits and rezoning applications are important because they let us know what is
going on in an area. These crucial steps allow parcels to change their use and build new
structures. There is not much information available about these developments on the Nanaimo
City website. The development permit for Machleary St does show some development plans
that resemble some type of townhouse complex. The only information available for the
remainder of documents was the file number and locations of the documents which can be
seen in Table 1 below.
Figure 24: Permit Activity
Type of Document File Number Location Development permit DP000625 541 Machleary St
Development permit DP000649 499 Milton St
Rezoning application RA000216 446 Milton St
Rezoning application RA000219 530 Fifth St
Rezoning application RA000229 894 Howard Ave
Rezoning application RA000232 888 Bruce Ave
DRAFT #1 – MAY 3 2010
Har
ewo
od
Co
mm
un
ity
Pro
file
20
10
43
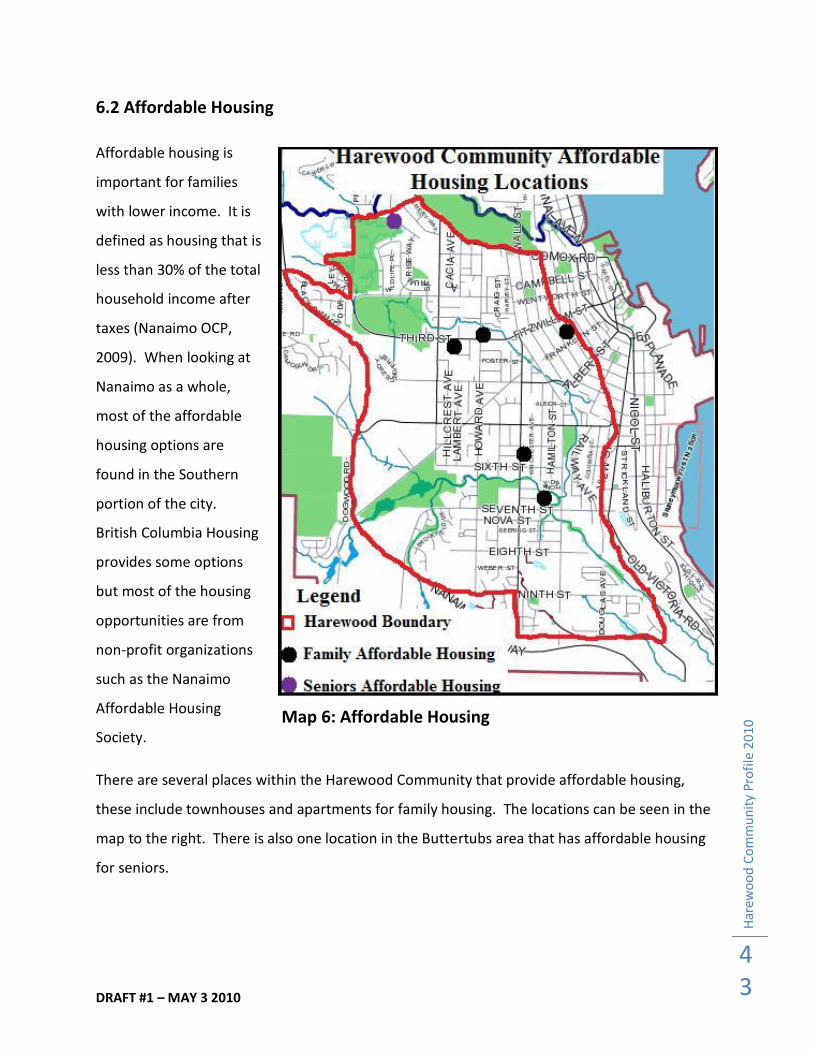
6.2 Affordable Housing
Affordable housing is
important for families
with lower income. It is
defined as housing that is
less than 30% of the total
household income after
taxes (Nanaimo OCP,
2009). When looking at
Nanaimo as a whole,
most of the affordable
housing options are
found in the Southern
portion of the city.
British Columbia Housing
provides some options
but most of the housing
opportunities are from
non-profit organizations
such as the Nanaimo
Affordable Housing
Society.
There are several places within the Harewood Community that provide affordable housing,
these include townhouses and apartments for family housing. The locations can be seen in the
map to the right. There is also one location in the Buttertubs area that has affordable housing
for seniors.
Map 6: Affordable Housing
DRAFT #1 – MAY 3 2010
Har
ewo
od
Co
mm
un
ity
Pro
file
20
10
44
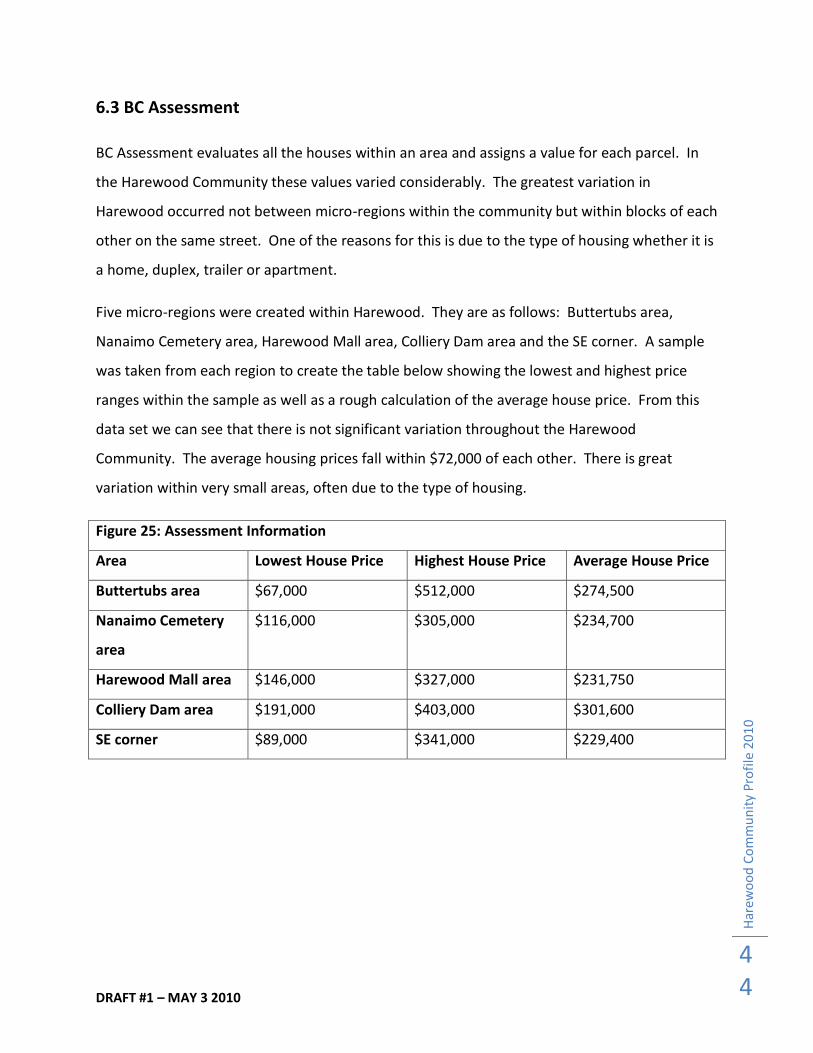
6.3 BC Assessment
BC Assessment evaluates all the houses within an area and assigns a value for each parcel. In
the Harewood Community these values varied considerably. The greatest variation in
Harewood occurred not between micro-regions within the community but within blocks of each
other on the same street. One of the reasons for this is due to the type of housing whether it is
a home, duplex, trailer or apartment.
Five micro-regions were created within Harewood. They are as follows: Buttertubs area,
Nanaimo Cemetery area, Harewood Mall area, Colliery Dam area and the SE corner. A sample
was taken from each region to create the table below showing the lowest and highest price
ranges within the sample as well as a rough calculation of the average house price. From this
data set we can see that there is not significant variation throughout the Harewood
Community. The average housing prices fall within $72,000 of each other. There is great
variation within very small areas, often due to the type of housing.
Figure 25: Assessment Information
Area Lowest House Price Highest House Price Average House Price
Buttertubs area $67,000 $512,000 $274,500
Nanaimo Cemetery
area
$116,000 $305,000 $234,700
Harewood Mall area $146,000 $327,000 $231,750
Colliery Dam area $191,000 $403,000 $301,600
SE corner $89,000 $341,000 $229,400
DRAFT #1 – MAY 3 2010
Har
ewo
od
Co
mm
un
ity
Pro
file
20
10
45
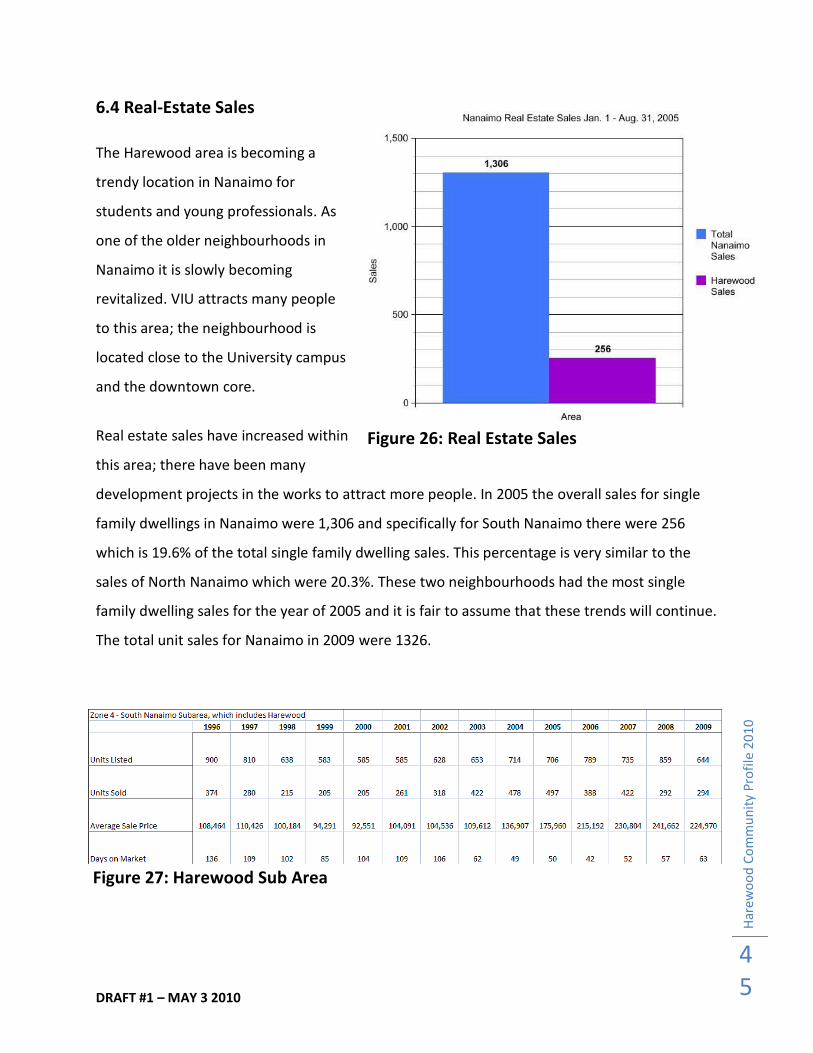
6.4 Real-Estate Sales
The Harewood area is becoming a
trendy location in Nanaimo for
students and young professionals. As
one of the older neighbourhoods in
Nanaimo it is slowly becoming
revitalized. VIU attracts many people
to this area; the neighbourhood is
located close to the University campus
and the downtown core.
Real estate sales have increased within
this area; there have been many
development projects in the works to attract more people. In 2005 the overall sales for single
family dwellings in Nanaimo were 1,306 and specifically for South Nanaimo there were 256
which is 19.6% of the total single family dwelling sales. This percentage is very similar to the
sales of North Nanaimo which were 20.3%. These two neighbourhoods had the most single
family dwelling sales for the year of 2005 and it is fair to assume that these trends will continue.
The total unit sales for Nanaimo in 2009 were 1326.
Figure 27: Harewood Sub Area
Figure 26: Real Estate Sales
DRAFT #1 – MAY 3 2010
Har
ewo
od
Co
mm
un
ity
Pro
file
20
10
46
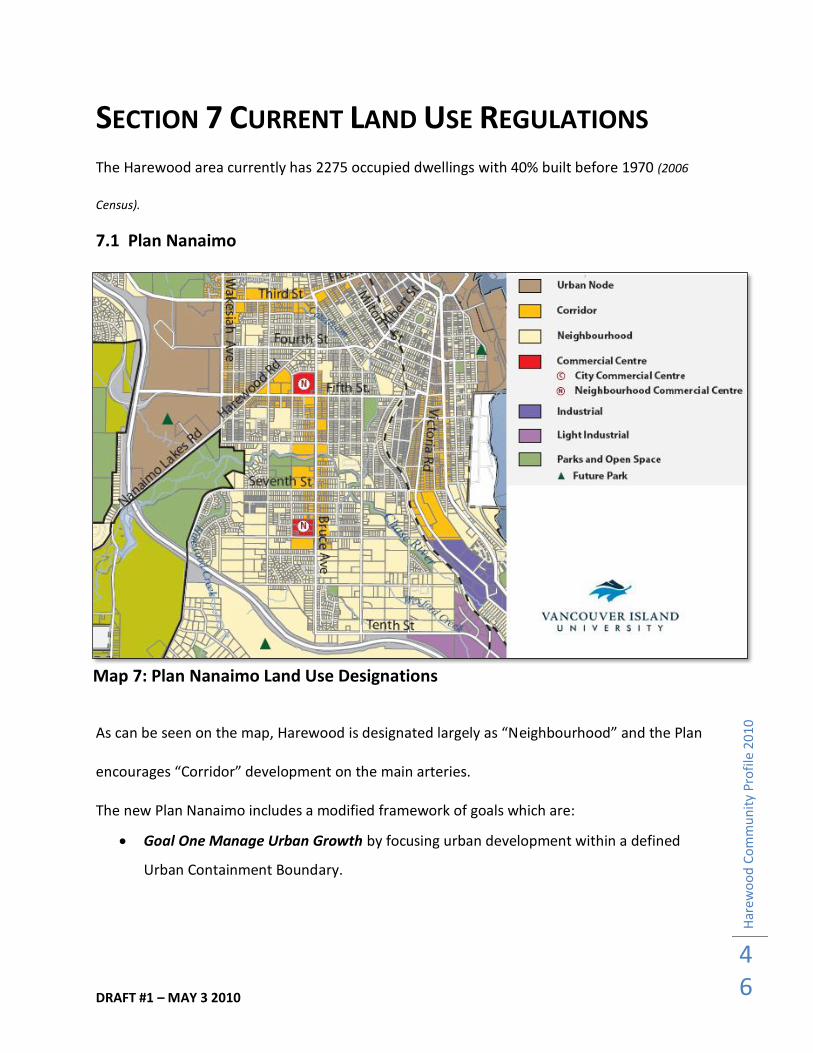
SECTION 7 CURRENT LAND USE REGULATIONS
The Harewood area currently has 2275 occupied dwellings with 40% built before 1970 (2006
Census).
7.1 Plan Nanaimo
As can be seen on the map, Harewood is designated largely as “Neighbourhood” and the Plan
encourages “Corridor” development on the main arteries.
The new Plan Nanaimo includes a modified framework of goals which are:
Goal One Manage Urban Growth by focusing urban development within a defined
Urban Containment Boundary.
Map 7: Plan Nanaimo Land Use Designations
DRAFT #1 – MAY 3 2010
Har
ewo
od
Co
mm
un
ity
Pro
file
20
10
47
Goal Two Build a More Sustainable Community by creating urban nodes and corridors
that support higher densities and a wider range of amenities and services than found in
the surrounding residential neighborhoods.
Goal Three Encourage Social Enrichment whereby Nanaimo is considered a socially
sustainable community that nurtures a caring, healthy, inclusive and safe environment,
and which empowers all of its citizens to realize their aspirations.
Goal Four Promote a Thriving Economy through efforts to grow and diversify the local
economy from the current tax base, affording opportunities for residents and
businesses, while staying within the capacity of the natural environment.
Goal Five Protect and Enhance our Environment by looking after Nanaimo’s natural
diversity of terrestrial, freshwater and marine ecosystems in the course of land use and
development.
Goal Six Improve Mobility and Servicing Efficiency by creating greater accessibility and
more opportunity for safe and convenient movement around the city by transit, cycle
and on foot.
Goal Seven Work Towards a Sustainable Nanaimo which is the critical goal for moving
from “planning to action”. Nanaimo strives to meet the vision of the Plan to build upon
the strengths of the city and work to improve those areas where changes in economic,
social, environmental conditions would create a stronger, more effective, sustainable
city.
Policies for neighborhood planning in Plan Nanaimo include:
The neighborhood designation provides for lower density residential areas along with
parks and open spaces, schools, and local service centers supporting residential
neighborhoods.
Development in neighborhoods will be characterized by a mix of low density residential
uses and may include detached and semi-detached dwelling units, secondary suites,
special needs housing, mobile homes, duplexes, triplexes, quadruplexes and
townhouses.
DRAFT #1 – MAY 3 2010
Har
ewo
od
Co
mm
un
ity
Pro
file
20
10
48
Residential densities from 10 to 50 units per hectare, in two to four storey building
forms, will be supported in neighborhoods.
Commercial Centers – Neighborhood designations are supported within neighborhoods,
and as identified through the neighborhood planning process.
Local service centers provide small scale commercial and community services within
neighborhoods.
These service centers are permitted in locations on a collector road and within a walk
able distance for neighboring residents.
The development or redevelopment of lands within existing Neighborhood designated
areas shall consider the surrounding context, including architecture, scale, densities, and
lot and lane configuration, when creating innovative designs which fit a variety of
housing forms and enhance the livability of the area.
Parks and open space shall form an integral component of the land base in
neighborhoods. Trail connections and sidewalks will encourage safe pedestrian
movement throughout the neighborhoods.
The infill of residential lots is encouraged and will be designed to complement existing
neighborhood character including the ground oriented nature of existing housing.
Ecological features, such as steep slopes, watercourses, riparian areas, significant trees,
and environmentally sensitive lands are recognized as attributes of the site, and
development shall proceed only where the impacts on these features are minimized and
can be mitigated.
A clustered housing design approach to development is encouraged to protect
environmentally sensitive features, steep slope and hazard lands, and provide for open
spaces in neighborhoods.
Steep slope properties included in Development Permit Area 5 may be considered for
additional density, in exchange for the preservation of open space, so long as the overall
density of the site does not exceed that allowed within the Neighborhood designation.
DRAFT #1 – MAY 3 2010
Har
ewo
od
Co
mm
un
ity
Pro
file
20
10
49
The integration of higher density forms of ground oriented residential housing shall be
encouraged on major roads and within and adjacent to Commercial Centers
Neighborhood.
This Plan supports the development of a mix of residential options for all demographic
categories and levels of affordability across the city. However, isolated residential
developments, which are secured and gated as stand alone housing, are not supported
in the Neighborhood designation.
Home-based business secondary to the principal residence will be encouraged provided
that such businesses are compatible with existing adjacent uses and the environment.
Historic structures, places and trees will be identified and preserved in neighborhoods
throughout the city.
Existing neighborhood plans are adopted as part of plan Nanaimo. Neighborhood plans
prepared in the future will also be adopted as part of plan Nanaimo and will complement the
vision, goals, objectives and policies established within this Plan.
7.2 Zoning Bylaw and other Regulations
Under Bylaw 1000, the area is zoned mostly as residential, with some pockets of commercial
zoning and parkland. Other important regulations include those for heritage buildings.
DRAFT #1 – MAY 3 2010
Har
ewo
od
Co
mm
un
ity
Pro
file
20
10
50
SECTION 8 RECREATION
8.1 Inventory
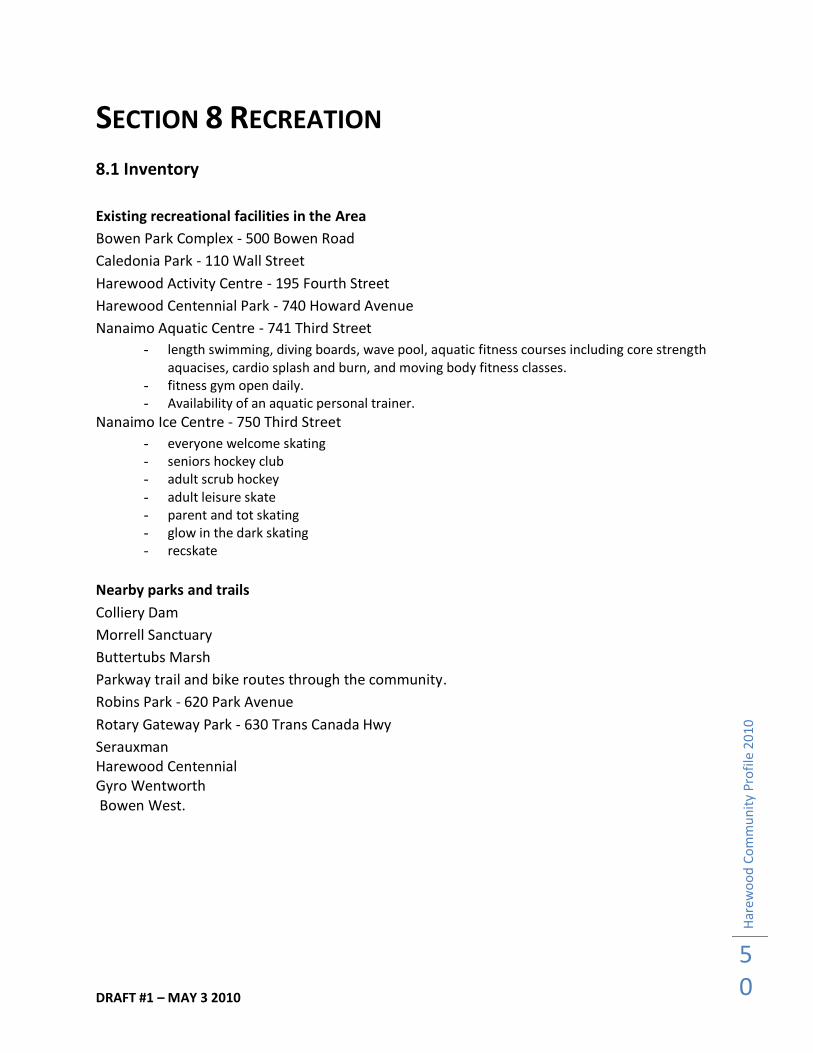
Existing recreational facilities in the Area
Bowen Park Complex - 500 Bowen Road
Caledonia Park - 110 Wall Street
Harewood Activity Centre - 195 Fourth Street
Harewood Centennial Park - 740 Howard Avenue
Nanaimo Aquatic Centre - 741 Third Street
- length swimming, diving boards, wave pool, aquatic fitness courses including core strength aquacises, cardio splash and burn, and moving body fitness classes.
- fitness gym open daily. - Availability of an aquatic personal trainer.
Nanaimo Ice Centre - 750 Third Street
- everyone welcome skating - seniors hockey club - adult scrub hockey - adult leisure skate - parent and tot skating - glow in the dark skating - recskate
Nearby parks and trails
Colliery Dam
Morrell Sanctuary
Buttertubs Marsh
Parkway trail and bike routes through the community.
Robins Park - 620 Park Avenue
Rotary Gateway Park - 630 Trans Canada Hwy
Serauxman Harewood Centennial Gyro Wentworth Bowen West.
DRAFT #1 – MAY 3 2010
Har
ewo
od
Co
mm
un
ity
Pro
file
20
10
51
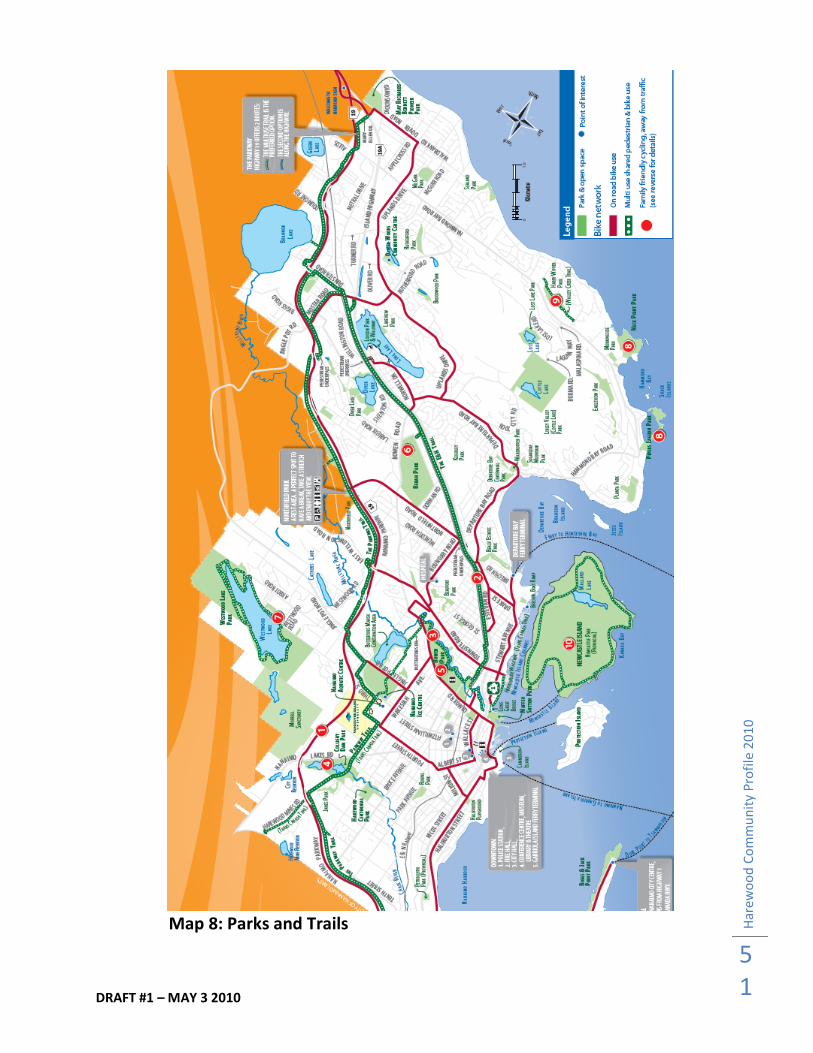
Map 8: Parks and Trails
DRAFT #1 – MAY 3 2010
Har
ewo
od
Co
mm
un
ity
Pro
file
20
10
52
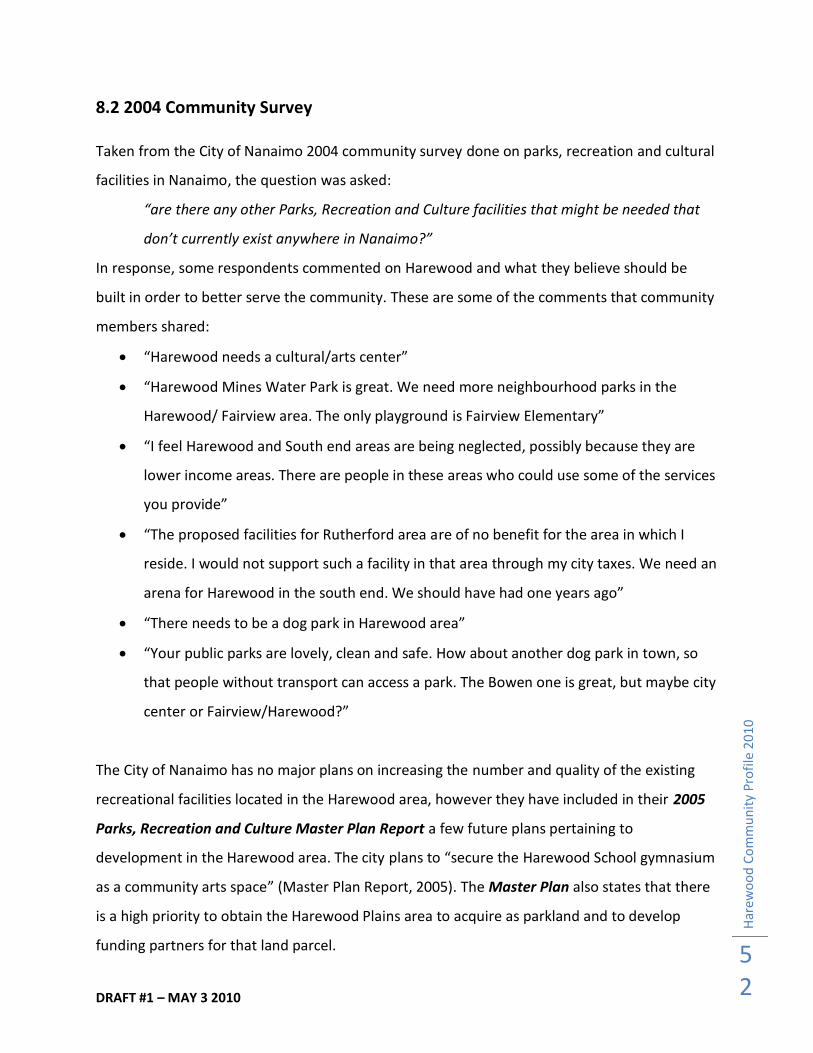
8.2 2004 Community Survey
Taken from the City of Nanaimo 2004 community survey done on parks, recreation and cultural
facilities in Nanaimo, the question was asked:
“are there any other Parks, Recreation and Culture facilities that might be needed that
don’t currently exist anywhere in Nanaimo?”
In response, some respondents commented on Harewood and what they believe should be
built in order to better serve the community. These are some of the comments that community
members shared:
“Harewood needs a cultural/arts center”
“Harewood Mines Water Park is great. We need more neighbourhood parks in the
Harewood/ Fairview area. The only playground is Fairview Elementary”
“I feel Harewood and South end areas are being neglected, possibly because they are
lower income areas. There are people in these areas who could use some of the services
you provide”
“The proposed facilities for Rutherford area are of no benefit for the area in which I
reside. I would not support such a facility in that area through my city taxes. We need an
arena for Harewood in the south end. We should have had one years ago”
“There needs to be a dog park in Harewood area”
“Your public parks are lovely, clean and safe. How about another dog park in town, so
that people without transport can access a park. The Bowen one is great, but maybe city
center or Fairview/Harewood?”
The City of Nanaimo has no major plans on increasing the number and quality of the existing
recreational facilities located in the Harewood area, however they have included in their 2005
Parks, Recreation and Culture Master Plan Report a few future plans pertaining to
development in the Harewood area. The city plans to “secure the Harewood School gymnasium
as a community arts space” (Master Plan Report, 2005). The Master Plan also states that there
is a high priority to obtain the Harewood Plains area to acquire as parkland and to develop
funding partners for that land parcel.
DRAFT #1 – MAY 3 2010
Har
ewo
od
Co
mm
un
ity
Pro
file
20
10
53
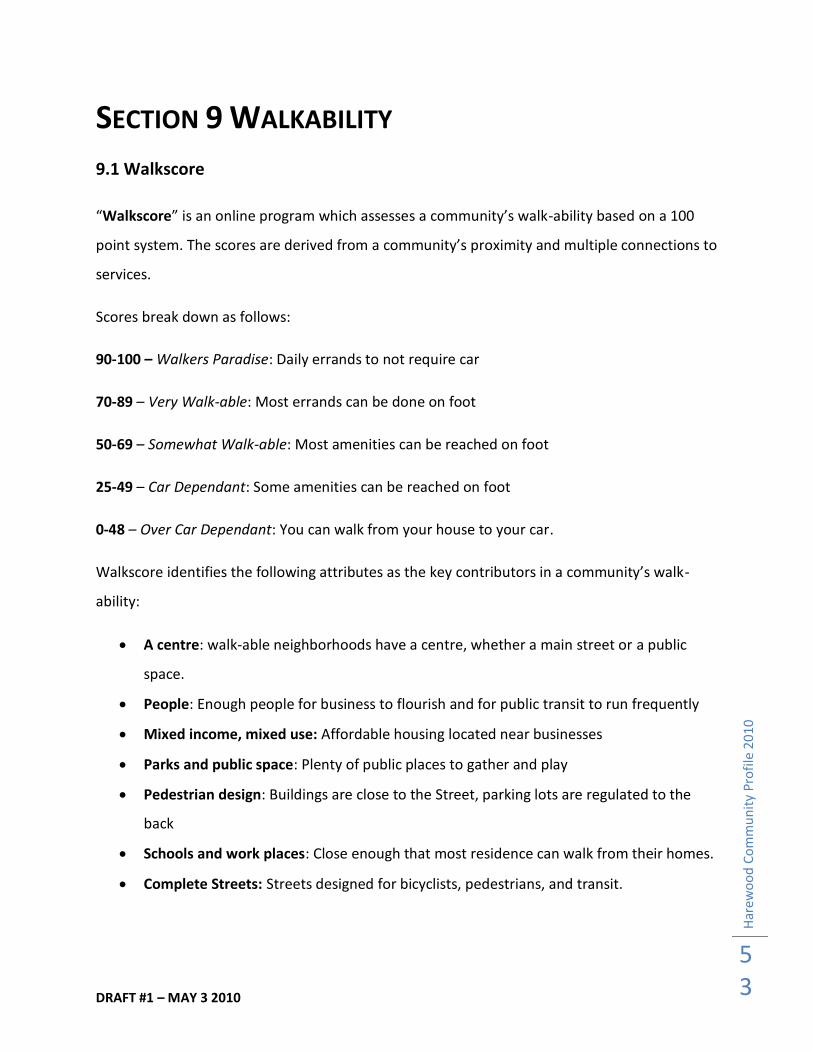
SECTION 9 WALKABILITY
9.1 Walkscore
“Walkscore” is an online program which assesses a community’s walk-ability based on a 100
point system. The scores are derived from a community’s proximity and multiple connections to
services.
Scores break down as follows:
90-100 – Walkers Paradise: Daily errands to not require car
70-89 – Very Walk-able: Most errands can be done on foot
50-69 – Somewhat Walk-able: Most amenities can be reached on foot
25-49 – Car Dependant: Some amenities can be reached on foot
0-48 – Over Car Dependant: You can walk from your house to your car.
Walkscore identifies the following attributes as the key contributors in a community’s walk-
ability:
A centre: walk-able neighborhoods have a centre, whether a main street or a public
space.
People: Enough people for business to flourish and for public transit to run frequently
Mixed income, mixed use: Affordable housing located near businesses
Parks and public space: Plenty of public places to gather and play
Pedestrian design: Buildings are close to the Street, parking lots are regulated to the
back
Schools and work places: Close enough that most residence can walk from their homes.
Complete Streets: Streets designed for bicyclists, pedestrians, and transit.
DRAFT #1 – MAY 3 2010
Har
ewo
od
Co
mm
un
ity
Pro
file
20
10
54
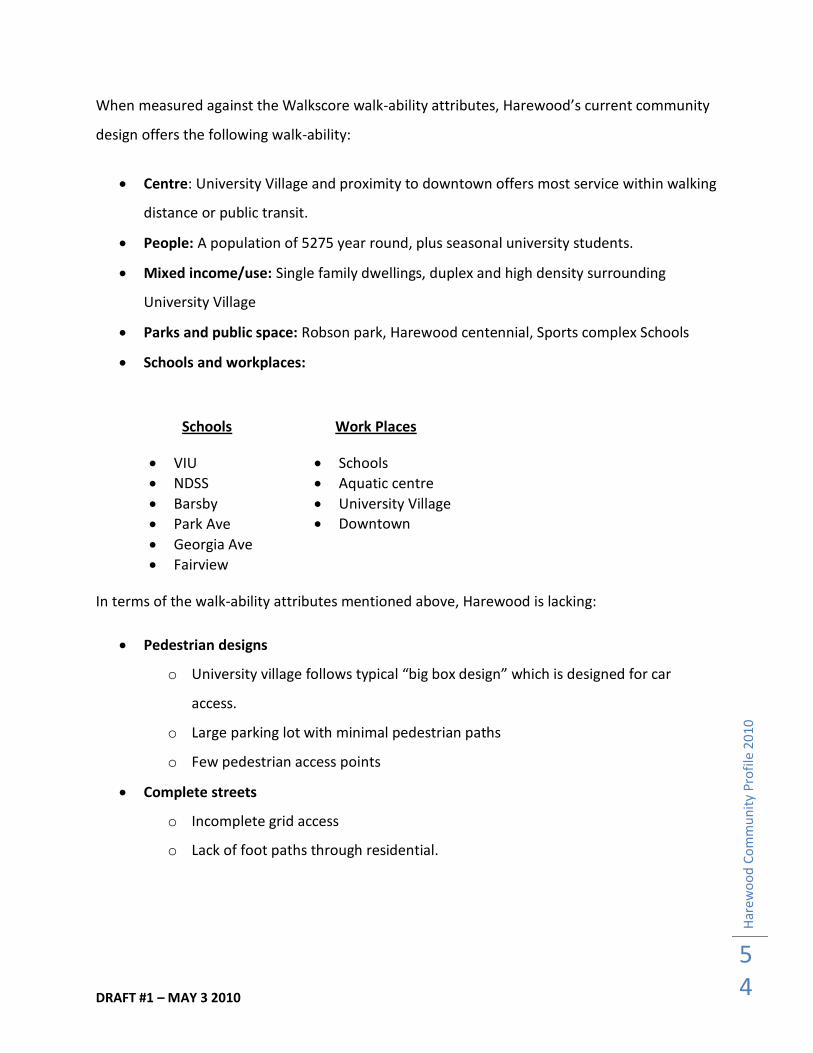
When measured against the Walkscore walk-ability attributes, Harewood’s current community
design offers the following walk-ability:
Centre: University Village and proximity to downtown offers most service within walking
distance or public transit.
People: A population of 5275 year round, plus seasonal university students.
Mixed income/use: Single family dwellings, duplex and high density surrounding
University Village
Parks and public space: Robson park, Harewood centennial, Sports complex Schools
Schools and workplaces:
In terms of the walk-ability attributes mentioned above, Harewood is lacking:
Pedestrian designs
o University village follows typical “big box design” which is designed for car
access.
o Large parking lot with minimal pedestrian paths
o Few pedestrian access points
Complete streets
o Incomplete grid access
o Lack of foot paths through residential.
Schools
VIU
NDSS
Barsby
Park Ave
Georgia Ave
Fairview
Bayview
Work Places
Schools
Aquatic centre
University Village Downtown
DRAFT #1 – MAY 3 2010
Har
ewo
od
Co
mm
un
ity
Pro
file
20
10
55
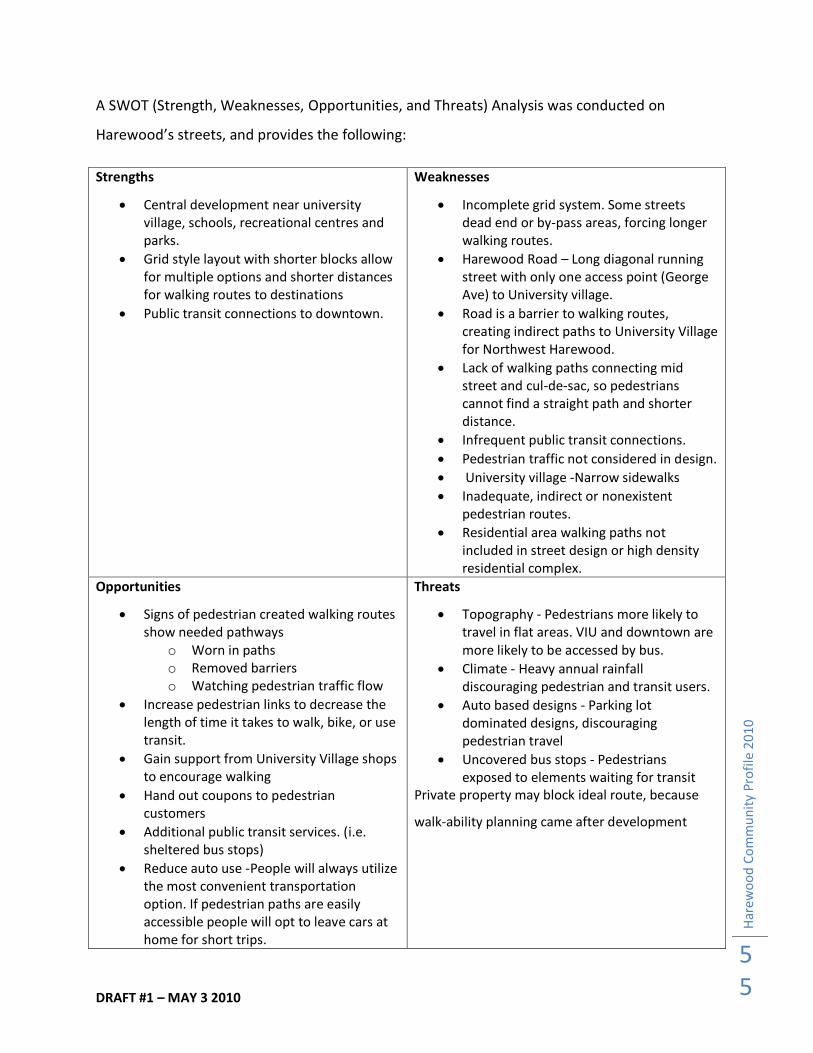
A SWOT (Strength, Weaknesses, Opportunities, and Threats) Analysis was conducted on
Harewood’s streets, and provides the following:
Strengths
Central development near university village, schools, recreational centres and parks.
Grid style layout with shorter blocks allow for multiple options and shorter distances for walking routes to destinations
Public transit connections to downtown.
Weaknesses
Incomplete grid system. Some streets dead end or by-pass areas, forcing longer walking routes.
Harewood Road – Long diagonal running street with only one access point (George Ave) to University village.
Road is a barrier to walking routes, creating indirect paths to University Village for Northwest Harewood.
Lack of walking paths connecting mid street and cul-de-sac, so pedestrians cannot find a straight path and shorter distance.
Infrequent public transit connections.
Pedestrian traffic not considered in design.
University village -Narrow sidewalks
Inadequate, indirect or nonexistent pedestrian routes.
Residential area walking paths not included in street design or high density residential complex.
Opportunities
Signs of pedestrian created walking routes show needed pathways
o Worn in paths o Removed barriers o Watching pedestrian traffic flow
Increase pedestrian links to decrease the length of time it takes to walk, bike, or use transit.
Gain support from University Village shops to encourage walking
Hand out coupons to pedestrian customers
Additional public transit services. (i.e. sheltered bus stops)
Reduce auto use -People will always utilize the most convenient transportation option. If pedestrian paths are easily accessible people will opt to leave cars at home for short trips.
Threats
Topography - Pedestrians more likely to travel in flat areas. VIU and downtown are more likely to be accessed by bus.
Climate - Heavy annual rainfall discouraging pedestrian and transit users.
Auto based designs - Parking lot dominated designs, discouraging pedestrian travel
Uncovered bus stops - Pedestrians exposed to elements waiting for transit
Private property may block ideal route, because
walk-ability planning came after development
DRAFT #1 – MAY 3 2010
Har
ewo
od
Co
mm
un
ity
Pro
file
20
10
56
Considering all factors, Harewood’s walk-ability scores are:
Kerr Street - 43/100
Fourth Street – 49/100
Dundas Street - 55/100
Harewood’s scores average around 50/100. These low scores are not based solely on indirect
walking routes, but from services not found within Harewood boundaries. University Village
does provide most daily needs; however walking routes do not directly connect all of the
surround residence to the centre.
Multiple direct and indirect benefits can be created by planning walk-able communities.
Walkscore illustrates 4 main benefits:
1. Finances: One point of Walk Score is worth up to $3,000 of value for your property.
2. Communities: Studies show that for every 10 minutes a person spends in a daily car
commute, time spent in community activities falls by 10%.
3. Environment: Cars are a leading cause of climate change. Your feet are zero-pollution
transportation machines.
4. Health: The average resident of a walk-able neighborhood weighs 7 pounds less than
someone who lives in a sprawling neighborhood
DRAFT #1 – MAY 3 2010
Har
ewo
od
Co
mm
un
ity
Pro
file
20
10
57
Sources
Nanaimo City Website. http://www.nanaimoinformation.com
NALT Website. http://www.nalt.bc.ca/
Nanaimo Parks PDF.
http://nanaimo.parksgo.com/sites/parksgo_nanaimo/documents/media/79.pdf
Trails BC Website. http://www.trailsbc.ca/v_island_region/nanaimo-1.html
Vancouver Island Bound Website. http://www.vancouverislandabound.com/flora_fauna.htm
Environment Nanaimo. http://enviro.nanaimo.ca/index.cfm?tab_ID=2&content_ID=25
www.wikipedia.com
http://geonames.nrcan.gc.ca/
http://www2.canada.com/nanaimodailynews/features/nanaimo135/story.html?id=62899af0-
501e-49b9-8bbd-7996544cb57c
http://books.google.ca/books?id=Vh9tCsWrjJ4C&pg=PA573&lpg=PA573&dq=history+of+harew
ood,bc+coal+mining&source=bl&ots=-
7s4Tg_7G7&sig=waWY81Yo5K1VcpCBXqVAK_eagik&hl=en&ei=MFvDS4GRApCjnwft2KC7Cg&sa
=X&oi=book_result&ct=result&resnum=10&ved=0CCEQ6AEwCQ#v=onepage&q&f=false
http://www12.statcan.gc.ca/census-recensement/2006/dp-pd/prof/92-
597/P3.cfm?Lang=E&CTCODE=5172&CACODE=938&PRCODE=59&PC=v9r1x1
http://www12.statcan.gc.ca/census-recensement/2006/dp-pd/prof/92-
597/P3.cfm?Lang=E&CTCODE=5174&CACODE=938&PRCODE=59&PC=v9r1a1
Food Link Nanaimo. (2009). About Food Link Nanaimo. Retrieved March 30, 2010 from Food
Link Nanaimo http://www.foodlinknanaimo.com/
Food Share Nanaimo. (2009). Welcome to Foodshare. Retrieved March 30, 2010 from Food
Share Nanaimo http://www.nanaimofoodshare.ca/
Nanaimo 7-10 Club, (2010). Serving the people with dignity and respect. Retrieved March 30,
2010 from Nanaimo 7-10 Club http://nanaimo710club.com/
DRAFT #1 – MAY 3 2010
Har
ewo
od
Co
mm
un
ity
Pro
file
20
10
58
Nanaimo Loaves and Fishes. (2009). Mission and History of Loaves & Fishes Family Kitchen.
Retrieved March 30, 2010 from Loaves and Fishes Nanaimo
http://www.loavesfishes.org/
Nanaimo Community Kitchens. (2004). NCK History. Retrieved March 30, 2010 from Nanaimo
Community Gardens http://www.nanaimocommunitykitchens.org/index.htm
Nanaimo Community Gardens. (2009). About Us. Retrieved March 30, 2010 from Nanaimo
Community Kitchens http://www.nanaimocommunitygardens.ca/
BC Assessment website http://www.bcassessment.ca
BC Housing Website http://www.bchousing.org/applicants/housing_listing
Nanaimo Affordable Housing Society website http://www.nahs.ca
Nanaimo City Website Maps http://maps.nanaimo.ca/nanaimomap/#
City of Nanaimo. (2008). Plan Nanaimo: Official Community Plan. City of Nanaimo.
Retrieved on April 1st, 2010 at
http://www.nanaimo.ca/assets/Departments/Community~Planning/Offical~Community
~Plan~10~Year~Review/Official~Community~Plan/OfficialCommunityPlan2008.pdf?zoo
m_highlight=official+community+plan#search="official community plan"
City of Nanaimo. (2006). Planning Area Profile: Harewood. Statistics Canada. Retrieved on
April 1st, 2010 at
http://www.nanaimo.ca/assets/Departments/Community~Planning/Neighbourhood~Pl
anning/PlanningAreaProfileHarewood.pdf
MLS Real Estate Stats Website http://www.dougbelcher.com/nanaimo-mls-real-estate-
stats/nanaimo-mls-statistics-aug-2005.pdf
www.city.nanaimo.ca accessed: April 09 2010
www.rdn.bc.ca accessed: April 09 2010
Recommended
![Untitled Document [cdn-pays.bnpparibas.com] · 2012-08-29 · 12 harewood avenue bnp paribas london branch bnp paribas london ! nw16aa united kingdom london 10 harewood avenue - -](https://img.pdfslide.us/doc/110x75/5e6c94489ff81c748422d085/untitled-document-cdn-pays-2012-08-29-12-harewood-avenue-bnp-paribas-london.jpg)