CIRJE Discussion Papers can be downloaded without charge from:
http://www.cirje.e.u-tokyo.ac.jp/research/03research02dp.html
Discussion Papers are a series of manuscripts in their draft form. They are not intended for
circulation or distribution except as indicated by the author. For that reason Discussion Papers
may not be reproduced or distributed without the written consent of the author.
CIRJE-F-987
Happiness in Life Domains: Evidence from Bangladesh Based on Parametric and
Non-Parametric Models
Minhaj Mahmud BRAC University
Yasuyuki Sawada The University of Tokyo
August 2015

1
Happiness in Life Domains:
Evidence from Bangladesh Based on Parametric and Non-Parametric Models
by
Minhaj Mahmud *1 and Yasuyuki Sawada **
Abstract
This paper applies a two layer approach to explain overall happiness both as a function of
happiness in different life-domains and conventional explanatory variables such as income,
education and health etc. Then it tests the happiness-income relationship in different
happiness domains. Overall, the results suggest that income explains a large part of the
variation in total happiness and that income is closely related with domain-specific happiness,
even with non-economic domains. This is also consistent with a hypothesis that income and
happiness will move hand in hand in developing countries, suggesting that income is a good
summary measure of well-being and welfare for low income societies. Yet, the non-
parametric estimation confirms the concavity of happiness function in economic domain,
which is consistent with Easterlin paradox.
Key words: Happiness; domain specific happiness, two-layer analysis, Easterlin paradox;
non-parametric estimation; Bangladesh
JEL Classification: I3; O1; O53
* BRAC Institute of Governance and Development, BRAC University, Bangladesh
**Faculty of Economics, University of Tokyo, Japan
1 Correspondence: [email protected]. The authors thankfully acknowledge the
Japan Society for the Promotion of Science (JSPS) fellowship at the University of Tokyo for
completion of this research. The data used in the paper comes from the dissertation survey of
the first author (Mahmud, 2005); and very helpful suggestions by Olof Johansson-Stenman
and Peter Martinsson as well as funding from the Swedish International Development
Agency (sida), are gratefully acknowledged.

2
1. Introduction
Recently the Stiglitz commission on the measurement of economic and social progress
highlighted the importance of measuring subjective well-being (or happiness) as it provides
key information about quality of life of citizens (Stiglitz, Sen & Fitoussi 2009). Richard
Easterlin, by examining the available evidence on income and happiness, concluded that
higher level of income or economic growth does not necessarily make people much happier
(Easterlin 1974, 1995), which is known as Easterlin paradox.2 Since then a large number of
literature have emerged studying happiness or subjective well-being within various
disciplines including economics and psychology and by now self-reported happiness has
largely been accepted as valid measure of individual well-being (see e.g. Clark and Oswald
1994; Diener, Diener and Diener, 1995; Diener, Suh, Smith and Shao 1995; Easterlin 1995;
Kahneman, Wakker and Sarin, 1997; Ng 1997; Oswald 1997; Frey and Stutzer 2000; Argyle
2001; Easterlin 2001; Di Tella, MacCulloch and Oswald, 2001, Frey and Stutzer 2002;
Blanchflower and Oswald 2004; Kahneman and Krueger 2006; Di Tella and MacCulloch
2006, 2008; Clark, Frijters and Shields, 2008; Blanchflower and Oswald 2008a; Stevenson
and Wolfer 2008; Easterlin and Sawangfa 2009; Layard 2010).3 Krueger and Schkade (2008)
show that individuals’ reported well-being numbers are apparently stable through time. More
recently Oswald and Wu (2010, 2011) demonstrated a strong relation between subjective and
objective well-being, which suggests further validity of subjective well-being or happiness
index as a measure of individual well-being.
2 For a recent discussion on the paradox, see Angeles (2011).
3 Blanchflower and Oswald (2011) provides an excellent overview of international evidence on happiness,
including employed methodologies and core findings.

3
However, there are still important gaps in the literature, particularly in the context of
developing countries.4 First, while happiness studies on developing countries are scarce in
general, Easterlin and Sawangfa (2009) suggest that studying happiness trend in developing
countries is of particular importance as economic growth would be expected to have its
biggest impact on happiness in developing countries. Also, Graham (2005) argues that
discrepancies observed in happiness research between reported wellbeing and conventional
income measure (such as Easterlin paradox) can provide better insight into development
outcome. As achieving happiness would be particularly important for an underdeveloped
country which has been plagued by destitution, greater availability of happiness data would
facilitate our understandings and observations of stages and dimensions of development
(Clark and Senik, 2010).
Second, while most happiness studies used “black-box” reduced form approach to
explain overall happiness as a function of various explanatory variables, some researchers
also highlighted the importance of studying happiness over different life domains to better
understand overall happiness (Van Praag, Frijter & Carbonell 2003; Van Praag and Carbonell
2004; Easterlin and Sawangfa 2007). Van Praag et al. (2003) proposed a two-layer approach,
where overall satisfaction is assumed to be the aggregate of six-types of domain-specific
happiness components. This approach can explain income happiness relationship in a more
structured way. For example, the following question, which has been mostly unanswered in
existing studies, can be explored: are rich people much happier because they are more
satisfied with their financial situation, or because their job satisfaction increases with
increasing wages?
4 Evidence from developing countries include for example: Brinkerhoff et al.(1997); Biswas-Diener and
Diener(2001); Kingdon and Knight(2007); Camfield et al. ( 2009); Knight, Song & Gunatilka(2009) ; Ravalion
and Lokshin(2010); Knight and Gunatilka(2010, 2012); Selezneva(2011); Asadullah and Chowdhury( 2012).

4
In this paper, we try to bridge these two gaps in the existing studies on happiness in
developing countries. To the best of our knowledge, we are the first to apply a two-layer
approach to a developing country and simultaneously to shed “structural” light on Easterlin
paradox from a developing country perspective, in our case Bangladesh. We closely examine
happiness-income relationship in various economic and non-economic domains. Our results
suggest that income remains as a significant determinant for all the happiness domain and
that the concavity of the happiness function with respect to income is observed in economic
domain, which is broadly consistent with the Easterlin paradox. That is, the most important
happiness domain, by far, would be happiness with the financial/economic situation. Also,
the relative perceived economic position in the society and other conventional variables seem
to explain a large part of the variation in overall happiness.
The rest of this paper is organized as follow. Section 2 describes the empirical
strategy and the data, while Section 3 discusses the econometric analysis and the results.
Section 4 provides concluding remarks of the paper.
2. The Empirical Strategy and the Data
Three Empirical Strategies
In our framework, we examine overall happiness as well as domain-specific happiness for the
following six domains: (1) work/job situation; (2) financial/economic situation; (3) house
condition; (4) available leisure; (5) social life; and (6) married life. To investigate the
determinants and patterns of overall happiness, H, and six domain-specific happiness levels,
Di, where i stands for domain and i=1, 2, …., 6, we postulate the following relationship for
each individual j:

5
(1) Hj = H [D1(x), D2(x), D3(x), D4(x), D5(x), D6(x); x],
where x is a vector of k determinants of happiness for individual j. To empirically investigate
the equation (1), we adopt three empirical strategies. First, we regress each of the six domain
specific happiness components Di, linearly on the relevant explanatory variables, xk with the
corresponding coefficients αik. To estimate these equations of six domain-specific happiness
measures, we adopt the seemingly-unrelated regression (SUR) method so that we can
accommodate possible cross-equation correlations. Then the overall happiness H is estimated
as a linear function of each domain specific happiness Di with the corresponding coefficients
βi, as well as the other explanatory variables xk with the coefficients γk. This allows us to
estimate how each happiness domain contributes to overall happiness as well as the overall
marginal effect. The overall marginal effect on happiness H from, xk, which may for example
reflect a year increase in schooling, will then be given by:
(2) ki iki
ki
k
i
ik
γαβx
H
x
D
D
H
dx
dH
6
1
6
1.
Then we explore the Easterlin Paradox closely by quantifying the partial derivatives of
overall and domain-specific happiness index with respect to income, y, i.e., ∂H/∂y and ∂Di/∂y,
respectively, where y is an element of x.
In the second empirical approach, we quantify the partial derivatives, ∂H/∂y and
∂Di/∂y, flexibly by employing Robinson’s (1988) “double residual methodology” to estimate
the following semi-parametric regression model on individual j where i stands for domain i:
(1) Hj = xjβH + fH (yj) + uH
j,

6
(2) Dij = xjβi+ fi
(yj) + uij.
The third approach is intended to tackle a critical issue of regression analysis of cross-
sectional happiness data, i.e., omitted variable bias arising from unobserved heterogeneities
due to subjective response errors. One standard way to amend such a problem is to
incorporate individual fixed effects and control for unobserved time-invariant heterogeneities
(Clark, Frijters, and Shields, 2008). While we have cross-sectional data only, we can still
incorporate fixed effects by stacking overall and domain-specific happiness variables.
Specifically, we estimate the “heterogeneity-free” ratios of the domain specific happiness
levels Dj to the overall happiness H by pooling all the data together and run the following
regression:
(3) ijji
ijij εγdδY
6
1log ,
where Y = [H, Di]T; di is a dummy variable which takes one for Di where H is taken as the
default category, and γj is fixed effects for individual j; and ε is a well-behaved error term.
The estimated parameter δi shows the “heterogeneity-free” ratio of Di to H in log, i.e., log
(Dj/H), after controlling for time-invariant unobserved heterogeneities by individual fixed
effects.5 This approach also provides us with useful robustness check of our primary analysis
above.
Survey and Data
Our empirical analysis is based on a unique household survey (Mahmud, 2005), whereby
randomly selected rural households from a stratified sample of 46 villages from five districts
5 Since the minimum happiness level is zero, we added a small number, 0.01 to take natural logs.

7
of the Dhaka division in Bangladesh from October to November 2003 were interviewed face-
to- face on various socioeconomic and happiness questions.6 Table 1 presents characteristics
of the sample population used in the subsequent empirical analysis.
**** TABLE 1 ****
A general problem with happiness questions is that the scales vary between people, i.e.
“very happy” for a person may correspond to “happy” for another person. However, this is
not necessarily a serious problem from a statistical point of view, since such reporting errors
can be treated as a classical measurement error problem of an independent variable (see
Blanchflower and Oswald 2004). Therefore, to mitigate potential subjectivity bias and
facilitate the respondents interpreting happiness questions as close as possible, they were
provided an explicit reference point corresponding to the median happiness level of the
citizens in Bangladesh observed in the World Value Surveys.7 The overall happiness question
was posed as follows:
“As a whole, how happy would you say you are? Please answer by using the following scale
in which 0 means ‘extremely unhappy’ and 10 means ‘extremely happy’. ‘5’ indicate
average happiness so that half the population in Bangladesh are above 5 and half below 5.”
6 The stratification was done to so that the respondents from Hindu religion are over represented (in our case
34% compared to national average of 11%) to facilitate religious comparisons. Therefore, the sample is not
representative of population of either Dhaka division or Bangladesh population. The interviews were conducted
with household heads who are usually in charge of household decisions if not the breadwinner.
7 The distribution of happiness in 2002 World Value Survey (WVS) in Bangladesh was: 14.8% very happy,
62.7% quite happy, 20.4% not vary happy and 2.1% not at all happy.
8
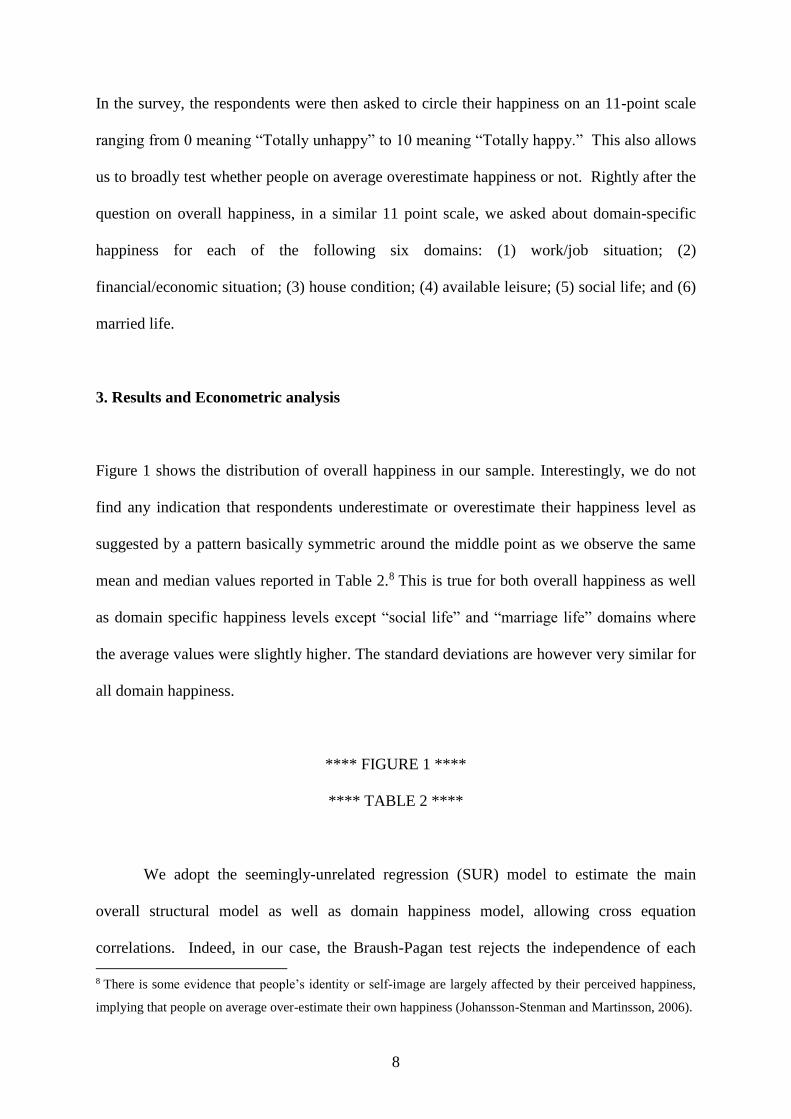
In the survey, the respondents were then asked to circle their happiness on an 11-point scale
ranging from 0 meaning “Totally unhappy” to 10 meaning “Totally happy.” This also allows
us to broadly test whether people on average overestimate happiness or not. Rightly after the
question on overall happiness, in a similar 11 point scale, we asked about domain-specific
happiness for each of the following six domains: (1) work/job situation; (2)
financial/economic situation; (3) house condition; (4) available leisure; (5) social life; and (6)
married life.
3. Results and Econometric analysis
Figure 1 shows the distribution of overall happiness in our sample. Interestingly, we do not
find any indication that respondents underestimate or overestimate their happiness level as
suggested by a pattern basically symmetric around the middle point as we observe the same
mean and median values reported in Table 2.8 This is true for both overall happiness as well
as domain specific happiness levels except “social life” and “marriage life” domains where
the average values were slightly higher. The standard deviations are however very similar for
all domain happiness.
**** FIGURE 1 ****
**** TABLE 2 ****
We adopt the seemingly-unrelated regression (SUR) model to estimate the main
overall structural model as well as domain happiness model, allowing cross equation
correlations. Indeed, in our case, the Braush-Pagan test rejects the independence of each
8 There is some evidence that people’s identity or self-image are largely affected by their perceived happiness,
implying that people on average over-estimate their own happiness (Johansson-Stenman and Martinsson, 2006).

9
equation strongly (p-value= 0.000). While an alternative estimation model is an ordered
dependent variable model, it is reasonable to interpret a change of happiness level from, say,
from 4 to 5 to be quantitatively equal to a change from 8 to 9, in our case. 9 The SUR
estimates also allow us to compute the overall total effect in a more straightforward way
rather than ordered regressions. Nevertheless, we also ran all estimations based on ordered
probit regression with very qualitatively similar results with respect to sign and parameter
significance.10
**** TABLE 3 ****
The column (1) of Table 3 reports the results from structural regression of overall
happiness, where we also present reduced form results using ordinary least squares method
[column (2)]. The column (3) shows the results based on equation (1) obtained from
combining the structural form results of column (1) with reduced-form estimation results of
domain-specific happiness reported in Table 4 by the delta method. In column (1), we find
that happiness in “financial/economic domain” most importantly contribute to overall
happiness, followed by the happiness in “work domain.” Happiness in “social life domain”
also contributes to overall happiness in a statistically significant way, although its
contribution is quantitatively much smaller than the marginal contribution from “financial
domain” happiness. Also, note that in reduced form results of overall happiness shown by
9 An ordered approach also implies that the happiness data must be interpreted in a cardinal way, even though
the cardinalization are chosen endogenously by the structure of the data by an explicit assumption (van Praag
and Ferrer-i-Carbonell, 2004). Both ways have their drawbacks, but it is not at all obvious that the structure
implied by equal happiness distance between the numbers is less realistic in our case.
10 The results based on the ordered probit model are available from the authors upon request. In all estimations
we control village fixed effects and enumerator effects (dummy for each enumerator as, since several
enumerators were used to conduct the survey), although we do not present the corresponding coefficients in
Table 3.

10
columns (2) and (3), the variation in total happiness and that in income are positively and
significantly related,
**** TABLE 4 ****
Table 4 shows estimation results of six domain specific happiness regressions using the
seemingly-unrelated regression (SUR) method. Looking at the explanatory variables shown,
we also observe that household income is important not only for “economic domain”
happiness, but also for “work domain” happiness, “social domain” happiness and “housing
domain” happiness; income remains important in all domains, not surprisingly. Here we also
have two variables measuring relative income. Overall, it is very important for happiness
both to be ‘better off than others’ and not to be ‘worse off than others.’ To see the overall
importance of the relative economic situation, consider the effect of moving from worse off
towards better off. Ceteris paribus such a change corresponds to about 1.3 happiness steps
[column (2) in Table 3]. Although our measure of relative income is rather subjective
assessment of one’s economic situation comparing that with her neighbour, the results here
however do not suggest that relative income is primarily important for happiness, given that
the total effect of absolute income is quite strong in our case, as often proposed. 11 The
housing condition variable is of course most important for the “housing happiness domain,”
but it is also important for other domains except the work domain, which follows intuition.
Surprisingly we obtain a strong effect of the perceived environmental quality, as it is
11 For example, in the context of Bangladesh, Asadullah and Chowdhury (2012) shows that relative income is
more important for richer individuals while general evidence that household’s subjective wellbeing are more
affected by their absolute income.
11
sometimes viewed as a luxury good that poor people cannot afford to be concerned about.12
We found significant negative effect of chronic illnesses, which is consistent with cross
country evidence that suggests negative association with happiness and hypertension (e.g.
Blanchflower and Oswald, 2008b). We find practicing religious people are happier, primarily
through work happiness and through happier marriage; the overall effect is quite modest
however.13 Also trust is important for work and economic happiness as well as social and
marriage domain happiness but no significant overall effect is found. Similarly, the number
of friends that can help when needed is important for “social domain happiness” but there is
no significant overall effect found. While these non-economic factors also affect overall and
domain-specific happiness levels, economic variables such as income consistently affect
happiness levels even if we control for these non-economic variables.
Easterlin Paradox
As described above, we explore the Easterlin Paradox closely by quantifying the
partial derivatives of overall and domain-specific happiness index with respect to income, i.e.,
∂H/∂y and ∂Di/∂y, respectively. While we find that overall happiness is related to income
level based on equation (1) [in the column (3) of Table 3] and that log household income is
positively and significantly related to each domain specific happiness in Table 4, the
structural equation result in column (1) of Table 3 shows the insignificant coefficients on
income. These results suggest that the nexus between income and happiness is not
necessarily a direct one but an indirect one through each domain specific happiness being
affected by income.
12 Welsh (2006) explain the relationship between environmental quality and life satisfaction and then provides
valuation estimates for 10 European countries for air quality improvements.
13 Lelkes (2005) obtained similar results for Hungary suggesting that religious involvement contributes
positively to individuals’ subjective well-being.

12
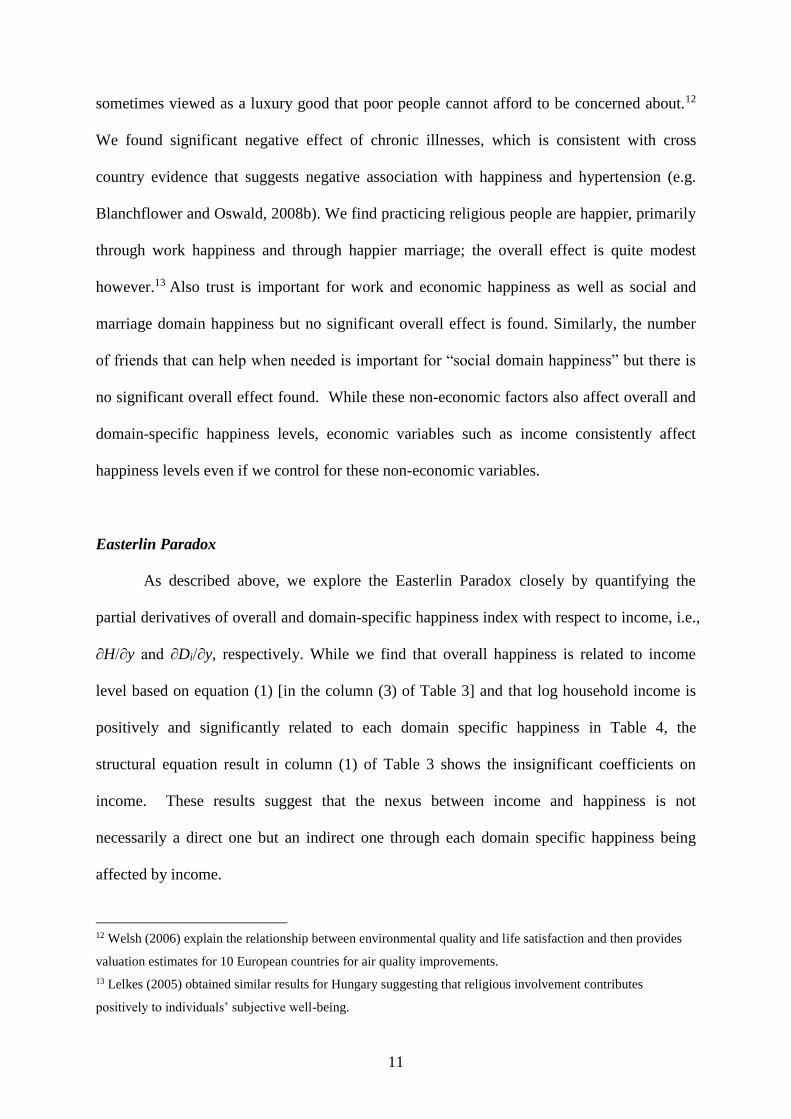
To quantify the slopes, ∂H/∂y and ∂Di/∂y, flexibly, we also employ Robinson’s (1988)
“double residual methodology” and estimate the semi-parametric regression model described
in equation (3) and (4). Figure 2 to 6 show the estimation results, indicating positive and
significant income effects on happiness, for all domain specific happiness indices. These
results suggests that income remains as an important determinant for happiness i.e., richer
individual are more satisfied in various life domains than poorer individuals. We also use the
Hardle and Mammen’s (1993) test by which we compare the nonparametric and parametric
regressions. Intriguingly, except for the economic domain happiness, we cannot reject the
null hypothesis that the nonparametric regression and linear regression give the same fitted
equation. So, generally richer individuals are happier than poorer individuals. Yet, our results
for economic/financial domain happiness is rather in favor of Easterlin paradox: in the Hardle
and Mammen’s (1993) test, while we reject the null hypothesis that the nonparametric
regression and linear regression give the same fitted equation, we cannot reject the null
hypothesis that the nonparametric regression and the cubic regression give the same fitted
equation. As pointed out by Easterlin and Sawangfa (2009) that ‘perceptions of one’s
financial situation, do not rise commensurately with the objective improvement in living
conditions’ because rising income also raises the standards by which people judge their living
conditions (cf. Clark, Frijters and Shields 2008) and that offsetting changes in other life
domains can produce such non-linearity within income-happiness (financial satisfaction)
relationship. 14
Unobserved heterogeneity
Regression analyses of cross-sectional happiness data have been criticized because
unobserved personality traits and subjective response tendencies can generate estimation
14 By distinguishing between actual income and aspiration income, Knight and Gunaltilka (2012) show in case
of China that subjective wellbeing is raised by actual income, while it is lowered by aspiration income.

13
biases. A common way to handle this problem has been to incorporate individual fixed
effects and to eliminate time-invariant unobserved heterogeneity (Frey and Stutzer, 2002,
Clark et al., 2008). We also adopt such a canonical method: while we have only single cross-
section data, domain specific happiness answers for each respondent allow us to eliminate
unobserved heterogeneities due to personality traits and subjective response tendencies.
Table 4 reports estimated “heterogeneity-free” ratios of the domain specific happiness levels
Dj to the overall happiness H in log, i.e., log (Dj/H), after controlling for time-invariant
unobserved heterogeneities by individual fixed effects. The happiness levels of economic
and housing conditions are significantly lower than that of the overall happiness level by
37.8% and 10.5%, respectively. On the other hand, an average Bangladesh respondent is
happier in social and married lives than that of overall happiness by 22.8% and 14.8% where
the latter figure is computed only for married respondents. These results, together with the
importance of happiness in financial and economic domain found in column (1) of Table 3,
may manifest themselves that, to enhance people’s happiness further effectively, it would be
important to fill in the gap of happiness in economic domain by improving material well-
beings in low income economies like Bangladesh.
4. Concluding Remarks
Our results generally suggest that income and wealth variables, including relative economic
status ones, appear to be important determinants of happiness, which is consistent with few
other available existing literature in developing countries and it is also reasonable in the light
of cross-country comparisons, where it is found that average income is important at low
income levels, but basically non-important above a certain threshold level (Argyle, 2001,
Easterlin and Sawangfa, 2007). That relative economic condition matters is consistent with a

14
hypothesis that income and happiness will move hand in hand in developing countries,
suggesting that income is a good summary measure of well-being and welfare.
We closely test income-happiness relationship in several life domains. It is important
to note that our results are also consistent with the “Easterlin Paradox” or the concavity of the
happiness function, particularly in economic happiness or financial satisfaction domain. This
is very important result, indicating that to enhance people’s happiness further effectively, it
would be indispensable to improve material well-beings in low income economies like
Bangladesh. Intriguingly, Easterlin and Sawangfa (2009) find financial and overall life
satisfaction typically trend similarly within a country, in case of 13 developing countries, and
they suggest that satisfaction with finance, albeit a less comprehensive measure of happiness
than overall happiness, may be more closely associated with economic growth and arguably a
better measure of happiness to test happiness growth relationship. Our result thus provides
new insight into the debate on happiness-income relationship and also highlights the
importance of studying happiness trends in the context of developing countries. Our results
also suggest that in lower segment of ‘Easterlin paradox’ it is still important to examine the
material determinant of happiness. We believe that much of the results obtained here provide
important insights and are generalizable, to a varying extent, in case of other developing
countries.

15
Reference
Angeles, L. (2011), A Closer Look at the Easterlin Paradox, Journal of Socioeconomics 40,
67-73
Argyle, M. (2001) The Psychology of Happiness. 2nd Edition, Routledge, London
Asadullah, M.N., and Chowdhury, N. (2012), Subjective Wellbeing and Relative Poverty in
Rural Bangladesh, Journal of Economic Psychology.
Biswas-Diener, R, and Diener, E (2001), Making the Best of a Bad Situation: Satisfaction in
the Slums of Calcutta, Social Indicators Research 55, 329-352
Blanchflower and Oswald, A. J. (2004), Well-Being Over Time in Britain and USA, Journal
of Public Economics, 88(7-8), pages 1359-1386.
Blanchflower, D.G. and Oswald, A. J. (2011), International Happiness, NBER Working
Paper 16668, National Bureau of Economic Research, USA.
Blanchflower, D.G., Oswald, A.J. (2008a), Is Well-Being U-Shaped over the Life Cycle?
Social Science and Medicine 66, 1733-1749.
Blanchflower, D.G. and Oswald, A. (2008b) Hypertension and Happiness across nations,
Journal of health economics, 27(2) 218-233.
Brinkerhoff, M. B., K.A. Fredell and J.S. Frideres, 1997, Basic Minimum needs, Quality of
Life and Selected Correlates: Exploration in Villages in Northern India, Social
Indicator Research 42, pp 245-281.
Camfield, L., Chowdhury, K. and Devine, J. (2009), Relationships, Happiness and Well-
being, Insights from Bangladesh, Journal of Happiness Studies 10(1), 71-91.
Clark, A.E., and Oswald, A.J. (1994), Unhappiness and Unemployment, The Economic
Journal 104, 648-659.

16
Clark, A.E., Frijters, P., and Shields, M.A. (2008). “Relative Income, Happiness, and Utility:
An Explanation for the Easterlin Paradox and Other Puzzles,” Journal of Economic
Literature, 46(1), 95-144.
Clark, A.E. and Senik, C. (2010), Who compares to whom? The anatomy of income
comparisons in Europe, Economic Journal, 120(544); 553-594.
Di Tella, R., MacCulloch, R., Oswald, A.(2001). Preferences over inflation and
unemployment: evidence from surveys of happiness, American Economic Review 91,
335-341.
Di-Tella, R. D., & MacCulloch, R. (2006). Some Uses of Happiness Data in Economics.
Journal of Economic Perspectives, 20 (1), 25-46.
Di-Tella, R. D., & MacCulloch, R. (2008). Gross National Happiness as an answer to the
Easterlin Paradox? Journal of Development Economics, 86, 22-42.
Diener, E., Suh, E.M., Smith, H., and Shao, L. (1995a), National Differences in Subjective
Wellbeing- why do they occur? Social Indicator Research, 34, 7-32.
Diener, E. Diener, M. and Diener, C. (1995b) Factors Predicting Subjective Wellbeing of
Nations, Journal of Personality and Social Psychology, 99(52-61).
Diener, E. and Biswas-Diener, R. (2002), Will Money Increase Subjective Well-Being? A
Literature Review and Guide to Needed Research, Social Indicator Research 57, 119-
169.
Easterlin, R., 1974, Does Economic Growth Improve the Human Lot? Some Empirical
Evidence, In :David, P.A., Reder, M.W.(Eds), Nations and Households in Economic
Growth: Essays in honour of Moses Abramovitz, Academic Press, New York, pp. 89-
125.
Easterlin, R A (1995), Will Raising the Incomes of All Increase the Happiness of All?
Journal of Economic Behaviour and Organisation, 27, 35-47.

17
Easterlin R, (2001), Income and Happiness: Towards a Unified Theory, Economic Journal,
111(473) July, 465-84.
Easterlin, R. A., and Sawangfa, O. (2007). “Happiness and Domain Satisfaction: Theory and
Evidence.” In Amitava Krishna Dutt and Benjamin Radcliff (eds.) Happiness,
Economics, and Politics: New Lessons for Old Problems. Northampton, MA:
Edwards Elgar Publishers.
Easterlin, R.A. and Sawangfa, O. (2009), Happiness and Economic Growth: Does the cross
section predict time trends? Evidence from developing countries, IZA Discussion
paper No 4000, February.
Frey, B. S. and Stutzer, A. (2000), Happiness, Economy and Institutions, Economic Journal
110(466), 918-938
Frey, B. S. and Stutzer, A. (2002), What Can Economists Learn from Happiness Research?
Journal of Economic Literature, 40(2), 402-435
Graham, C. (2005) Insights on Development from the Economics of Happiness, World Bank
Research Observer, 20(2), 201-31.
Hardle, W. and Mammen, E. (1993) Comparing Nonparametric Versus Parametric
Regression Fits, The Annals of Statistics, 21(4) (1993); 1926-1947.
Johansson-Stenman, Olof & Martinsson, P. (2006), Honestly, why are you driving a BMW?
Journal of Economic Behavior & Organization, vol. 60(2), 129-146,
Kahneman, D, Wakker, P. and Sarin, R. (1997), Back to Bentham? Explorations of
Experienced utility, Quarterly Journal of Economics 112, 375-405.
Kahneman, D., Krueger, A.B. (2006), Development in the Measurement of Subjective
Wellbeing, Journal of Economic Perspective 20(1), 3-24.
Kingdon, G., and Knight J. (2007), Community, Comparisons and Subjective Wellbeing in a
divided society, Journal of Economic Behavior and Organization 64, 69-90.

18
Knight, J., and Gunatilka, R. (2010), Great Expectations? The Subjective Wellbeing of Rural
Urban Migrants in China, World development 38(1), 113-124.
Knight, J. and Gunatilka, R. (2012), Income Aspirations and the Hedonic Treadmill in a Poor
Society, Journal of Economic Behavior and Organization 82, 67-81.
Knight, J., Song, L and Gunatilka, R. (2009), The Determinants of Subjective Well-being in
China, China Economic Review 20(4), 634-649.
Krueger, A. B. and Schkade, D.A. (2008), The Reliability of Subjective Well-being Measures,
Journal of Public Economics 92, 1833-1845.
Layard, R. (2010), Measuring Subjective Wellbeing, Science 327(534).
Lelkes, O. (2006), Tasting Freedom: Happiness, Religion and Economic Transition, Journal
of Economic Behaviour and Organization 59(2), 173-194.
Mahmud, M. (2005), Measuring Trust and the Value of statistical lives: evidence from
Bangladesh, Economic Studies 145, Department of Economics, University of
Gothenburg, Sweden, ISBN 91-85169-04-8, ISSN 1651-4289
Ng. Y. K. (1997), A Case for Happiness, Cardinalism, and Interpersonal Comparability,
Economic Journal 107, 1848-1858.
Oswald, A. (1997), Happiness and Economic Performance, Economic Journal, 107(445),
1815-31.
Oswald, A.J. and Wu, S. (2011), Well-being across America, Review of Economics and
Statistics, 93(4), 1118-1134.
Ravallion, M. and Lokshin, M (2010), Who Cares About Relative Deprivation? Journal of
Economic Behavior and Organization 73(2), 171-185.
Robinson, P. M. (1988), "Root-n Consistent Semiparametric Regression". Econometrica 56
(4): 931–954

19
Selezneva, E. (2011), Surveying transitional experience and subjective well-being: Income,
work, family, Economic Systems 35: 139-157
Stevenson, B, Wolfer, J. (2008), Economic Growth and Subjective Wellbeing: Reassessing
the Easterlin Paradox, Brookings Paper on Economic Activity, Spring.
Stigliltz, J.E., Sen, A., and Fitoussi, J.P. (2009), Report by the commission on the
measurement of economic performance and social progress, February 2014.
Van Praag, B.M.S. , Ferrer-i-Carbonell, A.(2004), Happiness Quantified: A Satisfaction
Calculus Approach. Oxford: Oxford University Press.
Van Praag, B.M.S., P. Frijters, and Ferrer-i-Carbonell, A. (2003) The Anatomy of Subjective
Well-being, Journal of Economic Behaviour and Organization 51, 29-49.
Welsch, H. (2006), Environment and Happiness: Valuation of Air Pollution Using Life
Satisfaction Data, Ecological Economics 58(4), 801-813.

20
Table 1. Respondent Characteristics
Variable Definition Min Max Mean Std. N
Age Age of the respondent 19 87 43.837 12.942 700
Married The respondent is currently married 0 1 0.928 - 700
More than two children There are more than two children in the family 0 1 0.292 - 700
Low education The respondent has education up to high school level 0 1 0.56 0.496 700
High education The respondent has education above high school level 0 1 0.132 0.441 700
Household equivalent income Annual household income adjusted with equivalence and economies of scale;
Total yearly household income was divided by
[(number of adults+ 0.5×number of children) 0.75]
4385 61650 18687.95 11941.73 700
Economically better-off than others The respondent thinks his household’s economic situation is better compared to other
households’ in the village
0 1 0.269 0.441 700
Economically similar as others The respondent thinks his household’s economic situation is similar as compared to other
households’ in the village
0 1 0.394 0.489 700
Economically worse-off than others The respondent thinks his household’s economic situation is worse compared to other
households in the village
0 1 0.39 0.49 699
House material standard An index of the structure of the house: main materials of the Floor, the Wall, and the Roof of
the house in which the household lives. Natural material=1, Rudimentary material=2, Finished
material=3. The index is the sum of these three categories for the Floor, Wall and the Roof.
3 9 5.443 1.499 777
Perceived environmental quality An index (Arithmetic sum) of the responses to following questions: 1) How would you describe
the quality of the water that you and the others in your household drink? And 2) How would you
describe the air quality in the area you live? Very Bad=0, Bad=1, Neither Good or Bad=2,
Good=3, Very Good=4
2 8 6.371 1.264 699
Health Chronic illness If respondent has any of the following health condition: Asthma, Blood pressure, Diabetic,
Heart Disease, and Lung disease.
0 1 0.384 - 700
Self-reported health Self-reported health. The question was asked as follows: How would you say your health is in
general? 1=Very poor, 2= Poor, 3= Fair, 4= Good and 5=Very good.
1 5 2.995 0.810 700
Member of voluntary organisation Has membership in voluntary groups and/or association 0 1 0.494 - 697
No of friends to get financial help If you suddenly needed a small amount of money which would be enough to pay for expenses
for your household for one week, how many people beyond your immediate household could
you turn to who would be willing to provide this money?
0 20 4.67 4.794 700
Hindu religion The religion of the respondent is Hinduism 0 1 0.351 - 700
Religious practice The respondent does religious praying at least once a day 0 1 0.633 0.48 699
Recent misfortune The respondent or any member of the household has been victim to any of the following
incidents in the last one year: robbery/theft, mugging, personal assault, home attack, land fraud,
false criminal accusation, and political harassment
0 1 0.232 0.43 697
Stated trust Level of agreement with the statement that most people can be trusted. 1= strongly disagree,
2=disagree, 3=partly disagree, 4=partly agree, 5=agree, 6=strongly agree.
0 6 3.09 1.410 700

21
Table 2. Overall Happiness and Happiness in Different Life Domains
Mean Median Standard
deviation
Overall happiness 5.0 5 2.1
Happy about work situation 5.0 5 2.5
Happy about Financial/Economic
situation
4.1 4 2.3
Happy about Housing condition 4.8 5 2.5
Happy about Leisure 4.9 5 2.5
Happy about Social life 5.9 6 2.5
Happy about Married life 7.4 8 2.6

22
Table 3. Analysis of Overall Happiness
(1) (2) (3) Structural form Reduced form
estimation Total effect
Method OLS OLS Delta method Combining (1) and domain specific happiness results
Happy about Work situation 0.205*** (0.03)
Happy about Financial/Economic situation
0.360*** (0.03)
Happy about Housing condition 0.052* (0.03)
Happy about available leisure 0.035 (0.03)
Happy about Social life 0.069** (0.03)
Happy about Married life -0.021 (0.02)
Married
-0.122 (0.47)
0.230 (0.69)
-0.099 (0.11)
More than two children -0.014 (0.13)
-0.011 (0.17)
-0.014 (0.16)
Age
-0.026 (0.03)
-0.040 (0.03)
-0.039 (0.04)
Age square × (1/100)
0.033 (0.03)
0.048 (0.03)
0.047 (0.04)
Low education
0.231* (0.13)
0.290 (0.20)
0.286 (0.18)
High education -0.101 (0.21)
0.123 (0.23)
0.123 (0.28)
Unemployed
0.090 (0.35)
-0.716 (0.53)
-0.7087 (0.46)
Log (Household equivalent income) 0.099 (0.11)
0.391*** (0.13)
0.393*** (0.14)
Economically better-off than others 0.315** (0.15)
0.631*** (0.18)
0.628*** (0.20)
Economically worse-off than others -0.058 (0.14)
-0.713*** (0.18)
-0.710*** (0.18)
Housing condition 0.061 (0.05)
0.210*** (0.07)
0.202*** (0.07)
Perceived environmental quality 0.114** (0.05)
0.241*** (0.05)
0.240*** (0.062)
Has chronic illness -0.265** (0.12)
-0.397*** (0.14)
-0.389** (0.16)
Self- reported health status -0.051 (0.08)
0.072 (0.138)
0.076 (0.10)
Member in voluntary organisation 0.140 (0.12)
0.113 (0.16)
0.115 (0.15)
Has recent misfortune -0.167 (0.13)
-0.31* (0.16)
-0.308* (0.17)
Hindu religion -0.012 (0.30)
-0.050 (0.37)
-0.047 (0.40)
Religious practice 0.096 (0.13)
0.272 (0.17)
0.273* (0.17)
Stated trust -0.031 (0.04)
0.078 (0.05)
0.077 (0.05)
No. of friends to get financial help 0.007 (0.01)
0.013 (0.01)
0.013 (0.02)
Constant -0.662 (1.14)
-1.464 (0.14)
R Square 0.623 0.267 Number of Observations 637 637 637
Note: Standard errors are reported in parentheses. Dependent variable is a measure of overall happiness based on the question, “as
a whole, how happy would you say you are? Please answer by using the following scale in which 0 means ‘extremely unhappy’
and 10 means ‘extremely happy’. ‘5’ indicate average happiness so that half the population in Bangladesh are above 5 and half
below 5.” In the survey, the respondents were asked to circle their happiness on an 11-point scale ranging from 0 meaning
“Totally unhappy” to 10 meaning “Totally happy.”

23
Table 4. Analysis of Happiness: Seemingly Unrelated Regression (SUR) Model
Happiness in Different Life Domains
Work Economic Housing Leisure Social Life Married Life
Married
0.269
(0.72)
0.375
(0.66)
-0.947
(0.73)
-1.645
(0.76)
-0.446
(0.74)
More than two children 0.087
(0.20)
0.031
(0.18)
-0.195
(0.20)
-0.248
(0.21)
-0.029
(0.21)
0.338
(0.23)
Age
0.030
(0.05)
-0.050
(0.04)
0.003
(0.05)
-0.035
(0.05)
0.020
(0.05)
0.066
(0.05)
Age square × (1/100)
-0.043
(0.05)
0.057
(0.04)
0.014
(0.05)
0.043
(0.05)
-0.017
(0.05)
-0.054
(0.06)
Low education
0.092
(0.22)
0.046
(0.19)
0.094
(0.22)
0.134
(0.23)
0.051
(0.23)
-0.272
(0.25)
High education 0.780**
(0.34)
0.241
(0.30)
-0.286
(0.34)
0.217
(0.35)
-0.263
(0.35)
-0.147
(0.38)
Unemployed
-1.161*
(0.57)
-1.242*
(0.51)
-0.853
(0.57)
-0.605
(0.59)
0.829
(0.59)
-0.496
(0.64)
Log (Household equivalent income) 0.374*
(0.17)
0.428*
(0.16)
0.437*
(0.17)
0.416*
(0.18)
0.489*
(0.18)
0.384*
(0.20)
Economically better-off than others 0.666***
(0.24)
0.581***
(0.22)
-0.286
(0.24)
0.164
(0.25)
-0.445*
(0.25)
-0.360
(0.27)
Economically worse-off than others -0.785***
(0.22)
-1.143***
(0.20)
-1.058***
(0.22)
-0.738***
(0.23)
-0.148
(0.23)
-0.496**
(0.25)
Housing condition 0.093
(0.08)
0.218***
(0.07)
0.523***
(0.08)
0.232***
(0.09)
0.194***
(0.09)
0.260***
(0.09)
Perceived environmental quality 0.272***
(0.08)
0.111
(0.07)
0.194**
(0.08)
0.286***
(0.08)
0.225***
(0.08)
0.252***
(0.09)
Has chronic illness -0.385**
(0.19)
-0.078
(0.17)
-0.329*
(0.19)
-0.008
(0.20)
-0.073
(0.20)
-0.236
(0.22)
Self- reported health status 0.186
(0.12)
0.184*
(0.11)
-0.034
(0.10)
0.220*
(0.13)
0.369***
(0.13)
0.405***
(0.14)
Member in voluntary organisation 0.057
(0.19)
-0.144
(0.17)
-0.221
(0.19)
0.293
(0.19)
0.257
(0.20)
0.046
(0.20)
Has recent misfortune -0.239
(0.21)
-0.178
(0.19)
0.067
(0.21)
-0.329
(0.22)
-0.296
(0.22)
-0.019
(0.24)
Hindu religion 0.122
(0.48)
-0.102
(0.43)
-0.624
(0.49)
-0.177
(0.51)
-0.008
(0.51)
-0.764
(0.55)
Religious practice 0.367*
(0.20)
0.246
(0.18)
0.197
(0.20)
0.145
(0.21)
0.143
(0.21)
0.563**
(0.23)
Stated trust 0.184***
(0.06)
0.145**
(0.06)
0.131
(0.06)
0.076
(0.07)
0.185**
(0.07)
0.164**
(0.07)
No. of friends to get financial help 0.006
(0.02)
0.002
(0.02)
0.026
(0.02)
0.019
(0.02)
0.066***
(0.02)
0.034
(0.02)
Constant -4.435*
(2.30)
-2.622
(2.06)
-4.064*
(2.31)
-0.490
(2.40)
-3.145
(2.40)
-2.378
(2.52)
R Square 0.275 0.315 0.299 0.239 0.211 0.181
Number of Observations 637 637 637 637 637 637
Note: Standard errors are reported in parentheses. Dependent variable is a measure of happiness in each domain based on the
questions for each domain, “how happy would you say you are? Please answer by using the following scale in which 0 means
‘extremely unhappy’ and 10 means ‘extremely happy’. ‘5’ indicate average happiness so that half the population in Bangladesh
are above 5 and half below 5.” In the survey, the respondents were asked to circle their happiness on an 11-point scale ranging
from 0 meaning “Totally unhappy” to 10 meaning “Totally happy.”

24
Table 5. The Estimated Ratios of the Domain to Overall Happiness Levels
Estimation Method: Individual Fixed Effects
Dependent variables Coefficient (Standard error)
Dummy=1 if happy about work situation -0.041 (0.047)
Dummy=1 if happy about financial/economic situation -0.378*** (0.052)
Dummy=1 if happy about housing condition -0.105** (0.052)
Dummy=1 if happy about leisure -0.076 (0.049)
Dummy=1 if happy about social life 0.227*** (0.049)
Dummy=1 if happy about married life -0.971 (0.837)
Happy about married life*married 1.472* (0.835)
Constant 1.352*** (0.031)
Number of observations 4844
Number of individuals 700
F test statistics for the jointly zero coefficients
[p-value]
35.19
[0.000]
Note: Dependent variable is overall or domain specific happiness in logs. In the set of independent variables, a dummy for overall
happiness is taken as the default category. In estimation, individual fixed effects are included. Standard errors shown in
parentheses are robust-standard errors.

25
Figure 1. Distribution of Happiness

26
Figure 2. Overall Happiness and Income Relationship

27
Figure 3. Domain-Specific Happiness and Income Relationship
Recommended