Hands-on: Using ArcGIS and QGIS GIS Mapping for Linguistic Research
Jennifer Cramer
University of Kentucky

Hands on!I think last week went well!
Like last week, I’ll do a quick run through of the assignment, and you’ll have access to the slides to do the work itself
If you haven’t already, please make sure you’ve done the following:
Create a free public account on ArcGIS online at http://www.arcgis.com/home/index.html
Download QGIS at http://www.qgis.org/en/site/ (should be available to all types)
Work in pairs, need one computer, might not take the whole session, can leave when done

Remember…Actually, before we get started, I’m going to finish up some of the demo of ArcGIS I was doing on Friday
Follow along at http://learn.arcgis.com/en/projects/get-started-with-arcmap/
Let me know if I can help you figure out whether your institution already has a license
If you already have it on your computer, you can do the tutorial too!
If not, you should be able to access this tutorial from home or work; it’s a good way to get to know the capabilities of the tool!

Remember…An important component to doing GIS analysis is georeferencing
“Georeferencing describes the process of locating an entity in ‘real world’ coordinates.” (EPA 2009)
So, to build our maps, we need
Georeferenced linguistic data
Base map data
Other relevant data we want to map
Our favorite mapping tool!

Remember…When we map, we must make decisions
In the first part of today’s assignment, we’re going to map that same dialect data again (in ArcGIS online), but this time we’ll combine it with some other data
The second part involves mapping the native languages of Kentucky in QGIS
And we always have to ask
What is the research question?
What level of detail do we need?
What info do we need?

Part 1: Mapping in ArcGIS OnlineGo to https://www.arcgis.com/home/index.html and sign in with the username and password you set up

Part 1: Mapping in ArcGIS OnlineClick “Map” in the top bar
This will open the map that appears on the next slide
Obviously, there are other things here to do…play with them!


Part 1: Mapping in ArcGIS OnlineTo create your map, click the “Add data” button and find the .csv file
Click “Add layer from file” and locate the file
It will ask you about which fields are your geographic indicators, but it has also already figured it out! Click “Import layer”
By default, it will show you points on the map representing the first column, which is first name…not likely to be useful!
So you will need to select the attribute you want to show and how

Part 1: Mapping in ArcGIS OnlineOn the left, you’ll see this in the table of contents area
Select one of the attributes from (1)
Then select the drawing style you want from (2)The first one will show dots for each location (click “Options” to change colors, transparency, etc.)
The second one will calculate areas of density for the selected terms (click “Options” to change colors, transparency, etc.)
The third one will just show locations
If you play with “Heat map” – what do you think it is showing?

Part 1: Mapping in ArcGIS OnlineAfter you select “Done”, you will see this image (Mine was showing “cot/caught” data at the time)
Here you can do a few thingsRename the legend key
Change style some more
See attribute table
But let’s add another layer to see if we can find more interesting patterns!

Part 1: Mapping in ArcGIS OnlineZoom into/center on KY and click “Add data” and “Search for layers”
This is a time for you to see what’s out there
Some things you might try – “Kentucky counties”, “Kentucky demographics”, or just “Kentucky”
Feel free to try this with other parts of the country
Just like in ArcGIS, you can move the items around in the table of contents to change the layering
Here’s what I created!
When you’re done, either print or share (you must save first!)

Part 2: Mapping in QGISFor this next part, we’ll be using QGIS Desktop
Why QGIS and not ArcGIS Online?ArcOnline will limit the size of files that you might want to upload
As you get more involved with spatial analysis, you will find that online applications will actually limit the types of queries and statistics you can perform
You control your data- this might be important depending on what (or who) you are mapping
It’s free!

Part 2: Mapping in QGISToday, we’re going to map the Native American languages that were at one time spoken in Kentucky
In addition to familiarizing everyone with QGIS, this will also allow us to:
Identify places we can get georeferenced data
How we can create georeferenced data
How we can combine non-georeferenced data with our georeferenced dataWhat we’ll need: the KY_native_languages_areas.zip, KY_archaeological_sites.csv, and NativeLanguagesData.csv files(all on Canvas).

Part 2: Mapping in QGISFirst things first:
QGIS has a number of basic functions, but these can be expanded.
Let’s start by adding a plugin that will allow us to have base maps.
->Plugins -> Manage and Install PluginsSearch for OpenLayers Plugin
Once this is installed, go to the ->Web ->OpenLayers plugin
You now have base map utilities in Q!

Part 2: Mapping in QGISHowever, sometimes we want to create our own maps.
QGIS is great for this.
Before we start using our data from Canvas, let’s first look at where we can get other files for creating our own “base” maps.
Search for Kentucky GIS in Google or go to www.kygeonet.ky.govWe’ll want the second link, Kentucky Geography Network
Here, we’ll be searching for a shapefile that includes the outline of the Commonwealth of Kentucky
We’ll find our file by searching for “state”
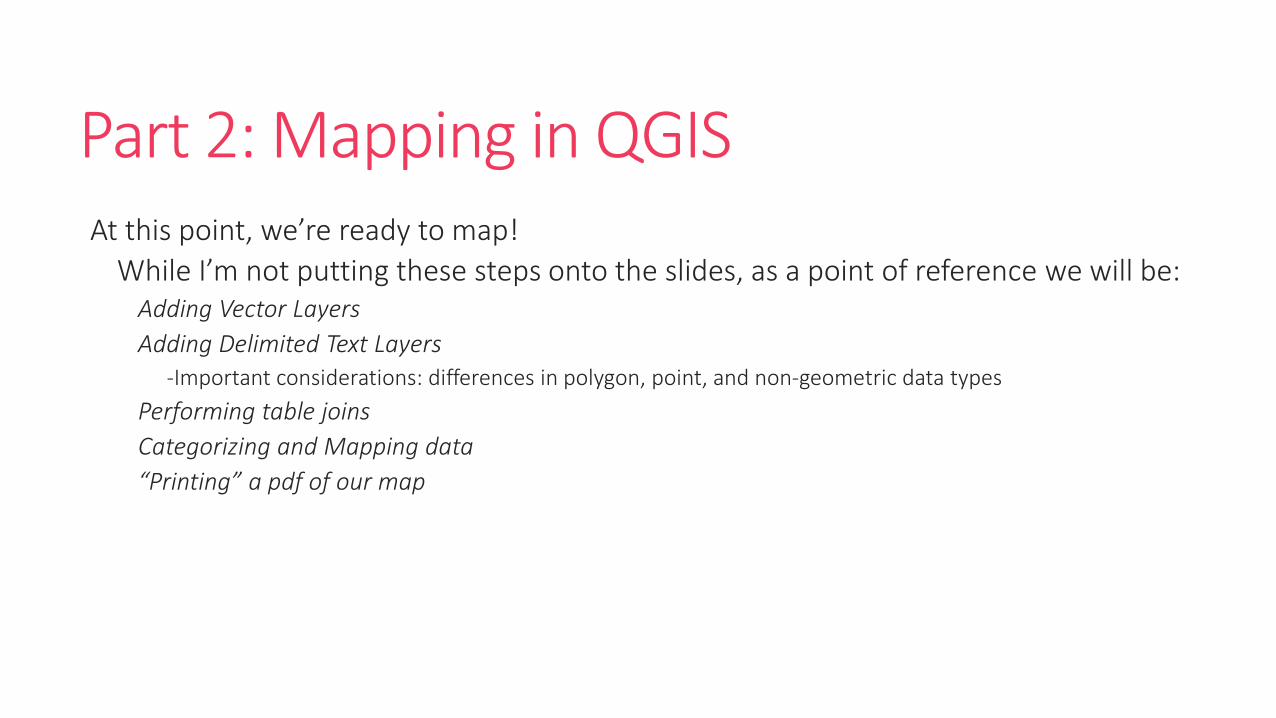
Part 2: Mapping in QGISAt this point, we’re ready to map!
While I’m not putting these steps onto the slides, as a point of reference we will be:Adding Vector Layers
Adding Delimited Text Layers-Important considerations: differences in polygon, point, and non-geometric data types
Performing table joins
Categorizing and Mapping data
“Printing” a pdf of our map

Part 3: ReflectionFinally, when you have created your maps, I would like you, as a group, to reflect on the process. Please answer the following questions (like ~4-5 sentences each).
1. You saw KyGeoNet, a really awesome clearinghouse for geospatial data about Kentucky. Search the web to see if you can find anything like this for your home state/country. What is available? Do you think it will be useful to your research?
2. We’ve talked a little about the ethical concerns that might arise in mapping certain kinds of data. Do you have a better idea about how to handle this in your research? What would you do?
3. You’ve played with ArcGIS and QGIS today. Which one do you like better? Why?
Recommended