DISCLOSURE APPENDIX AT THE BACK OF THIS REPORT CONTAINS IMPORTANT DISCLOSURES, ANALYST CERTIFICATIONS, AND THE STATUS OF NON-US ANALYSTS. US Disclosure: Credit Suisse does and seeks to do business with companies covered in its research reports. As a result, investors should be aware that the Firm may have a conflict of interest that could affect the objectivity of this report. Investors should consider this report as only a single factor in making their investment decision.
CREDIT SUISSE SECURITIES RESEARCH & ANALYTICS BEYOND INFORMATION®
Client-Driven Solutions, Insights, and Access
01 September 2014
Asia Pacific/Singapore
Equity Research
Forest Products
Halcyon Agri Corporation Ltd
(HALC.SI / HACL SP) REINSTATEMENT
Capacity expansion to drive growth
■ Re-instate coverage with OUTPERFORM. We re-instate coverage of
Halcyon Agri with an OUTPERFORM rating (previously Neutral) and target
price of S$1.20 (previously S$0.80). We believe there is over 40% share
price upside driven by significant capacity growth and supported by
increasing demand in the global tyre market, which should lead to a five-fold
growth in net profit over 2013-16E.
■ Licensed capacity doubled with Anson acquisition. Following the
acquisition of Anson Company from Lee Rubber for a consideration of
S$450 mn, Halcyon's licensed capacity will increase by 408,000 mT to reach
748,000 mT, making it one of the largest producers of Technically Specified
Rubber (TSR) globally. Rising demand for natural rubber is likely to be
driven by an expanding tyre market, which we expect to grow at 3.8% per
annum in 2013-17E.
■ Potential synergies to further drive earnings growth. With the use of
Halcyon's sales and marketing to support Anson's operations, we see scope
for Anson's margin to increase from US$161/mT in 2013 to US$320/mT in
2016E, in line with Halcyon's margin. Overall, we expect the volume growth
and acquisition synergies to drive an increase in net profit from US$9 mn in
2013 to US$50 mn in 2016.
■ Valuation attractive. Halcyon currently trades at a 2015E P/E of 9.2x and 2016E P/E of 5.8x, a discount to global tyre manufacturers and commodity traders. Our S$1.20 target price is based on a 2016E P/E of 8.0x, in line with its peers. In our view, the successful execution of its planned capacity growth would drive re-rating. Key risks include high net gearing post acquisition of 2.5x, which would be closer to 2.0x after adjustment for working capital loans.
Share price performance
0
100
200
300
400
0
0.5
1
1.5
2
Feb-13 Jun-13 Oct-13 Feb-14 Jun-14
Price (LHS) Rebased Rel (RHS)
The price relative chart measures performance against the
FTSE STRAITS TIMES IDX which closed at 3327.09 on
29/08/14
On 29/08/14 the spot exchange rate was S$1.25/US$1
Performance over 1M 3M 12M Absolute (%) 2.4 10.4 26.9 — Relative (%) 3.2 9.4 17.4 —
Financial and valuation metrics
Year 12/13A 12/14E 12/15E 12/16E Revenue (US$ mn) 205.0 400.0 1,287.5 1,362.5 EBITDA (US$ mn) 13.1 18.4 78.5 101.1 EBIT (US$ mn) 12.1 17.0 67.1 89.8 Net profit (US$ mn) 9.1 6.7 31.2 49.6 EPS (CS adj.) (US$) 0.02 0.02 0.07 0.12 Change from previous EPS (%) n.a. -62.4 0.5 27.3 Consensus EPS (US$) n.a. 0.03 0.09 0.09 EPS growth (%) -7.9 -31.3 338.5 58.9 P/E (x) 27.7 40.3 9.2 5.8 Dividend yield (%) 1.2 1.2 1.2 1.2 EV/EBITDA (x) 18.1 30.4 7.6 5.6 P/B (x) 3.1 2.5 2.0 1.5 ROE (%) 17.1 6.8 23.8 29.5 Net debt/equity (%) net cash 163.8 158.7 114.0
Source: Company data, Thomson Reuters, Credit Suisse estimates.
Rating (from Neutral) OUTPERFORM* Price (29 Aug 14, S$) 0.85 Target price (S$) (from 0.80) 1.20¹ Upside/downside (%) 41.2 Mkt cap (S$ mn) 336.6 (US$ 269.6) Enterprise value (US$ mn) 559.67 Number of shares (mn) 396.00 Free float (%) 33.0 52-week price range 0.98 - 0.66 ADTO - 6M (US$ mn) 1.4
*Stock ratings are relative to the coverage universe in each
analyst's or each team's respective sector.
¹Target price is for 12 months.
Research Analysts
Gerald Wong, CFA
65 6212 3037
01 September 2014
Halcyon Agri Corporation Ltd (HALC.SI / HACL SP) 2
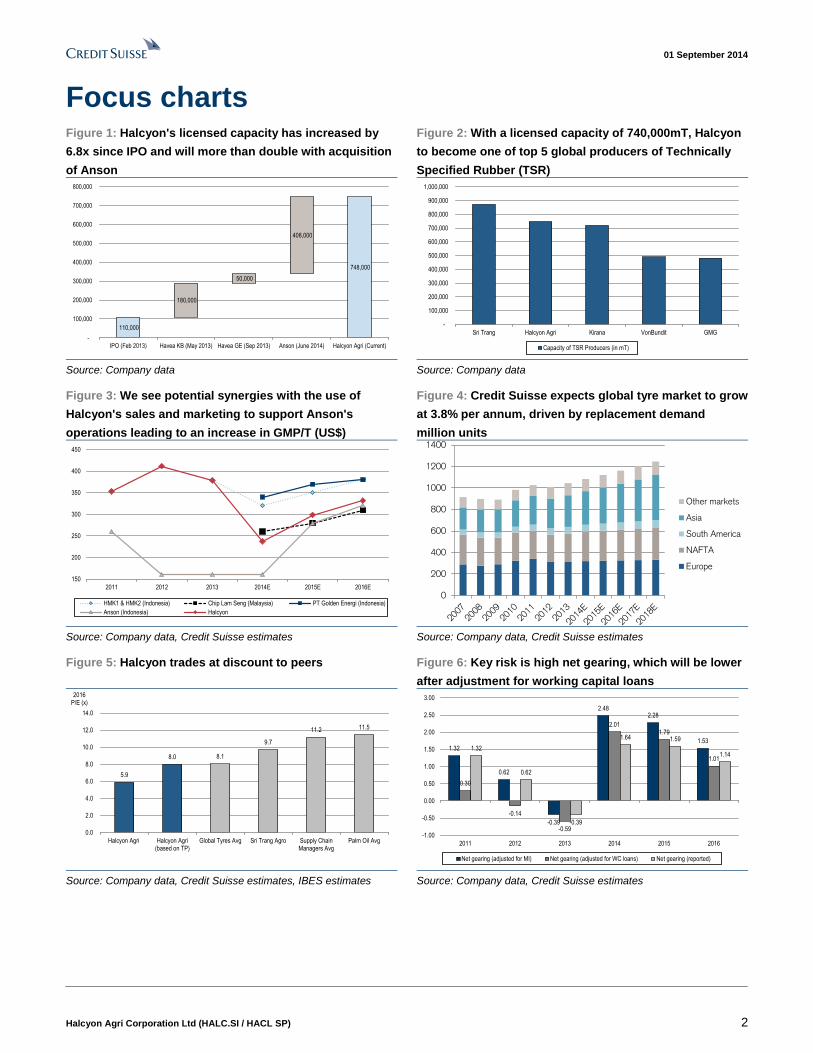
Focus charts Figure 1: Halcyon's licensed capacity has increased by
6.8x since IPO and will more than double with acquisition
of Anson
Figure 2: With a licensed capacity of 740,000mT, Halcyon
to become one of top 5 global producers of Technically
Specified Rubber (TSR)
110,000
748,000
180,000
50,000
408,000
-
100,000
200,000
300,000
400,000
500,000
600,000
700,000
800,000
IPO (Feb 2013) Havea KB (May 2013) Havea GE (Sep 2013) Anson (June 2014) Halcyon Agri (Current)
-
100,000
200,000
300,000
400,000
500,000
600,000
700,000
800,000
900,000
1,000,000
Sri Trang Halcyon Agri Kirana VonBundit GMG
Capacity of TSR Producers (in mT)
Source: Company data Source: Company data
Figure 3: We see potential synergies with the use of
Halcyon's sales and marketing to support Anson's
operations leading to an increase in GMP/T (US$)
Figure 4: Credit Suisse expects global tyre market to grow
at 3.8% per annum, driven by replacement demand
million units
150
200
250
300
350
400
450
2011 2012 2013 2014E 2015E 2016E
HMK1 & HMK2 (Indonesia) Chip Lam Seng (Malaysia) PT Golden Energi (Indonesia)
Anson (Indonesia) Halcyon
0
200
400
600
800
1000
1200
1400
Other markets
Asia
South America
NAFTA
Europe
Source: Company data, Credit Suisse estimates Source: Company data, Credit Suisse estimates
Figure 5: Halcyon trades at discount to peers Figure 6: Key risk is high net gearing, which will be lower
after adjustment for working capital loans
5.9
8.0 8.1
9.7
11.2 11.5
0.0
2.0
4.0
6.0
8.0
10.0
12.0
14.0
Halcyon Agri Halcyon Agri(based on TP)
Global Tyres Avg Sri Trang Agro Supply ChainManagers Avg
Palm Oil Avg
2016 P/E (x)
1.32
0.62
-0.39
2.482.28
1.53
0.30
-0.14
-0.59
2.011.79
1.01
1.32
0.62
-0.39
1.64 1.59
1.14
-1.00
-0.50
0.00
0.50
1.00
1.50
2.00
2.50
3.00
2011 2012 2013 2014 2015 2016
Net gearing (adjusted for MI) Net gearing (adjusted for WC loans) Net gearing (reported)
Source: Company data, Credit Suisse estimates, IBES estimates Source: Company data, Credit Suisse estimates

01 September 2014
Halcyon Agri Corporation Ltd (HALC.SI / HACL SP) 3
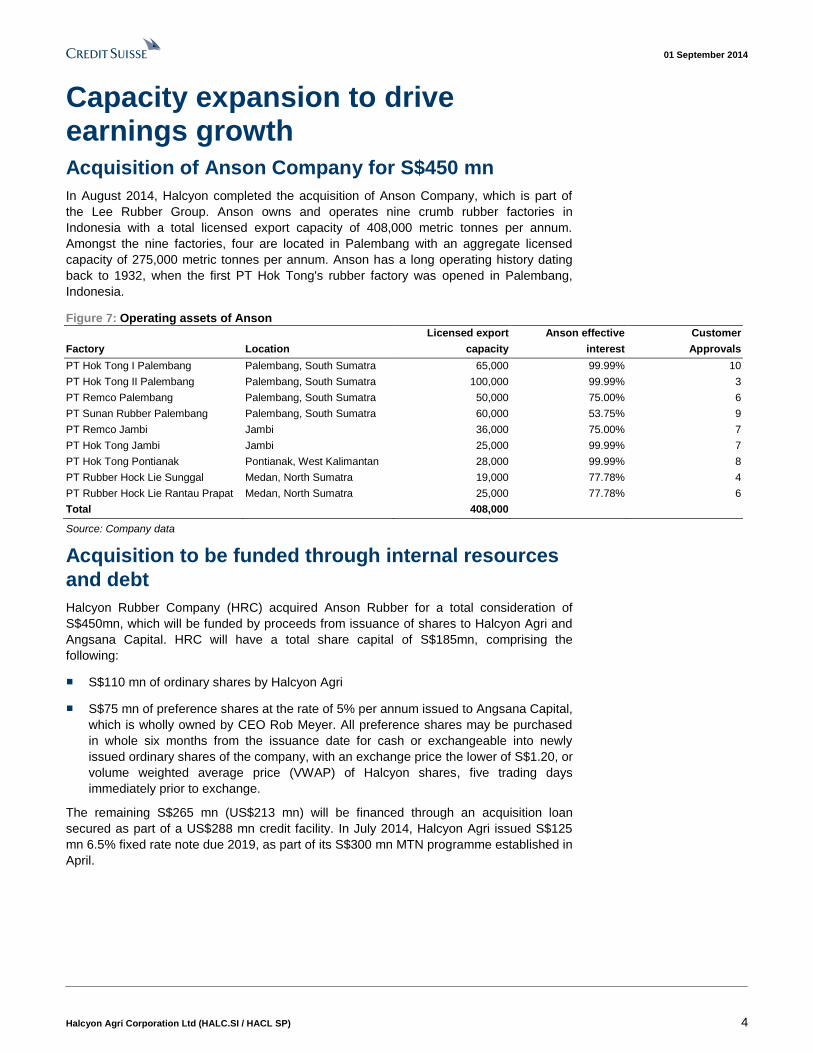
Capacity expansion to drive growth Licensed capacity doubled with acquisition of Anson
In August 2014, Halcyon completed the acquisition of Anson company, which is part of the
Lee Rubber Group. Anson owns and operates nine crumb rubber factories in Indonesia
with a total licensed export capacity of 408,000 mT per annum. Halcyon Rubber Company
acquired Anson for a consideration of S$450mn, which will be funded by a combination of
issuance of preference shares and borrowing. With the acquisition of Anson, Halcyon's
licensed export capacity will increase from 340,000 mT per annum to 748,00 mT per
annum. In combination with Halcyon's two existing HMK factories in Palembang, Halcyon
will become the largest crumb rubber producer and exporter in Palembang with a market
share of 30%. Halcyon will also become one of the top five producers of Technically
Specified Rubber (TSR) globally.
Potential synergies from combination of Anson and
Halcyon Agri
In addition, we expect the combination of Anson and Halcyon Agri to lead to potential
synergies. In 2012 and 2013, Halcyon Agri's margin was on average US$235/mT higher
than Anson, driven by the full capture of sales and marketing margin in Halcyon Agri.
When fully integrated, this could lead to potential EBITDA contribution of US$29 mn. We
forecast Anson's margin to increase from US$161/mT in 2013 to US$320/mT in 2016E, in
line with Halcyon's margin in 2014 YTD. Halcyon's distribution capabilities have been
further strengthened through its proposed acquisition of New Continent Enterprises, a
leading global dealer and distributor of natural rubber. Overall, we expect the volume
growth and acquisition synergies to drive an increase in net profit from US$9 mn in 2013
to US$50 mn in 2016.
Beneficiary of rising natural rubber demand
Halcyon is a beneficiary of rising demand for natural rubber, which is expected to grow
53% from 10.9 mn tonnes in 2011 to 16.7 mn tonnes in 2021, representing a CAGR of
4.4%. This is driven mainly by an expanding tyre market, which is the largest consumer of
natural rubber, accounting for about 70% of total demand. The tyre market has defensive
growth characteristics as the replacement market makes up for 70% of the total tyre
demand. Credit Suisse automotive team expects medium-term average tyre demand
growth of 3.8% per annum. This is driven mainly by replacement of passenger tyres,
particularly in China where we expect to grow by 7.3% in 2013-17E.
Valuation attractive
Halcyon currently trades at a 2015E P/E of 9.2x and 2016E P/E of 5.8x, a significant
discount to global tyre manufacturers and commodity traders despite its greater earnings
visibility. Our target price of S$1.20 is based on a 2016E P/E of 8.0x, in line with its peers.
On our estimates, it is trading at a 2016E P/B of 1.5x against expected ROE of 29.5%. In
our view, successful execution of its planned capacity growth would drive re-rating.
Key risks would include high net gearing post acquisition of 2.5x, which would be closer to
2.0x after adjusting for working capital loans. Other risks include dependence on raw
materials from several large suppliers and a large number of small suppliers. Also,
Halcyon's top five customers accounted for close to 90% historically. We expect its
customer base to be more diversified with the acquisition of New Continent Enterprises
(NCE), which allows the company to sell to a wider network of smaller, non-tyre
consumers in markets such as the EU and the USA.
01 September 2014
Halcyon Agri Corporation Ltd (HALC.SI / HACL SP) 4
Capacity expansion to drive earnings growth Acquisition of Anson Company for S$450 mn
In August 2014, Halcyon completed the acquisition of Anson Company, which is part of
the Lee Rubber Group. Anson owns and operates nine crumb rubber factories in
Indonesia with a total licensed export capacity of 408,000 metric tonnes per annum.
Amongst the nine factories, four are located in Palembang with an aggregate licensed
capacity of 275,000 metric tonnes per annum. Anson has a long operating history dating
back to 1932, when the first PT Hok Tong's rubber factory was opened in Palembang,
Indonesia.
Figure 7: Operating assets of Anson
Licensed export Anson effective Customer
Factory Location capacity interest Approvals
PT Hok Tong I Palembang Palembang, South Sumatra 65,000 99.99% 10
PT Hok Tong II Palembang Palembang, South Sumatra 100,000 99.99% 3
PT Remco Palembang Palembang, South Sumatra 50,000 75.00% 6
PT Sunan Rubber Palembang Palembang, South Sumatra 60,000 53.75% 9
PT Remco Jambi Jambi 36,000 75.00% 7
PT Hok Tong Jambi Jambi 25,000 99.99% 7
PT Hok Tong Pontianak Pontianak, West Kalimantan 28,000 99.99% 8
PT Rubber Hock Lie Sunggal Medan, North Sumatra 19,000 77.78% 4
PT Rubber Hock Lie Rantau Prapat Medan, North Sumatra 25,000 77.78% 6
Total 408,000
Source: Company data
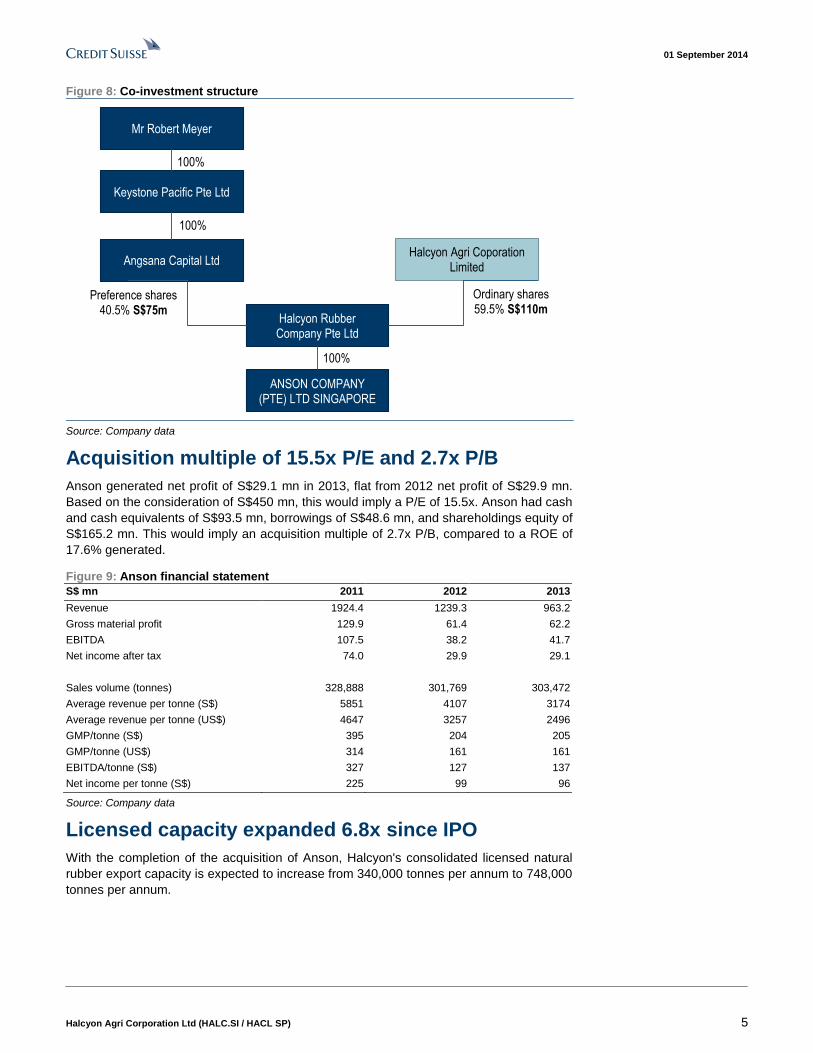
Acquisition to be funded through internal resources
and debt
Halcyon Rubber Company (HRC) acquired Anson Rubber for a total consideration of
S$450mn, which will be funded by proceeds from issuance of shares to Halcyon Agri and
Angsana Capital. HRC will have a total share capital of S$185mn, comprising the
following:
■ S$110 mn of ordinary shares by Halcyon Agri
■ S$75 mn of preference shares at the rate of 5% per annum issued to Angsana Capital,
which is wholly owned by CEO Rob Meyer. All preference shares may be purchased
in whole six months from the issuance date for cash or exchangeable into newly
issued ordinary shares of the company, with an exchange price the lower of S$1.20, or
volume weighted average price (VWAP) of Halcyon shares, five trading days
immediately prior to exchange.
The remaining S$265 mn (US$213 mn) will be financed through an acquisition loan
secured as part of a US$288 mn credit facility. In July 2014, Halcyon Agri issued S$125
mn 6.5% fixed rate note due 2019, as part of its S$300 mn MTN programme established in
April.
01 September 2014
Halcyon Agri Corporation Ltd (HALC.SI / HACL SP) 5
Figure 8: Co-investment structure
ANSON COMPANY (PTE) LTD SINGAPORE
Halcyon Rubber Company Pte Ltd
Halcyon Agri Coporation Limited
Angsana Capital Ltd
Keystone Pacific Pte Ltd
Mr Robert Meyer
100%
100%
100%
Preference shares40.5% S$75m
Ordinary shares59.5% S$110m
Source: Company data
Acquisition multiple of 15.5x P/E and 2.7x P/B
Anson generated net profit of S$29.1 mn in 2013, flat from 2012 net profit of S$29.9 mn.
Based on the consideration of S$450 mn, this would imply a P/E of 15.5x. Anson had cash
and cash equivalents of S$93.5 mn, borrowings of S$48.6 mn, and shareholdings equity of
S$165.2 mn. This would imply an acquisition multiple of 2.7x P/B, compared to a ROE of
17.6% generated.
Figure 9: Anson financial statement
S$ mn 2011 2012 2013
Revenue 1924.4 1239.3 963.2
Gross material profit 129.9 61.4 62.2
EBITDA 107.5 38.2 41.7
Net income after tax 74.0 29.9 29.1
Sales volume (tonnes) 328,888 301,769 303,472
Average revenue per tonne (S$) 5851 4107 3174
Average revenue per tonne (US$) 4647 3257 2496
GMP/tonne (S$) 395 204 205
GMP/tonne (US$) 314 161 161
EBITDA/tonne (S$) 327 127 137
Net income per tonne (S$) 225 99 96
Source: Company data
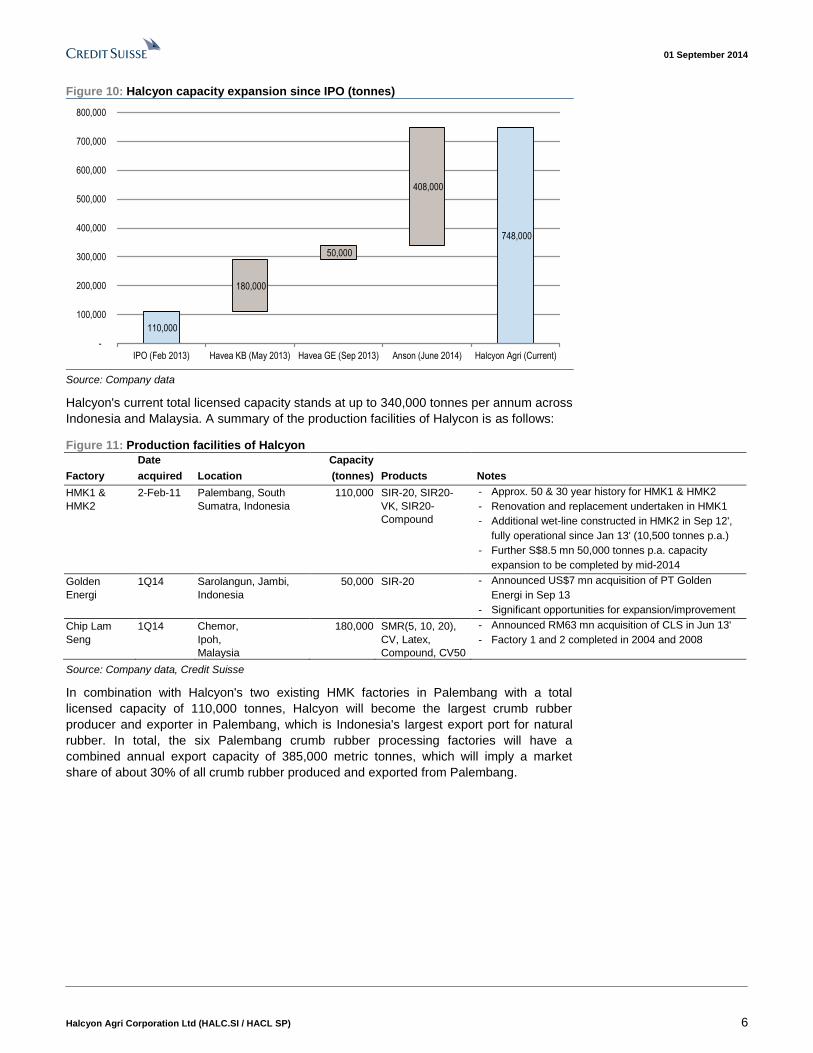
Licensed capacity expanded 6.8x since IPO
With the completion of the acquisition of Anson, Halcyon's consolidated licensed natural
rubber export capacity is expected to increase from 340,000 tonnes per annum to 748,000
tonnes per annum.
01 September 2014
Halcyon Agri Corporation Ltd (HALC.SI / HACL SP) 6
Figure 10: Halcyon capacity expansion since IPO (tonnes)
110,000
748,000
180,000
50,000
408,000
-
100,000
200,000
300,000
400,000
500,000
600,000
700,000
800,000
IPO (Feb 2013) Havea KB (May 2013) Havea GE (Sep 2013) Anson (June 2014) Halcyon Agri (Current)
Source: Company data
Halcyon's current total licensed capacity stands at up to 340,000 tonnes per annum across
Indonesia and Malaysia. A summary of the production facilities of Halycon is as follows:
Figure 11: Production facilities of Halcyon
Date Capacity
Factory acquired Location (tonnes) Products Notes
HMK1 &
HMK2
2-Feb-11 Palembang, South
Sumatra, Indonesia
110,000 SIR-20, SIR20-
VK, SIR20-
Compound
- Approx. 50 & 30 year history for HMK1 & HMK2
- Renovation and replacement undertaken in HMK1
- Additional wet-line constructed in HMK2 in Sep 12',
fully operational since Jan 13' (10,500 tonnes p.a.)
- Further S$8.5 mn 50,000 tonnes p.a. capacity
expansion to be completed by mid-2014
Golden
Energi
1Q14 Sarolangun, Jambi,
Indonesia
50,000 SIR-20 - Announced US$7 mn acquisition of PT Golden
Energi in Sep 13
- Significant opportunities for expansion/improvement
Chip Lam
Seng
1Q14 Chemor,
Ipoh,
Malaysia
180,000 SMR(5, 10, 20),
CV, Latex,
Compound, CV50
- Announced RM63 mn acquisition of CLS in Jun 13'
- Factory 1 and 2 completed in 2004 and 2008
Source: Company data, Credit Suisse
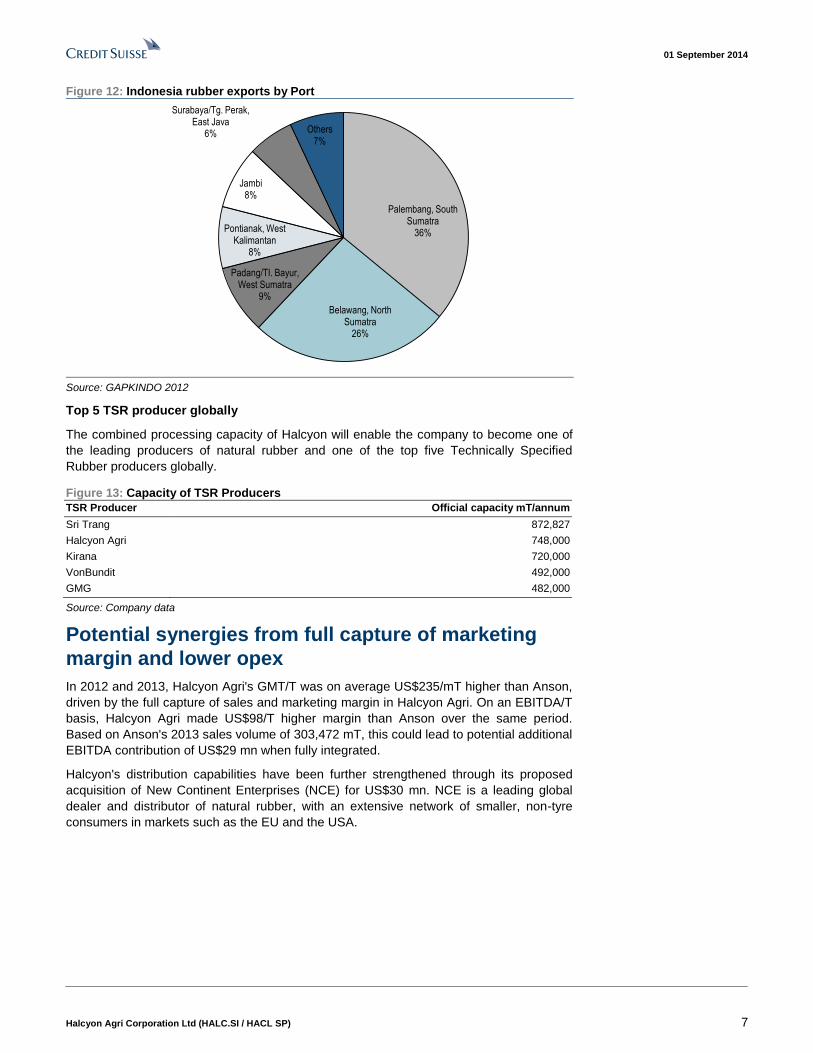
In combination with Halcyon's two existing HMK factories in Palembang with a total
licensed capacity of 110,000 tonnes, Halcyon will become the largest crumb rubber
producer and exporter in Palembang, which is Indonesia's largest export port for natural
rubber. In total, the six Palembang crumb rubber processing factories will have a
combined annual export capacity of 385,000 metric tonnes, which will imply a market
share of about 30% of all crumb rubber produced and exported from Palembang.
01 September 2014
Halcyon Agri Corporation Ltd (HALC.SI / HACL SP) 7
Figure 12: Indonesia rubber exports by Port
Palembang, South Sumatra
36%
Belawang, North Sumatra
26%
Padang/TI. Bayur, West Sumatra
9%
Pontianak, West Kalimantan
8%
Jambi8%
Surabaya/Tg. Perak, East Java
6% Others7%
Source: GAPKINDO 2012
Top 5 TSR producer globally
The combined processing capacity of Halcyon will enable the company to become one of
the leading producers of natural rubber and one of the top five Technically Specified
Rubber producers globally.
Figure 13: Capacity of TSR Producers
TSR Producer Official capacity mT/annum
Sri Trang 872,827
Halcyon Agri 748,000
Kirana 720,000
VonBundit 492,000
GMG 482,000
Source: Company data
Potential synergies from full capture of marketing
margin and lower opex
In 2012 and 2013, Halcyon Agri's GMT/T was on average US$235/mT higher than Anson,
driven by the full capture of sales and marketing margin in Halcyon Agri. On an EBITDA/T
basis, Halcyon Agri made US$98/T higher margin than Anson over the same period.
Based on Anson's 2013 sales volume of 303,472 mT, this could lead to potential additional
EBITDA contribution of US$29 mn when fully integrated.
Halcyon's distribution capabilities have been further strengthened through its proposed
acquisition of New Continent Enterprises (NCE) for US$30 mn. NCE is a leading global
dealer and distributor of natural rubber, with an extensive network of smaller, non-tyre
consumers in markets such as the EU and the USA.

01 September 2014
Halcyon Agri Corporation Ltd (HALC.SI / HACL SP) 8
Figure 14: Comparative GMP/T (US$) Figure 15: Comparative EBITDA/T (US$)
412
379
161 161
0
50
100
150
200
250
300
350
400
450
2012 2013
Halcyon Anson
225
180
101108
0
50
100
150
200
250
2012 2013
Halcyon Anson
Source: Company data, Credit Suisse estimates Source: Company data, Credit Suisse estimates
Due to economies of scale from its larger processing capacity, Anson's operating
expenses were on average US$136/mT lower than Halcyon Agri in 2012-13. Should
Halcyon Agri be able to lower operating cost to be in line with Anson, this could lead to an
additional EBITDA contribution of US$10 mn based on Halcyon's 2013 sales volume of
79,108 mT.
Figure 16: Comparative opex/MT
187199
6053
0
50
100
150
200
250
2012 2013
Halcyon Anson
Source: Company data, Credit Suisse
01 September 2014
Halcyon Agri Corporation Ltd (HALC.SI / HACL SP) 9
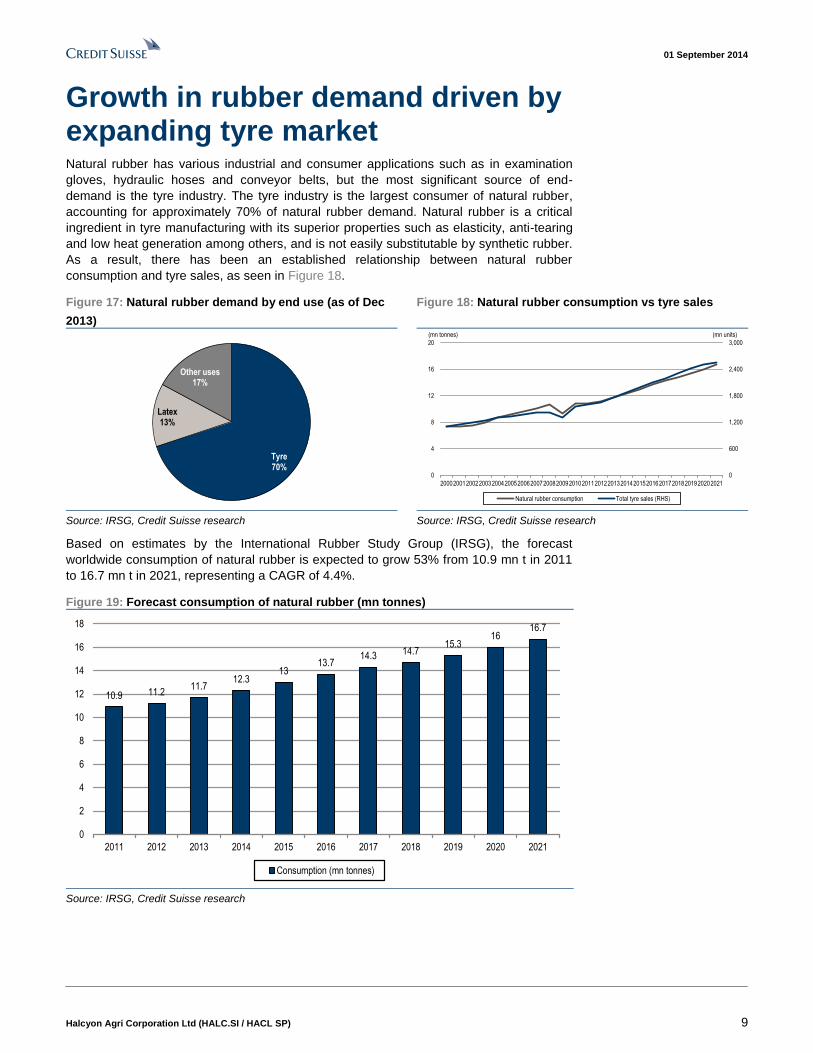
Growth in rubber demand driven by expanding tyre market Natural rubber has various industrial and consumer applications such as in examination
gloves, hydraulic hoses and conveyor belts, but the most significant source of end-
demand is the tyre industry. The tyre industry is the largest consumer of natural rubber,
accounting for approximately 70% of natural rubber demand. Natural rubber is a critical
ingredient in tyre manufacturing with its superior properties such as elasticity, anti-tearing
and low heat generation among others, and is not easily substitutable by synthetic rubber.
As a result, there has been an established relationship between natural rubber
consumption and tyre sales, as seen in Figure 18.
Figure 17: Natural rubber demand by end use (as of Dec
2013)
Figure 18: Natural rubber consumption vs tyre sales
Tyre70%
Latex13%
Other uses17%
0
600
1,200
1,800
2,400
3,000
0
4
8
12
16
20
2000200120022003200420052006200720082009201020112012201320142015201620172018201920202021
(mn units)(mn tonnes)
Natural rubber consumption Total tyre sales (RHS)
Source: IRSG, Credit Suisse research Source: IRSG, Credit Suisse research
Based on estimates by the International Rubber Study Group (IRSG), the forecast
worldwide consumption of natural rubber is expected to grow 53% from 10.9 mn t in 2011
to 16.7 mn t in 2021, representing a CAGR of 4.4%.
Figure 19: Forecast consumption of natural rubber (mn tonnes)
10.9 11.211.7
12.313
13.714.3 14.7
15.316
16.7
0
2
4
6
8
10
12
14
16
18
2011 2012 2013 2014 2015 2016 2017 2018 2019 2020 2021
Consumption (mn tonnes)
Source: IRSG, Credit Suisse research
01 September 2014
Halcyon Agri Corporation Ltd (HALC.SI / HACL SP) 10
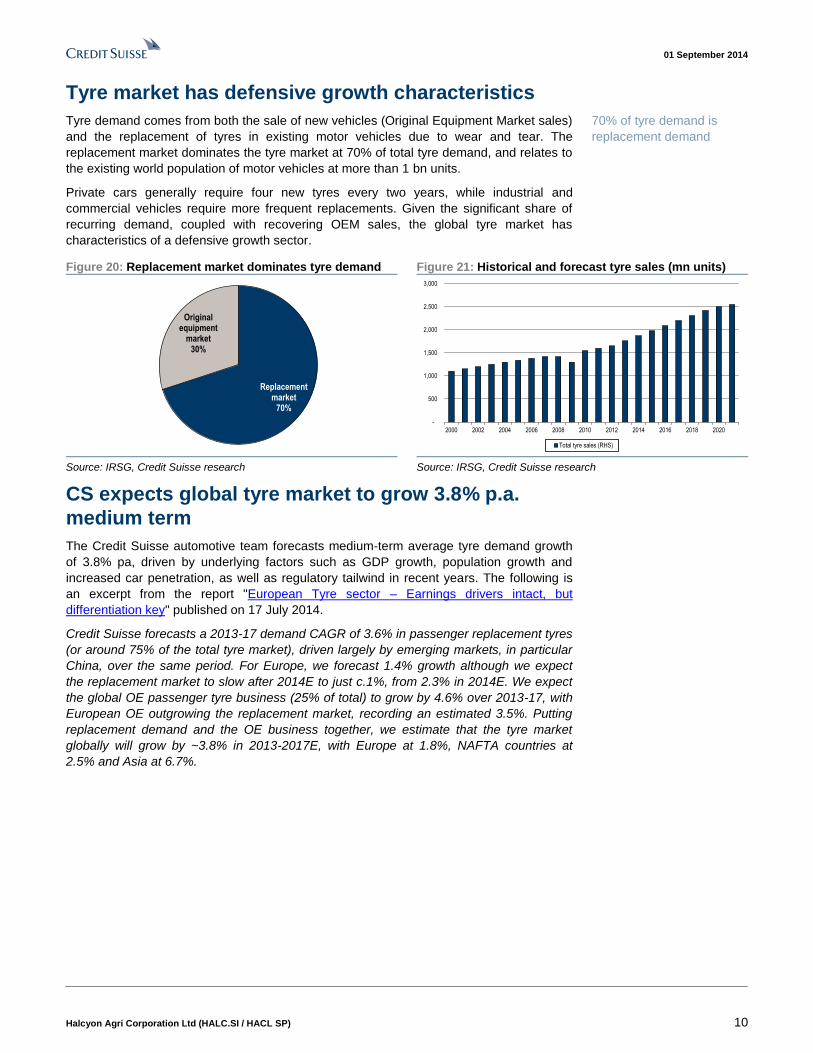
Tyre market has defensive growth characteristics
Tyre demand comes from both the sale of new vehicles (Original Equipment Market sales)
and the replacement of tyres in existing motor vehicles due to wear and tear. The
replacement market dominates the tyre market at 70% of total tyre demand, and relates to
the existing world population of motor vehicles at more than 1 bn units.
Private cars generally require four new tyres every two years, while industrial and
commercial vehicles require more frequent replacements. Given the significant share of
recurring demand, coupled with recovering OEM sales, the global tyre market has
characteristics of a defensive growth sector.
Figure 20: Replacement market dominates tyre demand Figure 21: Historical and forecast tyre sales (mn units)
Replacement market
70%
Original equipment
market30%
-
500
1,000
1,500
2,000
2,500
3,000
2000 2002 2004 2006 2008 2010 2012 2014 2016 2018 2020
Total tyre sales (RHS)
Source: IRSG, Credit Suisse research Source: IRSG, Credit Suisse research
CS expects global tyre market to grow 3.8% p.a.
medium term
The Credit Suisse automotive team forecasts medium-term average tyre demand growth
of 3.8% pa, driven by underlying factors such as GDP growth, population growth and
increased car penetration, as well as regulatory tailwind in recent years. The following is
an excerpt from the report "European Tyre sector – Earnings drivers intact, but
differentiation key" published on 17 July 2014.
Credit Suisse forecasts a 2013-17 demand CAGR of 3.6% in passenger replacement tyres
(or around 75% of the total tyre market), driven largely by emerging markets, in particular
China, over the same period. For Europe, we forecast 1.4% growth although we expect
the replacement market to slow after 2014E to just c.1%, from 2.3% in 2014E. We expect
the global OE passenger tyre business (25% of total) to grow by 4.6% over 2013-17, with
European OE outgrowing the replacement market, recording an estimated 3.5%. Putting
replacement demand and the OE business together, we estimate that the tyre market
globally will grow by ~3.8% in 2013-2017E, with Europe at 1.8%, NAFTA countries at
2.5% and Asia at 6.7%.
70% of tyre demand is
replacement demand
01 September 2014
Halcyon Agri Corporation Ltd (HALC.SI / HACL SP) 11
Figure 22: Replacement market (passenger and light
trucks) expected to grow c.3.6% (2013-17e) mn units
Figure 23: OE market (passenger and light trucks)
expected to grow at 4.6% mn units
0
200
400
600
800
1000
1200
1400
Other markets
Asia
South America
NAFTA
Europe
0
50
100
150
200
250
300
350
400
450
Other markets
Asia
South America
NAFTA
Europe
Source: Company data, Credit Suisse estimates Source: Company data, Credit Suisse estimates
Figure 24: Replacement market (passenger and light
trucks)—growth rates
Figure 25: OE market (passenger and light trucks)—
growth rates
17.0%
18.0%
19.0%
20.0%
21.0%
22.0%
23.0%
0.0%
1.0%
2.0%
3.0%
4.0%
5.0%
6.0%
7.0%
8.0%
9.0%
10.0%
2013 2014E 2015E 2016E 2017E 2018E
Premium growth Non - premium growth Share premium (rhs)
29%
30%
31%
32%
33%
34%
35%
0.0%
1.0%
2.0%
3.0%
4.0%
5.0%
6.0%
7.0%
8.0%
2013 2014E 2015E 2016E 2017E 2018E
Premium growth Non - premium growth Share premium (rhs)
Source: Company data, Credit Suisse estimates Source: Company data, Credit Suisse estimates
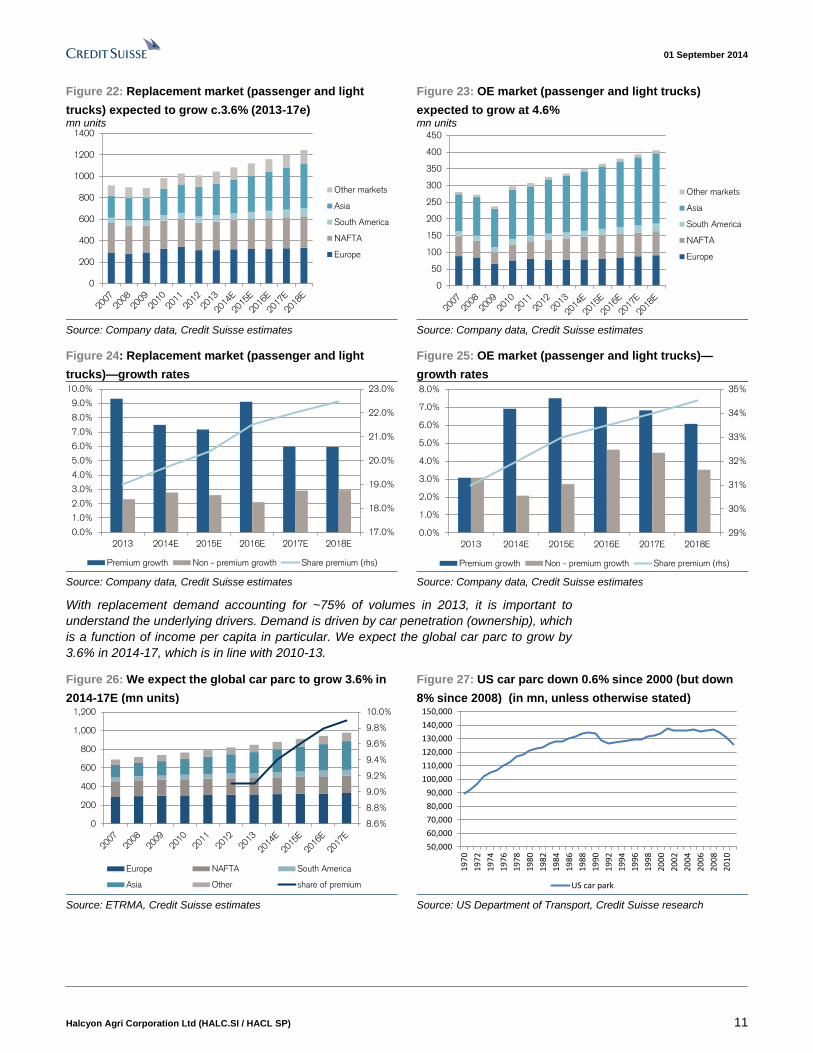
With replacement demand accounting for ~75% of volumes in 2013, it is important to
understand the underlying drivers. Demand is driven by car penetration (ownership), which
is a function of income per capita in particular. We expect the global car parc to grow by
3.6% in 2014-17, which is in line with 2010-13.
Figure 26: We expect the global car parc to grow 3.6% in
2014-17E (mn units)
Figure 27: US car parc down 0.6% since 2000 (but down
8% since 2008) (in mn, unless otherwise stated)
8.6%
8.8%
9.0%
9.2%
9.4%
9.6%
9.8%
10.0%
0
200
400
600
800
1,000
1,200
Europe NAFTA South America
Asia Other share of premium
50,000
60,000
70,000
80,000
90,000
100,000
110,000
120,000
130,000
140,000
150,000
19
70
19
72
19
74
19
76
19
78
19
80
19
82
19
84
19
86
19
88
19
90
19
92
19
94
19
96
19
98
20
00
20
02
20
04
20
06
20
08
20
10
US car park
Source: ETRMA, Credit Suisse estimates Source: US Department of Transport, Credit Suisse research
01 September 2014
Halcyon Agri Corporation Ltd (HALC.SI / HACL SP) 12
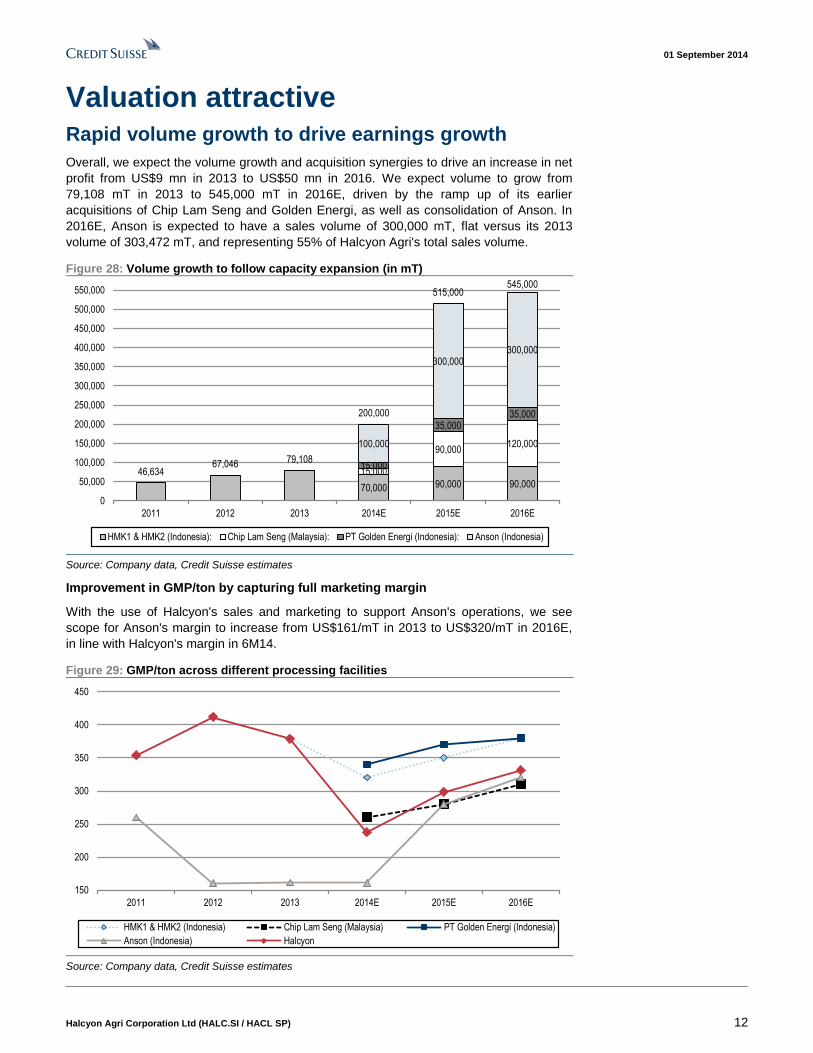
Valuation attractive Rapid volume growth to drive earnings growth
Overall, we expect the volume growth and acquisition synergies to drive an increase in net
profit from US$9 mn in 2013 to US$50 mn in 2016. We expect volume to grow from
79,108 mT in 2013 to 545,000 mT in 2016E, driven by the ramp up of its earlier
acquisitions of Chip Lam Seng and Golden Energi, as well as consolidation of Anson. In
2016E, Anson is expected to have a sales volume of 300,000 mT, flat versus its 2013
volume of 303,472 mT, and representing 55% of Halcyon Agri's total sales volume.
Figure 28: Volume growth to follow capacity expansion (in mT)
70,000 90,000 90,000
15,000
90,000120,000
15,000
35,00035,000
100,000
300,000300,000
46,63467,046 79,108
200,000
515,000545,000
0
50,000
100,000
150,000
200,000
250,000
300,000
350,000
400,000
450,000
500,000
550,000
2011 2012 2013 2014E 2015E 2016E
HMK1 & HMK2 (Indonesia): Chip Lam Seng (Malaysia): PT Golden Energi (Indonesia): Anson (Indonesia)
Source: Company data, Credit Suisse estimates
Improvement in GMP/ton by capturing full marketing margin
With the use of Halcyon's sales and marketing to support Anson's operations, we see
scope for Anson's margin to increase from US$161/mT in 2013 to US$320/mT in 2016E,
in line with Halcyon's margin in 6M14.
Figure 29: GMP/ton across different processing facilities
150
200
250
300
350
400
450
2011 2012 2013 2014E 2015E 2016E
HMK1 & HMK2 (Indonesia) Chip Lam Seng (Malaysia) PT Golden Energi (Indonesia)
Anson (Indonesia) Halcyon
Source: Company data, Credit Suisse estimates
01 September 2014
Halcyon Agri Corporation Ltd (HALC.SI / HACL SP) 13
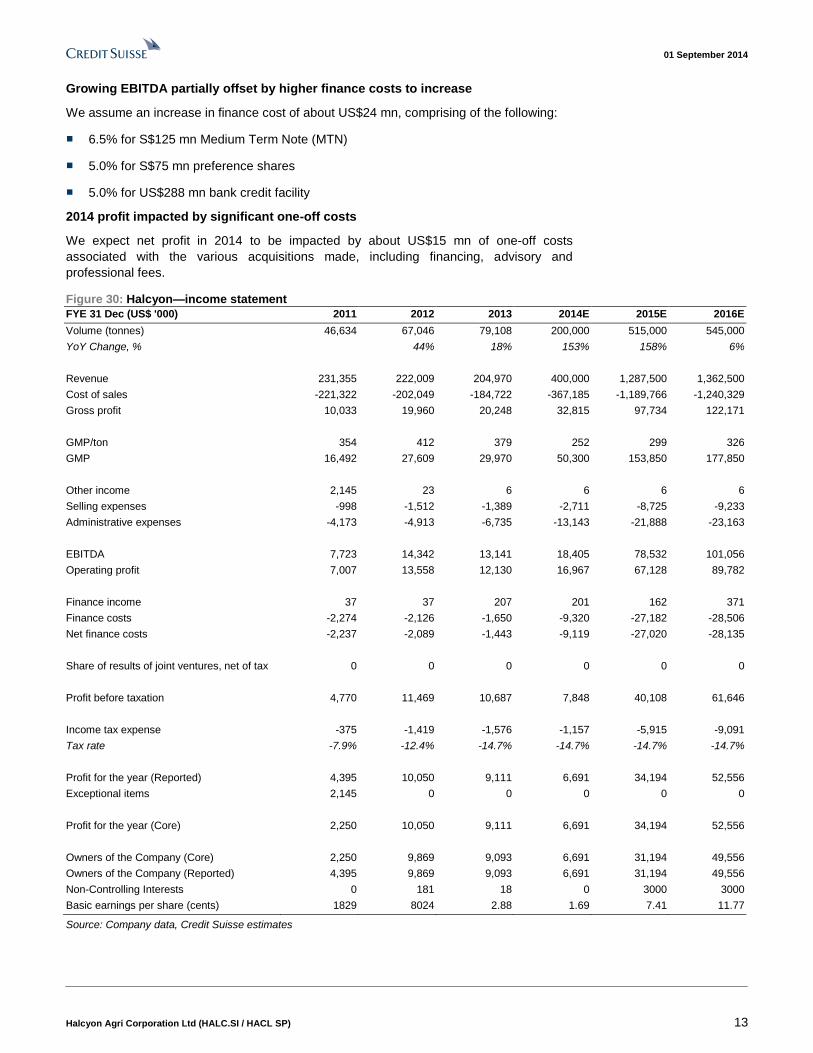
Growing EBITDA partially offset by higher finance costs to increase
We assume an increase in finance cost of about US$24 mn, comprising of the following:
■ 6.5% for S$125 mn Medium Term Note (MTN)
■ 5.0% for S$75 mn preference shares
■ 5.0% for US$288 mn bank credit facility
2014 profit impacted by significant one-off costs
We expect net profit in 2014 to be impacted by about US$15 mn of one-off costs
associated with the various acquisitions made, including financing, advisory and
professional fees.
Figure 30: Halcyon—income statement
FYE 31 Dec (US$ '000) 2011 2012 2013 2014E 2015E 2016E
Volume (tonnes) 46,634 67,046 79,108 200,000 515,000 545,000
YoY Change, % 44% 18% 153% 158% 6%
Revenue 231,355 222,009 204,970 400,000 1,287,500 1,362,500
Cost of sales -221,322 -202,049 -184,722 -367,185 -1,189,766 -1,240,329
Gross profit 10,033 19,960 20,248 32,815 97,734 122,171
GMP/ton 354 412 379 252 299 326
GMP 16,492 27,609 29,970 50,300 153,850 177,850
Other income 2,145 23 6 6 6 6
Selling expenses -998 -1,512 -1,389 -2,711 -8,725 -9,233
Administrative expenses -4,173 -4,913 -6,735 -13,143 -21,888 -23,163
EBITDA 7,723 14,342 13,141 18,405 78,532 101,056
Operating profit 7,007 13,558 12,130 16,967 67,128 89,782
Finance income 37 37 207 201 162 371
Finance costs -2,274 -2,126 -1,650 -9,320 -27,182 -28,506
Net finance costs -2,237 -2,089 -1,443 -9,119 -27,020 -28,135
Share of results of joint ventures, net of tax 0 0 0 0 0 0
Profit before taxation 4,770 11,469 10,687 7,848 40,108 61,646
Income tax expense -375 -1,419 -1,576 -1,157 -5,915 -9,091
Tax rate -7.9% -12.4% -14.7% -14.7% -14.7% -14.7%
Profit for the year (Reported) 4,395 10,050 9,111 6,691 34,194 52,556
Exceptional items 2,145 0 0 0 0 0
Profit for the year (Core) 2,250 10,050 9,111 6,691 34,194 52,556
Owners of the Company (Core) 2,250 9,869 9,093 6,691 31,194 49,556
Owners of the Company (Reported) 4,395 9,869 9,093 6,691 31,194 49,556
Non-Controlling Interests 0 181 18 0 3000 3000
Basic earnings per share (cents) 1829 8024 2.88 1.69 7.41 11.77
Source: Company data, Credit Suisse estimates

01 September 2014
Halcyon Agri Corporation Ltd (HALC.SI / HACL SP) 14
Figure 31: Halcyon—balance sheet
FYE 31 Dec (US$ '000) 2011 2012 2013 2014 2015 2016
Non-current assets 22,260 21,280 27,912 402,774 401,370 400,096
Other assets - - 2,054 64,294 64,294 64,294
Intangible assets 10,000 10,000 10,000 214,960 214,960 214,960
Property, plant and equipment 11,963 10,922 15,537 123,199 121,795 120,521
Investment in subsidiaries - - - 0 0 0
Deferred charges 251 202 124 124 124 124
Deferred tax assets 46 156 197 197 197 197
Current assets 34,826 40,829 79,896 228,333 289,401 368,523
Cash and bank balances 8,406 11,866 52,688 154,856 131,186 195,934
Trade receivables 10,611 6,816 7,347 19,726 63,493 67,192
Other receivables 1,512 1,131 2,549 2,549 2,549 2,549
Derivative financial instruments 3,067 718 903 903 903 903
Inventories 11,230 20,298 16,409 50,299 91,270 101,945
Total assets 57,086 62,109 107,808 631,107 690,771 768,619
Current liabilities 31,167 34,723 26,107 302,588 331,374 359,981
Derivative financial instruments 1,282 977 789 789 789 789
Trade payables 33 1,626 0 0 0 0
Other payables 7,318 3,028 2,823 5,570 18,047 18,814
Loan payables 22,329 28,110 21,143 294,878 311,186 339,026
Provision for taxation 205 982 1,352 1,352 1,352 1,352
Non-current liabilities 8,897 1,116 1,429 151,429 151,429 151,429
Loan payables 8,500 - - 150,000 150,000 150,000
Retirement benefit obligations 222 529 648 648 648 648
Deferred tax liabilities 175 587 781 781 781 781
Total liabilities 40,064 35,839 27,536 454,017 482,803 511,410
Equity attributable to owners of the Company 17,022 26,089 80,110 116,927 144,806 191,047
Share capital 12,500 12,500 63,713 96,958 96,958 96,958
Capital reserves 143 143 143 143 143 143
Accumulated profits (losses) 4,503 14,372 21,195 24,767 52,646 98,887
Foreign currency translation reserve -124 -926 -4,941 -4,941 -4,941 -4,941
Non-controlling interests - 181 162 60,162 63,162 66,162
Total equity 17,022 26,270 80,272 177,089 207,968 257,209
Source: Company data, Credit Suisse estimates
01 September 2014
Halcyon Agri Corporation Ltd (HALC.SI / HACL SP) 15
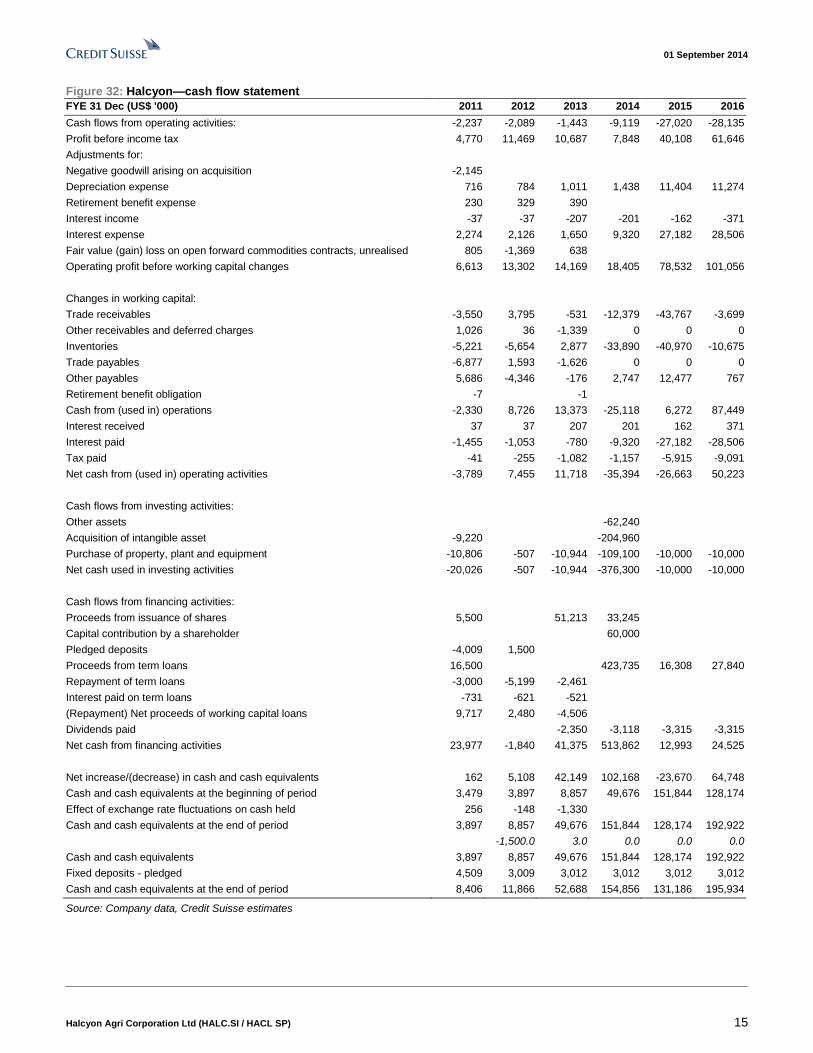
Figure 32: Halcyon—cash flow statement
FYE 31 Dec (US$ '000) 2011 2012 2013 2014 2015 2016
Cash flows from operating activities: -2,237 -2,089 -1,443 -9,119 -27,020 -28,135
Profit before income tax 4,770 11,469 10,687 7,848 40,108 61,646
Adjustments for:
Negative goodwill arising on acquisition -2,145
Depreciation expense 716 784 1,011 1,438 11,404 11,274
Retirement benefit expense 230 329 390
Interest income -37 -37 -207 -201 -162 -371
Interest expense 2,274 2,126 1,650 9,320 27,182 28,506
Fair value (gain) loss on open forward commodities contracts, unrealised 805 -1,369 638
Operating profit before working capital changes 6,613 13,302 14,169 18,405 78,532 101,056
Changes in working capital:
Trade receivables -3,550 3,795 -531 -12,379 -43,767 -3,699
Other receivables and deferred charges 1,026 36 -1,339 0 0 0
Inventories -5,221 -5,654 2,877 -33,890 -40,970 -10,675
Trade payables -6,877 1,593 -1,626 0 0 0
Other payables 5,686 -4,346 -176 2,747 12,477 767
Retirement benefit obligation -7 -1
Cash from (used in) operations -2,330 8,726 13,373 -25,118 6,272 87,449
Interest received 37 37 207 201 162 371
Interest paid -1,455 -1,053 -780 -9,320 -27,182 -28,506
Tax paid -41 -255 -1,082 -1,157 -5,915 -9,091
Net cash from (used in) operating activities -3,789 7,455 11,718 -35,394 -26,663 50,223
Cash flows from investing activities:
Other assets -62,240
Acquisition of intangible asset -9,220 -204,960
Purchase of property, plant and equipment -10,806 -507 -10,944 -109,100 -10,000 -10,000
Net cash used in investing activities -20,026 -507 -10,944 -376,300 -10,000 -10,000
Cash flows from financing activities:
Proceeds from issuance of shares 5,500 51,213 33,245
Capital contribution by a shareholder 60,000
Pledged deposits -4,009 1,500
Proceeds from term loans 16,500 423,735 16,308 27,840
Repayment of term loans -3,000 -5,199 -2,461
Interest paid on term loans -731 -621 -521
(Repayment) Net proceeds of working capital loans 9,717 2,480 -4,506
Dividends paid -2,350 -3,118 -3,315 -3,315
Net cash from financing activities 23,977 -1,840 41,375 513,862 12,993 24,525
Net increase/(decrease) in cash and cash equivalents 162 5,108 42,149 102,168 -23,670 64,748
Cash and cash equivalents at the beginning of period 3,479 3,897 8,857 49,676 151,844 128,174
Effect of exchange rate fluctuations on cash held 256 -148 -1,330
Cash and cash equivalents at the end of period 3,897 8,857 49,676 151,844 128,174 192,922
-1,500.0 3.0 0.0 0.0 0.0
Cash and cash equivalents 3,897 8,857 49,676 151,844 128,174 192,922
Fixed deposits - pledged 4,509 3,009 3,012 3,012 3,012 3,012
Cash and cash equivalents at the end of period 8,406 11,866 52,688 154,856 131,186 195,934
Source: Company data, Credit Suisse estimates
01 September 2014
Halcyon Agri Corporation Ltd (HALC.SI / HACL SP) 16
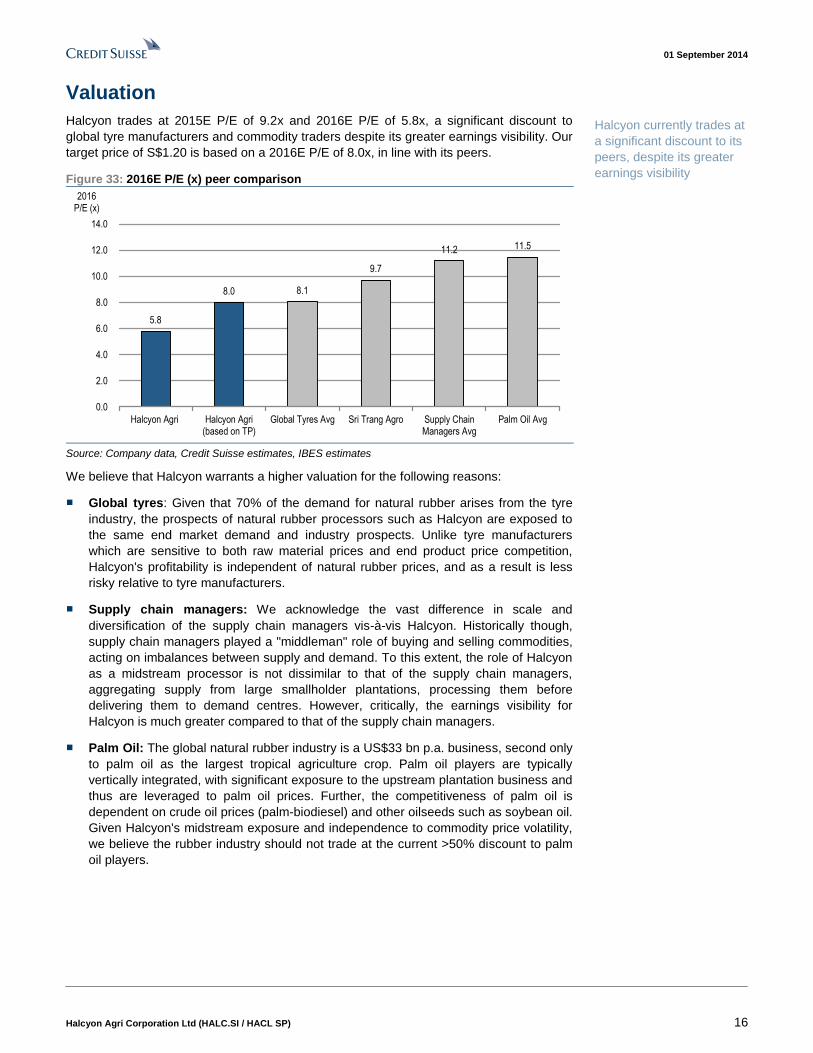
Valuation
Halcyon trades at 2015E P/E of 9.2x and 2016E P/E of 5.8x, a significant discount to
global tyre manufacturers and commodity traders despite its greater earnings visibility. Our
target price of S$1.20 is based on a 2016E P/E of 8.0x, in line with its peers.
Figure 33: 2016E P/E (x) peer comparison
5.8
8.0 8.1
9.7
11.2 11.5
0.0
2.0
4.0
6.0
8.0
10.0
12.0
14.0
Halcyon Agri Halcyon Agri(based on TP)
Global Tyres Avg Sri Trang Agro Supply ChainManagers Avg
Palm Oil Avg
2016 P/E (x)
Source: Company data, Credit Suisse estimates, IBES estimates
We believe that Halcyon warrants a higher valuation for the following reasons:
■ Global tyres: Given that 70% of the demand for natural rubber arises from the tyre
industry, the prospects of natural rubber processors such as Halcyon are exposed to
the same end market demand and industry prospects. Unlike tyre manufacturers
which are sensitive to both raw material prices and end product price competition,
Halcyon's profitability is independent of natural rubber prices, and as a result is less
risky relative to tyre manufacturers.
■ Supply chain managers: We acknowledge the vast difference in scale and
diversification of the supply chain managers vis-à-vis Halcyon. Historically though,
supply chain managers played a "middleman" role of buying and selling commodities,
acting on imbalances between supply and demand. To this extent, the role of Halcyon
as a midstream processor is not dissimilar to that of the supply chain managers,
aggregating supply from large smallholder plantations, processing them before
delivering them to demand centres. However, critically, the earnings visibility for
Halcyon is much greater compared to that of the supply chain managers.
■ Palm Oil: The global natural rubber industry is a US$33 bn p.a. business, second only
to palm oil as the largest tropical agriculture crop. Palm oil players are typically
vertically integrated, with significant exposure to the upstream plantation business and
thus are leveraged to palm oil prices. Further, the competitiveness of palm oil is
dependent on crude oil prices (palm-biodiesel) and other oilseeds such as soybean oil.
Given Halcyon's midstream exposure and independence to commodity price volatility,
we believe the rubber industry should not trade at the current >50% discount to palm
oil players.
Halcyon currently trades at
a significant discount to its
peers, despite its greater
earnings visibility
01 September 2014
Halcyon Agri Corporation Ltd (HALC.SI / HACL SP) 17
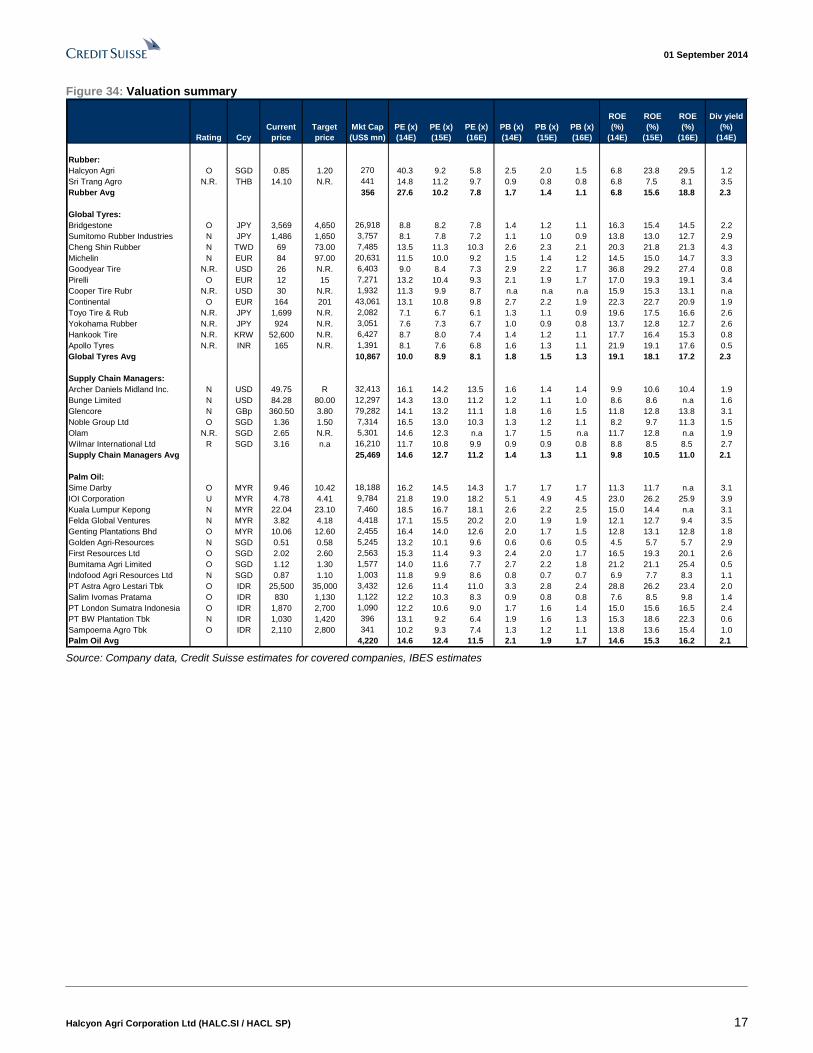
Figure 34: Valuation summary
Rating Ccy
Current
price
Target
price
Mkt Cap
(US$ mn)
PE (x)
(14E)
PE (x)
(15E)
PE (x)
(16E)
PB (x)
(14E)
PB (x)
(15E)
PB (x)
(16E)
ROE
(%)
(14E)
ROE
(%)
(15E)
ROE
(%)
(16E)
Div yield
(%)
(14E)
Rubber:
Halcyon Agri O SGD 0.85 1.20 270 40.3 9.2 5.8 2.5 2.0 1.5 6.8 23.8 29.5 1.2
Sri Trang Agro N.R. THB 14.10 N.R. 441 14.8 11.2 9.7 0.9 0.8 0.8 6.8 7.5 8.1 3.5
Rubber Avg 356 27.6 10.2 7.8 1.7 1.4 1.1 6.8 15.6 18.8 2.3
Global Tyres:
Bridgestone O JPY 3,569 4,650 26,918 8.8 8.2 7.8 1.4 1.2 1.1 16.3 15.4 14.5 2.2
Sumitomo Rubber Industries N JPY 1,486 1,650 3,757 8.1 7.8 7.2 1.1 1.0 0.9 13.8 13.0 12.7 2.9
Cheng Shin Rubber N TWD 69 73.00 7,485 13.5 11.3 10.3 2.6 2.3 2.1 20.3 21.8 21.3 4.3
Michelin N EUR 84 97.00 20,631 11.5 10.0 9.2 1.5 1.4 1.2 14.5 15.0 14.7 3.3
Goodyear Tire N.R. USD 26 N.R. 6,403 9.0 8.4 7.3 2.9 2.2 1.7 36.8 29.2 27.4 0.8
Pirelli O EUR 12 15 7,271 13.2 10.4 9.3 2.1 1.9 1.7 17.0 19.3 19.1 3.4
Cooper Tire Rubr N.R. USD 30 N.R. 1,932 11.3 9.9 8.7 n.a n.a n.a 15.9 15.3 13.1 n.a
Continental O EUR 164 201 43,061 13.1 10.8 9.8 2.7 2.2 1.9 22.3 22.7 20.9 1.9
Toyo Tire & Rub N.R. JPY 1,699 N.R. 2,082 7.1 6.7 6.1 1.3 1.1 0.9 19.6 17.5 16.6 2.6
Yokohama Rubber N.R. JPY 924 N.R. 3,051 7.6 7.3 6.7 1.0 0.9 0.8 13.7 12.8 12.7 2.6
Hankook Tire N.R. KRW 52,600 N.R. 6,427 8.7 8.0 7.4 1.4 1.2 1.1 17.7 16.4 15.3 0.8
Apollo Tyres N.R. INR 165 N.R. 1,391 8.1 7.6 6.8 1.6 1.3 1.1 21.9 19.1 17.6 0.5
Global Tyres Avg 10,867 10.0 8.9 8.1 1.8 1.5 1.3 19.1 18.1 17.2 2.3
Supply Chain Managers:
Archer Daniels Midland Inc. N USD 49.75 R 32,413 16.1 14.2 13.5 1.6 1.4 1.4 9.9 10.6 10.4 1.9
Bunge Limited N USD 84.28 80.00 12,297 14.3 13.0 11.2 1.2 1.1 1.0 8.6 8.6 n.a 1.6
Glencore N GBp 360.50 3.80 79,282 14.1 13.2 11.1 1.8 1.6 1.5 11.8 12.8 13.8 3.1
Noble Group Ltd O SGD 1.36 1.50 7,314 16.5 13.0 10.3 1.3 1.2 1.1 8.2 9.7 11.3 1.5
Olam N.R. SGD 2.65 N.R. 5,301 14.6 12.3 n.a 1.7 1.5 n.a 11.7 12.8 n.a 1.9
Wilmar International Ltd R SGD 3.16 n.a 16,210 11.7 10.8 9.9 0.9 0.9 0.8 8.8 8.5 8.5 2.7
Supply Chain Managers Avg 25,469 14.6 12.7 11.2 1.4 1.3 1.1 9.8 10.5 11.0 2.1
Palm Oil:
Sime Darby O MYR 9.46 10.42 18,188 16.2 14.5 14.3 1.7 1.7 1.7 11.3 11.7 n.a 3.1
IOI Corporation U MYR 4.78 4.41 9,784 21.8 19.0 18.2 5.1 4.9 4.5 23.0 26.2 25.9 3.9
Kuala Lumpur Kepong N MYR 22.04 23.10 7,460 18.5 16.7 18.1 2.6 2.2 2.5 15.0 14.4 n.a 3.1
Felda Global Ventures N MYR 3.82 4.18 4,418 17.1 15.5 20.2 2.0 1.9 1.9 12.1 12.7 9.4 3.5
Genting Plantations Bhd O MYR 10.06 12.60 2,455 16.4 14.0 12.6 2.0 1.7 1.5 12.8 13.1 12.8 1.8
Golden Agri-Resources N SGD 0.51 0.58 5,245 13.2 10.1 9.6 0.6 0.6 0.5 4.5 5.7 5.7 2.9
First Resources Ltd O SGD 2.02 2.60 2,563 15.3 11.4 9.3 2.4 2.0 1.7 16.5 19.3 20.1 2.6
Bumitama Agri Limited O SGD 1.12 1.30 1,577 14.0 11.6 7.7 2.7 2.2 1.8 21.2 21.1 25.4 0.5
Indofood Agri Resources Ltd N SGD 0.87 1.10 1,003 11.8 9.9 8.6 0.8 0.7 0.7 6.9 7.7 8.3 1.1
PT Astra Agro Lestari Tbk O IDR 25,500 35,000 3,432 12.6 11.4 11.0 3.3 2.8 2.4 28.8 26.2 23.4 2.0
Salim Ivomas Pratama O IDR 830 1,130 1,122 12.2 10.3 8.3 0.9 0.8 0.8 7.6 8.5 9.8 1.4
PT London Sumatra Indonesia O IDR 1,870 2,700 1,090 12.2 10.6 9.0 1.7 1.6 1.4 15.0 15.6 16.5 2.4
PT BW Plantation Tbk N IDR 1,030 1,420 396 13.1 9.2 6.4 1.9 1.6 1.3 15.3 18.6 22.3 0.6
Sampoerna Agro Tbk O IDR 2,110 2,800 341 10.2 9.3 7.4 1.3 1.2 1.1 13.8 13.6 15.4 1.0
Palm Oil Avg 4,220 14.6 12.4 11.5 2.1 1.9 1.7 14.6 15.3 16.2 2.1 Source: Company data, Credit Suisse estimates for covered companies, IBES estimates
01 September 2014
Halcyon Agri Corporation Ltd (HALC.SI / HACL SP) 18
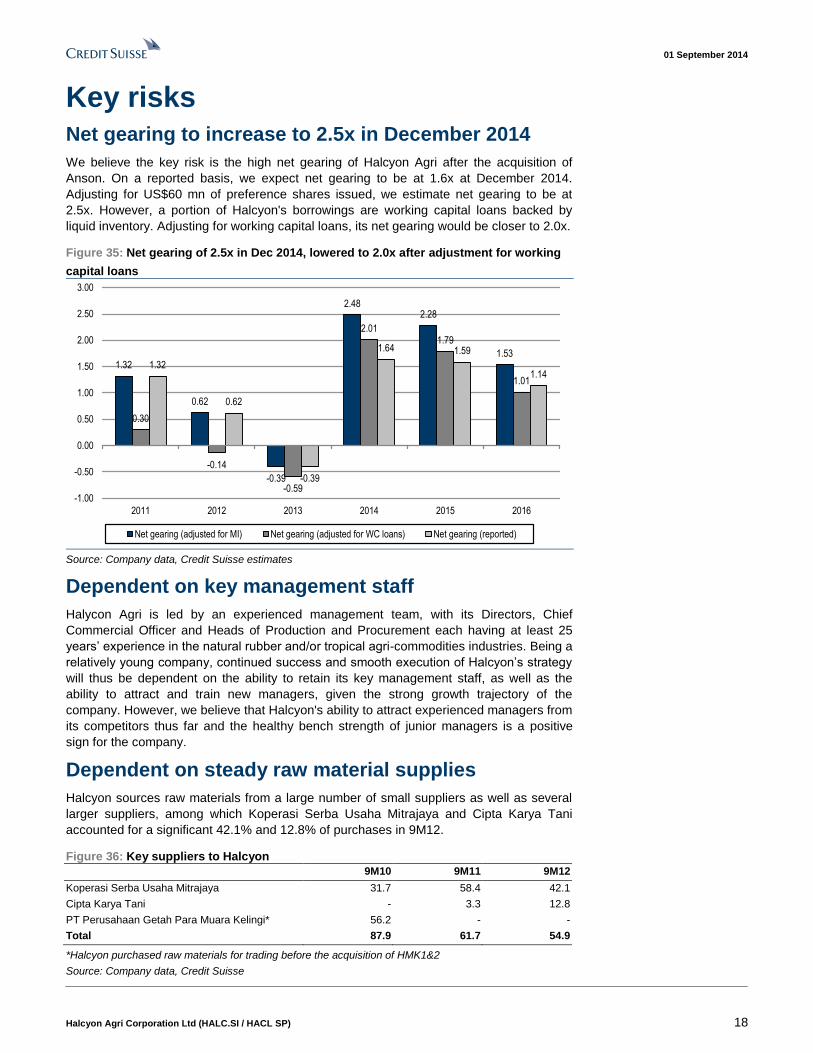
Key risks Net gearing to increase to 2.5x in December 2014
We believe the key risk is the high net gearing of Halcyon Agri after the acquisition of
Anson. On a reported basis, we expect net gearing to be at 1.6x at December 2014.
Adjusting for US$60 mn of preference shares issued, we estimate net gearing to be at
2.5x. However, a portion of Halcyon's borrowings are working capital loans backed by
liquid inventory. Adjusting for working capital loans, its net gearing would be closer to 2.0x.
Figure 35: Net gearing of 2.5x in Dec 2014, lowered to 2.0x after adjustment for working
capital loans
1.32
0.62
-0.39
2.482.28
1.53
0.30
-0.14
-0.59
2.011.79
1.01
1.32
0.62
-0.39
1.64 1.59
1.14
-1.00
-0.50
0.00
0.50
1.00
1.50
2.00
2.50
3.00
2011 2012 2013 2014 2015 2016
Net gearing (adjusted for MI) Net gearing (adjusted for WC loans) Net gearing (reported)
Source: Company data, Credit Suisse estimates
Dependent on key management staff
Halycon Agri is led by an experienced management team, with its Directors, Chief
Commercial Officer and Heads of Production and Procurement each having at least 25
years’ experience in the natural rubber and/or tropical agri-commodities industries. Being a
relatively young company, continued success and smooth execution of Halcyon’s strategy
will thus be dependent on the ability to retain its key management staff, as well as the
ability to attract and train new managers, given the strong growth trajectory of the
company. However, we believe that Halcyon's ability to attract experienced managers from
its competitors thus far and the healthy bench strength of junior managers is a positive
sign for the company.
Dependent on steady raw material supplies
Halcyon sources raw materials from a large number of small suppliers as well as several
larger suppliers, among which Koperasi Serba Usaha Mitrajaya and Cipta Karya Tani
accounted for a significant 42.1% and 12.8% of purchases in 9M12.
Figure 36: Key suppliers to Halcyon
9M10 9M11 9M12
Koperasi Serba Usaha Mitrajaya 31.7 58.4 42.1
Cipta Karya Tani - 3.3 12.8
PT Perusahaan Getah Para Muara Kelingi* 56.2 - -
Total 87.9 61.7 54.9
*Halcyon purchased raw materials for trading before the acquisition of HMK1&2
Source: Company data, Credit Suisse
01 September 2014
Halcyon Agri Corporation Ltd (HALC.SI / HACL SP) 19
Given that Halcyon does not have long-term supply contracts with any of its suppliers, and
transacts largely on a cash-on-delivery basis with all its suppliers in line with industry
practices, it is dependent on the steady supply of raw materials at fair prices to fulfil its
obligations to customers. Unfavourable weather conditions and other supply side
constraints may thus affect the availability of raw materials from suppliers, and restrict
Halcyon’s ability to grow its processing volumes. Through geographical expansion to
Malaysia, we believe Halcyon's dependence on its key suppliers will progressively come
down over the coming periods.
Major customers account for significant revenues
Sales to Halcyon’s major customers account for a substantial portion of total revenues:
Figure 37: Customers accounting for more than 5% of total revenue
(%) 9M10 9M11 9M12
Cooper Tire 72.8 48.7 38.8
Bridgestone - 7.5 13.7
Sri Trang International - 16 13.1
New Continent Enterprise - 9.5 12.9
Marubeni 7.6 14.9 9.3
Continental 17.2 - -
Total 97.6 96.6 87.8
Source: Company data, Credit Suisse
Top five customers of Halcyon in 9M12 are the established international tyre
manufacturers and trading houses, and they contributed 88% of total revenue for 9M12.
Material cancellations or reduction in orders from these key customers would thus have a
significant impact on Halcyon. We expect its customer base to be more diversified with the
acquisition of Chip Lam Seng, which has approvals to sell processed rubber to new
customers such as Hankook and Nexen.
Significant exposure to tyre industry
Given that the tyre industry represents the largest end market for natural rubber, and that
virtually all of Halcyon’s products are sold directly or indirectly to the tyre manufacturers,
Halcyon is substantially exposed to the end market demand in the tyre industry.
A sizeable number of Halcyon’s direct customers include the leading tyre manufacturers,
who require their suppliers to undertake a rigorous qualification programme to ensure that
their output meets the standards required. These customers also enforce strict quality
control standards on their natural rubber suppliers, and as a result any suspension of
approval status and product claims may adversely affect the long term sales relationship
of Halcyon and its key customers. However, despite the short operating history of Halcyon,
the company is already an approved supplier to nine of the major tyre manufacturers, with
steady progress being made on approvals with the other major manufacturers. As such,
we believe that the right systems and processes are in place to ensure continued
compliance with the rigorous qualification programmes of Halcyon's customers.
Funding risk
Halcyon transacts on a cash-on-delivery basis with all its suppliers, while payment periods
for its customers generally range from 2 to 15 days upon delivery. In addition, natural
rubber yields are lowest during the wintering period, which typically spans from August to
October. As a result, inventory holdings of raw materials typically increase during the
wintering period to manage exposure to seasonality. Given the significant amount of cash
involved in its operations, Halcyon relies on working capital facilities provided by the banks
to fund its purchases, and in times of higher market prices for natural rubber, working
capital requirements will increase. Halcyon will thus be affected should it be unable to
continue to access sufficient working capital at reasonable rates. However, we understand

01 September 2014
Halcyon Agri Corporation Ltd (HALC.SI / HACL SP) 20
that significant undrawn capacity exists for the working capital facilities provided by the
banks. Further, such loans are collateralised by the inventories purchased, thus providing
greater security to the lending banks and correspondingly, lower funding risks to Halcyon.
Foreign currency risk
At present, all of Halcyon's purchases are denominated in IDR, given that raw materials
are purchased from the local suppliers on a daily basis, while all of Halcyon's revenues are
denominated in USD. In 9M12, approximately 47.7%, 31.8% and 20.5% of the group’s
expenses were denominated in SGD, USD and IDR, respectively. Foreign currency
exposure thus arises from timing differences between invoicing and collection and
payment and may affect the financial position of Halcyon as it does not currently have a
formal foreign currency hedging policy in place. On an operational basis, foreign currency
risk for Halcyon is mitigated through the daily purchasing of raw materials, with the
exchange rate fixed on a daily basis. Halcyon thus does not seek to take a position on
foreign currencies, and is thus less susceptible to the volatilities in the foreign exchange
market.
01 September 2014
Halcyon Agri Corporation Ltd (HALC.SI / HACL SP) 21
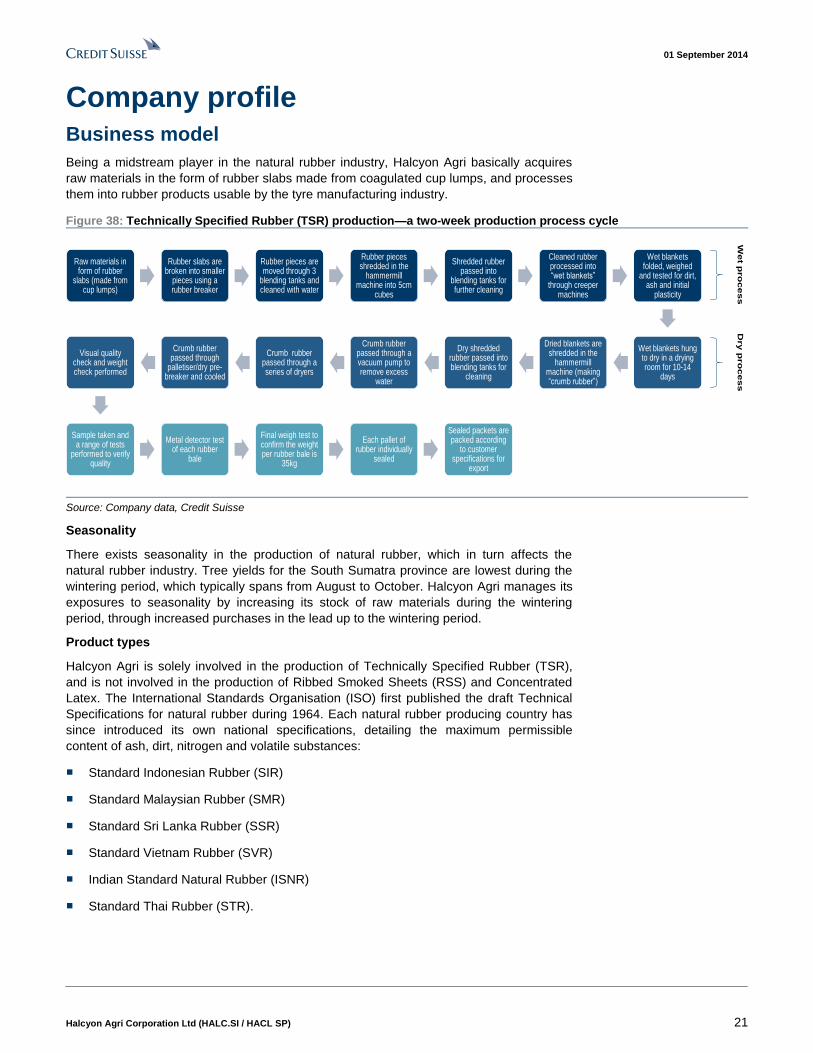
Company profile Business model
Being a midstream player in the natural rubber industry, Halcyon Agri basically acquires
raw materials in the form of rubber slabs made from coagulated cup lumps, and processes
them into rubber products usable by the tyre manufacturing industry.
Figure 38: Technically Specified Rubber (TSR) production—a two-week production process cycle
Raw materials in form of rubber
slabs (made from cup lumps)
Rubber slabs are broken into smaller
pieces using a rubber breaker
Rubber pieces are moved through 3
blending tanks and cleaned with water
Rubber pieces shredded in the
hammermillmachine into 5cm
cubes
Shredded rubber passed into
blending tanks for further cleaning
Cleaned rubber processed into “wet blankets”
through creeper machines
Wet blankets folded, weighed
and tested for dirt, ash and initial
plasticity
Wet blankets hung to dry in a drying room for 10-14
days
Dried blankets are shredded in the
hammermillmachine (making “crumb rubber”)
Dry shredded rubber passed into blending tanks for
cleaning
Crumb rubber passed through a vacuum pump to remove excess
water
Crumb rubber passed through a series of dryers
Crumb rubber passed through
palletiser/dry pre-breaker and cooled
Visual quality check and weight check performed
Sample taken and a range of tests
performed to verify quality
Metal detector test of each rubber
bale
Final weigh test to confirm the weight per rubber bale is
35kg
Each pallet of rubber individually
sealed
Sealed packets are packed according
to customer specifications for
export
We
t pro
ce
ss
Dry p
ro
ce
ss
Source: Company data, Credit Suisse
Seasonality
There exists seasonality in the production of natural rubber, which in turn affects the
natural rubber industry. Tree yields for the South Sumatra province are lowest during the
wintering period, which typically spans from August to October. Halcyon Agri manages its
exposures to seasonality by increasing its stock of raw materials during the wintering
period, through increased purchases in the lead up to the wintering period.
Product types
Halcyon Agri is solely involved in the production of Technically Specified Rubber (TSR),
and is not involved in the production of Ribbed Smoked Sheets (RSS) and Concentrated
Latex. The International Standards Organisation (ISO) first published the draft Technical
Specifications for natural rubber during 1964. Each natural rubber producing country has
since introduced its own national specifications, detailing the maximum permissible
content of ash, dirt, nitrogen and volatile substances:
■ Standard Indonesian Rubber (SIR)
■ Standard Malaysian Rubber (SMR)
■ Standard Sri Lanka Rubber (SSR)
■ Standard Vietnam Rubber (SVR)
■ Indian Standard Natural Rubber (ISNR)
■ Standard Thai Rubber (STR).

01 September 2014
Halcyon Agri Corporation Ltd (HALC.SI / HACL SP) 22
Figure 39: Standard Indonesian Rubber (SIR)
TSR CV TSR L TSR 5 TSR 10 TSR 20
Parameter Unit SIR 3CV50 SIR 3CV60 SIR 3L SIR 3WF SIR 5 SIR 10 SIR 10VK SIR 20 SIR 20VK
Dirt (max) % wt 0.03 0.03 0.03 0.03 0.05 0.1 0.1 0.2 0.2
Ash (max) % wt 0.5 0.5 0.5 0.5 0.5 0.75 0.75 1 1
Nitrogen (max) % wt 0.6 0.6 0.6 0.6 0.6 0.6 0.6 0.6 0.6
Volatile Matter (max) % wt 0.6 0.6 0.8 0.8 0.8 0.8 0.8 0.8 0.8
Initial Plasticity (min) 30 30 30 30 30 30 30 30 30
PRI index (min) 60 60 75 75 70 60 60 50 50
Colour Lovibond Scale (individual
value, max)
NA NA 6 NA NA NA NA NA NA
Mooney Viscosity (ML, 1+4, 100°C) 50 +/- 5 60 +/- 5 NA NA NA NA 60 +/- 5* NA 60 +/- 5*
Source: Inpol, Credit Suisse; *Not specification status, but are controlled at the producer end.
Being of Indonesian origin, Halcyon Agri produces TSR of varying specifications, all of
which are mainly used as key inputs in the manufacture of vehicle tyres:
■ SIR20: Standard medium grade rubber
■ SIR20-VK: Highly sought by customers due to technical properties, allowing tyre
manufacturers to lower their energy costs and increase manufacturing throughput.
Priced at a premium over SIR20.
■ SIR20-Compound: Suited in particular to the China market
■ Other products: SIR10, SIR10-VK
Revenues
Revenues are derived through the sale of natural rubber products, with minimal revenue
recognition due to the associated physical rubber hedging revenues and revenues from
the unrealised fair value gain/(loss) in open forward commodity contracts. Revenues are
thus largely driven by sales volume of rubber products sold.
Sales are conducted on a spot basis for delivery within three months, or conducted based
on long-term contracts. A majority of Halcyon Agri's volumes are sold through long-term
sales contracts ranging from 3 to 12 months, with a specified volume, delivery schedule
and pricing basis. Given the better visibility on demand and its corresponding effect on
procurement and production planning, Halcyon Agri seeks to have the majority of sales on
the basis of long-term contracts, with 74% of sales volume and 77% of revenue derived
from long-term contracts in 9M12.
Given the pricing premium of SIR20-VK and the strong demand-supply fundamentals,
Halycon Agri also seeks to maximise the production of SIR20-VK given its attractiveness
to tyre manufacturers.
Revenue breakdown by geography
The breakdown of revenue /sale and trading of processed rubber is based on the origin of
its customers’ ultimate parent company. Given that Cooper Tire accounts for a majority of
Halcyon Agri's revenues, sales to the US similarly accounts for a majority of its revenues.

01 September 2014
Halcyon Agri Corporation Ltd (HALC.SI / HACL SP) 23
Figure 40: Halcyon Agri revenue breakdown by geography
9M10 2011 2012
US$ mn % share US$ mn % share US$ mn % share
USA 7.2 72.7 110.7 48.7 89.2 40.4
Asia (ex SG & China) 0.8 8.1 87.3 38.4 80.1 36.3
Singapore 0.2 2.0 28.5 12.5 41.8 19.0
Europe 1.7 17.2 0.8 0.3 8.4 3.8
China - - - - 1.1 0.5
Total 9.9 100.0 227.2 100.0 220.6 100.0
Source: Company data, Credit Suisse research
Cost of sales breakdown
Raw material costs represent a significant majority of Halcyon Agri's cost of sales,
between 95% and 100% of total costs. Raw material costs are directly related to the
market price for natural rubber as gauged by the SICOM TSR20 prices, procurement
effectiveness and the availability of raw materials supply.
Figure 41: Halcyon Agri cost of sales breakdown
9M10 9M11 9M12
US$ mn % share US$ mn % share US$ mn % share
Raw materials 9.7 100 156.8 95 155.7 96.1
Employee benefit expense — — 1.2 0.7 2.2 1.4
Service fee — — 4.4 2.7 — —
Depreciation — — 0.5 0.3 0.5 0.3
Other processing costs — — 2.2 1.3 3.5 2.2
Total cost of sales 9.7 100 165.1 100 161.9 100
Source: Company data, Credit Suisse research
Brief history
Halcyon Agri was incorporated in Singapore in 2005, but remained a dormant company up
until 2010, when the company started its natural rubber trading business through investing
in Hevea Global in May 2010. Thereafter, Halcyon Agri acquired all outstanding shares of
Hevea Global in July 2010.
In September 2010, Halcyon Agri exercised in September 2010 an option (acquired in
August 2010) to acquire the HMK1 and HMK2 rubber processing facilities and the related
operating assets, as well as the know-how of the technology and processes relating to
SIR20-VK rubber, for a total consideration of US$20 mn from PT Perusahaan Getah Para
Muara Kelingi. The acquisition was completed in February 2011.
Although the company only began operations in recent years, the HMK1 and HMK2
processing facilities have been in operation since the 1960s and 1980s, respectively, and
enjoy a well-established reputation for high quality production in the natural rubber
industry. TSR produced by HMK1 and HMK2 have regularly outperformed the minimum
technical specifications required.
Halcyon Agri has since put in place its own risk management and merchandising
operations and professional systems, secured new funding and built up its own customer
base and customer contracts to be aligned to its business model.
Existing production facilities in Indonesia
The existing production facilities, HMK1 and HMK2, were acquired from PT Perusahaan
Getah Para Muara Kelingi, one of the group's suppliers of processed rubber, in 2010 while
the group was still primarily involved in the rubber trading business. Both production
facilities are ISO 9001 certified and fully mechanised, with in-house laboratories to monitor
product quality, as well as environmental performance metrics daily.
01 September 2014
Halcyon Agri Corporation Ltd (HALC.SI / HACL SP) 24
Both facilities are located on the banks of the Musi River in Palembang, Indonesia, which
provides direct access to the Boom Baru port for ease of export. Being located in the
South Sumatra Province, Indonesia, also allows for easy access to rubber trees from
which raw materials are sourced.
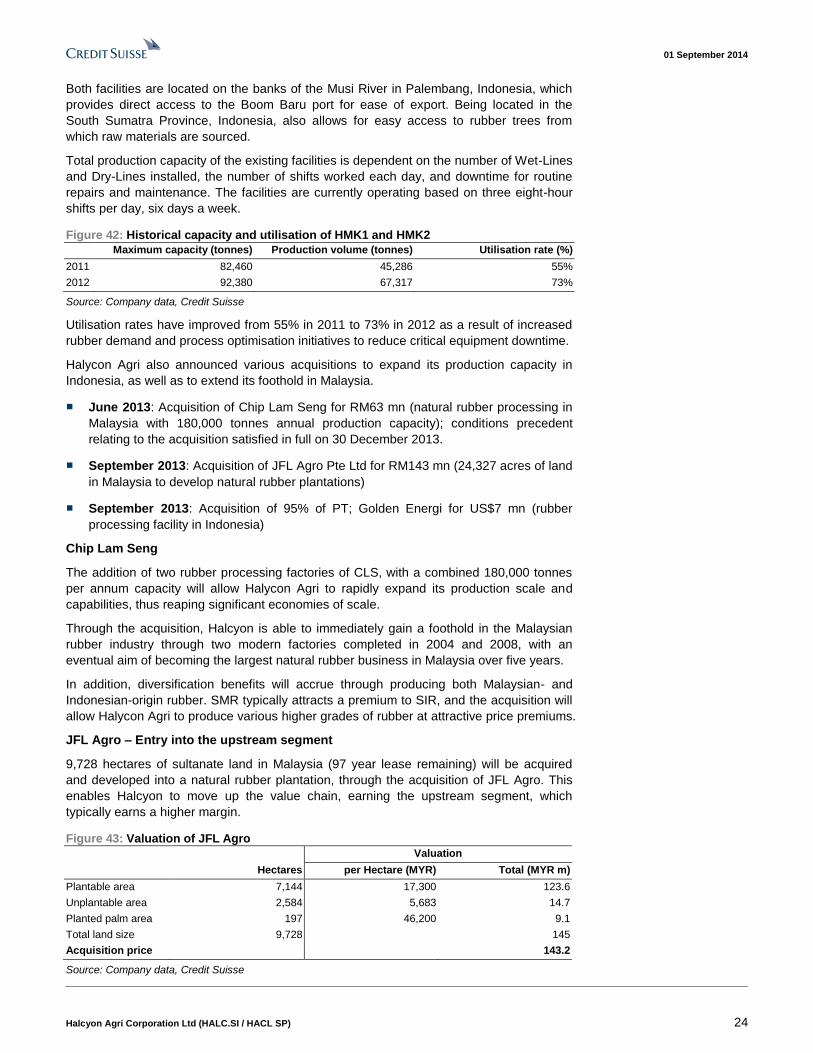
Total production capacity of the existing facilities is dependent on the number of Wet-Lines
and Dry-Lines installed, the number of shifts worked each day, and downtime for routine
repairs and maintenance. The facilities are currently operating based on three eight-hour
shifts per day, six days a week.
Figure 42: Historical capacity and utilisation of HMK1 and HMK2
Maximum capacity (tonnes) Production volume (tonnes) Utilisation rate (%)
2011 82,460 45,286 55%
2012 92,380 67,317 73%
Source: Company data, Credit Suisse
Utilisation rates have improved from 55% in 2011 to 73% in 2012 as a result of increased
rubber demand and process optimisation initiatives to reduce critical equipment downtime.
Halycon Agri also announced various acquisitions to expand its production capacity in
Indonesia, as well as to extend its foothold in Malaysia.
■ June 2013: Acquisition of Chip Lam Seng for RM63 mn (natural rubber processing in
Malaysia with 180,000 tonnes annual production capacity); conditions precedent
relating to the acquisition satisfied in full on 30 December 2013.
■ September 2013: Acquisition of JFL Agro Pte Ltd for RM143 mn (24,327 acres of land
in Malaysia to develop natural rubber plantations)
■ September 2013: Acquisition of 95% of PT; Golden Energi for US$7 mn (rubber
processing facility in Indonesia)
Chip Lam Seng
The addition of two rubber processing factories of CLS, with a combined 180,000 tonnes
per annum capacity will allow Halycon Agri to rapidly expand its production scale and
capabilities, thus reaping significant economies of scale.
Through the acquisition, Halcyon is able to immediately gain a foothold in the Malaysian
rubber industry through two modern factories completed in 2004 and 2008, with an
eventual aim of becoming the largest natural rubber business in Malaysia over five years.
In addition, diversification benefits will accrue through producing both Malaysian- and
Indonesian-origin rubber. SMR typically attracts a premium to SIR, and the acquisition will
allow Halycon Agri to produce various higher grades of rubber at attractive price premiums.
JFL Agro – Entry into the upstream segment
9,728 hectares of sultanate land in Malaysia (97 year lease remaining) will be acquired
and developed into a natural rubber plantation, through the acquisition of JFL Agro. This
enables Halcyon to move up the value chain, earning the upstream segment, which
typically earns a higher margin.
Figure 43: Valuation of JFL Agro
Valuation
Hectares per Hectare (MYR) Total (MYR m)
Plantable area 7,144 17,300 123.6
Unplantable area 2,584 5,683 14.7
Planted palm area 197 46,200 9.1
Total land size 9,728 145
Acquisition price 143.2
Source: Company data, Credit Suisse
01 September 2014
Halcyon Agri Corporation Ltd (HALC.SI / HACL SP) 25
The acquisition is complementary to Halcyon's rubber processing facilities in Malaysia,
potentially providing up to 10% of the required raw materials when the plantations are fully
matured. Though representing only a minority of CLS's needs, the rubber plantations will
enhance Halcyon's ability to procure raw materials and provide useful feedback on the
state of rubber plantations in Malaysia.
Given the long gestation period of the investment, with rubber plantations typically
requiring six to seven years to reach maturity, we have not factored in any contributions
from JFL Agro in our projections. Further, through the sale of palm oil products from the
197 acres of planted oil palm, any operational expenses associated with the development
of the rubber plantations are likely to be offset.
PT Golden Energi – Bolt on acquisition
Located in Jambi Province, Indonesia, PT Golden Energi represents an incremental ‘bolt
on’ acquisition, which enables Halcyon to leverage on its established Indonesian
operations and know-how. With a license to export 50,000 tonnes of natural rubber per
year, the factory, which was built in 2010, is capable of producing SIR-20 rubber.
Management team
Executive chairman and CEO – Robert Meyer
Mr Robert Meyer is the Executive Chairman and CEO of Halcyon Agri and is in charge of
formulating and executing the strategic business development of the Group.
Between 1999 and 2004, Mr Robert Meyer was a director in Kingfisher Automotive Pte. Ltd.
and its affiliated companies and was in charge of business development. His responsibilities
centred on finding new agencies for the company, as well as expanding its distribution
network in Asia. During that period, he travelled extensively throughout Asia and negotiated
sales and distribution contracts with automotive and industrial stockists in the region.
Mr Robert Meyer left Kingfisher Automotive Pte. Ltd. in December 2004 and founded the
Halcyon Group. He has contributed significantly to the Halcyon Group’s development and
charted its corporate direction together with his co-founders and management team. He is
in charge of formulating and executing the strategic business development of the Group,
and his responsibilities include overseeing the core aspects of the business such as
Halcyon Agri's rubber processing operations and sales and marketing operations.
Chief Commercial Officer – Andrew Trevatt
Mr Andrew Trevatt is responsible for merchandising, risk management and business
development.
Mr Andrew Trevatt started work in 1982 as a junior auditor/assistant to the senior
accountant at Aarons Grew & Woodcroft, Certified Accountants, London. In 1986, he
commenced working as a trader for Lewis & Peat (Rubber) Ltd, London, and stayed with
the company for 14 years till 2000. His last position held at Lewis & Peat (Rubber) Ltd,
London, was trading director. In 2002, he went on to work in Sri Trang International Pte.
Ltd. as its chief executive officer. In 2007, he joined Louis Dreyfus Commodities Asian Pte.
Ltd. as a trading manager.
Mr Andrew Trevatt joined Halcyon Agri in 2010. After 26 years of experience in the natural
rubber industry, he has a thorough understanding of its operations, including customer and
supplier relationships, natural rubber processing knowledge and customer requirement
knowledge. He is also responsible for growing the client and supplier base of the business.
Technical Director – James Ronald Bugansky
Mr James Ronald Bugansky is responsible for analysing, maintaining and ultimately
improving the company's technical resources in both existing factories, as well as in
potential mid and upstream acquisitions. Prior to his appointment, he had worked as an
exclusive consultant for Halcyon Agri since May 2013.
01 September 2014
Halcyon Agri Corporation Ltd (HALC.SI / HACL SP) 26
Mr James Bugansky has more than 34 years of experience in natural rubber processing and
plantations. Following his graduation from the Ohio State University in 1976, he started work
in the rubber industry as the Plantation Management Trainee of PT Goodyear Sumatra
Plantation before moving up to be the Assistant Managing Director of Goodyear Guatemala
Plantation, and subsequently Goodyear Brazil Plantation. From 1984 to 2001, he held a
senior management position at The Goodyear Tire & Rubber company's headquarters
covering different areas from Research and Development (Senior Research Fellow -
Research / Corporate), Administrative Management (Manager Plantation Operations),
Purchasing to Inventory and Material Management (Global Materials Manager).
In 2001, he returned to plantation work at PT Goodyear Sumatra Plantation Company in
Indonesia as General Manager and Director. Thereafter he worked as the Factories
Operations Manager at Firestone Liberia from 2007 to 2009 taking responsibility for three
natural rubber processing factories and one rubber wood factory. Following this, and prior
to his service with the Group, he was an independent consultant and worked for GMG
Global as the General Manager Industrial Performance/EHS.
Chief Financial Officer – Ng Eng Kiat
Mr Ng Eng Kiat, was appointed as Halcyon Agri's CFO on 1 January 2013. He joined the
Halcyon Group as its Financial Controller in December 2011 and has been responsible for
overseeing the accounting and financial matters of the Group since he joined the Halcyon
Group.
Prior to joining Halcyon, he worked as an Assurance Supervisor in KPMG LLP in Kuala
Lumpur, Malaysia from 2002 to 2005. In 2005, he went on to join Ernst & Young LLP in
Leeds, England as an Assurance Manager, and thereafter worked at the same firm in
Singapore as an Assurance Senior Manager from 2010 to 2011.
He has been a fellow member of the Association of Chartered Certified Accountants since
2005 and is also a member of the Institute of Certified Public Accountants of Singapore.
Director of Operations, Palembang – Leonard Beschizza
Mr Leonard Beschizza is responsible for industrial and human resource matters in
Palembang, including the daily procurement and monitoring of raw materials.
Mr Leonard Beschizza started working as a trader with Pacol Ltd, London, a member of
the Gill & Duffus Group in 1971. He went on to become a director of Pacol Sdn Bhd and
Pacol Singapore in 1976, and his duties included the procurement of natural rubber and
cocoa on behalf of Pacol’s UK and North American trading offices. In 1978, he returned to
Pacol Ltd, London, to head the natural rubber trading desk and was appointed as a main
board director in 1985. In 1987, he went on to become the director of Centrotrade
Singapore and headed the natural rubber trading team at Centrotrade Singapore. In 1995,
he headed the sales and marketing department in PT PP London Sumatra Indonesia and
dealt with the price risk management of agricultural products. In addition, he was a
moderator at the Indonesian Palm Oil Association or GAPKI (Gabungan Pengusaha
Kelapa Sawit Indonesia) conferences in 2008, 2009 and 2010.
Mr Leonard Beschizza joined Halcyon Agri in 2010. After working for about 40 years in the
natural rubber and agricultural industry, he is experienced in most aspects of the natural
rubber business, including the processing and trading of physical rubber and futures. He
also has an in-depth knowledge of the palm oil and cocoa industry.
Head of Production, Palembang – Alex Kurniawan Edy
Mr Alex Kurniawan Edy, Halcyon Agri's Head of Production, joined the Group in 2011 as
part of the acquisition of the HMK1 and HMK2 facilities. Since he joined the Group, he has
been responsible for overseeing the rubber processing operations, administrative and
human resource matters of PT Hevea. He has been involved in the natural rubber industry
for 20 years and, during this period, has been exclusively employed in relation to HMK1
and HMK2.
01 September 2014
Halcyon Agri Corporation Ltd (HALC.SI / HACL SP) 27
Mr Alex Kurniawan Edy started work at PT Perusahaan Getah Para Muara Kelingi in 1992
as its factory manager and remained with PT Perusahaan Getah Para Muara Kelingi until
Halcyon Agri's acquisition of HMK1 and HMK2 in 2011.
Mr Alex Kurniawan Edy has been the Chairman of the South Sumatra office of
GAPKINDO since 1996 and is also the Vice Chairman of GAPKINDO’s central office in
Jakarta.
Head of Procurement, Palembang – Rachman Rachmadi
Mr Rachman Rachmadi, Halcyon Agri's Head of Procurement, joined the Group in 2011 as
part of the acquisition of the HMK1 and HMK2 facilities. Since he joined the Group, he has
been responsible for overseeing the financial matters of PT Hevea and manages PT
Hevea’s raw material procurement and payment process. He has been involved in the
natural rubber industry for over 40 years and, in particular, has been closely involved with
the operations of HMK1 and HMK2 for 25 years.
Mr Rachman Rachmadi started work in 1968 as a director of PT Garuntang, a company
engaged in the rubber business in the Lampung Province in Indonesia. In 1987, he joined
PT Perusahaan Getah Para Muara Kelingi, from whom the HMK1 and HMK2 facilities
were acquired, as its finance manager. In 1990, he was made a director of PT Perusahaan
Getah Para Muara Kelingi and he remained with it until Halcyon Agri's acquisition of HMK1
and HMK2 in 2011.
01 September 2014
Halcyon Agri Corporation Ltd (HALC.SI / HACL SP) 28
Companies Mentioned (Price as of 28-Aug-2014)
Apollo Tyres (APLO.NS, Rs165.3) Archer Daniels Midland Inc. (ADM.N, $49.75) Bridgestone (5108.T, ¥3,608) Bumitama Agri Limited (BUMI.SI, S$1.11) Bunge Limited (BG.N, $84.28) Cheng Shin Rubber (2105.TW, NT$69.9) Continental (CONG.DE, €163.55) Cooper Tire Rubr (CTB.N, $30.37) Felda Global Ventures (FGVH.KL, RM3.93) First Resources Ltd (FRLD.SI, S$2.05) GMG (GMGG.SI, S$0.08) Genting Plantations Bhd (GENP.KL, RM10.16) Glencore (GLEN.L, 360.5p) Golden Agri-Resources (GAGR.SI, S$0.52) Goodyear Tire (GT.OQ, $25.77) Halcyon Agri Corporation Ltd (HALC.SI, S$0.86, OUTPERFORM, TP S$1.2) Hankook Tire (161390.KS, W53,500) IOI Corporation (IOIB.KL, RM4.82) Indofood Agri Resources Ltd (IFAR.SI, S$0.87) Kuala Lumpur Kepong (KLKK.KL, RM22.14) Kumho Tire (073240.KS, W10,600) Marubeni Corp (8002.T, ¥754) Michelin (MICP.PA, €84.04) Nexen Tire (002350.KS, W14,650) Noble Group Ltd (NOBG.SI, S$1.36) Olam (OLAM.SI, S$2.55) PT Astra Agro Lestari Tbk (AALI.JK, Rp26,000) PT BW Plantation Tbk (BWPT.JK, Rp1,025) PT London Sumatra Indonesia (LSIP.JK, Rp1,905) Pirelli (PECI.MI, €11.61) S Giti Tire (600182.SS, Rmb18.02) Salim Ivomas Pratama (SIMP.JK, Rp850) Sampoerna Agro Tbk (SGRO.JK, Rp2,080) Sime Darby (SIME.KL, RM9.47) Sri Trang Agro (STA.BK, Bt14.2) Sumitomo Rubber Industries (5110.T, ¥1,477) Toyo Tire & Rub (5105.T, ¥1,719) Wilmar International Ltd (WLIL.SI, S$3.15) Yokohama Rubber (5101.T, ¥923)
Disclosure Appendix
Important Global Disclosures
I, Gerald Wong, CFA, certify that (1) the views expressed in this report accurately reflect my personal views about all of the subject companies and securities and (2) no part of my compensation was, is or will be directly or indirectly related to the specific recommendations or views expressed in this report.
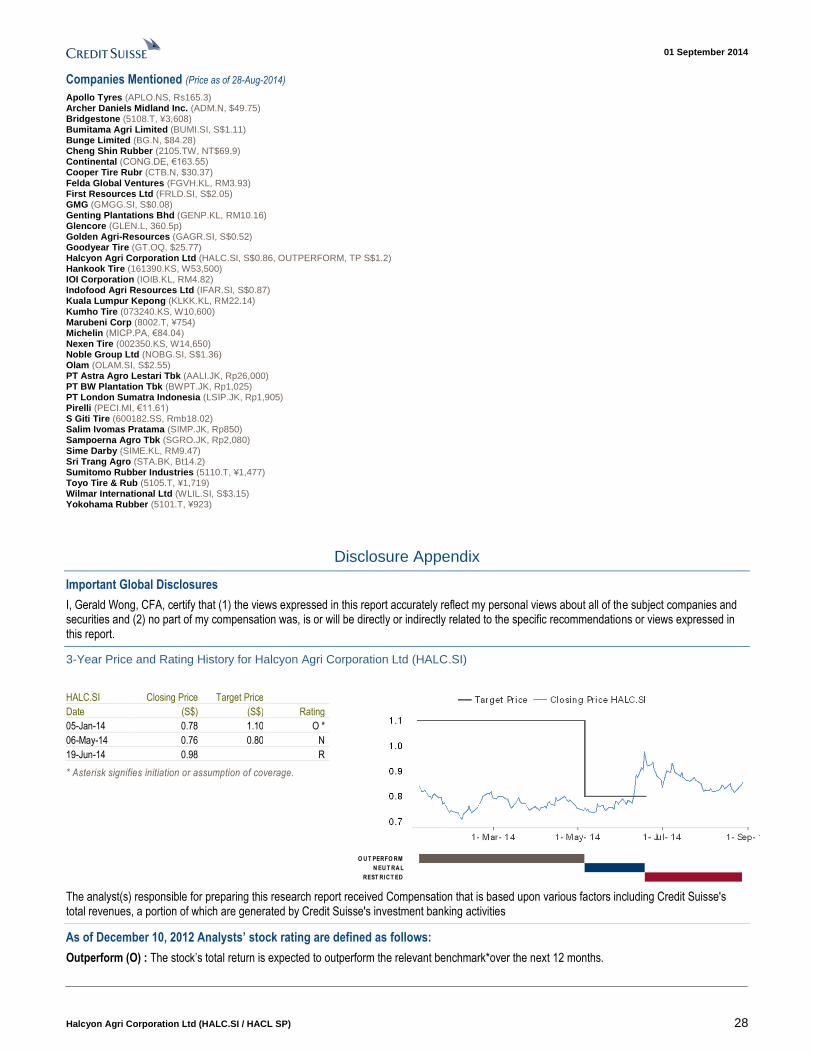
3-Year Price and Rating History for Halcyon Agri Corporation Ltd (HALC.SI)
HALC.SI Closing Price Target Price
Date (S$) (S$) Rating
05-Jan-14 0.78 1.10 O *
06-May-14 0.76 0.80 N
19-Jun-14 0.98 R
* Asterisk signifies initiation or assumption of coverage.
O U T PERFO RM
N EU T RA L
REST RICT ED
The analyst(s) responsible for preparing this research report received Compensation that is based upon various factors including Credit Suisse's total revenues, a portion of which are generated by Credit Suisse's investment banking activities
As of December 10, 2012 Analysts’ stock rating are defined as follows:
Outperform (O) : The stock’s total return is expected to outperform the relevant benchmark*over the next 12 months.

01 September 2014
Halcyon Agri Corporation Ltd (HALC.SI / HACL SP) 29
Neutral (N) : The stock’s total return is expected to be in line with the relevant benchmark* over the next 12 months.
Underperform (U) : The stock’s total return is expected to underperform the relevant benchmark* over the next 12 months.
*Relevant benchmark by region: As of 10th December 2012, Japanese ratings are based on a stock’s total return relative to the analyst's coverage universe which consists of all companies covered by the analyst within the relevant sector, with Outperforms representing the most attractiv e, Neutrals the less attractive, and Underperforms the least attractive investment opportunities. As of 2nd October 2012, U.S. and Canadian as well as European ratings are based on a stock’s total return relative to the analyst's coverage universe which consists of all companies covered by the analyst within the relevant sector, with Outperforms representing the most attractive, Neutrals the less attractive, and Underperforms the least attractive investment opportunities. For Latin American an d non-Japan Asia stocks, ratings are based on a stock’s total return relative to the average total return of the relevant country o r regional benchmark; prior to 2nd October 2012 U.S. and Canadian ratings were based on (1) a stock’s absolute total return potential to its current share price and (2) the relative attractiveness of a stock’s total return potential within an analyst’s coverage universe. For Australian and New Zealand stocks, 12-month rolling yield is incorporated in the absolute total return calculation and a 15% and a 7.5% threshold replace the 10-15% level in the Outperform and Underperform stock rating definitions, respectively. The 15% and 7.5% thresholds replace the +10-15% and -10-15% levels in the Neutral stock rating definition, respectively. Prior to 10th December 2012, Japanese ratings were based on a stock’s total return relative to the average total return of the relevant country or regional benchmark.
Restricted (R) : In certain circumstances, Credit Suisse policy and/or applicable law and regulations preclude certain types of communications, including an investment recommendation, during the course of Credit Suisse's engagement in an investment banking transaction and in certain other circumstances.
Volatility Indicator [V] : A stock is defined as volatile if the stock price has moved up or down by 20% or more in a month in at least 8 of the past 24 months or the analyst expects significant volatility going forward.
Analysts’ sector weightings are distinct from analysts’ stock ratings and are based on the analyst’s expectations for the fundamentals and/or valuation of the sector* relative to the group’s historic fundamentals and/or valuation:
Overweight : The analyst’s expectation for the sector’s fundamentals and/or valuation is favorable over the next 12 months.
Market Weight : The analyst’s expectation for the sector’s fundamentals and/or valuation is neutral over the next 12 months.
Underweight : The analyst’s expectation for the sector’s fundamentals and/or valuation is cautious over the next 12 months.
*An analyst’s coverage sector consists of all companies covered by the analyst within the relevant sector. An analyst may cover multiple sectors.
Credit Suisse's distribution of stock ratings (and banking clients) is:
Global Ratings Distribution
Rating Versus universe (%) Of which banking clients (%)
Outperform/Buy* 44% (53% banking clients)
Neutral/Hold* 40% (51% banking clients)
Underperform/Sell* 13% (44% banking clients)
Restricted 3%
*For purposes of the NYSE and NASD ratings distribution disclosure requirements, our stock ratings of Outperform, Neutral, an d Underperform most closely correspond to Buy, Hold, and Sell, respectively; however, the meanings are not the same, as our stock ratings are determined on a relative ba sis. (Please refer to definitions above.) An investor's decision to buy or sell a security should be based on investment objectives , current holdings, and other individual factors.
Credit Suisse’s policy is to update research reports as it deems appropriate, based on developments with the subject company, the sector or the market that may have a material impact on the research views or opinions stated herein.
Credit Suisse's policy is only to publish investment research that is impartial, independent, clear, fair and not misleading. For more detail please refer to Credit Suisse's Policies for Managing Conflicts of Interest in connection with Investment Research: http://www.csfb.com/research and analytics/disclaimer/managing_conflicts_disclaimer.html
Credit Suisse does not provide any tax advice. Any statement herein regarding any US federal tax is not intended or written to be used, and cannot be used, by any taxpayer for the purposes of avoiding any penalties.
Price Target: (12 months) for Halcyon Agri Corporation Ltd (HALC.SI)
Method: Our target price of S$1.20 for Halcyon Agri Corporation Ltd is based on a 2016E P/E of 7.0x, in line with peer industries.
Risk: Risks that could cause the share price to diverge from our S$1.20 target price for Halcyon Agri Corporation Ltd include: ( i) inability to secure raw material supplies at fair prices; (ii) material cancellation or reduction in orders; (iii) a sustained slump in end market demand in the tyre industry; (iv) funding risks; and (v) forex risks.
Please refer to the firm's disclosure website at https://rave.credit-suisse.com/disclosures for the definitions of abbreviations typically used in the target price method and risk sections.
See the Companies Mentioned section for full company names
01 September 2014
Halcyon Agri Corporation Ltd (HALC.SI / HACL SP) 30
The subject company (HALC.SI, LSIP.JK, GENP.KL, BWPT.JK, KLKK.KL, IOIB.KL, SGRO.JK, 8002.T, OLAM.SI, ADM.N, GAGR.SI, BG.N, CONG.DE, SIMP.JK, WLIL.SI, GLEN.L, IFAR.SI, AALI.JK) currently is, or was during the 12-month period preceding the date of distribution of this report, a client of Credit Suisse.
Credit Suisse provided investment banking services to the subject company (HALC.SI, LSIP.JK, SGRO.JK, OLAM.SI, GAGR.SI, BG.N, CONG.DE, SIMP.JK, GLEN.L, IFAR.SI) within the past 12 months.
Credit Suisse provided non-investment banking services to the subject company (CONG.DE) within the past 12 months
Credit Suisse has managed or co-managed a public offering of securities for the subject company (CONG.DE, GLEN.L) within the past 12 months.
Credit Suisse has received investment banking related compensation from the subject company (HALC.SI, LSIP.JK, SGRO.JK, OLAM.SI, GAGR.SI, BG.N, CONG.DE, SIMP.JK, GLEN.L, IFAR.SI) within the past 12 months
Credit Suisse expects to receive or intends to seek investment banking related compensation from the subject company (HALC.SI, FGVH.KL, LSIP.JK, GENP.KL, BWPT.JK, KLKK.KL, IOIB.KL, SGRO.JK, 8002.T, OLAM.SI, FRLD.SI, PECI.MI, BUMI.SI, 5108.T, ADM.N, 5110.T, GAGR.SI, BG.N, CONG.DE, SIMP.JK, GLEN.L, IFAR.SI, AALI.JK) within the next 3 months.
Credit Suisse has received compensation for products and services other than investment banking services from the subject company (CONG.DE) within the past 12 months
As of the date of this report, Credit Suisse makes a market in the following subject companies (ADM.N, BG.N).
Credit Suisse may have interest in (SIME.KL, FGVH.KL, GENP.KL, KLKK.KL, IOIB.KL)
As of the end of the preceding month, Credit Suisse beneficially own 1% or more of a class of common equity securities of (BWPT.JK, MICP.PA).
Credit Suisse has a material conflict of interest with the subject company (ADM.N) . Credit Suisse is the financial advisor to GrainCorp Limited in relation to the proposed acquisition offer by Archer Daniels Midland Inc.
Credit Suisse has a material conflict of interest with the subject company (WLIL.SI) . Credit Suisse is acting as financial advisor to Goodman Fielder in relation to the receipt of the announced proposal from Wilmar International Limited and First Pacific Company Limited.
Credit Suisse has a material conflict of interest with the subject company (GLEN.L) . Credit Suisse Securities (Europe) Limited is acting as financial advisor in connection with the GlencoreXstrata sale of its interest in the Las Bambas copper mine project in Peru to a consortium owned 62.5% by MMG Limited, 22.5% by GUOXIN International Investment Corporation Limited and 15.0% by CITIC Metal Co. Limited.
For other important disclosures concerning companies featured in this report, including price charts, please visit the website at https://rave.credit-suisse.com/disclosures or call +1 (877) 291-2683.
Important Regional Disclosures
Singapore recipients should contact Credit Suisse AG, Singapore Branch for any matters arising from this research report.
The analyst(s) involved in the preparation of this report have not visited the material operations of the subject company (HALC.SI, SIME.KL, FGVH.KL, LSIP.JK, GENP.KL, NOBG.SI, BWPT.JK, KLKK.KL, IOIB.KL, 161390.KS, SGRO.JK, 8002.T, OLAM.SI, FRLD.SI, PECI.MI, BUMI.SI, ADM.N, GAGR.SI, BG.N, CONG.DE, SIMP.JK, WLIL.SI, GLEN.L, 2105.TW, IFAR.SI, AALI.JK, MICP.PA) within the past 12 months
Restrictions on certain Canadian securities are indicated by the following abbreviations: NVS--Non-Voting shares; RVS--Restricted Voting Shares; SVS--Subordinate Voting Shares.
Individuals receiving this report from a Canadian investment dealer that is not affiliated with Credit Suisse should be advised that this report may not contain regulatory disclosures the non-affiliated Canadian investment dealer would be required to make if this were its own report.
For Credit Suisse Securities (Canada), Inc.'s policies and procedures regarding the dissemination of equity research, please visit http://www.csfb.com/legal_terms/canada_research_policy.shtml.
The following disclosed European company/ies have estimates that comply with IFRS: (CONG.DE, MICP.PA).
Credit Suisse has acted as lead manager or syndicate member in a public offering of securities for the subject company (8002.T, OLAM.SI, GAGR.SI, CONG.DE, GLEN.L) within the past 3 years.
As of the date of this report, Credit Suisse acts as a market maker or liquidity provider in the equities securities that are the subject of this report.
Principal is not guaranteed in the case of equities because equity prices are variable.
Commission is the commission rate or the amount agreed with a customer when setting up an account or at any time after that.
To the extent this is a report authored in whole or in part by a non-U.S. analyst and is made available in the U.S., the following are important disclosures regarding any non-U.S. analyst contributors: The non-U.S. research analysts listed below (if any) are not registered/qualified as research analysts with FINRA. The non-U.S. research analysts listed below may not be associated persons of CSSU and therefore may not be subject to the NASD Rule 2711 and NYSE Rule 472 restrictions on communications with a subject company, public appearances and trading securities held by a research analyst account.
Credit Suisse AG, Singapore Branch .......................................................................................................................................... Gerald Wong, CFA

01 September 2014
Halcyon Agri Corporation Ltd (HALC.SI / HACL SP) 31
For Credit Suisse disclosure information on other companies mentioned in this report, please visit the website at https://rave.credit-suisse.com/disclosures or call +1 (877) 291-2683.
01 September 2014
Halcyon Agri Corporation Ltd (HALC.SI / HACL SP) 32
References in this report to Credit Suisse include all of the subsidiaries and affiliates of Credit Suisse operating under its investment banking division. For more information on our structure, please use the following link: https://www.credit-suisse.com/who_we_are/en/This report may contain material that is not directed to, or intended for distribution to or use by, any person or entity who is a citizen or resident of or located in any locality, state, country or other jurisdiction where such distribution, publication, availability or use would be contrary to law or regulation or which would subject Credit Suisse AG or its affiliates ("CS") to any registration or licensing requirement within such jurisdiction. All material presented in this report, unless specifically indicated otherwise, is under copyright to CS. None of the material, nor its content, nor any copy of it, may be altered in any way, transmitted to, copied or distributed to any other party, without the prior express written permission of CS. All trademarks, service marks and logos used in this report are trademarks or service marks or registered trademarks or service marks of CS or its affiliates. The information, tools and material presented in this report are provided to you for information purposes only and are not to be used or considered as an offer or the solicitation of an offer to sell or to buy or subscribe for securities or other financial instruments. CS may not have taken any steps to ensure that the securities referred to in this report are suitable for any particular investor. CS will not treat recipients of this report as its customers by virtue of their receiving this report. The investments and services contained or referred to in this report may not be suitable for you and it is recommended that you consult an independent investment advisor if you are in doubt about such investments or investment services. Nothing in this report constitutes investment, legal, accounting or tax advice, or a representation that any investment or strategy is suitable or appropriate to your individual circumstances, or otherwise constitutes a personal recommendation to you. CS does not advise on the tax consequences of investments and you are advised to contact an independent tax adviser. Please note in particular that the bases and levels of taxation may change. Information and opinions presented in this report have been obtained or derived from sources believed by CS to be reliable, but CS makes no representation as to their accuracy or completeness. CS accepts no liability for loss arising from the use of the material presented in this report, except that this exclusion of liability does not apply to the extent that such liability arises under specific statutes or regulations applicable to CS. This report is not to be relied upon in substitution for the exercise of independent judgment. CS may have issued, and may in the future issue, other communications that are inconsistent with, and reach different conclusions from, the information presented in this report. Those communications reflect the different assumptions, views and analytical methods of the analysts who prepared them and CS is under no obligation to ensure that such other communications are brought to the attention of any recipient of this report. Some investments referred to in this report will be offered solely by a single entity and in the case of some investments solely by CS, or an associate of CS or CS may be the only market maker in such investments. Past performance should not be taken as an indication or guarantee of future performance, and no representation or warranty, express or implied, is made regarding future performance. Information, opinions and estimates contained in this report reflect a judgment at its original date of publication by CS and are subject to change without notice. The price, value of and income from any of the securities or financial instruments mentioned in this report can fall as well as rise. The value of securities and financial instruments is subject to exchange rate fluctuation that may have a positive or adverse effect on the price or income of such securities or financial instruments. Investors in securities such as ADR's, the values of which are influenced by currency volatility, effectively assume this risk. Structured securities are complex instruments, typically involve a high degree of risk and are intended for sale only to sophisticated investors who are capable of understanding and assuming the risks involved. The market value of any structured security may be affected by changes in economic, financial and political factors (including, but not limited to, spot and forward interest and exchange rates), time to maturity, market conditions and volatility, and the credit quality of any issuer or reference issuer. Any investor interested in purchasing a structured product should conduct their own investigation and analysis of the product and consult with their own professional advisers as to the risks involved in making such a purchase. Some investments discussed in this report may have a high level of volatility. High volatility investments may experience sudden and large falls in their value causing losses when that investment is realised. Those losses may equal your original investment. Indeed, in the case of some investments the potential losses may exceed the amount of initial investment and, in such circumstances, you may be required to pay more money to support those losses. Income yields from investments may fluctuate and, in consequence, initial capital paid to make the investment may be used as part of that income yield. Some investments may not be readily realisable and it may be difficult to sell or realise those investments, similarly it may prove difficult for you to obtain reliable information about the value, or risks, to which such an investment is exposed. This report may provide the addresses of, or contain hyperlinks to, websites. Except to the extent to which the report refers to website material of CS, CS has not reviewed any such site and takes no responsibility for the content contained therein. Such address or hyperlink (including addresses or hyperlinks to CS's own website material) is provided solely for your convenience and information and the content of any such website does not in any way form part of this document. Accessing such website or following such link through this report or CS's website shall be at your own risk. This report is issued and distributed in Europe (except Switzerland) by Credit Suisse Securities (Europe) Limited, One Cabot Square, London E14 4QJ, England, which is authorised by the Prudential Regulation Authority and regulated by the Financial Conduct Authority and the Prudential Regulation Authority. This report is being distributed in Germany by Credit Suisse Securities (Europe) Limited Niederlassung Frankfurt am Main regulated by the Bundesanstalt fuer Finanzdienstleistungsaufsicht ("BaFin"). This report is being distributed in the United States and Canada by Credit Suisse Securities (USA) LLC; in Switzerland by Credit Suisse AG; in Brazil by Banco de Investimentos Credit Suisse (Brasil) S.A or its affiliates; in Mexico by Banco Credit Suisse (México), S.A. (transactions related to the securities mentioned in this report will only be effected in compliance with applicable regulation); in Japan by Credit Suisse Securities (Japan) Limited, Financial Instruments Firm, Director-General of Kanto Local Finance Bureau (Kinsho) No. 66, a member of Japan Securities Dealers Association, The Financial Futures Association of Japan, Japan Investment Advisers Association, Type II Financial Instruments Firms Association; elsewhere in Asia/ Pacific by whichever of the following is the appropriately authorised entity in the relevant jurisdiction: Credit Suisse (Hong Kong) Limited, Credit Suisse Equities (Australia) Limited, Credit Suisse Securities (Thailand) Limited, regulated by the Office of the Securities and Exchange Commission, Thailand, having registered address at 990 Abdulrahim Place, 27th Floor, Unit 2701, Rama IV Road, Silom, Bangrak, Bangkok 10500, Thailand, Tel. +66 2614 6000, Credit Suisse Securities (Malaysia) Sdn Bhd, Credit Suisse AG, Singapore Branch, Credit Suisse Securities (India) Private Limited (CIN no. U67120MH1996PTC104392) regulated by the Securities and Exchange Board of India (registration Nos. INB230970637; INF230970637; INB010970631; INF010970631), having registered address at 9th Floor, Ceejay House, Dr.A.B. Road, Worli, Mumbai - 18, India, T- +91-22 6777 3777, Credit Suisse Securities (Europe) Limited, Seoul Branch, Credit Suisse AG, Taipei Securities Branch, PT Credit Suisse Securities Indonesia, Credit Suisse Securities (Philippines ) Inc., and elsewhere in the world by the relevant authorised affiliate of the above. Research on Taiwanese securities produced by Credit Suisse AG, Taipei Securities Branch has been prepared by a registered Senior Business Person. Research provided to residents of Malaysia is authorised by the Head of Research for Credit Suisse Securities (Malaysia) Sdn Bhd, to whom they should direct any queries on +603 2723 2020. This report has been prepared and issued for distribution in Singapore to institutional investors, accredited investors and expert investors (each as defined under the Financial Advisers Regulations) only, and is also distributed by Credit Suisse AG, Singapore branch to overseas investors (as defined under the Financial Advisers Regulations). By virtue of your status as an institutional investor, accredited investor, expert investor or overseas investor, Credit Suisse AG, Singapore branch is exempted from complying with certain compliance requirements under the Financial Advisers Act, Chapter 110 of Singapore (the "FAA"), the Financial Advisers Regulations and the relevant Notices and Guidelines issued thereunder, in respect of any financial advisory service which Credit Suisse AG, Singapore branch may provide to you. This research may not conform to Canadian disclosure requirements. In jurisdictions where CS is not already registered or licensed to trade in securities, transactions will only be effected in accordance with applicable securities legislation, which will vary from jurisdiction to jurisdiction and may require that the trade be made in accordance with applicable exemptions from registration or licensing requirements. Non-U.S. customers wishing to effect a transaction should contact a CS entity in their local jurisdiction unless governing law permits otherwise. U.S. customers wishing to effect a transaction should do so only by contacting a representative at Credit Suisse Securities (USA) LLC in the U.S. Please note that this research was originally prepared and issued by CS for distribution to their market professional and institutional investor customers. Recipients who are not market professional or institutional investor customers of CS should seek the advice of their independent financial advisor prior to taking any investment decision based on this report or for any necessary explanation of its contents. This research may relate to investments or services of a person outside of the UK or to other matters which are not authorised by the Prudential Regulation Authority and regulated by the Financial Conduct Authority and the Prudential Regulation Authority or in respect of which the protections of the Prudential Regulation Authority and Financial Conduct Authority for private customers and/or the UK compensation scheme may not be available, and further details as to where this may be the case are available upon request in respect of this report. CS may provide various services to US municipal entities or obligated persons ("municipalities"), including suggesting individual transactions or trades and entering into such transactions. Any services CS provides to municipalities are not viewed as "advice" within the meaning of Section 975 of the Dodd-Frank Wall Street Reform and Consumer Protection Act. CS is providing any such services and related information solely on an arm's length basis and not as an advisor or fiduciary to the municipality. In connection with the provision of the any such services, there is no agreement, direct or indirect, between any municipality (including the officials, management, employees or agents thereof) and CS for CS to provide advice to the municipality. Municipalities should consult with their financial, accounting and legal advisors regarding any such services provided by CS. In addition, CS is not acting for direct or indirect compensation to solicit the municipality on behalf of an unaffiliated broker, dealer, municipal securities dealer, municipal advisor, or investment adviser for the purpose of obtaining or retaining an engagement by the municipality for or in connection with Municipal Financial Products, the issuance of municipal securities, or of an investment adviser to provide investment advisory services to or on behalf of the municipality. If this report is being distributed by a financial institution other than Credit Suisse AG, or its affiliates, that financial institution is solely responsible for distribution. Clients of that institution should contact that institution to effect a transaction in the securities mentioned in this report or require further information. This report does not constitute investment advice by Credit Suisse to the clients of the distributing financial institution, and neither Credit Suisse AG, its affiliates, and their respective officers, directors and employees accept any liability whatsoever for any direct or consequential loss arising from their use of this report or its content. Principal is not guaranteed. Commission is the commission rate or the amount agreed with a customer when setting up an account or at any time after that.
Copyright © 2014 CREDIT SUISSE AG and/or its affiliates. All rights reserved.
Investment principal on bonds can be eroded depending on sale price or market price. In addition, there are bonds on which investment principal can be eroded due to changes in redemption amounts. Care is required when investing in such instruments. When you purchase non-listed Japanese fixed income securities (Japanese government bonds, Japanese municipal bonds, Japanese government guaranteed bonds, Japanese corporate bonds) from CS as a seller, you will be requested to pay the purchase price only.
AG0149.doc
Recommended