H Reportable Noise Increases

Appendix H –Reportable Noise Increases
H-1 June 2013
DRAFT
H.1 Reportable Noise Increases – 2013
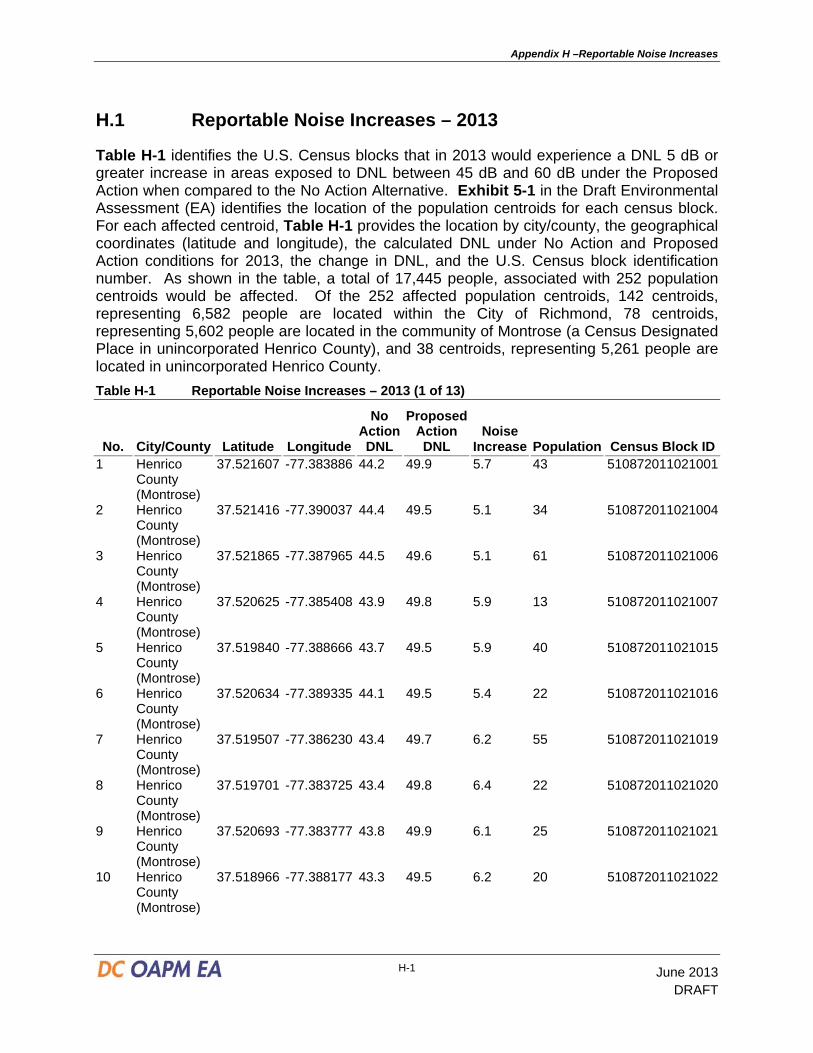
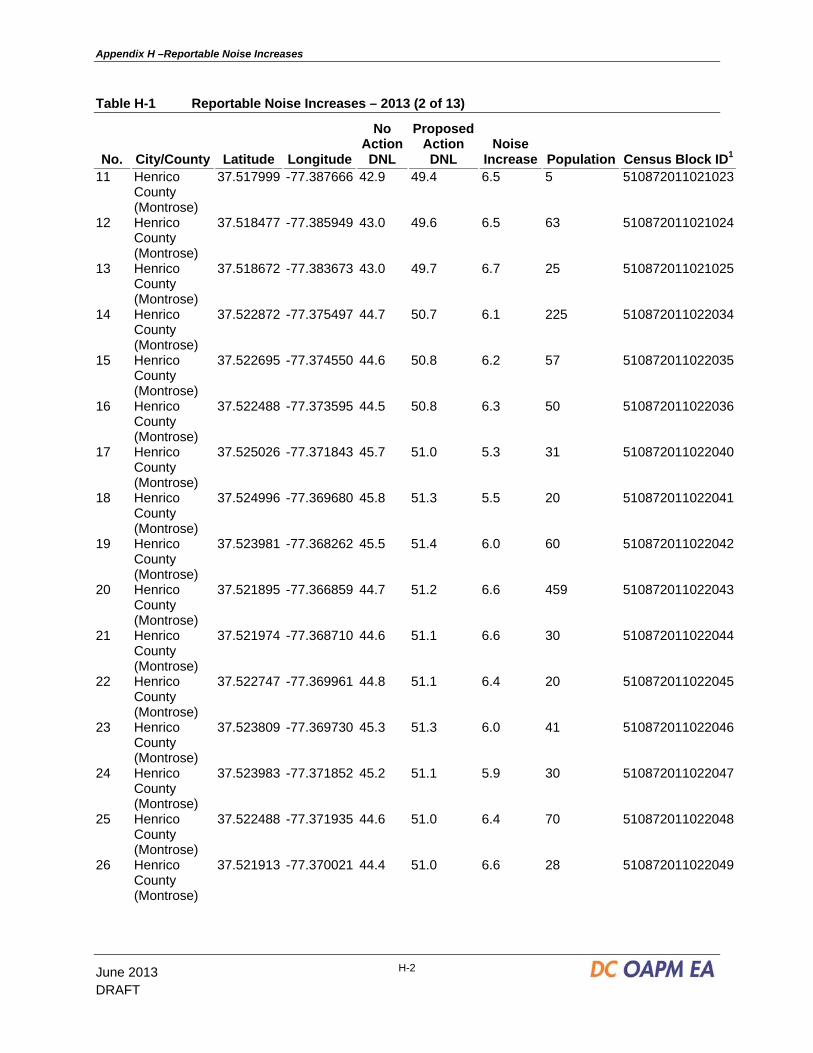
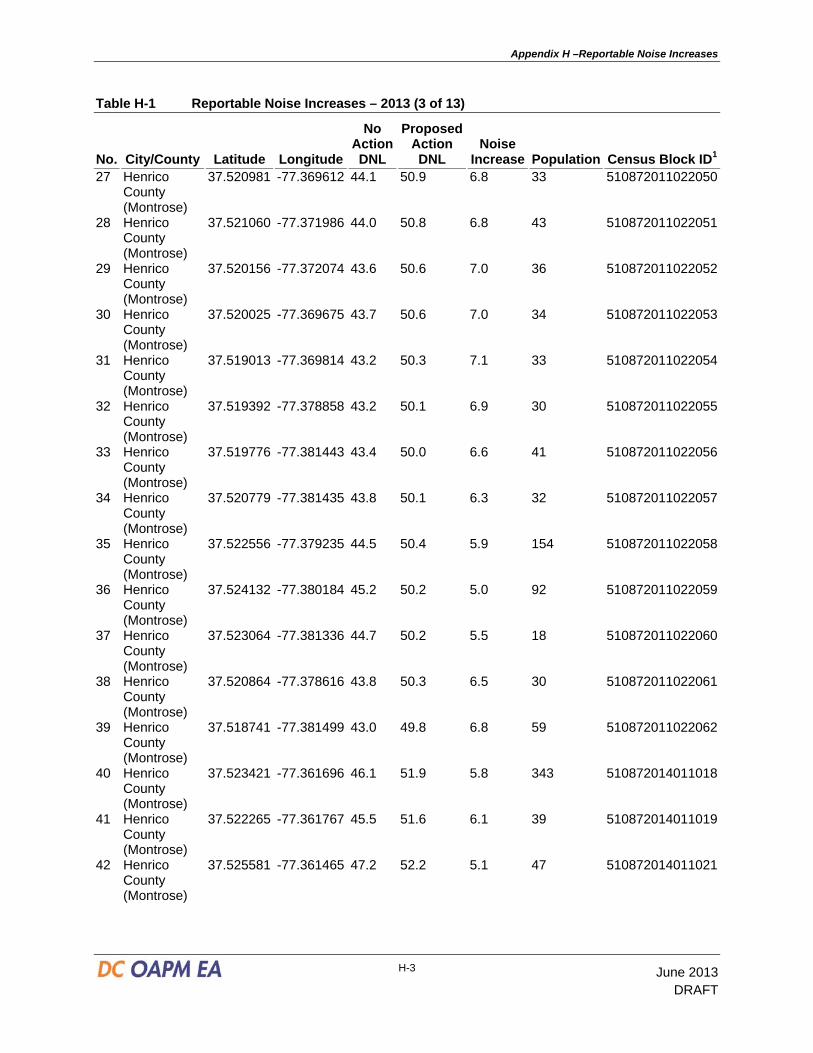
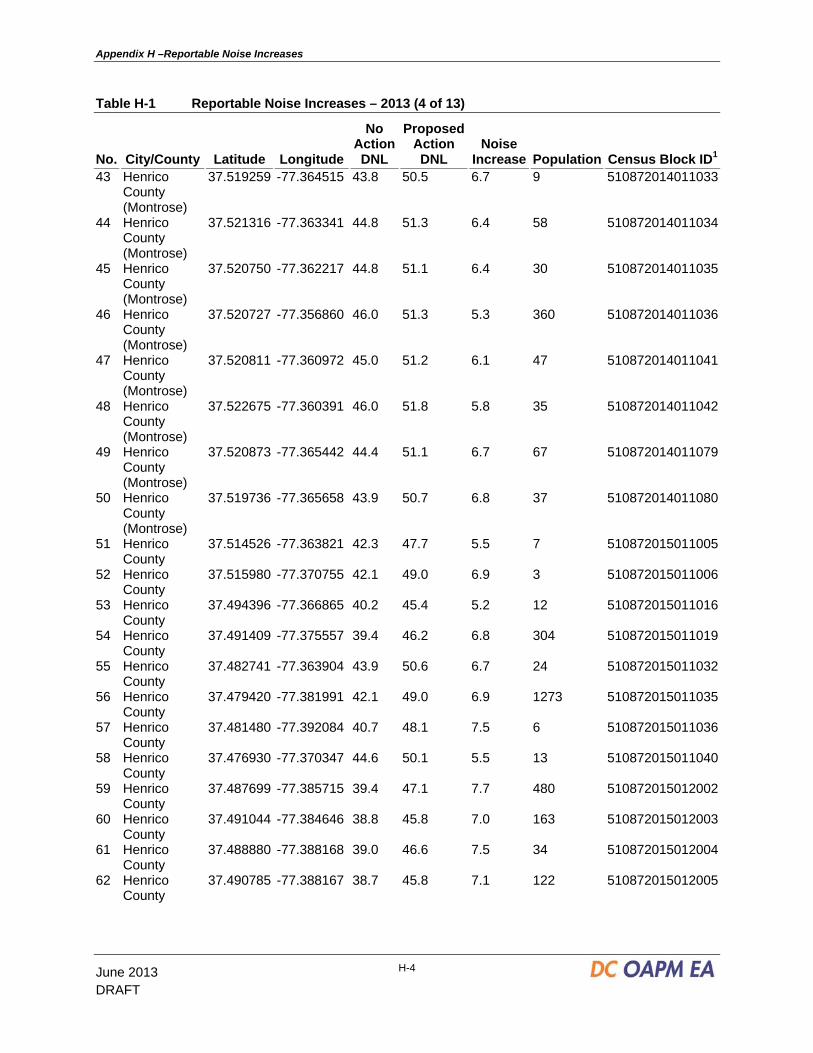
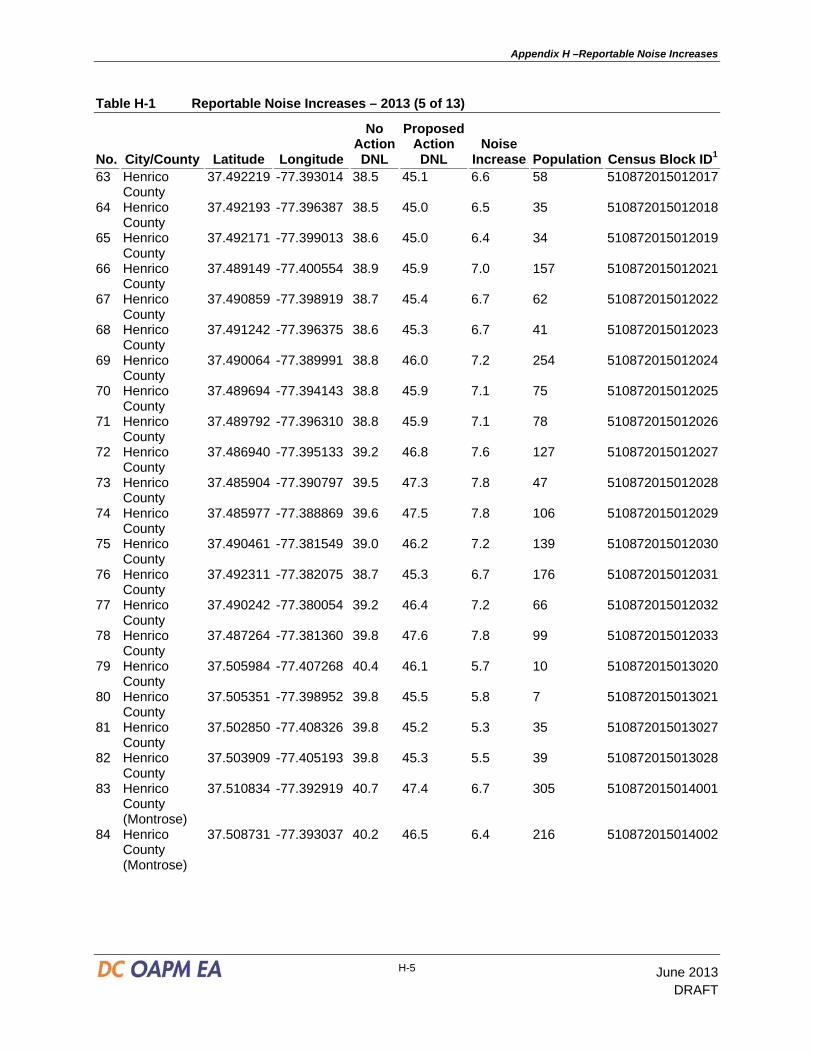
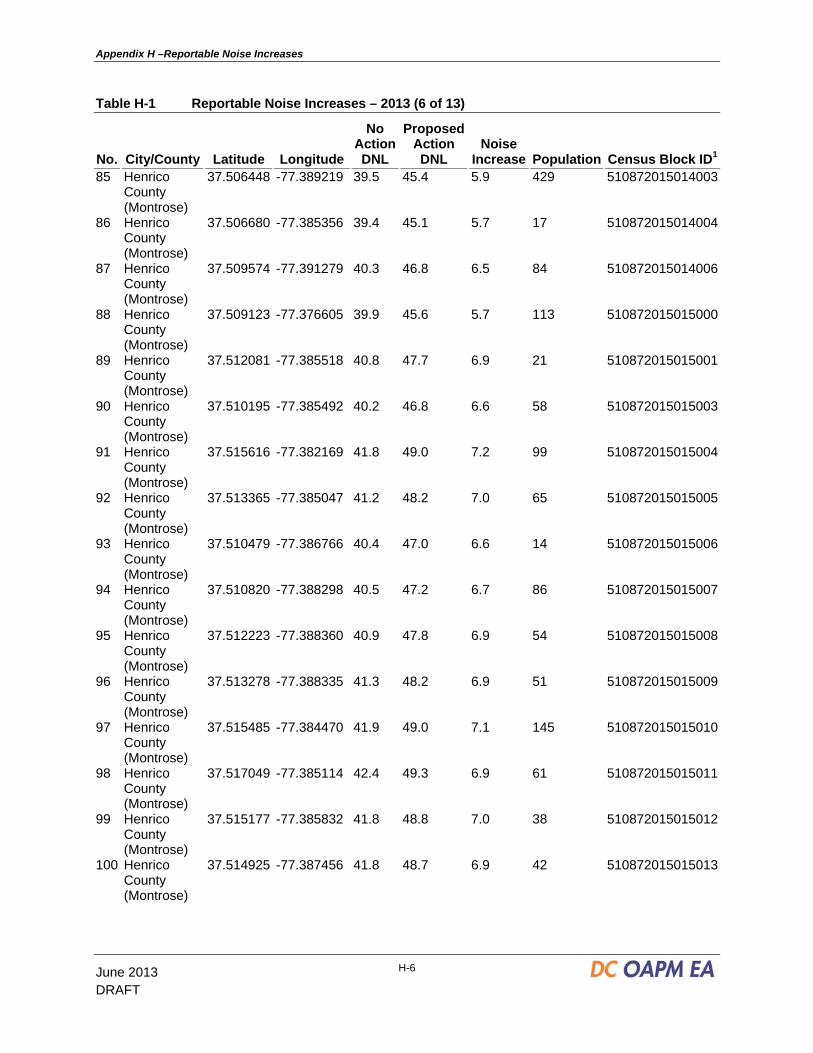
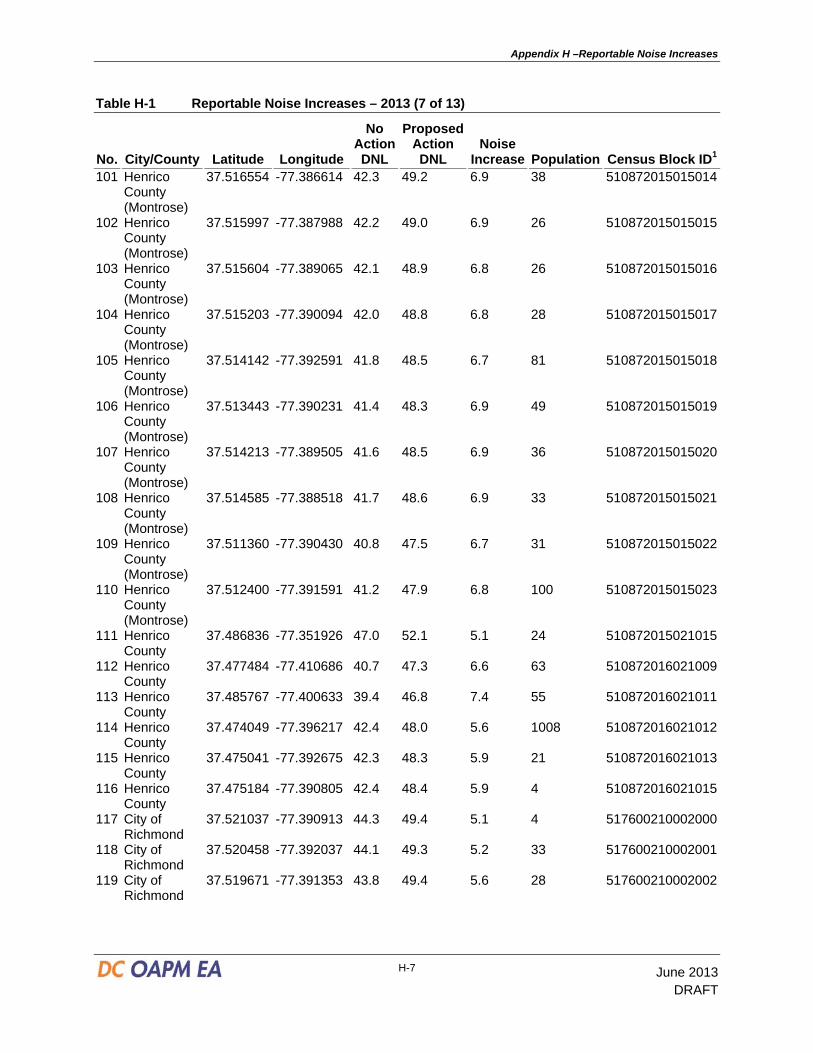
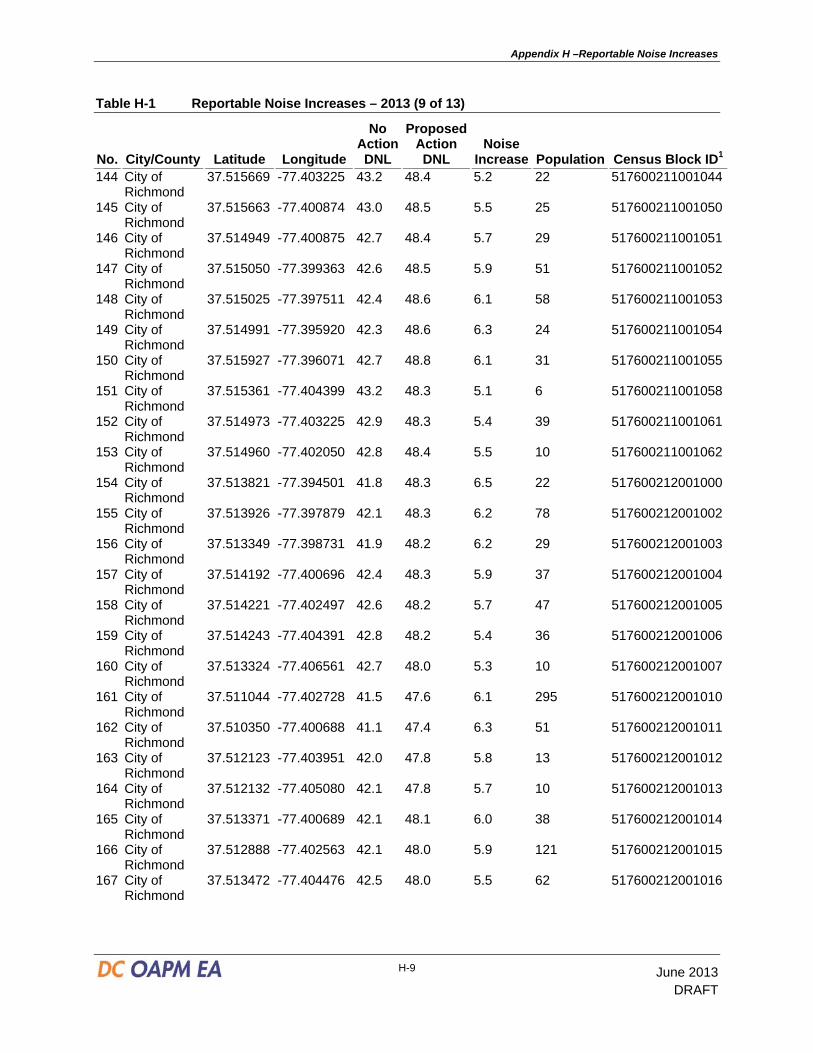
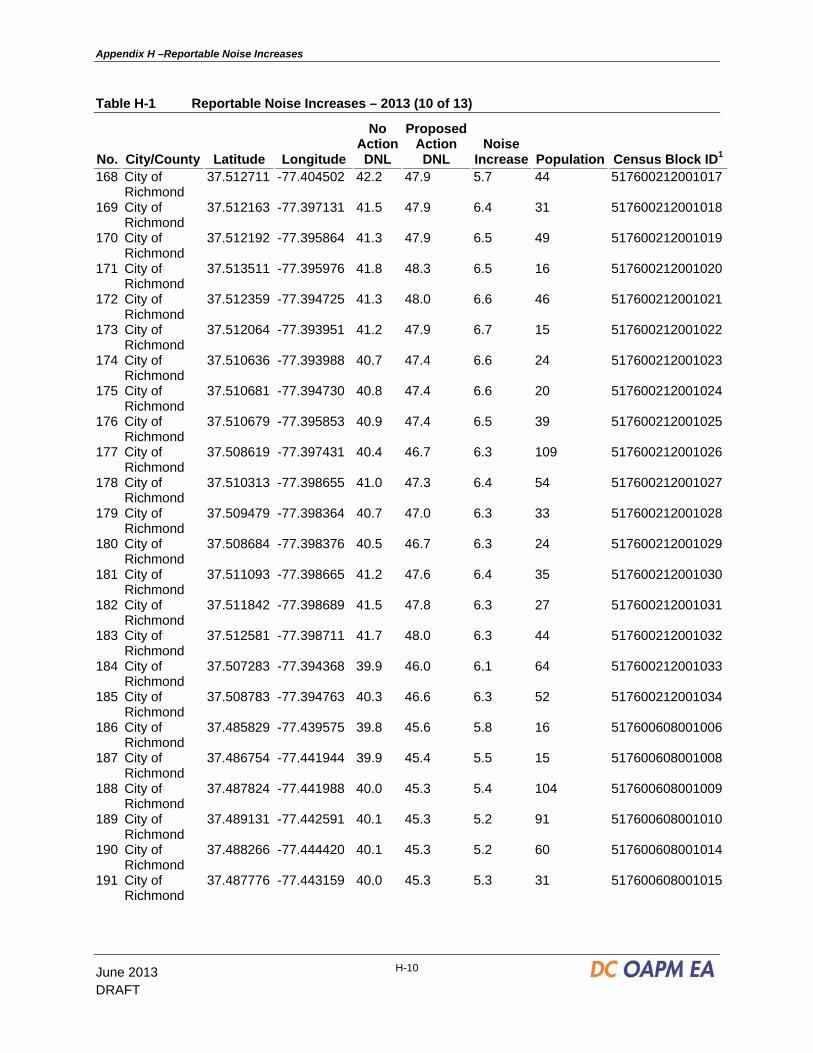
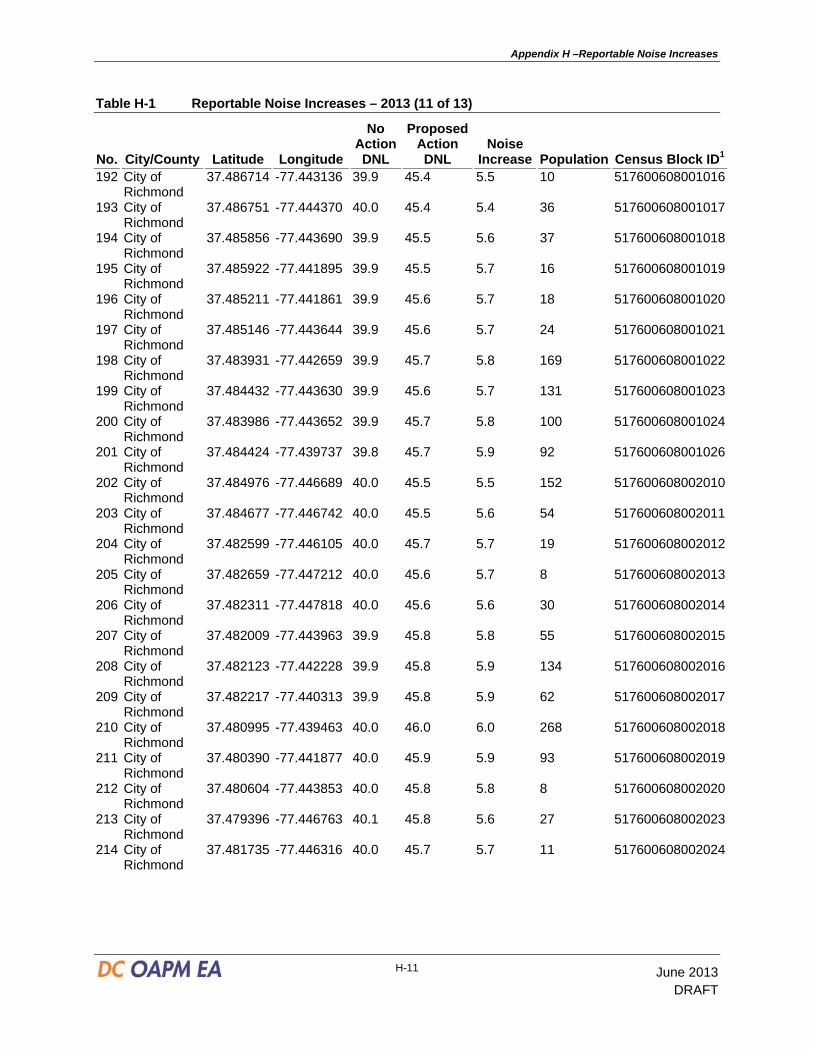
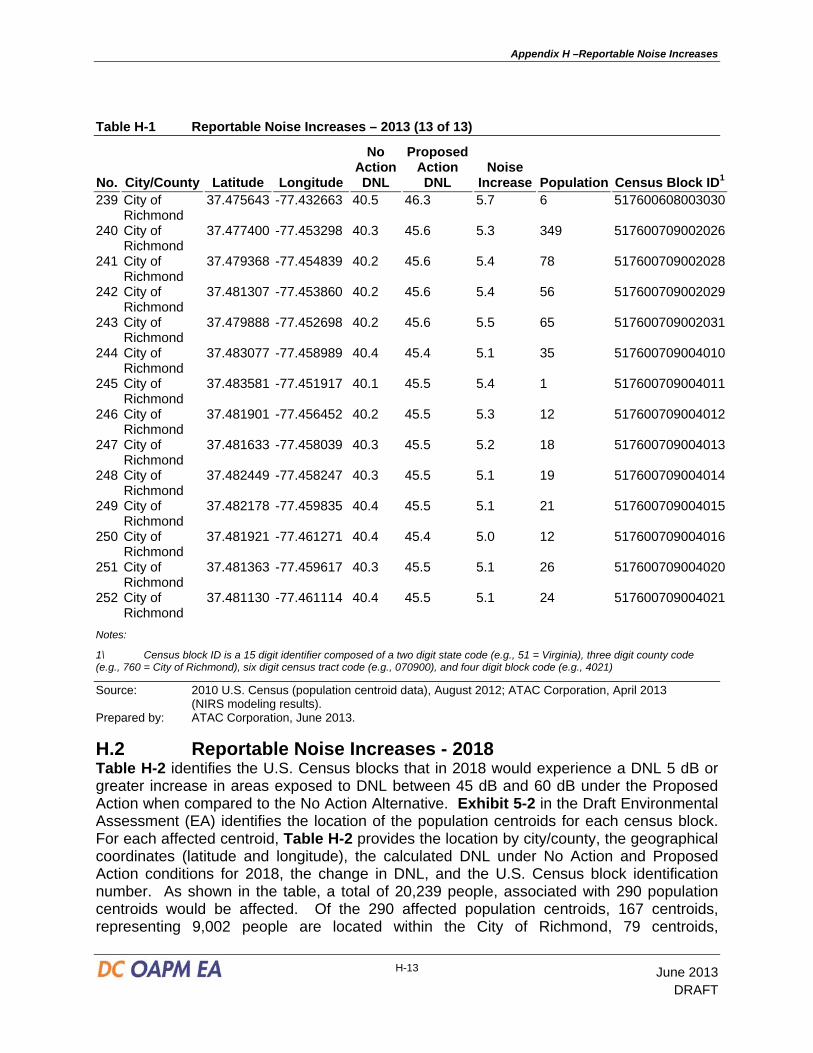
Table H-1 identifies the U.S. Census blocks that in 2013 would experience a DNL 5 dB or greater increase in areas exposed to DNL between 45 dB and 60 dB under the Proposed Action when compared to the No Action Alternative. Exhibit 5-1 in the Draft Environmental Assessment (EA) identifies the location of the population centroids for each census block. For each affected centroid, Table H-1 provides the location by city/county, the geographical coordinates (latitude and longitude), the calculated DNL under No Action and Proposed Action conditions for 2013, the change in DNL, and the U.S. Census block identification number. As shown in the table, a total of 17,445 people, associated with 252 population centroids would be affected. Of the 252 affected population centroids, 142 centroids, representing 6,582 people are located within the City of Richmond, 78 centroids, representing 5,602 people are located in the community of Montrose (a Census Designated Place in unincorporated Henrico County), and 38 centroids, representing 5,261 people are located in unincorporated Henrico County.
Table H-1 Reportable Noise Increases – 2013 (1 of 13)
No. City/County Latitude Longitude
No Action DNL
Proposed Action DNL
Noise Increase Population Census Block ID
1 Henrico County (Montrose)
37.521607 -77.383886 44.2 49.9 5.7 43 510872011021001
2 Henrico County (Montrose)
37.521416 -77.390037 44.4 49.5 5.1 34 510872011021004
3 Henrico County (Montrose)
37.521865 -77.387965 44.5 49.6 5.1 61 510872011021006
4 Henrico County (Montrose)
37.520625 -77.385408 43.9 49.8 5.9 13 510872011021007
5 Henrico County (Montrose)
37.519840 -77.388666 43.7 49.5 5.9 40 510872011021015
6 Henrico County (Montrose)
37.520634 -77.389335 44.1 49.5 5.4 22 510872011021016
7 Henrico County (Montrose)
37.519507 -77.386230 43.4 49.7 6.2 55 510872011021019
8 Henrico County (Montrose)
37.519701 -77.383725 43.4 49.8 6.4 22 510872011021020
9 Henrico County (Montrose)
37.520693 -77.383777 43.8 49.9 6.1 25 510872011021021
10 Henrico County (Montrose)
37.518966 -77.388177 43.3 49.5 6.2 20 510872011021022
Appendix H –Reportable Noise Increases
June 2013 H-2
DRAFT
Table H-1 Reportable Noise Increases – 2013 (2 of 13)
No. City/County Latitude Longitude
No Action DNL
Proposed Action DNL
Noise Increase Population Census Block ID1
11 Henrico County (Montrose)
37.517999 -77.387666 42.9 49.4 6.5 5 510872011021023
12 Henrico County (Montrose)
37.518477 -77.385949 43.0 49.6 6.5 63 510872011021024
13 Henrico County (Montrose)
37.518672 -77.383673 43.0 49.7 6.7 25 510872011021025
14 Henrico County (Montrose)
37.522872 -77.375497 44.7 50.7 6.1 225 510872011022034
15 Henrico County (Montrose)
37.522695 -77.374550 44.6 50.8 6.2 57 510872011022035
16 Henrico County (Montrose)
37.522488 -77.373595 44.5 50.8 6.3 50 510872011022036
17 Henrico County (Montrose)
37.525026 -77.371843 45.7 51.0 5.3 31 510872011022040
18 Henrico County (Montrose)
37.524996 -77.369680 45.8 51.3 5.5 20 510872011022041
19 Henrico County (Montrose)
37.523981 -77.368262 45.5 51.4 6.0 60 510872011022042
20 Henrico County (Montrose)
37.521895 -77.366859 44.7 51.2 6.6 459 510872011022043
21 Henrico County (Montrose)
37.521974 -77.368710 44.6 51.1 6.6 30 510872011022044
22 Henrico County (Montrose)
37.522747 -77.369961 44.8 51.1 6.4 20 510872011022045
23 Henrico County (Montrose)
37.523809 -77.369730 45.3 51.3 6.0 41 510872011022046
24 Henrico County (Montrose)
37.523983 -77.371852 45.2 51.1 5.9 30 510872011022047
25 Henrico County (Montrose)
37.522488 -77.371935 44.6 51.0 6.4 70 510872011022048
26 Henrico County (Montrose)
37.521913 -77.370021 44.4 51.0 6.6 28 510872011022049
Appendix H –Reportable Noise Increases
H-3 June 2013
DRAFT
Table H-1 Reportable Noise Increases – 2013 (3 of 13)
No. City/County Latitude Longitude
No Action DNL
Proposed Action DNL
Noise Increase Population Census Block ID1
27 Henrico County (Montrose)
37.520981 -77.369612 44.1 50.9 6.8 33 510872011022050
28 Henrico County (Montrose)
37.521060 -77.371986 44.0 50.8 6.8 43 510872011022051
29 Henrico County (Montrose)
37.520156 -77.372074 43.6 50.6 7.0 36 510872011022052
30 Henrico County (Montrose)
37.520025 -77.369675 43.7 50.6 7.0 34 510872011022053
31 Henrico County (Montrose)
37.519013 -77.369814 43.2 50.3 7.1 33 510872011022054
32 Henrico County (Montrose)
37.519392 -77.378858 43.2 50.1 6.9 30 510872011022055
33 Henrico County (Montrose)
37.519776 -77.381443 43.4 50.0 6.6 41 510872011022056
34 Henrico County (Montrose)
37.520779 -77.381435 43.8 50.1 6.3 32 510872011022057
35 Henrico County (Montrose)
37.522556 -77.379235 44.5 50.4 5.9 154 510872011022058
36 Henrico County (Montrose)
37.524132 -77.380184 45.2 50.2 5.0 92 510872011022059
37 Henrico County (Montrose)
37.523064 -77.381336 44.7 50.2 5.5 18 510872011022060
38 Henrico County (Montrose)
37.520864 -77.378616 43.8 50.3 6.5 30 510872011022061
39 Henrico County (Montrose)
37.518741 -77.381499 43.0 49.8 6.8 59 510872011022062
40 Henrico County (Montrose)
37.523421 -77.361696 46.1 51.9 5.8 343 510872014011018
41 Henrico County (Montrose)
37.522265 -77.361767 45.5 51.6 6.1 39 510872014011019
42 Henrico County (Montrose)
37.525581 -77.361465 47.2 52.2 5.1 47 510872014011021
Appendix H –Reportable Noise Increases
June 2013 H-4
DRAFT
Table H-1 Reportable Noise Increases – 2013 (4 of 13)
No. City/County Latitude Longitude
No Action DNL
Proposed Action DNL
Noise Increase Population Census Block ID1
43 Henrico County (Montrose)
37.519259 -77.364515 43.8 50.5 6.7 9 510872014011033
44 Henrico County (Montrose)
37.521316 -77.363341 44.8 51.3 6.4 58 510872014011034
45 Henrico County (Montrose)
37.520750 -77.362217 44.8 51.1 6.4 30 510872014011035
46 Henrico County (Montrose)
37.520727 -77.356860 46.0 51.3 5.3 360 510872014011036
47 Henrico County (Montrose)
37.520811 -77.360972 45.0 51.2 6.1 47 510872014011041
48 Henrico County (Montrose)
37.522675 -77.360391 46.0 51.8 5.8 35 510872014011042
49 Henrico County (Montrose)
37.520873 -77.365442 44.4 51.1 6.7 67 510872014011079
50 Henrico County (Montrose)
37.519736 -77.365658 43.9 50.7 6.8 37 510872014011080
51 Henrico County
37.514526 -77.363821 42.3 47.7 5.5 7 510872015011005
52 Henrico County
37.515980 -77.370755 42.1 49.0 6.9 3 510872015011006
53 Henrico County
37.494396 -77.366865 40.2 45.4 5.2 12 510872015011016
54 Henrico County
37.491409 -77.375557 39.4 46.2 6.8 304 510872015011019
55 Henrico County
37.482741 -77.363904 43.9 50.6 6.7 24 510872015011032
56 Henrico County
37.479420 -77.381991 42.1 49.0 6.9 1273 510872015011035
57 Henrico County
37.481480 -77.392084 40.7 48.1 7.5 6 510872015011036
58 Henrico County
37.476930 -77.370347 44.6 50.1 5.5 13 510872015011040
59 Henrico County
37.487699 -77.385715 39.4 47.1 7.7 480 510872015012002
60 Henrico County
37.491044 -77.384646 38.8 45.8 7.0 163 510872015012003
61 Henrico County
37.488880 -77.388168 39.0 46.6 7.5 34 510872015012004
62 Henrico County
37.490785 -77.388167 38.7 45.8 7.1 122 510872015012005
Appendix H –Reportable Noise Increases
H-5 June 2013
DRAFT
Table H-1 Reportable Noise Increases – 2013 (5 of 13)
No. City/County Latitude Longitude
No Action DNL
Proposed Action DNL
Noise Increase Population Census Block ID1
63 Henrico County
37.492219 -77.393014 38.5 45.1 6.6 58 510872015012017
64 Henrico County
37.492193 -77.396387 38.5 45.0 6.5 35 510872015012018
65 Henrico County
37.492171 -77.399013 38.6 45.0 6.4 34 510872015012019
66 Henrico County
37.489149 -77.400554 38.9 45.9 7.0 157 510872015012021
67 Henrico County
37.490859 -77.398919 38.7 45.4 6.7 62 510872015012022
68 Henrico County
37.491242 -77.396375 38.6 45.3 6.7 41 510872015012023
69 Henrico County
37.490064 -77.389991 38.8 46.0 7.2 254 510872015012024
70 Henrico County
37.489694 -77.394143 38.8 45.9 7.1 75 510872015012025
71 Henrico County
37.489792 -77.396310 38.8 45.9 7.1 78 510872015012026
72 Henrico County
37.486940 -77.395133 39.2 46.8 7.6 127 510872015012027
73 Henrico County
37.485904 -77.390797 39.5 47.3 7.8 47 510872015012028
74 Henrico County
37.485977 -77.388869 39.6 47.5 7.8 106 510872015012029
75 Henrico County
37.490461 -77.381549 39.0 46.2 7.2 139 510872015012030
76 Henrico County
37.492311 -77.382075 38.7 45.3 6.7 176 510872015012031
77 Henrico County
37.490242 -77.380054 39.2 46.4 7.2 66 510872015012032
78 Henrico County
37.487264 -77.381360 39.8 47.6 7.8 99 510872015012033
79 Henrico County
37.505984 -77.407268 40.4 46.1 5.7 10 510872015013020
80 Henrico County
37.505351 -77.398952 39.8 45.5 5.8 7 510872015013021
81 Henrico County
37.502850 -77.408326 39.8 45.2 5.3 35 510872015013027
82 Henrico County
37.503909 -77.405193 39.8 45.3 5.5 39 510872015013028
83 Henrico County (Montrose)
37.510834 -77.392919 40.7 47.4 6.7 305 510872015014001
84 Henrico County (Montrose)
37.508731 -77.393037 40.2 46.5 6.4 216 510872015014002
Appendix H –Reportable Noise Increases
June 2013 H-6
DRAFT
Table H-1 Reportable Noise Increases – 2013 (6 of 13)
No. City/County Latitude Longitude
No Action DNL
Proposed Action DNL
Noise Increase Population Census Block ID1
85 Henrico County (Montrose)
37.506448 -77.389219 39.5 45.4 5.9 429 510872015014003
86 Henrico County (Montrose)
37.506680 -77.385356 39.4 45.1 5.7 17 510872015014004
87 Henrico County (Montrose)
37.509574 -77.391279 40.3 46.8 6.5 84 510872015014006
88 Henrico County (Montrose)
37.509123 -77.376605 39.9 45.6 5.7 113 510872015015000
89 Henrico County (Montrose)
37.512081 -77.385518 40.8 47.7 6.9 21 510872015015001
90 Henrico County (Montrose)
37.510195 -77.385492 40.2 46.8 6.6 58 510872015015003
91 Henrico County (Montrose)
37.515616 -77.382169 41.8 49.0 7.2 99 510872015015004
92 Henrico County (Montrose)
37.513365 -77.385047 41.2 48.2 7.0 65 510872015015005
93 Henrico County (Montrose)
37.510479 -77.386766 40.4 47.0 6.6 14 510872015015006
94 Henrico County (Montrose)
37.510820 -77.388298 40.5 47.2 6.7 86 510872015015007
95 Henrico County (Montrose)
37.512223 -77.388360 40.9 47.8 6.9 54 510872015015008
96 Henrico County (Montrose)
37.513278 -77.388335 41.3 48.2 6.9 51 510872015015009
97 Henrico County (Montrose)
37.515485 -77.384470 41.9 49.0 7.1 145 510872015015010
98 Henrico County (Montrose)
37.517049 -77.385114 42.4 49.3 6.9 61 510872015015011
99 Henrico County (Montrose)
37.515177 -77.385832 41.8 48.8 7.0 38 510872015015012
100 Henrico County (Montrose)
37.514925 -77.387456 41.8 48.7 6.9 42 510872015015013
Appendix H –Reportable Noise Increases
H-7 June 2013
DRAFT
Table H-1 Reportable Noise Increases – 2013 (7 of 13)
No. City/County Latitude Longitude
No Action DNL
Proposed Action DNL
Noise Increase Population Census Block ID1
101 Henrico County (Montrose)
37.516554 -77.386614 42.3 49.2 6.9 38 510872015015014
102 Henrico County (Montrose)
37.515997 -77.387988 42.2 49.0 6.9 26 510872015015015
103 Henrico County (Montrose)
37.515604 -77.389065 42.1 48.9 6.8 26 510872015015016
104 Henrico County (Montrose)
37.515203 -77.390094 42.0 48.8 6.8 28 510872015015017
105 Henrico County (Montrose)
37.514142 -77.392591 41.8 48.5 6.7 81 510872015015018
106 Henrico County (Montrose)
37.513443 -77.390231 41.4 48.3 6.9 49 510872015015019
107 Henrico County (Montrose)
37.514213 -77.389505 41.6 48.5 6.9 36 510872015015020
108 Henrico County (Montrose)
37.514585 -77.388518 41.7 48.6 6.9 33 510872015015021
109 Henrico County (Montrose)
37.511360 -77.390430 40.8 47.5 6.7 31 510872015015022
110 Henrico County (Montrose)
37.512400 -77.391591 41.2 47.9 6.8 100 510872015015023
111 Henrico County
37.486836 -77.351926 47.0 52.1 5.1 24 510872015021015
112 Henrico County
37.477484 -77.410686 40.7 47.3 6.6 63 510872016021009
113 Henrico County
37.485767 -77.400633 39.4 46.8 7.4 55 510872016021011
114 Henrico County
37.474049 -77.396217 42.4 48.0 5.6 1008 510872016021012
115 Henrico County
37.475041 -77.392675 42.3 48.3 5.9 21 510872016021013
116 Henrico County
37.475184 -77.390805 42.4 48.4 5.9 4 510872016021015
117 City of Richmond
37.521037 -77.390913 44.3 49.4 5.1 4 517600210002000
118 City of Richmond
37.520458 -77.392037 44.1 49.3 5.2 33 517600210002001
119 City of Richmond
37.519671 -77.391353 43.8 49.4 5.6 28 517600210002002

Appendix H –Reportable Noise Increases
June 2013 H-8
DRAFT
Table H-1 Reportable Noise Increases – 2013 (8 of 13)
No. City/County Latitude Longitude
No Action DNL
Proposed Action DNL
Noise Increase Population Census Block ID1
120 City of Richmond
37.520254 -77.390211 43.9 49.5 5.5 6 517600210002003
121 City of Richmond
37.519511 -77.389596 43.6 49.4 5.9 1 517600210002004
122 City of Richmond
37.518193 -77.394426 43.4 49.1 5.7 181 517600210002006
123 City of Richmond
37.519503 -77.393228 43.8 49.2 5.4 37 517600210002007
124 City of Richmond
37.516575 -77.394157 42.8 48.9 6.1 32 517600210002008
125 City of Richmond
37.517395 -77.392141 42.9 49.1 6.2 33 517600210002009
126 City of Richmond
37.518222 -77.390164 43.1 49.3 6.2 34 517600210002010
127 City of Richmond
37.518703 -77.388902 43.2 49.4 6.2 22 517600210002011
128 City of Richmond
37.517809 -77.388376 42.9 49.4 6.5 14 517600210002012
129 City of Richmond
37.517338 -77.389494 42.8 49.2 6.4 46 517600210002013
130 City of Richmond
37.516306 -77.389475 42.4 49.1 6.7 1 517600210002014
131 City of Richmond
37.516749 -77.388381 42.5 49.2 6.7 1 517600210002015
132 City of Richmond
37.517045 -77.387689 42.5 49.3 6.7 39 517600210002016
133 City of Richmond
37.516507 -77.391482 42.5 49.0 6.5 96 517600210002017
134 City of Richmond
37.515482 -77.391532 42.2 48.8 6.6 1 517600210002018
135 City of Richmond
37.515872 -77.390508 42.3 48.9 6.7 10 517600210002019
136 City of Richmond
37.515667 -77.393597 42.4 48.8 6.4 8 517600210002020
137 City of Richmond
37.517213 -77.400865 43.6 48.6 5.1 22 517600211001030
138 City of Richmond
37.516432 -77.400870 43.3 48.6 5.3 22 517600211001037
139 City of Richmond
37.516435 -77.402045 43.4 48.5 5.2 27 517600211001038
140 City of Richmond
37.515992 -77.399356 42.9 48.6 5.6 32 517600211001040
141 City of Richmond
37.515972 -77.397499 42.8 48.7 5.9 50 517600211001041
142 City of Richmond
37.517177 -77.397277 43.2 48.8 5.6 31 517600211001042
143 City of Richmond
37.515665 -77.402048 43.1 48.4 5.4 23 517600211001043
Appendix H –Reportable Noise Increases
H-9 June 2013
DRAFT
Table H-1 Reportable Noise Increases – 2013 (9 of 13)
No. City/County Latitude Longitude
No Action DNL
Proposed Action DNL
Noise Increase Population Census Block ID1
144 City of Richmond
37.515669 -77.403225 43.2 48.4 5.2 22 517600211001044
145 City of Richmond
37.515663 -77.400874 43.0 48.5 5.5 25 517600211001050
146 City of Richmond
37.514949 -77.400875 42.7 48.4 5.7 29 517600211001051
147 City of Richmond
37.515050 -77.399363 42.6 48.5 5.9 51 517600211001052
148 City of Richmond
37.515025 -77.397511 42.4 48.6 6.1 58 517600211001053
149 City of Richmond
37.514991 -77.395920 42.3 48.6 6.3 24 517600211001054
150 City of Richmond
37.515927 -77.396071 42.7 48.8 6.1 31 517600211001055
151 City of Richmond
37.515361 -77.404399 43.2 48.3 5.1 6 517600211001058
152 City of Richmond
37.514973 -77.403225 42.9 48.3 5.4 39 517600211001061
153 City of Richmond
37.514960 -77.402050 42.8 48.4 5.5 10 517600211001062
154 City of Richmond
37.513821 -77.394501 41.8 48.3 6.5 22 517600212001000
155 City of Richmond
37.513926 -77.397879 42.1 48.3 6.2 78 517600212001002
156 City of Richmond
37.513349 -77.398731 41.9 48.2 6.2 29 517600212001003
157 City of Richmond
37.514192 -77.400696 42.4 48.3 5.9 37 517600212001004
158 City of Richmond
37.514221 -77.402497 42.6 48.2 5.7 47 517600212001005
159 City of Richmond
37.514243 -77.404391 42.8 48.2 5.4 36 517600212001006
160 City of Richmond
37.513324 -77.406561 42.7 48.0 5.3 10 517600212001007
161 City of Richmond
37.511044 -77.402728 41.5 47.6 6.1 295 517600212001010
162 City of Richmond
37.510350 -77.400688 41.1 47.4 6.3 51 517600212001011
163 City of Richmond
37.512123 -77.403951 42.0 47.8 5.8 13 517600212001012
164 City of Richmond
37.512132 -77.405080 42.1 47.8 5.7 10 517600212001013
165 City of Richmond
37.513371 -77.400689 42.1 48.1 6.0 38 517600212001014
166 City of Richmond
37.512888 -77.402563 42.1 48.0 5.9 121 517600212001015
167 City of Richmond
37.513472 -77.404476 42.5 48.0 5.5 62 517600212001016
Appendix H –Reportable Noise Increases
June 2013 H-10
DRAFT
Table H-1 Reportable Noise Increases – 2013 (10 of 13)
No. City/County Latitude Longitude
No Action DNL
Proposed Action DNL
Noise Increase Population Census Block ID1
168 City of Richmond
37.512711 -77.404502 42.2 47.9 5.7 44 517600212001017
169 City of Richmond
37.512163 -77.397131 41.5 47.9 6.4 31 517600212001018
170 City of Richmond
37.512192 -77.395864 41.3 47.9 6.5 49 517600212001019
171 City of Richmond
37.513511 -77.395976 41.8 48.3 6.5 16 517600212001020
172 City of Richmond
37.512359 -77.394725 41.3 48.0 6.6 46 517600212001021
173 City of Richmond
37.512064 -77.393951 41.2 47.9 6.7 15 517600212001022
174 City of Richmond
37.510636 -77.393988 40.7 47.4 6.6 24 517600212001023
175 City of Richmond
37.510681 -77.394730 40.8 47.4 6.6 20 517600212001024
176 City of Richmond
37.510679 -77.395853 40.9 47.4 6.5 39 517600212001025
177 City of Richmond
37.508619 -77.397431 40.4 46.7 6.3 109 517600212001026
178 City of Richmond
37.510313 -77.398655 41.0 47.3 6.4 54 517600212001027
179 City of Richmond
37.509479 -77.398364 40.7 47.0 6.3 33 517600212001028
180 City of Richmond
37.508684 -77.398376 40.5 46.7 6.3 24 517600212001029
181 City of Richmond
37.511093 -77.398665 41.2 47.6 6.4 35 517600212001030
182 City of Richmond
37.511842 -77.398689 41.5 47.8 6.3 27 517600212001031
183 City of Richmond
37.512581 -77.398711 41.7 48.0 6.3 44 517600212001032
184 City of Richmond
37.507283 -77.394368 39.9 46.0 6.1 64 517600212001033
185 City of Richmond
37.508783 -77.394763 40.3 46.6 6.3 52 517600212001034
186 City of Richmond
37.485829 -77.439575 39.8 45.6 5.8 16 517600608001006
187 City of Richmond
37.486754 -77.441944 39.9 45.4 5.5 15 517600608001008
188 City of Richmond
37.487824 -77.441988 40.0 45.3 5.4 104 517600608001009
189 City of Richmond
37.489131 -77.442591 40.1 45.3 5.2 91 517600608001010
190 City of Richmond
37.488266 -77.444420 40.1 45.3 5.2 60 517600608001014
191 City of Richmond
37.487776 -77.443159 40.0 45.3 5.3 31 517600608001015
Appendix H –Reportable Noise Increases
H-11 June 2013
DRAFT
Table H-1 Reportable Noise Increases – 2013 (11 of 13)
No. City/County Latitude Longitude
No Action DNL
Proposed Action DNL
Noise Increase Population Census Block ID1
192 City of Richmond
37.486714 -77.443136 39.9 45.4 5.5 10 517600608001016
193 City of Richmond
37.486751 -77.444370 40.0 45.4 5.4 36 517600608001017
194 City of Richmond
37.485856 -77.443690 39.9 45.5 5.6 37 517600608001018
195 City of Richmond
37.485922 -77.441895 39.9 45.5 5.7 16 517600608001019
196 City of Richmond
37.485211 -77.441861 39.9 45.6 5.7 18 517600608001020
197 City of Richmond
37.485146 -77.443644 39.9 45.6 5.7 24 517600608001021
198 City of Richmond
37.483931 -77.442659 39.9 45.7 5.8 169 517600608001022
199 City of Richmond
37.484432 -77.443630 39.9 45.6 5.7 131 517600608001023
200 City of Richmond
37.483986 -77.443652 39.9 45.7 5.8 100 517600608001024
201 City of Richmond
37.484424 -77.439737 39.8 45.7 5.9 92 517600608001026
202 City of Richmond
37.484976 -77.446689 40.0 45.5 5.5 152 517600608002010
203 City of Richmond
37.484677 -77.446742 40.0 45.5 5.6 54 517600608002011
204 City of Richmond
37.482599 -77.446105 40.0 45.7 5.7 19 517600608002012
205 City of Richmond
37.482659 -77.447212 40.0 45.6 5.7 8 517600608002013
206 City of Richmond
37.482311 -77.447818 40.0 45.6 5.6 30 517600608002014
207 City of Richmond
37.482009 -77.443963 39.9 45.8 5.8 55 517600608002015
208 City of Richmond
37.482123 -77.442228 39.9 45.8 5.9 134 517600608002016
209 City of Richmond
37.482217 -77.440313 39.9 45.8 5.9 62 517600608002017
210 City of Richmond
37.480995 -77.439463 40.0 46.0 6.0 268 517600608002018
211 City of Richmond
37.480390 -77.441877 40.0 45.9 5.9 93 517600608002019
212 City of Richmond
37.480604 -77.443853 40.0 45.8 5.8 8 517600608002020
213 City of Richmond
37.479396 -77.446763 40.1 45.8 5.6 27 517600608002023
214 City of Richmond
37.481735 -77.446316 40.0 45.7 5.7 11 517600608002024

Appendix H –Reportable Noise Increases
June 2013 H-12
DRAFT
Table H-1 Reportable Noise Increases – 2013 (12 of 13)
No. City/County Latitude Longitude
No Action DNL
Proposed Action DNL
Noise Increase Population Census Block ID1
215 City of Richmond
37.481761 -77.445492 40.0 45.7 5.8 6 517600608002025
216 City of Richmond
37.481723 -77.447383 40.0 45.7 5.7 8 517600608002026
217 City of Richmond
37.476806 -77.446472 40.4 45.8 5.5 40 517600608002027
218 City of Richmond
37.477603 -77.444679 40.3 45.9 5.6 10 517600608002028
219 City of Richmond
37.478871 -77.443019 40.2 45.9 5.7 14 517600608002030
220 City of Richmond
37.479785 -77.443768 40.1 45.8 5.8 10 517600608002031
221 City of Richmond
37.482163 -77.446089 40.0 45.7 5.7 21 517600608002032
222 City of Richmond
37.478227 -77.442091 40.2 46.0 5.7 36 517600608002033
223 City of Richmond
37.476262 -77.439658 40.4 46.0 5.6 214 517600608002034
224 City of Richmond
37.477008 -77.442380 40.4 45.9 5.6 18 517600608002036
225 City of Richmond
37.475895 -77.442323 40.5 45.9 5.5 60 517600608002038
226 City of Richmond
37.474543 -77.444828 40.6 45.8 5.2 20 517600608002040
227 City of Richmond
37.475783 -77.447041 40.5 45.8 5.3 26 517600608002041
228 City of Richmond
37.474714 -77.447117 40.6 45.7 5.1 44 517600608002042
229 City of Richmond
37.474216 -77.442162 40.7 45.9 5.2 84 517600608002047
230 City of Richmond
37.477395 -77.431179 40.4 46.3 6.0 52 517600608003015
231 City of Richmond
37.478725 -77.434320 40.2 46.2 6.1 106 517600608003019
232 City of Richmond
37.478493 -77.432612 40.2 46.3 6.1 60 517600608003021
233 City of Richmond
37.476569 -77.432630 40.4 46.3 5.9 32 517600608003022
234 City of Richmond
37.476174 -77.434076 40.5 46.3 5.8 77 517600608003023
235 City of Richmond
37.477202 -77.435024 40.4 46.2 5.9 98 517600608003024
236 City of Richmond
37.477159 -77.436144 40.4 46.2 5.8 63 517600608003025
237 City of Richmond
37.477070 -77.437256 40.3 46.1 5.8 93 517600608003026
238 City of Richmond
37.477308 -77.437910 40.3 46.1 5.7 93 517600608003027
Appendix H –Reportable Noise Increases
H-13 June 2013
DRAFT
Table H-1 Reportable Noise Increases – 2013 (13 of 13)
No. City/County Latitude Longitude
No Action DNL
Proposed Action DNL
Noise Increase Population Census Block ID1
239 City of Richmond
37.475643 -77.432663 40.5 46.3 5.7 6 517600608003030
240 City of Richmond
37.477400 -77.453298 40.3 45.6 5.3 349 517600709002026
241 City of Richmond
37.479368 -77.454839 40.2 45.6 5.4 78 517600709002028
242 City of Richmond
37.481307 -77.453860 40.2 45.6 5.4 56 517600709002029
243 City of Richmond
37.479888 -77.452698 40.2 45.6 5.5 65 517600709002031
244 City of Richmond
37.483077 -77.458989 40.4 45.4 5.1 35 517600709004010
245 City of Richmond
37.483581 -77.451917 40.1 45.5 5.4 1 517600709004011
246 City of Richmond
37.481901 -77.456452 40.2 45.5 5.3 12 517600709004012
247 City of Richmond
37.481633 -77.458039 40.3 45.5 5.2 18 517600709004013
248 City of Richmond
37.482449 -77.458247 40.3 45.5 5.1 19 517600709004014
249 City of Richmond
37.482178 -77.459835 40.4 45.5 5.1 21 517600709004015
250 City of Richmond
37.481921 -77.461271 40.4 45.4 5.0 12 517600709004016
251 City of Richmond
37.481363 -77.459617 40.3 45.5 5.1 26 517600709004020
252 City of Richmond
37.481130 -77.461114 40.4 45.5 5.1 24 517600709004021
Notes:
1\ Census block ID is a 15 digit identifier composed of a two digit state code (e.g., 51 = Virginia), three digit county code (e.g., 760 = City of Richmond), six digit census tract code (e.g., 070900), and four digit block code (e.g., 4021)
Source: 2010 U.S. Census (population centroid data), August 2012; ATAC Corporation, April 2013 (NIRS modeling results).
Prepared by: ATAC Corporation, June 2013.
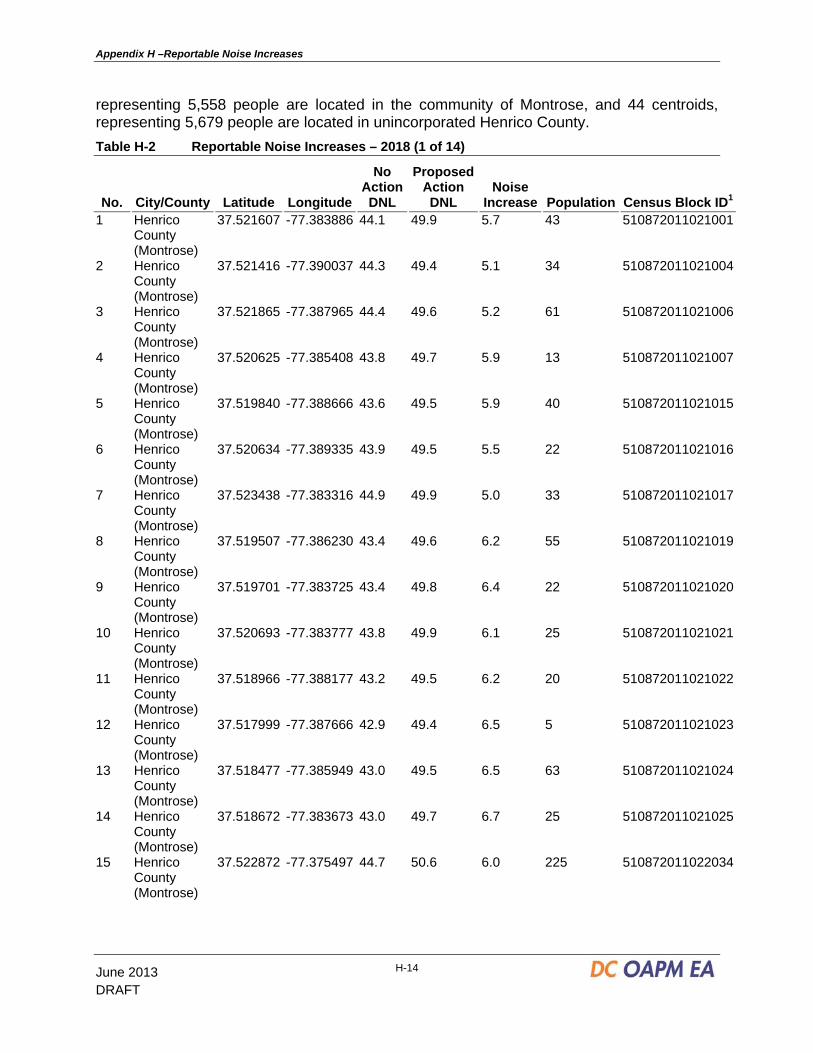
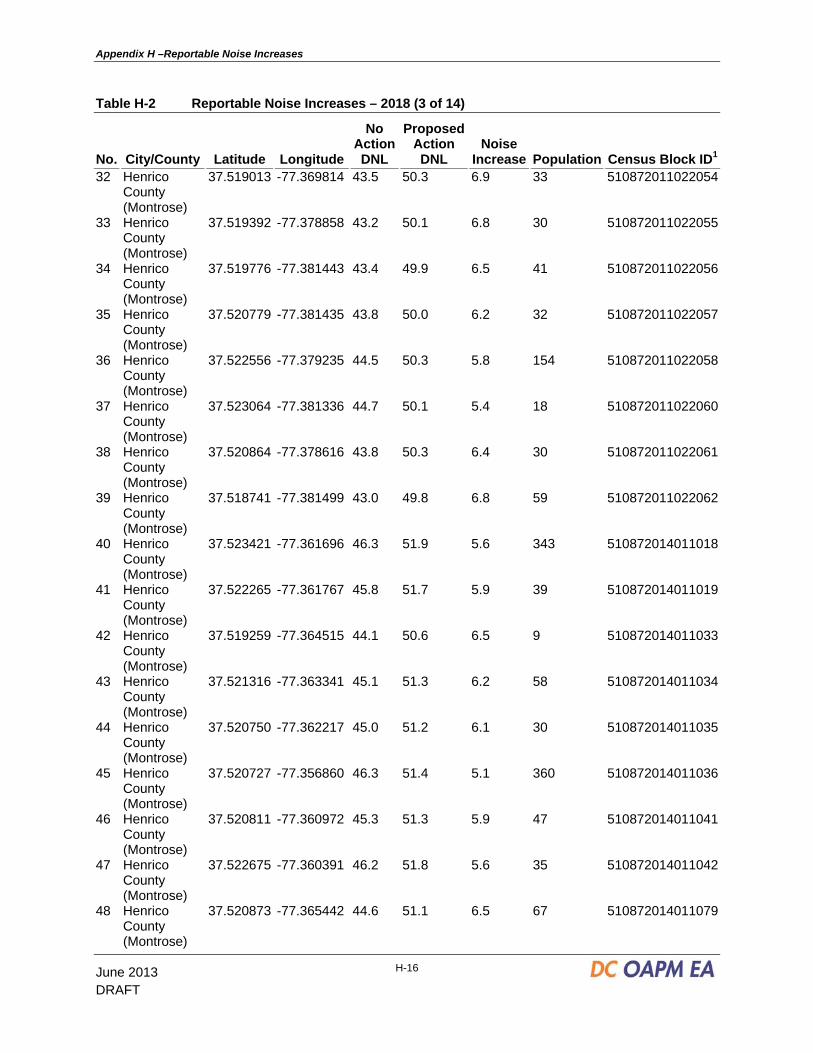
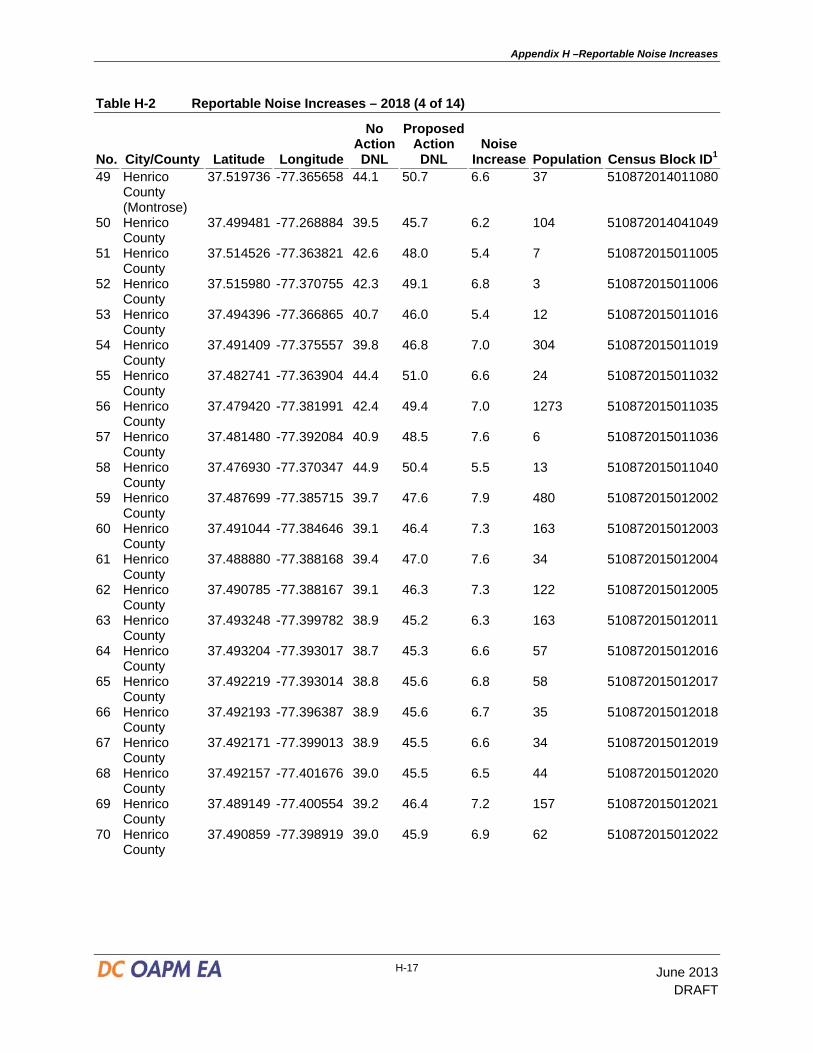
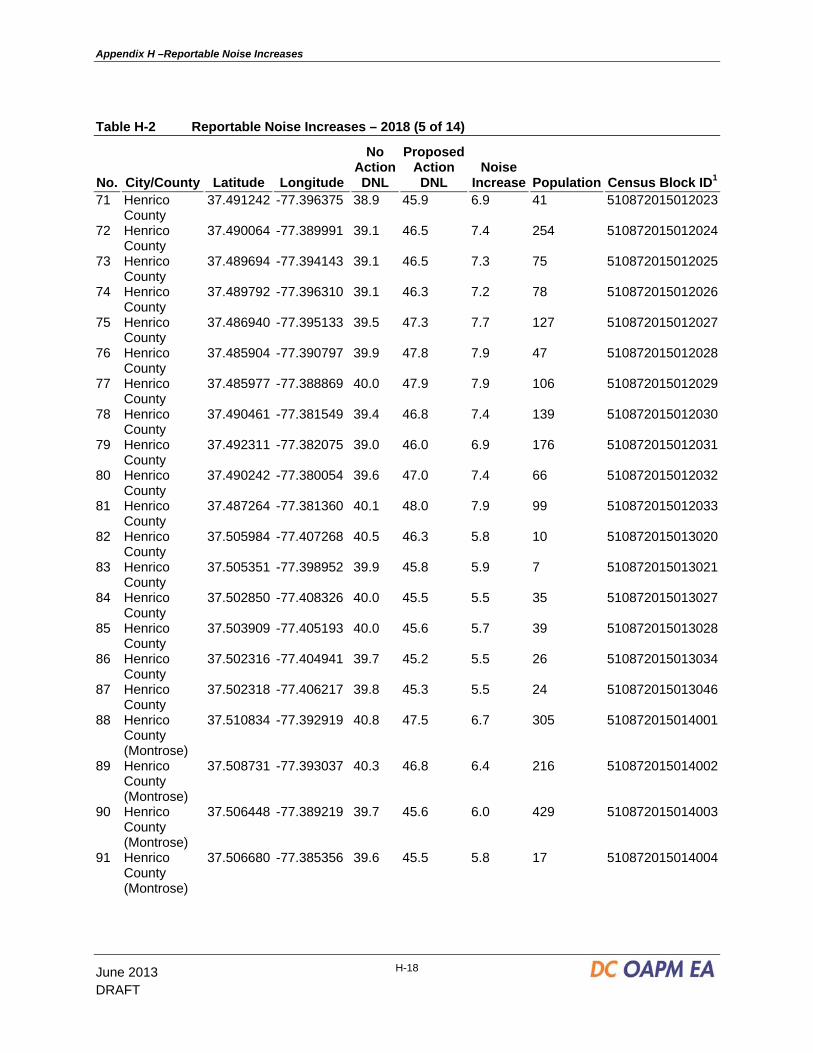
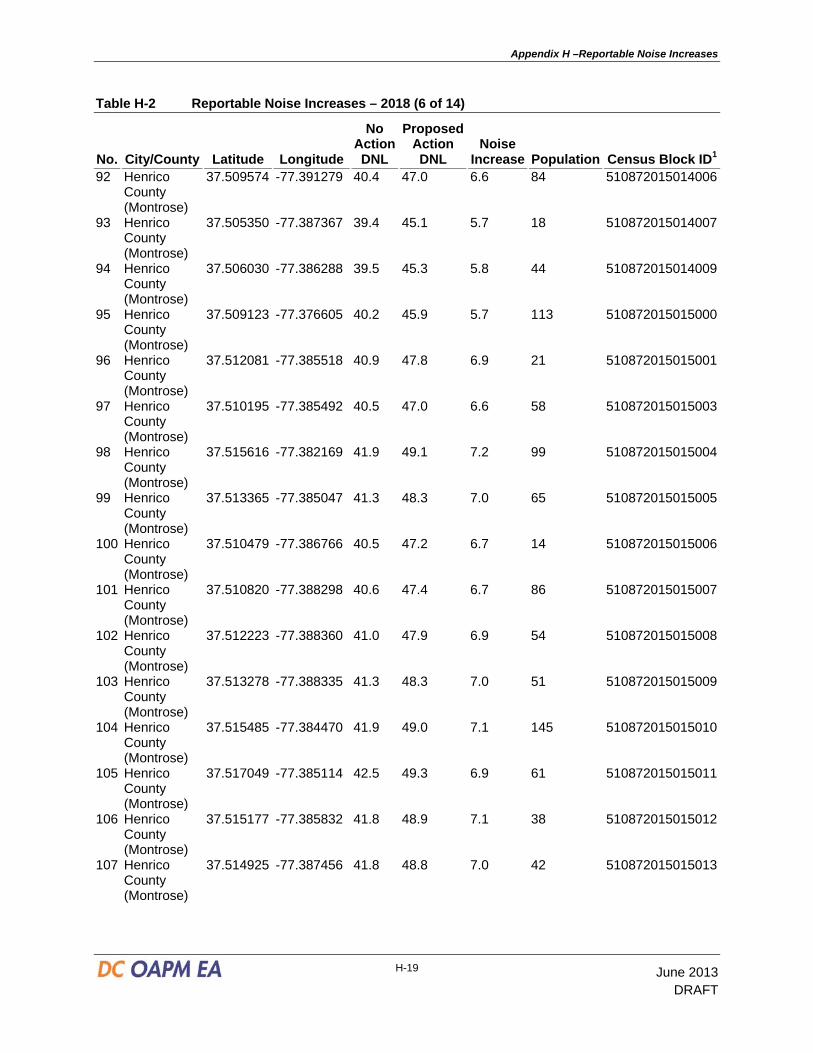
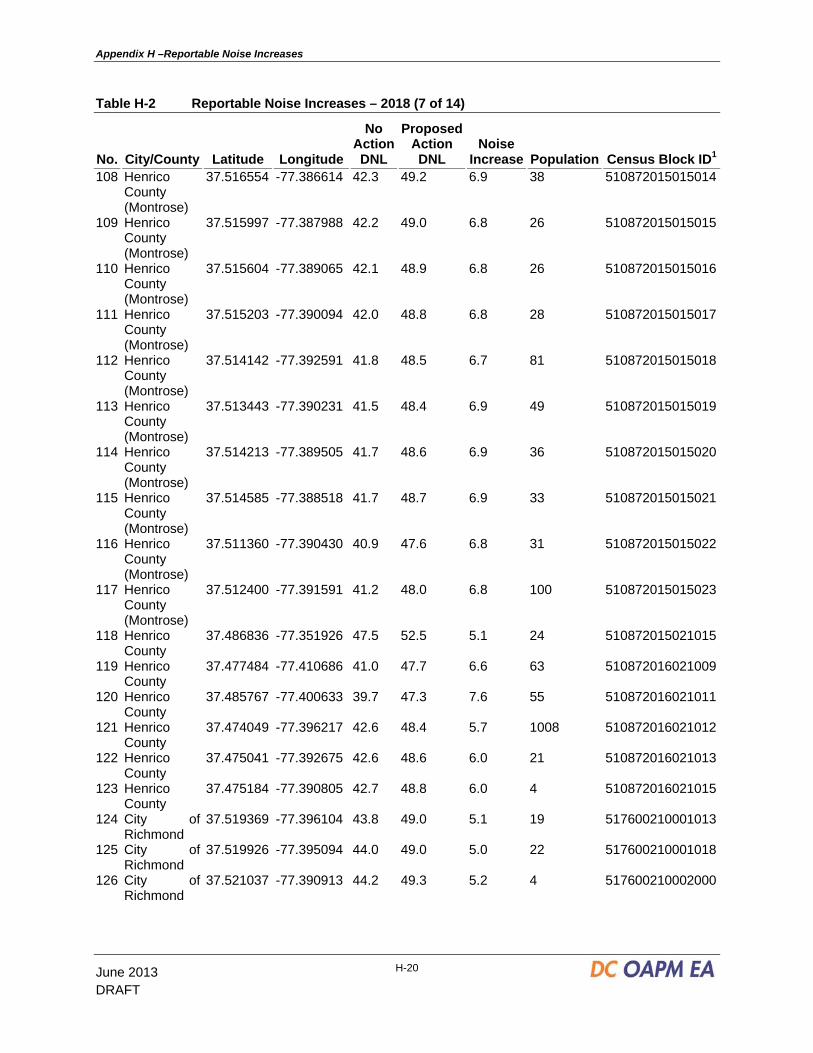
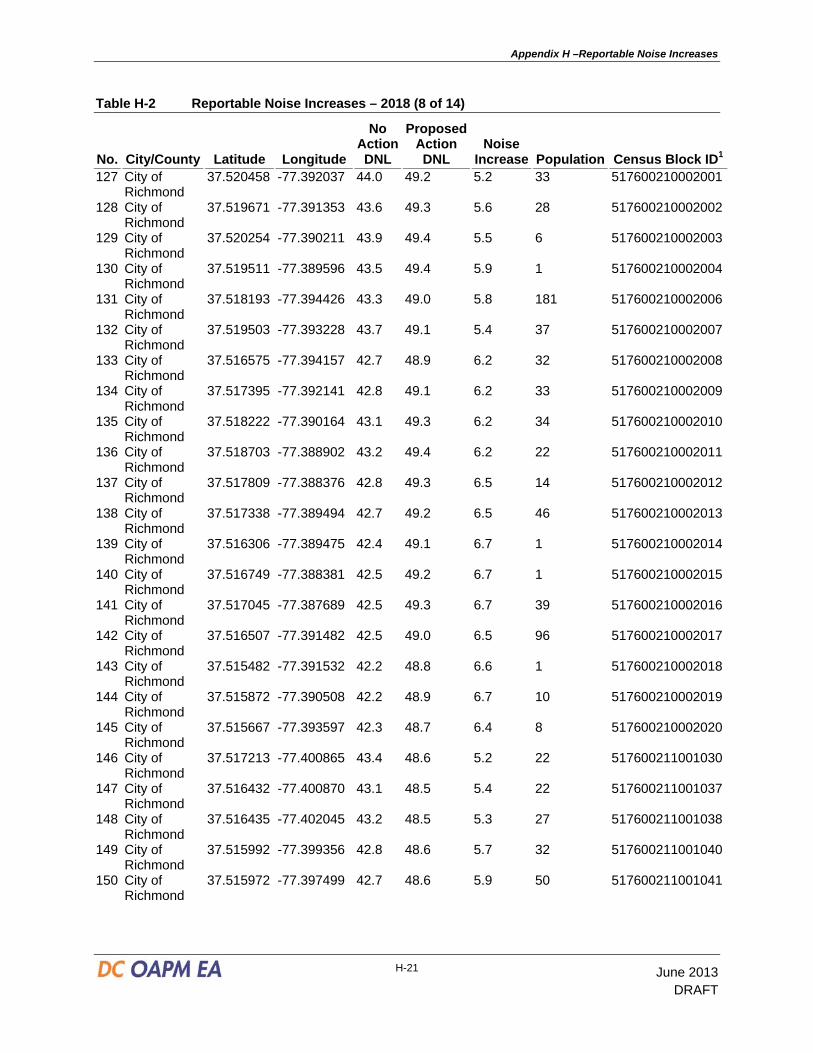
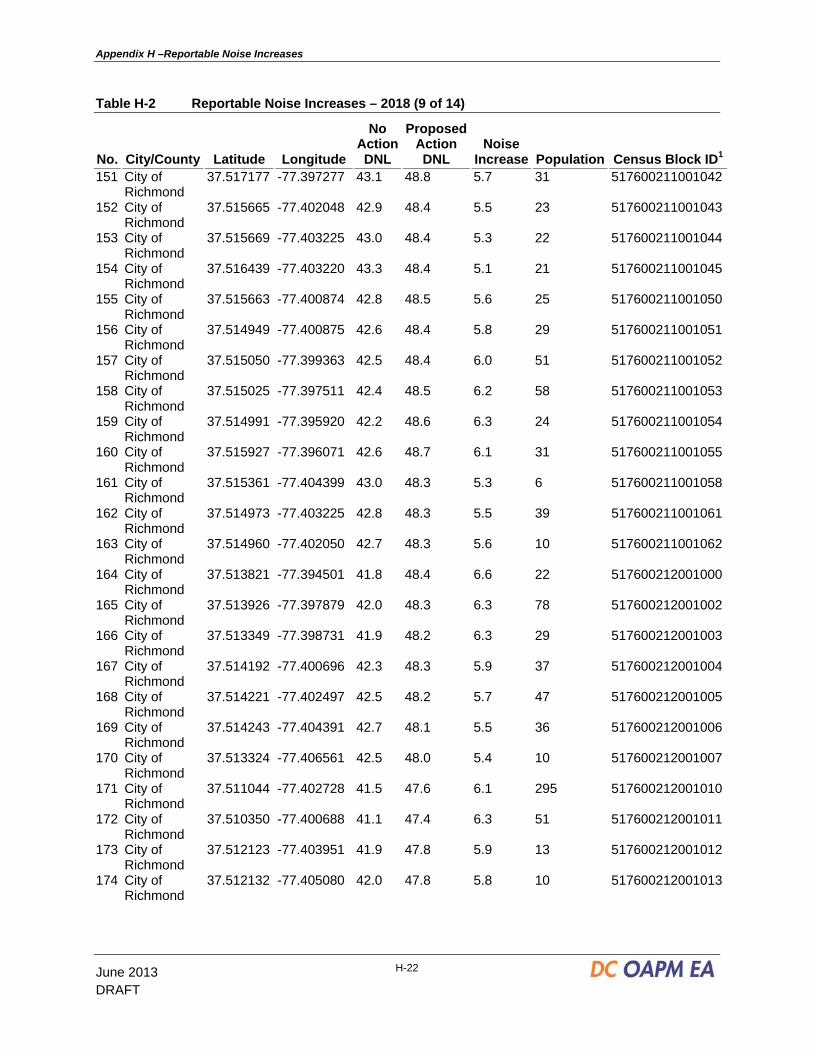
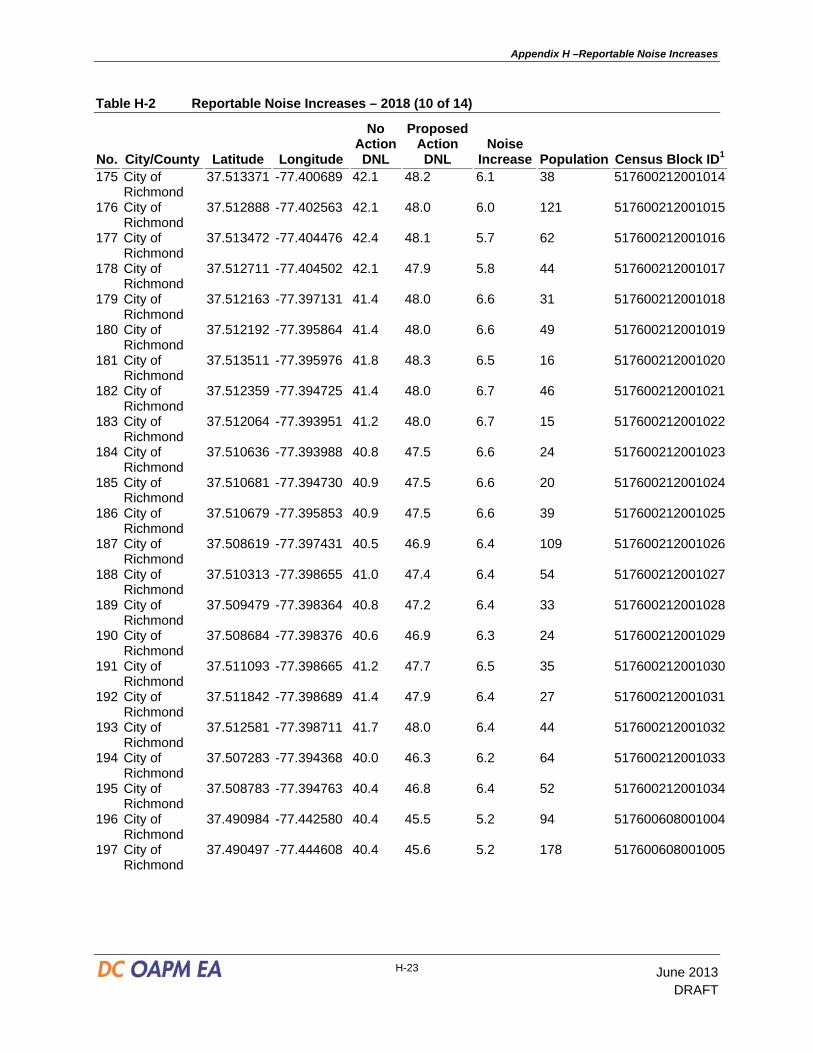
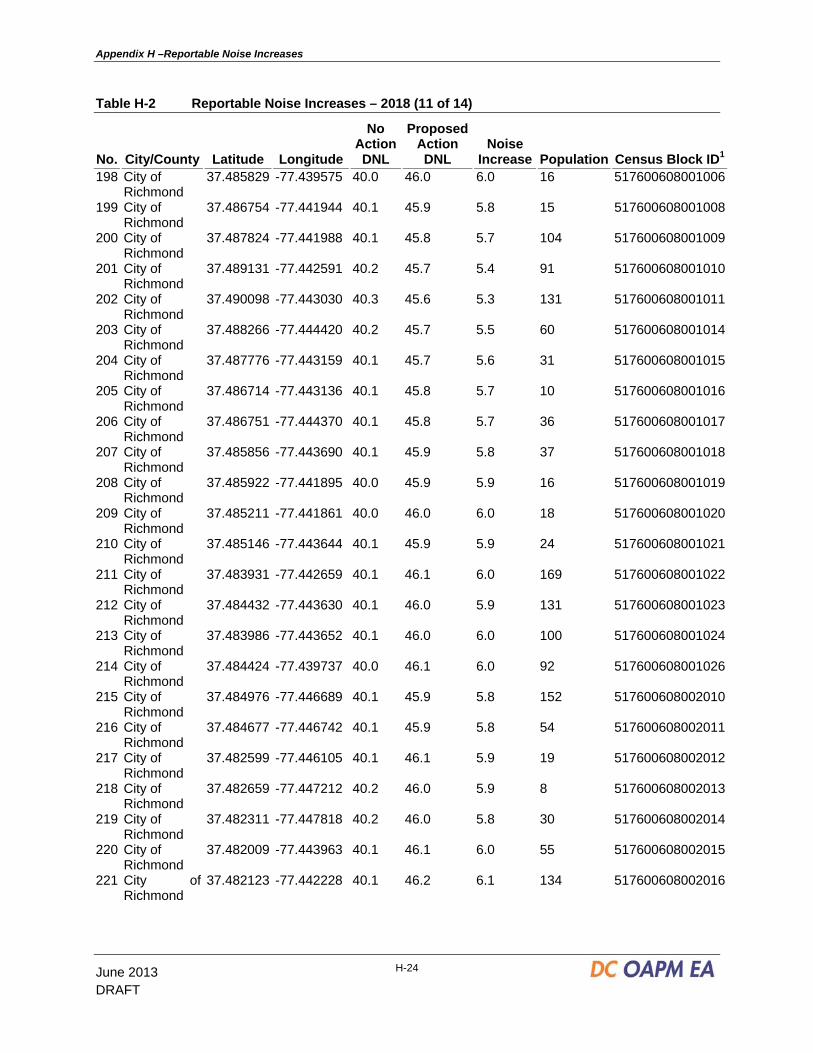
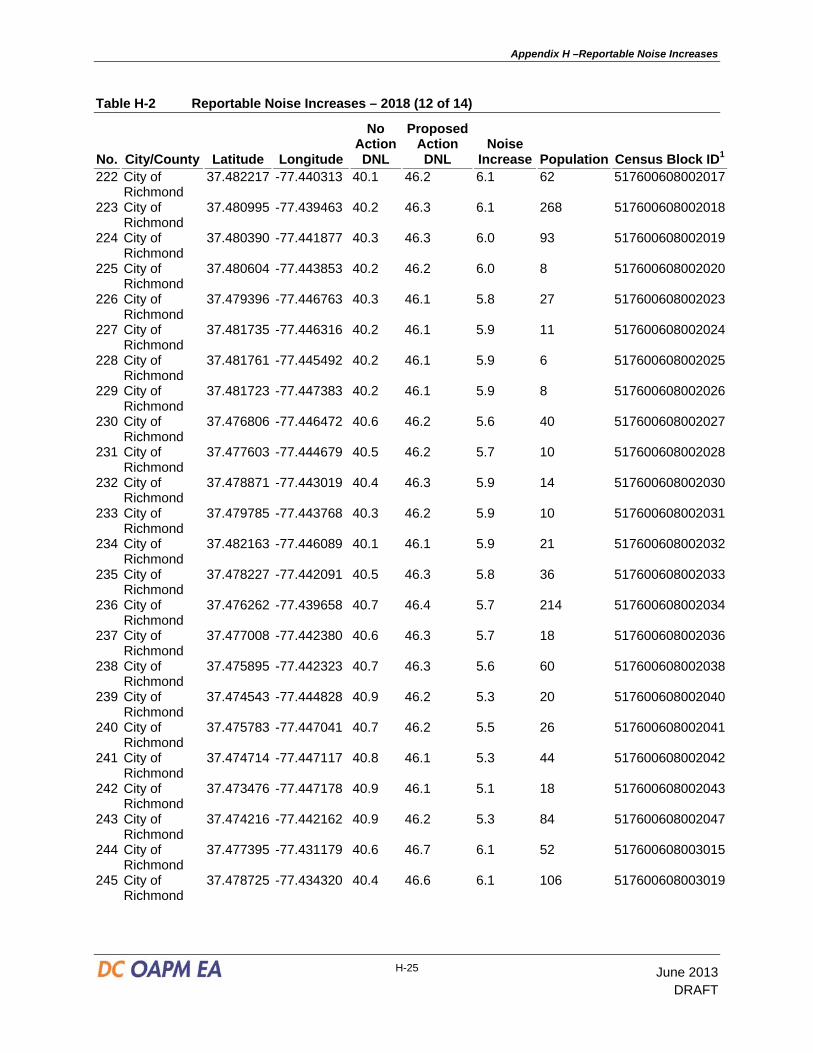
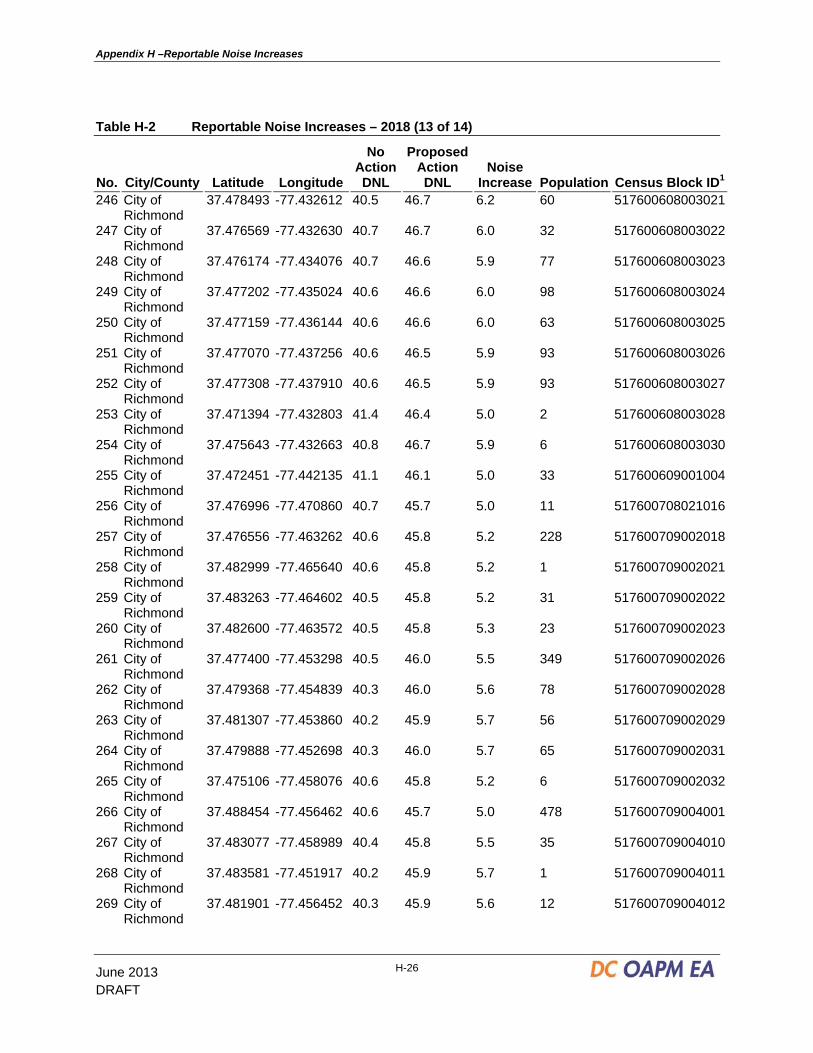
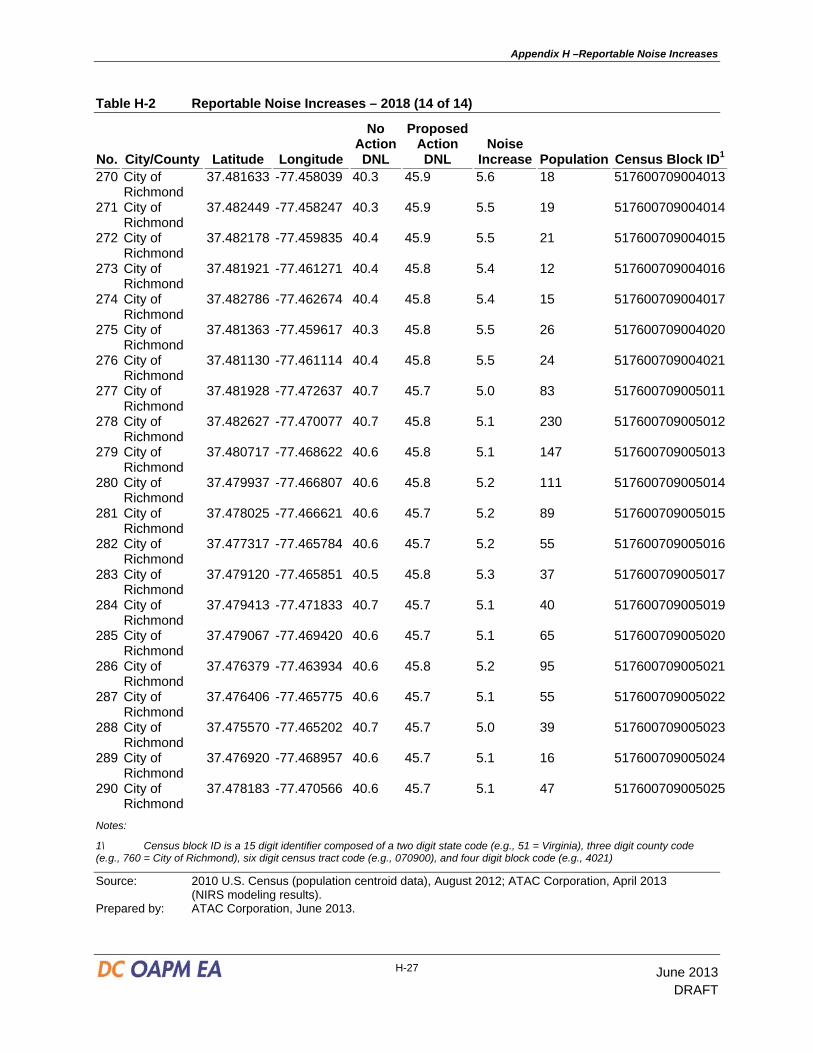
H.2 Reportable Noise Increases - 2018 Table H-2 identifies the U.S. Census blocks that in 2018 would experience a DNL 5 dB or greater increase in areas exposed to DNL between 45 dB and 60 dB under the Proposed Action when compared to the No Action Alternative. Exhibit 5-2 in the Draft Environmental Assessment (EA) identifies the location of the population centroids for each census block. For each affected centroid, Table H-2 provides the location by city/county, the geographical coordinates (latitude and longitude), the calculated DNL under No Action and Proposed Action conditions for 2018, the change in DNL, and the U.S. Census block identification number. As shown in the table, a total of 20,239 people, associated with 290 population centroids would be affected. Of the 290 affected population centroids, 167 centroids, representing 9,002 people are located within the City of Richmond, 79 centroids,
Appendix H –Reportable Noise Increases
June 2013 H-14
DRAFT
representing 5,558 people are located in the community of Montrose, and 44 centroids, representing 5,679 people are located in unincorporated Henrico County.
Table H-2 Reportable Noise Increases – 2018 (1 of 14)
No. City/County Latitude Longitude
No Action DNL
Proposed Action DNL
Noise Increase Population Census Block ID1
1 Henrico County (Montrose)
37.521607 -77.383886 44.1 49.9 5.7 43 510872011021001
2 Henrico County (Montrose)
37.521416 -77.390037 44.3 49.4 5.1 34 510872011021004
3 Henrico County (Montrose)
37.521865 -77.387965 44.4 49.6 5.2 61 510872011021006
4 Henrico County (Montrose)
37.520625 -77.385408 43.8 49.7 5.9 13 510872011021007
5 Henrico County (Montrose)
37.519840 -77.388666 43.6 49.5 5.9 40 510872011021015
6 Henrico County (Montrose)
37.520634 -77.389335 43.9 49.5 5.5 22 510872011021016
7 Henrico County (Montrose)
37.523438 -77.383316 44.9 49.9 5.0 33 510872011021017
8 Henrico County (Montrose)
37.519507 -77.386230 43.4 49.6 6.2 55 510872011021019
9 Henrico County (Montrose)
37.519701 -77.383725 43.4 49.8 6.4 22 510872011021020
10 Henrico County (Montrose)
37.520693 -77.383777 43.8 49.9 6.1 25 510872011021021
11 Henrico County (Montrose)
37.518966 -77.388177 43.2 49.5 6.2 20 510872011021022
12 Henrico County (Montrose)
37.517999 -77.387666 42.9 49.4 6.5 5 510872011021023
13 Henrico County (Montrose)
37.518477 -77.385949 43.0 49.5 6.5 63 510872011021024
14 Henrico County (Montrose)
37.518672 -77.383673 43.0 49.7 6.7 25 510872011021025
15 Henrico County (Montrose)
37.522872 -77.375497 44.7 50.6 6.0 225 510872011022034

Appendix H –Reportable Noise Increases
H-15 June 2013
DRAFT
Table H-2 Reportable Noise Increases – 2018 (2 of 14)
No. City/County Latitude Longitude
No Action DNL
Proposed Action DNL
Noise Increase Population Census Block ID1
16 Henrico County (Montrose)
37.522695 -77.374550 44.6 50.7 6.1 57 510872011022035
17 Henrico County (Montrose)
37.522488 -77.373595 44.6 50.8 6.2 50 510872011022036
18 Henrico County (Montrose)
37.525026 -77.371843 45.8 51.0 5.2 31 510872011022040
19 Henrico County (Montrose)
37.524996 -77.369680 45.9 51.2 5.4 20 510872011022041
20 Henrico County (Montrose)
37.523981 -77.368262 45.6 51.4 5.8 60 510872011022042
21 Henrico County (Montrose)
37.521895 -77.366859 44.8 51.2 6.4 459 510872011022043
22 Henrico County (Montrose)
37.521974 -77.368710 44.7 51.1 6.4 30 510872011022044
23 Henrico County (Montrose)
37.522747 -77.369961 44.9 51.1 6.2 20 510872011022045
24 Henrico County (Montrose)
37.523809 -77.369730 45.4 51.2 5.9 41 510872011022046
25 Henrico County (Montrose)
37.523983 -77.371852 45.3 51.0 5.7 30 510872011022047
26 Henrico County (Montrose)
37.522488 -77.371935 44.7 50.9 6.3 70 510872011022048
27 Henrico County (Montrose)
37.521913 -77.370021 44.6 51.0 6.5 28 510872011022049
28 Henrico County (Montrose)
37.520981 -77.369612 44.2 50.9 6.7 33 510872011022050
29 Henrico County (Montrose)
37.521060 -77.371986 44.1 50.7 6.6 43 510872011022051
30 Henrico County (Montrose)
37.520156 -77.372074 43.7 50.6 6.8 36 510872011022052
31 Henrico County (Montrose)
37.520025 -77.369675 43.8 50.6 6.8 34 510872011022053
Appendix H –Reportable Noise Increases
June 2013 H-16
DRAFT
Table H-2 Reportable Noise Increases – 2018 (3 of 14)
No. City/County Latitude Longitude
No Action DNL
Proposed Action DNL
Noise Increase Population Census Block ID1
32 Henrico County (Montrose)
37.519013 -77.369814 43.5 50.3 6.9 33 510872011022054
33 Henrico County (Montrose)
37.519392 -77.378858 43.2 50.1 6.8 30 510872011022055
34 Henrico County (Montrose)
37.519776 -77.381443 43.4 49.9 6.5 41 510872011022056
35 Henrico County (Montrose)
37.520779 -77.381435 43.8 50.0 6.2 32 510872011022057
36 Henrico County (Montrose)
37.522556 -77.379235 44.5 50.3 5.8 154 510872011022058
37 Henrico County (Montrose)
37.523064 -77.381336 44.7 50.1 5.4 18 510872011022060
38 Henrico County (Montrose)
37.520864 -77.378616 43.8 50.3 6.4 30 510872011022061
39 Henrico County (Montrose)
37.518741 -77.381499 43.0 49.8 6.8 59 510872011022062
40 Henrico County (Montrose)
37.523421 -77.361696 46.3 51.9 5.6 343 510872014011018
41 Henrico County (Montrose)
37.522265 -77.361767 45.8 51.7 5.9 39 510872014011019
42 Henrico County (Montrose)
37.519259 -77.364515 44.1 50.6 6.5 9 510872014011033
43 Henrico County (Montrose)
37.521316 -77.363341 45.1 51.3 6.2 58 510872014011034
44 Henrico County (Montrose)
37.520750 -77.362217 45.0 51.2 6.1 30 510872014011035
45 Henrico County (Montrose)
37.520727 -77.356860 46.3 51.4 5.1 360 510872014011036
46 Henrico County (Montrose)
37.520811 -77.360972 45.3 51.3 5.9 47 510872014011041
47 Henrico County (Montrose)
37.522675 -77.360391 46.2 51.8 5.6 35 510872014011042
48 Henrico County (Montrose)
37.520873 -77.365442 44.6 51.1 6.5 67 510872014011079
Appendix H –Reportable Noise Increases
H-17 June 2013
DRAFT
Table H-2 Reportable Noise Increases – 2018 (4 of 14)
No. City/County Latitude Longitude
No Action DNL
Proposed Action DNL
Noise Increase Population Census Block ID1
49 Henrico County (Montrose)
37.519736 -77.365658 44.1 50.7 6.6 37 510872014011080
50 Henrico County
37.499481 -77.268884 39.5 45.7 6.2 104 510872014041049
51 Henrico County
37.514526 -77.363821 42.6 48.0 5.4 7 510872015011005
52 Henrico County
37.515980 -77.370755 42.3 49.1 6.8 3 510872015011006
53 Henrico County
37.494396 -77.366865 40.7 46.0 5.4 12 510872015011016
54 Henrico County
37.491409 -77.375557 39.8 46.8 7.0 304 510872015011019
55 Henrico County
37.482741 -77.363904 44.4 51.0 6.6 24 510872015011032
56 Henrico County
37.479420 -77.381991 42.4 49.4 7.0 1273 510872015011035
57 Henrico County
37.481480 -77.392084 40.9 48.5 7.6 6 510872015011036
58 Henrico County
37.476930 -77.370347 44.9 50.4 5.5 13 510872015011040
59 Henrico County
37.487699 -77.385715 39.7 47.6 7.9 480 510872015012002
60 Henrico County
37.491044 -77.384646 39.1 46.4 7.3 163 510872015012003
61 Henrico County
37.488880 -77.388168 39.4 47.0 7.6 34 510872015012004
62 Henrico County
37.490785 -77.388167 39.1 46.3 7.3 122 510872015012005
63 Henrico County
37.493248 -77.399782 38.9 45.2 6.3 163 510872015012011
64 Henrico County
37.493204 -77.393017 38.7 45.3 6.6 57 510872015012016
65 Henrico County
37.492219 -77.393014 38.8 45.6 6.8 58 510872015012017
66 Henrico County
37.492193 -77.396387 38.9 45.6 6.7 35 510872015012018
67 Henrico County
37.492171 -77.399013 38.9 45.5 6.6 34 510872015012019
68 Henrico County
37.492157 -77.401676 39.0 45.5 6.5 44 510872015012020
69 Henrico County
37.489149 -77.400554 39.2 46.4 7.2 157 510872015012021
70 Henrico County
37.490859 -77.398919 39.0 45.9 6.9 62 510872015012022
Appendix H –Reportable Noise Increases
June 2013 H-18
DRAFT
Table H-2 Reportable Noise Increases – 2018 (5 of 14)
No. City/County Latitude Longitude
No Action DNL
Proposed Action DNL
Noise Increase Population Census Block ID1
71 Henrico County
37.491242 -77.396375 38.9 45.9 6.9 41 510872015012023
72 Henrico County
37.490064 -77.389991 39.1 46.5 7.4 254 510872015012024
73 Henrico County
37.489694 -77.394143 39.1 46.5 7.3 75 510872015012025
74 Henrico County
37.489792 -77.396310 39.1 46.3 7.2 78 510872015012026
75 Henrico County
37.486940 -77.395133 39.5 47.3 7.7 127 510872015012027
76 Henrico County
37.485904 -77.390797 39.9 47.8 7.9 47 510872015012028
77 Henrico County
37.485977 -77.388869 40.0 47.9 7.9 106 510872015012029
78 Henrico County
37.490461 -77.381549 39.4 46.8 7.4 139 510872015012030
79 Henrico County
37.492311 -77.382075 39.0 46.0 6.9 176 510872015012031
80 Henrico County
37.490242 -77.380054 39.6 47.0 7.4 66 510872015012032
81 Henrico County
37.487264 -77.381360 40.1 48.0 7.9 99 510872015012033
82 Henrico County
37.505984 -77.407268 40.5 46.3 5.8 10 510872015013020
83 Henrico County
37.505351 -77.398952 39.9 45.8 5.9 7 510872015013021
84 Henrico County
37.502850 -77.408326 40.0 45.5 5.5 35 510872015013027
85 Henrico County
37.503909 -77.405193 40.0 45.6 5.7 39 510872015013028
86 Henrico County
37.502316 -77.404941 39.7 45.2 5.5 26 510872015013034
87 Henrico County
37.502318 -77.406217 39.8 45.3 5.5 24 510872015013046
88 Henrico County (Montrose)
37.510834 -77.392919 40.8 47.5 6.7 305 510872015014001
89 Henrico County (Montrose)
37.508731 -77.393037 40.3 46.8 6.4 216 510872015014002
90 Henrico County (Montrose)
37.506448 -77.389219 39.7 45.6 6.0 429 510872015014003
91 Henrico County (Montrose)
37.506680 -77.385356 39.6 45.5 5.8 17 510872015014004
Appendix H –Reportable Noise Increases
H-19 June 2013
DRAFT
Table H-2 Reportable Noise Increases – 2018 (6 of 14)
No. City/County Latitude Longitude
No Action DNL
Proposed Action DNL
Noise Increase Population Census Block ID1
92 Henrico County (Montrose)
37.509574 -77.391279 40.4 47.0 6.6 84 510872015014006
93 Henrico County (Montrose)
37.505350 -77.387367 39.4 45.1 5.7 18 510872015014007
94 Henrico County (Montrose)
37.506030 -77.386288 39.5 45.3 5.8 44 510872015014009
95 Henrico County (Montrose)
37.509123 -77.376605 40.2 45.9 5.7 113 510872015015000
96 Henrico County (Montrose)
37.512081 -77.385518 40.9 47.8 6.9 21 510872015015001
97 Henrico County (Montrose)
37.510195 -77.385492 40.5 47.0 6.6 58 510872015015003
98 Henrico County (Montrose)
37.515616 -77.382169 41.9 49.1 7.2 99 510872015015004
99 Henrico County (Montrose)
37.513365 -77.385047 41.3 48.3 7.0 65 510872015015005
100 Henrico County (Montrose)
37.510479 -77.386766 40.5 47.2 6.7 14 510872015015006
101 Henrico County (Montrose)
37.510820 -77.388298 40.6 47.4 6.7 86 510872015015007
102 Henrico County (Montrose)
37.512223 -77.388360 41.0 47.9 6.9 54 510872015015008
103 Henrico County (Montrose)
37.513278 -77.388335 41.3 48.3 7.0 51 510872015015009
104 Henrico County (Montrose)
37.515485 -77.384470 41.9 49.0 7.1 145 510872015015010
105 Henrico County (Montrose)
37.517049 -77.385114 42.5 49.3 6.9 61 510872015015011
106 Henrico County (Montrose)
37.515177 -77.385832 41.8 48.9 7.1 38 510872015015012
107 Henrico County (Montrose)
37.514925 -77.387456 41.8 48.8 7.0 42 510872015015013
Appendix H –Reportable Noise Increases
June 2013 H-20
DRAFT
Table H-2 Reportable Noise Increases – 2018 (7 of 14)
No. City/County Latitude Longitude
No Action DNL
Proposed Action DNL
Noise Increase Population Census Block ID1
108 Henrico County (Montrose)
37.516554 -77.386614 42.3 49.2 6.9 38 510872015015014
109 Henrico County (Montrose)
37.515997 -77.387988 42.2 49.0 6.8 26 510872015015015
110 Henrico County (Montrose)
37.515604 -77.389065 42.1 48.9 6.8 26 510872015015016
111 Henrico County (Montrose)
37.515203 -77.390094 42.0 48.8 6.8 28 510872015015017
112 Henrico County (Montrose)
37.514142 -77.392591 41.8 48.5 6.7 81 510872015015018
113 Henrico County (Montrose)
37.513443 -77.390231 41.5 48.4 6.9 49 510872015015019
114 Henrico County (Montrose)
37.514213 -77.389505 41.7 48.6 6.9 36 510872015015020
115 Henrico County (Montrose)
37.514585 -77.388518 41.7 48.7 6.9 33 510872015015021
116 Henrico County (Montrose)
37.511360 -77.390430 40.9 47.6 6.8 31 510872015015022
117 Henrico County (Montrose)
37.512400 -77.391591 41.2 48.0 6.8 100 510872015015023
118 Henrico County
37.486836 -77.351926 47.5 52.5 5.1 24 510872015021015
119 Henrico County
37.477484 -77.410686 41.0 47.7 6.6 63 510872016021009
120 Henrico County
37.485767 -77.400633 39.7 47.3 7.6 55 510872016021011
121 Henrico County
37.474049 -77.396217 42.6 48.4 5.7 1008 510872016021012
122 Henrico County
37.475041 -77.392675 42.6 48.6 6.0 21 510872016021013
123 Henrico County
37.475184 -77.390805 42.7 48.8 6.0 4 510872016021015
124 City of Richmond
37.519369 -77.396104 43.8 49.0 5.1 19 517600210001013
125 City of Richmond
37.519926 -77.395094 44.0 49.0 5.0 22 517600210001018
126 City of Richmond
37.521037 -77.390913 44.2 49.3 5.2 4 517600210002000
Appendix H –Reportable Noise Increases
H-21 June 2013
DRAFT
Table H-2 Reportable Noise Increases – 2018 (8 of 14)
No. City/County Latitude Longitude
No Action DNL
Proposed Action DNL
Noise Increase Population Census Block ID1
127 City of Richmond
37.520458 -77.392037 44.0 49.2 5.2 33 517600210002001
128 City of Richmond
37.519671 -77.391353 43.6 49.3 5.6 28 517600210002002
129 City of Richmond
37.520254 -77.390211 43.9 49.4 5.5 6 517600210002003
130 City of Richmond
37.519511 -77.389596 43.5 49.4 5.9 1 517600210002004
131 City of Richmond
37.518193 -77.394426 43.3 49.0 5.8 181 517600210002006
132 City of Richmond
37.519503 -77.393228 43.7 49.1 5.4 37 517600210002007
133 City of Richmond
37.516575 -77.394157 42.7 48.9 6.2 32 517600210002008
134 City of Richmond
37.517395 -77.392141 42.8 49.1 6.2 33 517600210002009
135 City of Richmond
37.518222 -77.390164 43.1 49.3 6.2 34 517600210002010
136 City of Richmond
37.518703 -77.388902 43.2 49.4 6.2 22 517600210002011
137 City of Richmond
37.517809 -77.388376 42.8 49.3 6.5 14 517600210002012
138 City of Richmond
37.517338 -77.389494 42.7 49.2 6.5 46 517600210002013
139 City of Richmond
37.516306 -77.389475 42.4 49.1 6.7 1 517600210002014
140 City of Richmond
37.516749 -77.388381 42.5 49.2 6.7 1 517600210002015
141 City of Richmond
37.517045 -77.387689 42.5 49.3 6.7 39 517600210002016
142 City of Richmond
37.516507 -77.391482 42.5 49.0 6.5 96 517600210002017
143 City of Richmond
37.515482 -77.391532 42.2 48.8 6.6 1 517600210002018
144 City of Richmond
37.515872 -77.390508 42.2 48.9 6.7 10 517600210002019
145 City of Richmond
37.515667 -77.393597 42.3 48.7 6.4 8 517600210002020
146 City of Richmond
37.517213 -77.400865 43.4 48.6 5.2 22 517600211001030
147 City of Richmond
37.516432 -77.400870 43.1 48.5 5.4 22 517600211001037
148 City of Richmond
37.516435 -77.402045 43.2 48.5 5.3 27 517600211001038
149 City of Richmond
37.515992 -77.399356 42.8 48.6 5.7 32 517600211001040
150 City of Richmond
37.515972 -77.397499 42.7 48.6 5.9 50 517600211001041
Appendix H –Reportable Noise Increases
June 2013 H-22
DRAFT
Table H-2 Reportable Noise Increases – 2018 (9 of 14)
No. City/County Latitude Longitude
No Action DNL
Proposed Action DNL
Noise Increase Population Census Block ID1
151 City of Richmond
37.517177 -77.397277 43.1 48.8 5.7 31 517600211001042
152 City of Richmond
37.515665 -77.402048 42.9 48.4 5.5 23 517600211001043
153 City of Richmond
37.515669 -77.403225 43.0 48.4 5.3 22 517600211001044
154 City of Richmond
37.516439 -77.403220 43.3 48.4 5.1 21 517600211001045
155 City of Richmond
37.515663 -77.400874 42.8 48.5 5.6 25 517600211001050
156 City of Richmond
37.514949 -77.400875 42.6 48.4 5.8 29 517600211001051
157 City of Richmond
37.515050 -77.399363 42.5 48.4 6.0 51 517600211001052
158 City of Richmond
37.515025 -77.397511 42.4 48.5 6.2 58 517600211001053
159 City of Richmond
37.514991 -77.395920 42.2 48.6 6.3 24 517600211001054
160 City of Richmond
37.515927 -77.396071 42.6 48.7 6.1 31 517600211001055
161 City of Richmond
37.515361 -77.404399 43.0 48.3 5.3 6 517600211001058
162 City of Richmond
37.514973 -77.403225 42.8 48.3 5.5 39 517600211001061
163 City of Richmond
37.514960 -77.402050 42.7 48.3 5.6 10 517600211001062
164 City of Richmond
37.513821 -77.394501 41.8 48.4 6.6 22 517600212001000
165 City of Richmond
37.513926 -77.397879 42.0 48.3 6.3 78 517600212001002
166 City of Richmond
37.513349 -77.398731 41.9 48.2 6.3 29 517600212001003
167 City of Richmond
37.514192 -77.400696 42.3 48.3 5.9 37 517600212001004
168 City of Richmond
37.514221 -77.402497 42.5 48.2 5.7 47 517600212001005
169 City of Richmond
37.514243 -77.404391 42.7 48.1 5.5 36 517600212001006
170 City of Richmond
37.513324 -77.406561 42.5 48.0 5.4 10 517600212001007
171 City of Richmond
37.511044 -77.402728 41.5 47.6 6.1 295 517600212001010
172 City of Richmond
37.510350 -77.400688 41.1 47.4 6.3 51 517600212001011
173 City of Richmond
37.512123 -77.403951 41.9 47.8 5.9 13 517600212001012
174 City of Richmond
37.512132 -77.405080 42.0 47.8 5.8 10 517600212001013
Appendix H –Reportable Noise Increases
H-23 June 2013
DRAFT
Table H-2 Reportable Noise Increases – 2018 (10 of 14)
No. City/County Latitude Longitude
No Action DNL
Proposed Action DNL
Noise Increase Population Census Block ID1
175 City of Richmond
37.513371 -77.400689 42.1 48.2 6.1 38 517600212001014
176 City of Richmond
37.512888 -77.402563 42.1 48.0 6.0 121 517600212001015
177 City of Richmond
37.513472 -77.404476 42.4 48.1 5.7 62 517600212001016
178 City of Richmond
37.512711 -77.404502 42.1 47.9 5.8 44 517600212001017
179 City of Richmond
37.512163 -77.397131 41.4 48.0 6.6 31 517600212001018
180 City of Richmond
37.512192 -77.395864 41.4 48.0 6.6 49 517600212001019
181 City of Richmond
37.513511 -77.395976 41.8 48.3 6.5 16 517600212001020
182 City of Richmond
37.512359 -77.394725 41.4 48.0 6.7 46 517600212001021
183 City of Richmond
37.512064 -77.393951 41.2 48.0 6.7 15 517600212001022
184 City of Richmond
37.510636 -77.393988 40.8 47.5 6.6 24 517600212001023
185 City of Richmond
37.510681 -77.394730 40.9 47.5 6.6 20 517600212001024
186 City of Richmond
37.510679 -77.395853 40.9 47.5 6.6 39 517600212001025
187 City of Richmond
37.508619 -77.397431 40.5 46.9 6.4 109 517600212001026
188 City of Richmond
37.510313 -77.398655 41.0 47.4 6.4 54 517600212001027
189 City of Richmond
37.509479 -77.398364 40.8 47.2 6.4 33 517600212001028
190 City of Richmond
37.508684 -77.398376 40.6 46.9 6.3 24 517600212001029
191 City of Richmond
37.511093 -77.398665 41.2 47.7 6.5 35 517600212001030
192 City of Richmond
37.511842 -77.398689 41.4 47.9 6.4 27 517600212001031
193 City of Richmond
37.512581 -77.398711 41.7 48.0 6.4 44 517600212001032
194 City of Richmond
37.507283 -77.394368 40.0 46.3 6.2 64 517600212001033
195 City of Richmond
37.508783 -77.394763 40.4 46.8 6.4 52 517600212001034
196 City of Richmond
37.490984 -77.442580 40.4 45.5 5.2 94 517600608001004
197 City of Richmond
37.490497 -77.444608 40.4 45.6 5.2 178 517600608001005
Appendix H –Reportable Noise Increases
June 2013 H-24
DRAFT
Table H-2 Reportable Noise Increases – 2018 (11 of 14)
No. City/County Latitude Longitude
No Action DNL
Proposed Action DNL
Noise Increase Population Census Block ID1
198 City of Richmond
37.485829 -77.439575 40.0 46.0 6.0 16 517600608001006
199 City of Richmond
37.486754 -77.441944 40.1 45.9 5.8 15 517600608001008
200 City of Richmond
37.487824 -77.441988 40.1 45.8 5.7 104 517600608001009
201 City of Richmond
37.489131 -77.442591 40.2 45.7 5.4 91 517600608001010
202 City of Richmond
37.490098 -77.443030 40.3 45.6 5.3 131 517600608001011
203 City of Richmond
37.488266 -77.444420 40.2 45.7 5.5 60 517600608001014
204 City of Richmond
37.487776 -77.443159 40.1 45.7 5.6 31 517600608001015
205 City of Richmond
37.486714 -77.443136 40.1 45.8 5.7 10 517600608001016
206 City of Richmond
37.486751 -77.444370 40.1 45.8 5.7 36 517600608001017
207 City of Richmond
37.485856 -77.443690 40.1 45.9 5.8 37 517600608001018
208 City of Richmond
37.485922 -77.441895 40.0 45.9 5.9 16 517600608001019
209 City of Richmond
37.485211 -77.441861 40.0 46.0 6.0 18 517600608001020
210 City of Richmond
37.485146 -77.443644 40.1 45.9 5.9 24 517600608001021
211 City of Richmond
37.483931 -77.442659 40.1 46.1 6.0 169 517600608001022
212 City of Richmond
37.484432 -77.443630 40.1 46.0 5.9 131 517600608001023
213 City of Richmond
37.483986 -77.443652 40.1 46.0 6.0 100 517600608001024
214 City of Richmond
37.484424 -77.439737 40.0 46.1 6.0 92 517600608001026
215 City of Richmond
37.484976 -77.446689 40.1 45.9 5.8 152 517600608002010
216 City of Richmond
37.484677 -77.446742 40.1 45.9 5.8 54 517600608002011
217 City of Richmond
37.482599 -77.446105 40.1 46.1 5.9 19 517600608002012
218 City of Richmond
37.482659 -77.447212 40.2 46.0 5.9 8 517600608002013
219 City of Richmond
37.482311 -77.447818 40.2 46.0 5.8 30 517600608002014
220 City of Richmond
37.482009 -77.443963 40.1 46.1 6.0 55 517600608002015
221 City of Richmond
37.482123 -77.442228 40.1 46.2 6.1 134 517600608002016
Appendix H –Reportable Noise Increases
H-25 June 2013
DRAFT
Table H-2 Reportable Noise Increases – 2018 (12 of 14)
No. City/County Latitude Longitude
No Action DNL
Proposed Action DNL
Noise Increase Population Census Block ID1
222 City of Richmond
37.482217 -77.440313 40.1 46.2 6.1 62 517600608002017
223 City of Richmond
37.480995 -77.439463 40.2 46.3 6.1 268 517600608002018
224 City of Richmond
37.480390 -77.441877 40.3 46.3 6.0 93 517600608002019
225 City of Richmond
37.480604 -77.443853 40.2 46.2 6.0 8 517600608002020
226 City of Richmond
37.479396 -77.446763 40.3 46.1 5.8 27 517600608002023
227 City of Richmond
37.481735 -77.446316 40.2 46.1 5.9 11 517600608002024
228 City of Richmond
37.481761 -77.445492 40.2 46.1 5.9 6 517600608002025
229 City of Richmond
37.481723 -77.447383 40.2 46.1 5.9 8 517600608002026
230 City of Richmond
37.476806 -77.446472 40.6 46.2 5.6 40 517600608002027
231 City of Richmond
37.477603 -77.444679 40.5 46.2 5.7 10 517600608002028
232 City of Richmond
37.478871 -77.443019 40.4 46.3 5.9 14 517600608002030
233 City of Richmond
37.479785 -77.443768 40.3 46.2 5.9 10 517600608002031
234 City of Richmond
37.482163 -77.446089 40.1 46.1 5.9 21 517600608002032
235 City of Richmond
37.478227 -77.442091 40.5 46.3 5.8 36 517600608002033
236 City of Richmond
37.476262 -77.439658 40.7 46.4 5.7 214 517600608002034
237 City of Richmond
37.477008 -77.442380 40.6 46.3 5.7 18 517600608002036
238 City of Richmond
37.475895 -77.442323 40.7 46.3 5.6 60 517600608002038
239 City of Richmond
37.474543 -77.444828 40.9 46.2 5.3 20 517600608002040
240 City of Richmond
37.475783 -77.447041 40.7 46.2 5.5 26 517600608002041
241 City of Richmond
37.474714 -77.447117 40.8 46.1 5.3 44 517600608002042
242 City of Richmond
37.473476 -77.447178 40.9 46.1 5.1 18 517600608002043
243 City of Richmond
37.474216 -77.442162 40.9 46.2 5.3 84 517600608002047
244 City of Richmond
37.477395 -77.431179 40.6 46.7 6.1 52 517600608003015
245 City of Richmond
37.478725 -77.434320 40.4 46.6 6.1 106 517600608003019
Appendix H –Reportable Noise Increases
June 2013 H-26
DRAFT
Table H-2 Reportable Noise Increases – 2018 (13 of 14)
No. City/County Latitude Longitude
No Action DNL
Proposed Action DNL
Noise Increase Population Census Block ID1
246 City of Richmond
37.478493 -77.432612 40.5 46.7 6.2 60 517600608003021
247 City of Richmond
37.476569 -77.432630 40.7 46.7 6.0 32 517600608003022
248 City of Richmond
37.476174 -77.434076 40.7 46.6 5.9 77 517600608003023
249 City of Richmond
37.477202 -77.435024 40.6 46.6 6.0 98 517600608003024
250 City of Richmond
37.477159 -77.436144 40.6 46.6 6.0 63 517600608003025
251 City of Richmond
37.477070 -77.437256 40.6 46.5 5.9 93 517600608003026
252 City of Richmond
37.477308 -77.437910 40.6 46.5 5.9 93 517600608003027
253 City of Richmond
37.471394 -77.432803 41.4 46.4 5.0 2 517600608003028
254 City of Richmond
37.475643 -77.432663 40.8 46.7 5.9 6 517600608003030
255 City of Richmond
37.472451 -77.442135 41.1 46.1 5.0 33 517600609001004
256 City of Richmond
37.476996 -77.470860 40.7 45.7 5.0 11 517600708021016
257 City of Richmond
37.476556 -77.463262 40.6 45.8 5.2 228 517600709002018
258 City of Richmond
37.482999 -77.465640 40.6 45.8 5.2 1 517600709002021
259 City of Richmond
37.483263 -77.464602 40.5 45.8 5.2 31 517600709002022
260 City of Richmond
37.482600 -77.463572 40.5 45.8 5.3 23 517600709002023
261 City of Richmond
37.477400 -77.453298 40.5 46.0 5.5 349 517600709002026
262 City of Richmond
37.479368 -77.454839 40.3 46.0 5.6 78 517600709002028
263 City of Richmond
37.481307 -77.453860 40.2 45.9 5.7 56 517600709002029
264 City of Richmond
37.479888 -77.452698 40.3 46.0 5.7 65 517600709002031
265 City of Richmond
37.475106 -77.458076 40.6 45.8 5.2 6 517600709002032
266 City of Richmond
37.488454 -77.456462 40.6 45.7 5.0 478 517600709004001
267 City of Richmond
37.483077 -77.458989 40.4 45.8 5.5 35 517600709004010
268 City of Richmond
37.483581 -77.451917 40.2 45.9 5.7 1 517600709004011
269 City of Richmond
37.481901 -77.456452 40.3 45.9 5.6 12 517600709004012
Appendix H –Reportable Noise Increases
H-27 June 2013
DRAFT
Table H-2 Reportable Noise Increases – 2018 (14 of 14)
No. City/County Latitude Longitude
No Action DNL
Proposed Action DNL
Noise Increase Population Census Block ID1
270 City of Richmond
37.481633 -77.458039 40.3 45.9 5.6 18 517600709004013
271 City of Richmond
37.482449 -77.458247 40.3 45.9 5.5 19 517600709004014
272 City of Richmond
37.482178 -77.459835 40.4 45.9 5.5 21 517600709004015
273 City of Richmond
37.481921 -77.461271 40.4 45.8 5.4 12 517600709004016
274 City of Richmond
37.482786 -77.462674 40.4 45.8 5.4 15 517600709004017
275 City of Richmond
37.481363 -77.459617 40.3 45.8 5.5 26 517600709004020
276 City of Richmond
37.481130 -77.461114 40.4 45.8 5.5 24 517600709004021
277 City of Richmond
37.481928 -77.472637 40.7 45.7 5.0 83 517600709005011
278 City of Richmond
37.482627 -77.470077 40.7 45.8 5.1 230 517600709005012
279 City of Richmond
37.480717 -77.468622 40.6 45.8 5.1 147 517600709005013
280 City of Richmond
37.479937 -77.466807 40.6 45.8 5.2 111 517600709005014
281 City of Richmond
37.478025 -77.466621 40.6 45.7 5.2 89 517600709005015
282 City of Richmond
37.477317 -77.465784 40.6 45.7 5.2 55 517600709005016
283 City of Richmond
37.479120 -77.465851 40.5 45.8 5.3 37 517600709005017
284 City of Richmond
37.479413 -77.471833 40.7 45.7 5.1 40 517600709005019
285 City of Richmond
37.479067 -77.469420 40.6 45.7 5.1 65 517600709005020
286 City of Richmond
37.476379 -77.463934 40.6 45.8 5.2 95 517600709005021
287 City of Richmond
37.476406 -77.465775 40.6 45.7 5.1 55 517600709005022
288 City of Richmond
37.475570 -77.465202 40.7 45.7 5.0 39 517600709005023
289 City of Richmond
37.476920 -77.468957 40.6 45.7 5.1 16 517600709005024
290 City of Richmond
37.478183 -77.470566 40.6 45.7 5.1 47 517600709005025
Notes:
1\ Census block ID is a 15 digit identifier composed of a two digit state code (e.g., 51 = Virginia), three digit county code (e.g., 760 = City of Richmond), six digit census tract code (e.g., 070900), and four digit block code (e.g., 4021)
Source: 2010 U.S. Census (population centroid data), August 2012; ATAC Corporation, April 2013 (NIRS modeling results).
Prepared by: ATAC Corporation, June 2013.
Appendix H –Reportable Noise Increases
June 2013 H-28
DRAFT
THIS PAGE INTENTIONALLY LEFT BLANK
Recommended