GUS: 0262Fundamentals of GIS
Lecture Presentation 6:
Raster Data Model
Jeremy Mennis
Department of Geography and Urban Studies
Temple University

• A raster representation is composed a series of layers, each with a theme
• Typically used to represent ‘field-like’ geographic phenomena
Raster Data Model

Regular Tessellations
Squares Triangles Hexagons

Irregular Tessellations
Raster Grid
– but most common raster is composed of squares, called grid cells
– grid cells are analogous to pixels in remote sensing images and computer graphics

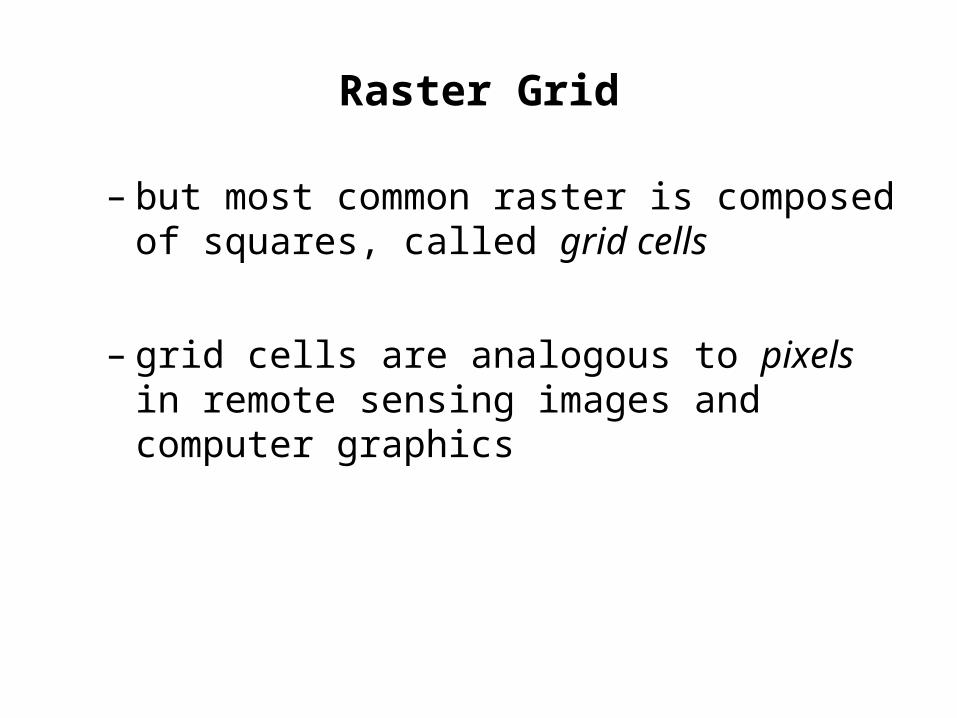
Raster Resolution
The distance that one side of a grid cell represents on the ground
1
22
4
4
1
1
4
4
1
1
2
4
4
1
2
3
3
3
3
2
2
2
2
2
= grid cell resolution
The higher the resolution (smaller the grid cell), the higher the precision, but the greater the cost in data storage

Raster Data: Encoding

Raster Data: Encoding

Raster and RDBMS
Raster layer can be attached to a RDBMS
1
22
4
4
1
1
4
4
1
1
2
4
4
1
2
3
3
3
3
2
2
2
2
2
1 Agricultural
2 Road
3 Residential
4 Industrial
ID Land Use

Raster Data:
ArcGIS

Raster Data:
ArcGIS
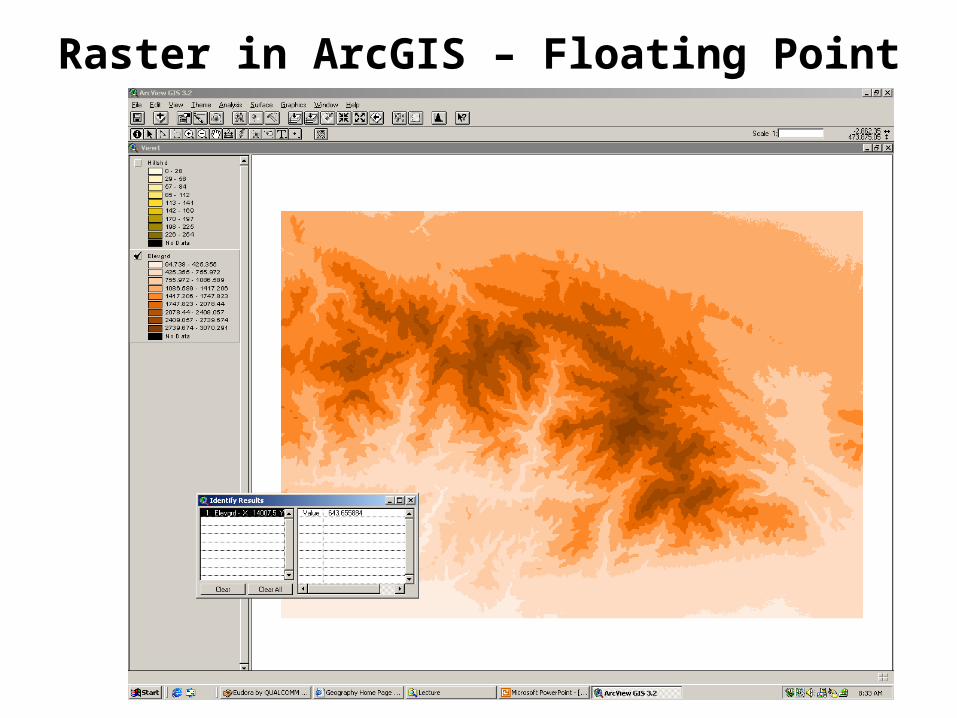
Raster in ArcGIS – Floating Point

Raster in ArcGIS - Integer

Converting Polygons from Vector to Raster

Data Compression
Common Methods:
– run length encoding– value point encoding– chain codes– block codes– quadtrees
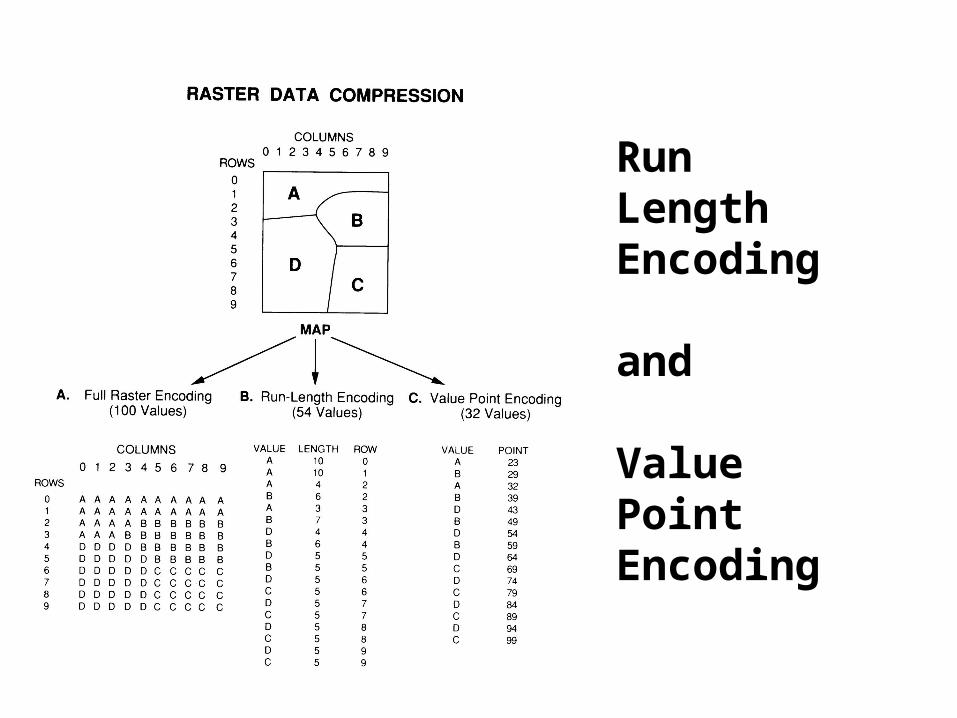
Run Length Encoding and
Value Point Encoding

Raster Chain Codes
directions around the boundary of a region
1
42
4
4
1
4
4
4
1
1
4
4
4
4
2
3
3
3
3
4
2
4
4
4
Start
North 1 East 1 North 2 East 2 South 3 West 3
Value 4
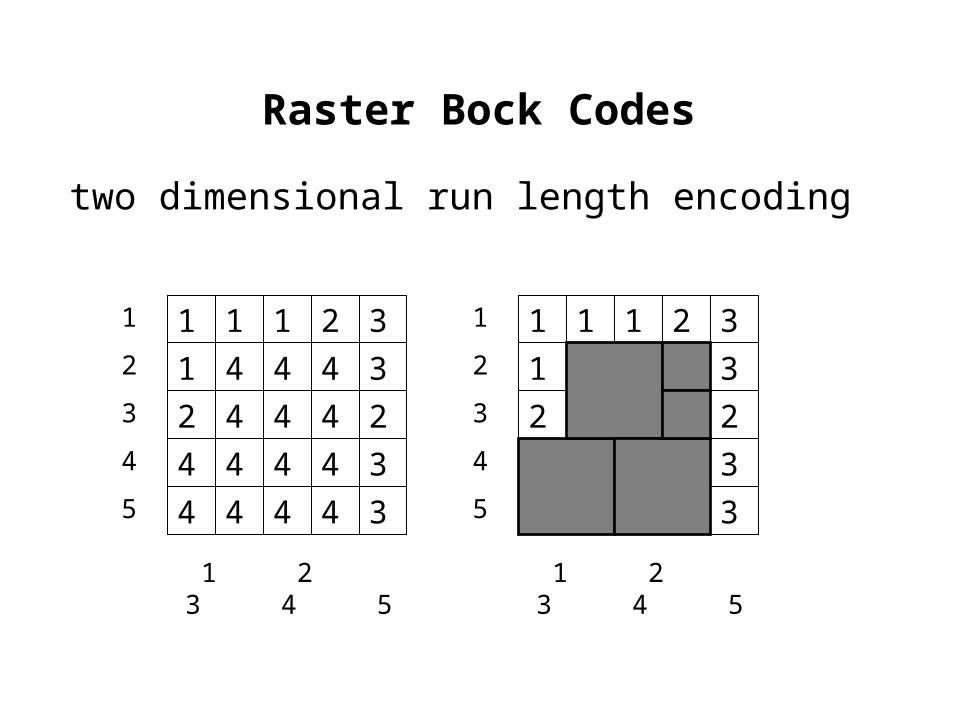
Raster Bock Codes
1
42
4
4
1
4
4
4
1
1
4
4
4
4
2
3
3
3
3
4
2
4
4
4
1
42
4
4
1
4
4
4
1
1
4
4
4
4
2
3
3
3
3
4
2
4
4
4
1
3
4
5
2
1 2 3 4 5
1
3
4
5
2
1 2 3 4 5
two dimensional run length encoding

Quadtreea partitioning of heterogeneous space into quarter sections

Quadtrees
• node is a quadrant that is heterogeneous
• leaf is a quadrant that is homogeneous
• quadrants are assigned an ID number according to their position and level
Recommended