GUIDE TO LOW CARBON OFFICES
Practical Guide on Carbon Audit and Management

ENVIRONMENTAL PROTECTION DEPARTMENT
Guide to Low Carbon Offices
Read on if you want to: • cutyourenergybills;• improveyourworkingplace;• meetyourstakeholders’
expectation;and• contributetotheenvironment.
About this GuideClimate change posed an unprecedented global challenge for everyone. Hong Kong is committed to contributing to the solution by taking community-wide actions to reduce greenhouse gases (GHG) emissions.
Carbon audit is an effective process to understand and measure our carbon footprint and a first step to identify appropriate carbon reduction measures.
This guide introduces the know-how of carbon audit and sets out the major steps of conducting a basic carbon audit for office-based operations.
A wide range of measures are also illustrated to facilitate office managers to reduce carbon emissions and to save operation cost.
ENVIRONMENTAL PROTECTION DEPARTMENT
Guide to Low Carbon Offices
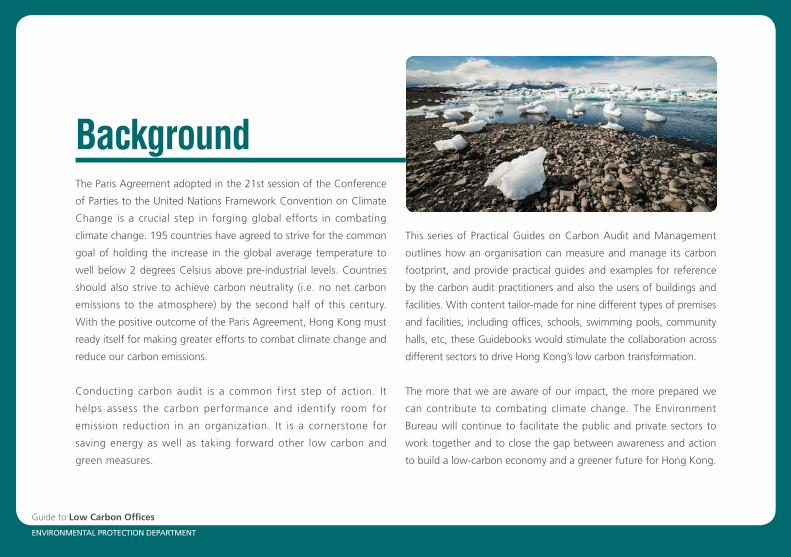
BackgroundThe Paris Agreement adopted in the 21st session of the Conference
of Parties to the United Nations Framework Convention on Climate
Change is a crucial step in forging global efforts in combating
climate change. 195 countries have agreed to strive for the common
goal of holding the increase in the global average temperature to
well below 2 degrees Celsius above pre-industrial levels. Countries
should also strive to achieve carbon neutrality (i.e. no net carbon
emissions to the atmosphere) by the second half of this century.
With the positive outcome of the Paris Agreement, Hong Kong must
ready itself for making greater efforts to combat climate change and
reduce our carbon emissions.
Conducting carbon audit is a common first step of action. It
helps assess the carbon performance and identify room for
emission reduction in an organization. It is a cornerstone for
saving energy as well as taking forward other low carbon and
green measures.
This series of Practical Guides on Carbon Audit and Management
outlines how an organisation can measure and manage its carbon
footprint, and provide practical guides and examples for reference
by the carbon audit practitioners and also the users of buildings and
facilities. With content tailor-made for nine different types of premises
and facilities, including offices, schools, swimming pools, community
halls, etc, these Guidebooks would stimulate the collaboration across
different sectors to drive Hong Kong’s low carbon transformation.
The more that we are aware of our impact, the more prepared we
can contribute to combating climate change. The Environment
Bureau will continue to facilitate the public and private sectors to
work together and to close the gap between awareness and action
to build a low-carbon economy and a greener future for Hong Kong.

ENVIRONMENTAL PROTECTION DEPARTMENT
Guide to Low Carbon Offices
How To Reduce Carbon Emissions
Case Studies
Useful Resources
15
24
27
01
05
13
Background
Introduction
What is Carbon Audit
Checklist for Conducting Carbon Audit
Table of Content
Guide to Low Carbon Offices01ENVIRONMENTAL PROTECTION DEPARTMENT
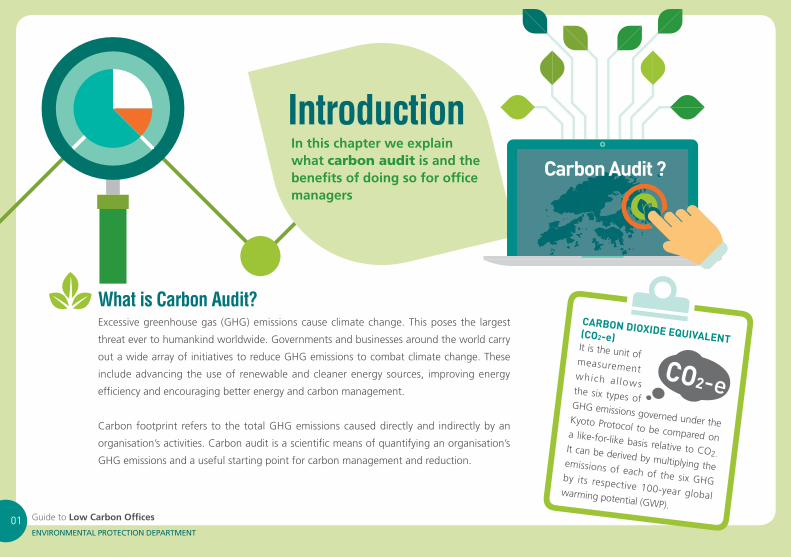
Excessive greenhouse gas (GHG) emissions cause climate change. This poses the largest
threat ever to humankind worldwide. Governments and businesses around the world carry
out a wide array of initiatives to reduce GHG emissions to combat climate change. These
include advancing the use of renewable and cleaner energy sources, improving energy
efficiency and encouraging better energy and carbon management.
Carbon footprint refers to the total GHG emissions caused directly and indirectly by an
organisation’s activities. Carbon audit is a scientific means of quantifying an organisation’s
GHG emissions and a useful starting point for carbon management and reduction.
What is Carbon Audit?
It is the unit ofmeasurement which al lowsthe six types ofGHG emissions goverKyoto Pr
ned under thea like-for
otocol to be compar-like basis red on
elative to CO2.
by
emissions of each of
It can be derived by multiplying the the its respective 100-year global
six GHGwarming potential (GWP).
CARBON DIO(CO2-e)XIDE EQUIVALENT
In this chapter we explain what carbon audit is and the benefits of doing so for office managers
IntroductionCarbon Audit ?
CO2-e
Guide to Low Carbon Offices02ENVIRONMENTAL PROTECTION DEPARTMENT
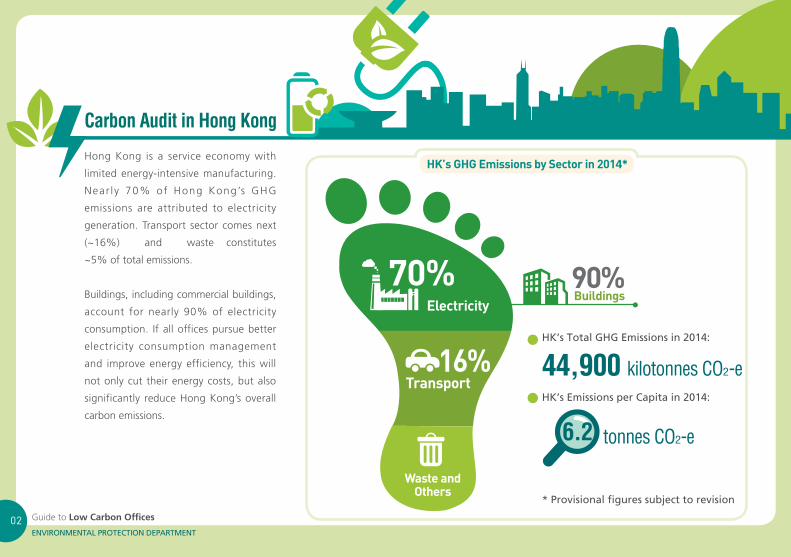
Carbon Audit in Hong Kong
Hong Kong is a service economy with
limited energy-intensive manufacturing.
Near l y 70% of Hong Kong’s GHG
emissions are attributed to electricity
generation. Transport sector comes next
(~16%) and waste constitutes
~5% of total emissions.
Buildings, including commercial buildings,
account for nearly 90% of electricity
consumption. If all offices pursue better
electricity consumption management
and improve energy efficiency, this will
not only cut their energy costs, but also
significantly reduce Hong Kong’s overall
carbon emissions.
90%Buildings
70%Electricity
16%Transport
Waste and Others
HK’s Total GHG Emissions in 2014:
44,900 kilotonnes CO2-eHK’s Emissions per Capita in 2014:
6.2 tonnes CO2-e
HK’s GHG Emissions by Sector in 2014*
* Provisional figures subject to revision
Guide to Low Carbon Offices03ENVIRONMENTAL PROTECTION DEPARTMENT
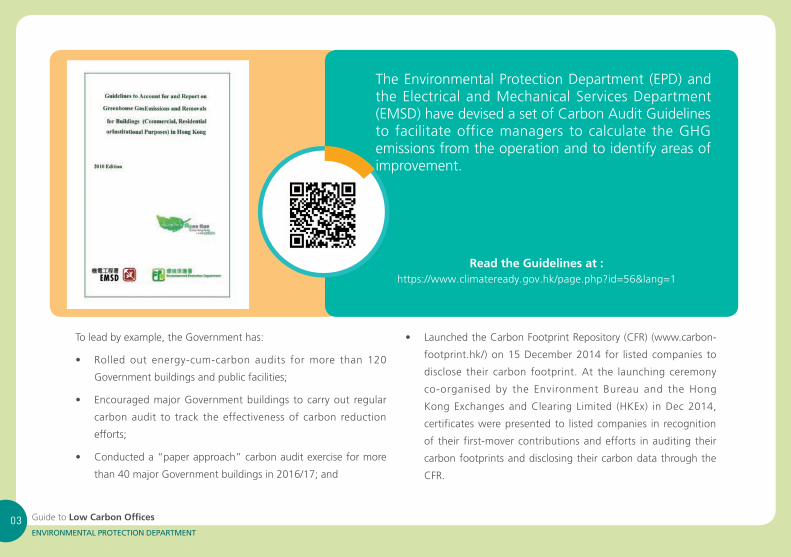
The Environmental Protection Department (EPD) and the Electrical and Mechanical Services Department (EMSD) have devised a set of Carbon Audit Guidelines to facilitate office managers to calculate the GHG emissions from the operation and to identify areas of improvement.
To lead by example, the Government has:
•
•
•
Rolled out energy-cum-carbon audits formore than 120
Government buildings and public facilities;
EncouragedmajorGovernmentbuildings tocarryout regular
carbon audit to track the effectiveness of carbon reduction
efforts;
Conducteda“paperapproach”carbonauditexerciseformore
than40majorGovernmentbuildingsin2016/17;and
Read the Guidelines at :https://www.climateready.gov.hk/page.php?id=56&lang=1
• LaunchedtheCarbonFootprintRepository(CFR)(www.carbon-
footprint.hk/)on15December2014 for listedcompanies to
disclose their carbon footprint. At the launching ceremony
co-organised by the Environment Bureau and the Hong
KongExchangesandClearing Limited (HKEx) inDec2014,
certificates were presented to listed companies in recognition
of their first-mover contributions and efforts in auditing their
carbon footprints and disclosing their carbon data through the
CFR.
Guide to Low Carbon Offices04ENVIRONMENTAL PROTECTION DEPARTMENT
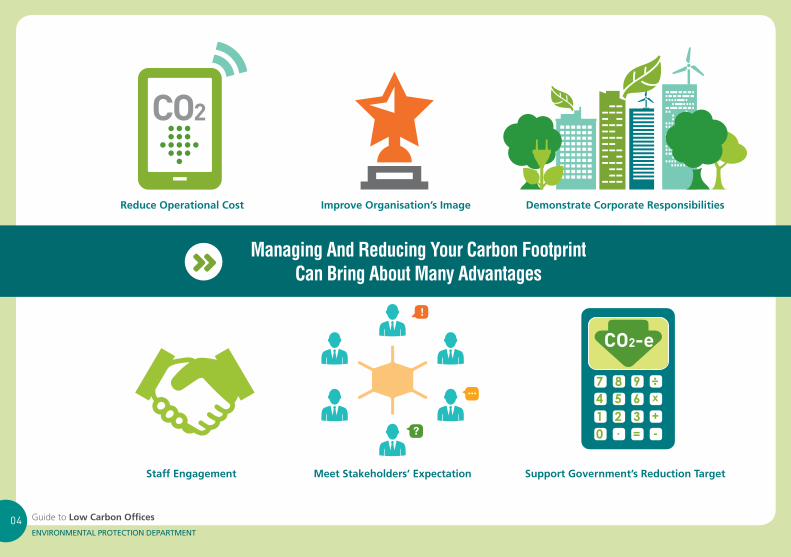
Managing And Reducing Your Carbon Footprint Can Bring About Many Advantages
Reduce Operational Cost
Staff Engagement
Improve Organisation’s Image
Meet Stakeholders’ Expectation
Demonstrate Corporate Responsibilities
Support Government’s Reduction Target
?
...
!
CO2
Guide to Low Carbon Offices05ENVIRONMENTAL PROTECTION DEPARTMENT
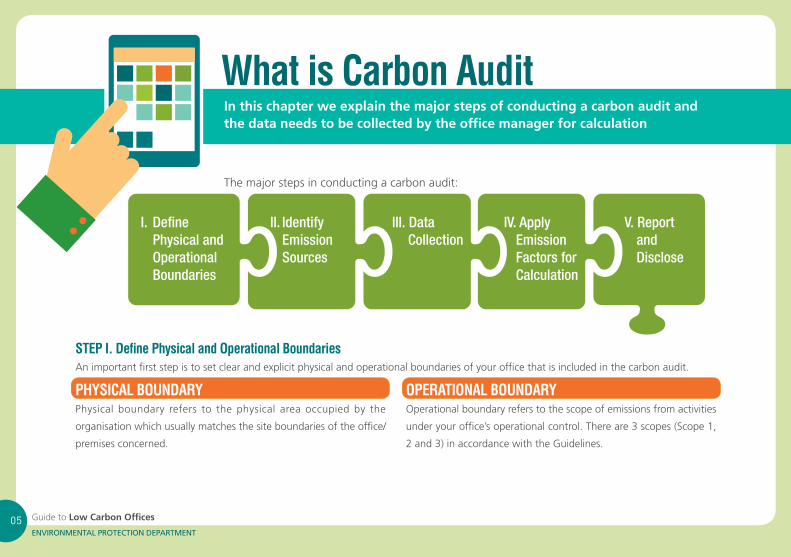
What is Carbon AuditIn this chapter we explain the major steps of conducting a carbon audit and the data needs to be collected by the office manager for calculation
I. Define Physical and Operational Boundaries
II. Identify Emission Sources
III. Data Collection
Themajorstepsinconductingacarbonaudit:
PHYSICAL BOUNDARYPhysical boundary refers to the physical area occupied by the
organisationwhichusuallymatchesthesiteboundariesoftheoffice/
premises concerned.
OPERATIONAL BOUNDARYOperational boundary refers to the scope of emissions from activities
under your office’s operational control. There are 3 scopes (Scope 1,
2 and 3) in accordance with the Guidelines.
STEP I. Define Physical and Operational BoundariesAn important first step is to set clear and explicit physical and operational boundaries of your office that is included in the carbon audit.
IV. Apply Emission Factors forCalculation
V. Report and Disclose
Guide to Low Carbon Offices06ENVIRONMENTAL PROTECTION DEPARTMENT
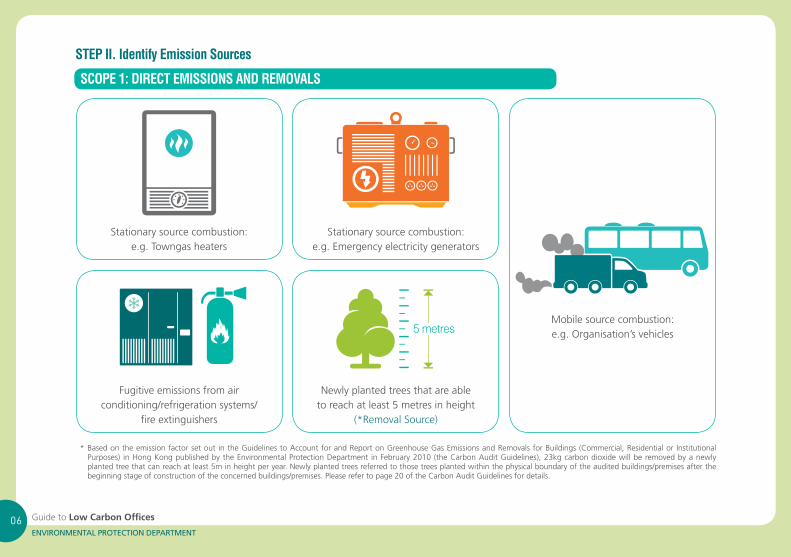
STEP II. Identify Emission Sources
SCOPE 1: DIRECT EMISSIONS AND REMOVALS
Stationary source combustion:e.g. Towngas heaters
Fugitive emissions from air conditioning/refrigerationsystems/
fire extinguishers
Newly planted trees that are able to reach at least 5 metres in height
(*RemovalSource)
Stationary source combustion:e.g. Emergency electricity generators
Mobile source combustion:e.g. Organisation’s vehicles5 metres
*Basedontheemissionfactorsetout intheGuidelinestoAccountforandReportonGreenhouseGasEmissionsandRemovalsforBuildings(Commercial,Residentialor InstitutionalPurposes) in Hong Kong published by the Environmental Protection Department in February 2010 (the Carbon Audit Guidelines), 23kg carbon dioxide will be removed by a newly plantedtreethatcanreachatleast5minheightperyear.Newlyplantedtreesreferredtothosetreesplantedwithinthephysicalboundaryoftheauditedbuildings/premisesafterthebeginningstageofconstructionoftheconcernedbuildings/premises.Pleaserefertopage20oftheCarbonAuditGuidelinesfordetails.
Guide to Low Carbon Offices07ENVIRONMENTAL PROTECTION DEPARTMENT
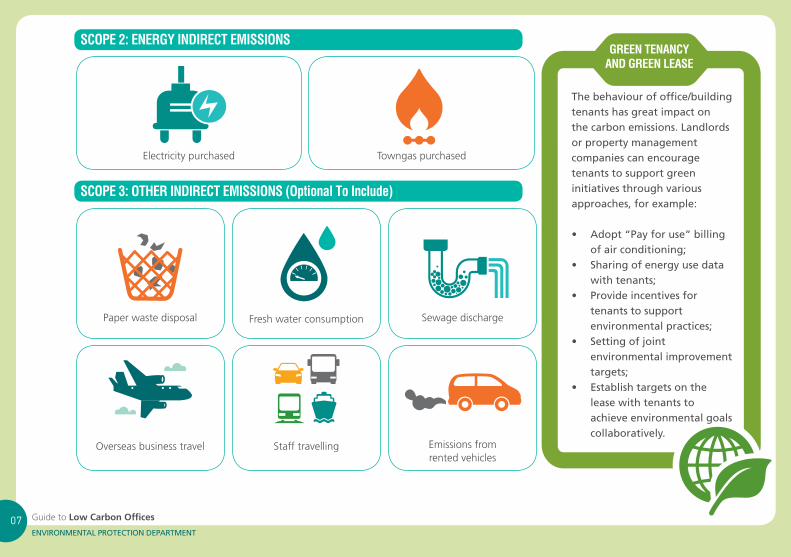
SCOPE 2: ENERGY INDIRECT EMISSIONS
SCOPE 3: OTHER INDIRECT EMISSIONS (Optional To Include)
Electricity purchased Towngas purchased
Paper waste disposal
Overseas business travel
Fresh water consumption
Staff travelling
Sewage discharge
Emissions from rented vehicles
GREEN TENANCY AND GREEN LEASE
The behaviour of office/building tenants has great impact on the carbon emissions. Landlords or property management companies can encourage tenants to support green initiatives through various approaches, for example:
• Adopt“Payforuse”billingof air conditioning;
•
•
•
•
Sharingofenergyusedatawith tenants;Provideincentivesfortenants to supportenvironmental practices;Settingofjointenvironmental improvementtargets;Establishtargetsonthelease with tenants toachieve environmental goalscollaboratively.
Guide to Low Carbon Offices08ENVIRONMENTAL PROTECTION DEPARTMENT
5 metres
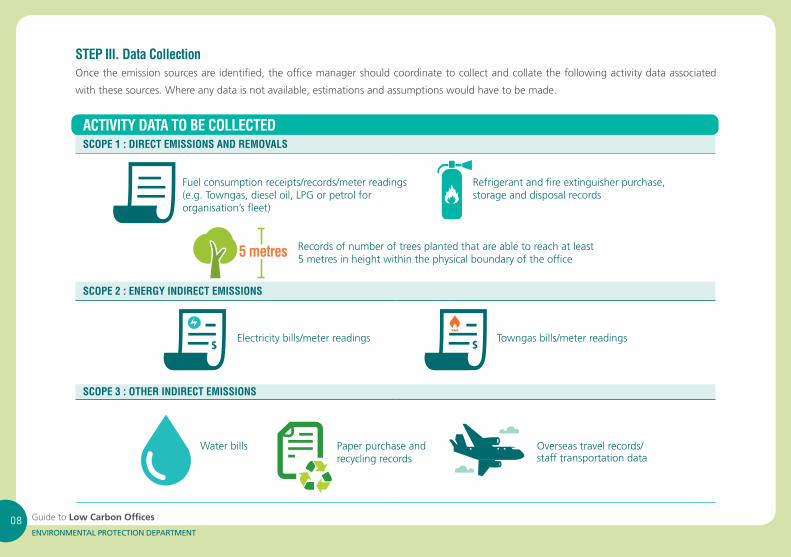
STEP III. Data CollectionOnce the emission sources are identified, the office manager should coordinate to collect and collate the following activity data associated
with these sources. Where any data is not available, estimations and assumptions would have to be made.
ACTIVITY DATA TO BE COLLECTEDSCOPE 1 : DIRECT EMISSIONS AND REMOVALS
SCOPE 2 : ENERGY INDIRECT EMISSIONS
SCOPE 3 : OTHER INDIRECT EMISSIONS
Fuelconsumptionreceipts/records/meterreadings(e.g.Towngas,dieseloil,LPGorpetrolfororganisation’s fleet)
Recordsofnumberoftreesplantedthatareabletoreachatleast5 metres in height within the physical boundary of the office
Refrigerantandfireextinguisherpurchase,storage and disposal records
Paper purchase and recycling records
Water bills Overseastravelrecords/staff transportation data
Electricitybills/meterreadings Towngasbills/meterreadings$ $
Guide to Low Carbon Offices09ENVIRONMENTAL PROTECTION DEPARTMENT
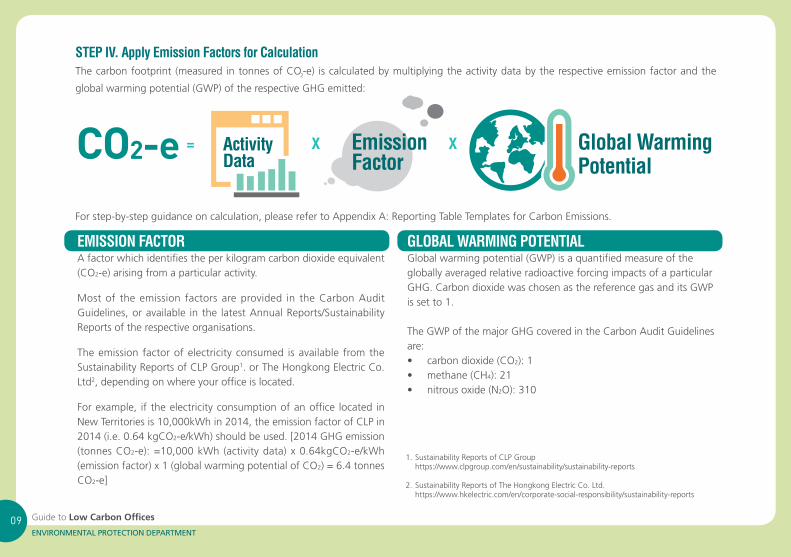
EMISSION FACTOR GLOBAL WARMING POTENTIALA factor which identifies the per kilogram carbon dioxide equivalent (CO2-e) arising from a particular activity.
Most of the emission factors are provided in the Carbon Audit Guidelines,oravailable inthe latestAnnualReports/SustainabilityReportsoftherespectiveorganisations.
The emission factor of electricity consumed is available from the SustainabilityReportsofCLPGroup1. or The Hongkong Electric Co. Ltd2, depending on where your office is located.
For example, if the electricity consumption of an office located in NewTerritoriesis10,000kWhin2014,theemissionfactorofCLPin2014 (i.e. 0.64 kgCO2-e/kWh)shouldbeused.[2014GHGemission(tonnes CO2-e): =10,000 kWh (activity data) x 0.64kgCO2-e/kWh(emission factor) x 1 (global warming potential of CO2) = 6.4 tonnes CO2-e]
Global warming potential (GWP) is a quantified measure of the globally averaged relative radioactive forcing impacts of a particular GHG. Carbon dioxide was chosen as the reference gas and its GWP is set to 1.
TheGWPofthemajorGHGcoveredintheCarbonAuditGuidelinesare:•••
carbondioxide(CO2): 1methane(CH4): 21nitrousoxide(N2O): 310
STEP IV. Apply Emission Factors for CalculationThe carbon footprint (measured in tonnes of CO2-e) is calculated by multiplying the activity data by the respective emission factor and the
global warming potential (GWP) of the respective GHG emitted:
CO2-e = Activity X Emission X Global Warming Data Factor Potential
Forstep-by-stepguidanceoncalculation,pleaserefertoAppendixA:ReportingTableTemplatesforCarbonEmissions.
1.SustainabilityReportsofCLPGrouphttps://www.clpgroup.com/en/sustainability/sustainability-reports
2.SustainabilityReportsofTheHongkongElectricCo.Ltd.https://www.hkelectric.com/en/corporate-social-responsibility/sustainability-reports
Guide to Low Carbon Offices10ENVIRONMENTAL PROTECTION DEPARTMENT
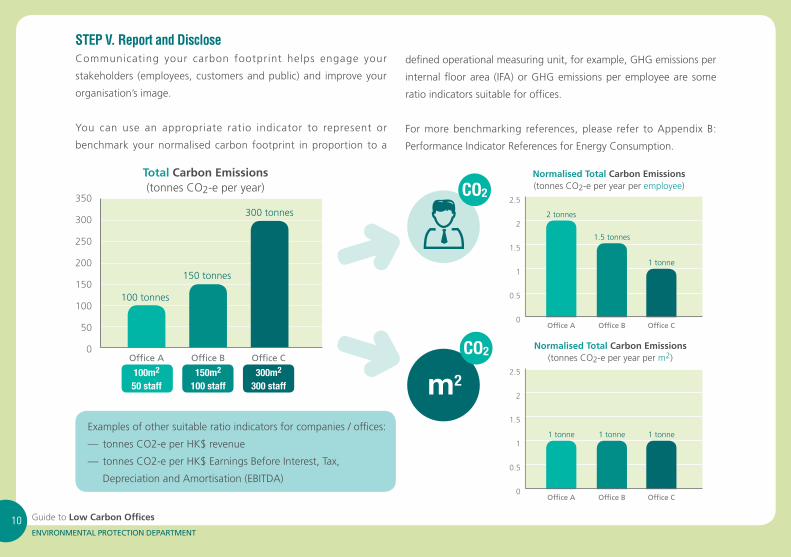
STEP V. Report and DiscloseCommunicating your carbon footprint helps engage your
stakeholders (employees, customers and public) and improve your
organisation’s image.
You can use an appropriate ratio indicator to represent or
benchmark your normalised carbon footprint in proportion to a
Normalised Total Carbon Emissions(tonnes CO2-e per year per m2)
2.5
2
1.5
1
0.5
0Office A Office B Office C
1 tonne 1 tonne 1 tonne
Total Carbon Emissions(tonnes CO2-e per year)
350
300
250
200
150
100
50
0Office A
100m2
50 staff
Office B
150m2
100 staff
Office C
300m2
300 staff
100 tonnes
150 tonnes
300 tonnes
Normalised Total Carbon Emissions(tonnes CO -e per year per employee)
2.5
2
1.5
1
0.5
0Office A Office B Office C
2 tonnes
1.5 tonnes
1 tonne
2CO2
CO2
m2
defined operational measuring unit, for example, GHG emissions per
internal floor area (IFA) or GHG emissions per employee are some
ratio indicators suitable for offices.
For more benchmarking references, please refer to Appendix B:
Performance Indicator References for Energy Consumption.
Examples of other suitable ratio indicators for companies / offices:
—
—
tonnes CO2-e per HK$ revenue
tonnes CO2-e per HK$ Earnings Before Interest, Tax,
Depreciation and Amortisation (EBITDA)
Guide to Low Carbon Offices11ENVIRONMENTAL PROTECTION DEPARTMENT
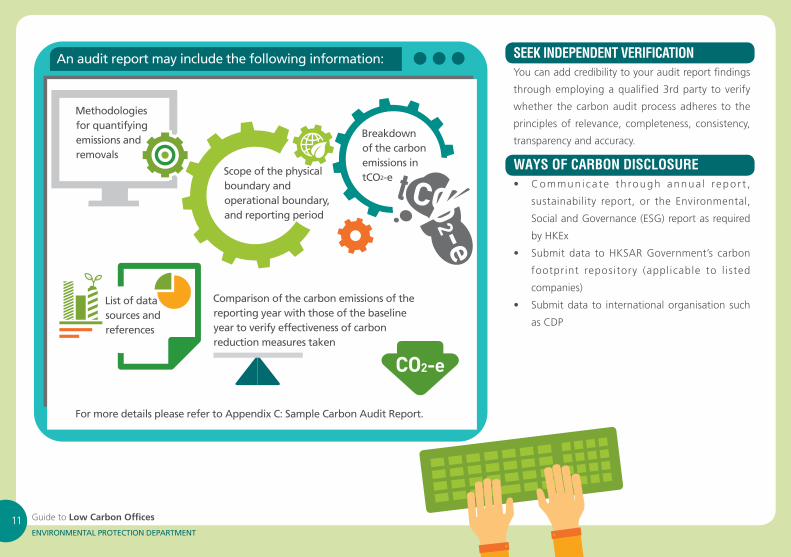
SEEK INDEPENDENT VERIFICATIONYou can add credibility to your audit report findings
through employing a qualified 3rd party to verify
whether the carbon audit process adheres to the
principles of relevance, completeness, consistency,
transparency and accuracy.
WAYS OF CARBON DISCLOSURE•
•
•
Commun i ca te th rough annua l repo r t ,
sustainability report, or the Environmental,
Social and Governance (ESG) report as required
by HKEx
Submitdata toHKSARGovernment’s carbon
footprint repository (applicable to l isted
companies)
Submitdatato internationalorganisationsuch
as CDP
Methodologies for quantifying emissions and removals
Scopeofthephysicalboundary and operational boundary,and reporting period
Breakdown of the carbon emissions in tCO2-e
An audit report may include the following information:
List of data sources and references
Comparison of the carbon emissions of the reporting year with those of the baseline year to verify effectiveness of carbon reduction measures taken
FormoredetailspleaserefertoAppendixC:SampleCarbonAuditReport.
CO2-eCO
2-e
t
Guide to Low Carbon Offices12ENVIRONMENTAL PROTECTION DEPARTMENT
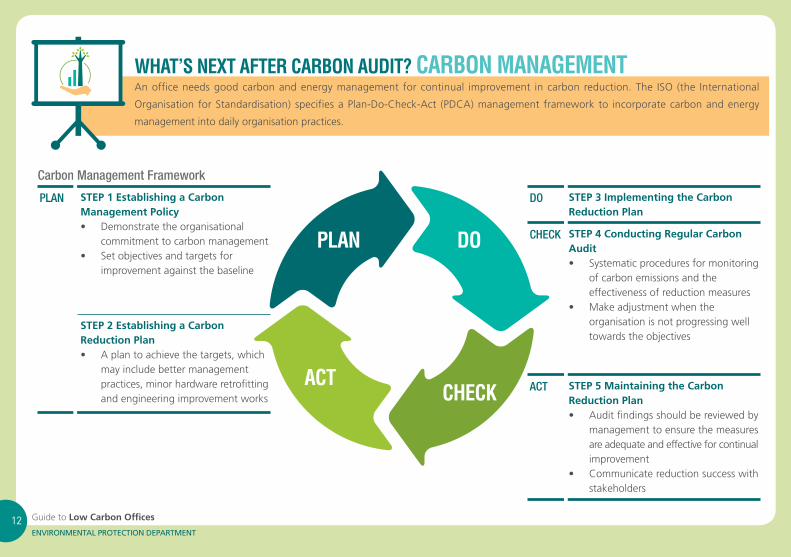
PLAN DO
CHECKACT
Carbon Management Framework
PLAN STEP 1 Establishing a Carbon Management Policy•
•
Demonstratetheorganisationalcommitment to carbon managementSetobjectivesandtargetsforimprovement against the baseline
STEP 2 Establishing a Carbon Reduction Plan• Aplantoachievethetargets,which
may include better managementpractices, minor hardware retrofittingand engineering improvement works
DO STEP 3 Implementing the Carbon Reduction Plan
CHECK STEP 4 Conducting Regular Carbon Audit•
•
Systematicproceduresformonitoringof carbon emissions and theeffectiveness of reduction measuresMakeadjustmentwhentheorganisation is not progressing welltowardstheobjectives
ACT STEP 5 Maintaining the Carbon Reduction Plan•
•
Auditfindingsshouldbereviewedbymanagement to ensure the measuresare adequate and effective for continual improvementCommunicatereductionsuccesswithstakeholders
WHAT’S NEXT AFTER CARBON AUDIT? CARBON MANAGEMENTAn office needs good carbon and energy management for continual improvement in carbon reduction. The ISO (the International
Organisation for Standardisation) specifies a Plan-Do-Check-Act (PDCA) management framework to incorporate carbon and energy
management into daily organisation practices.
Guide to Low Carbon Offices13ENVIRONMENTAL PROTECTION DEPARTMENT
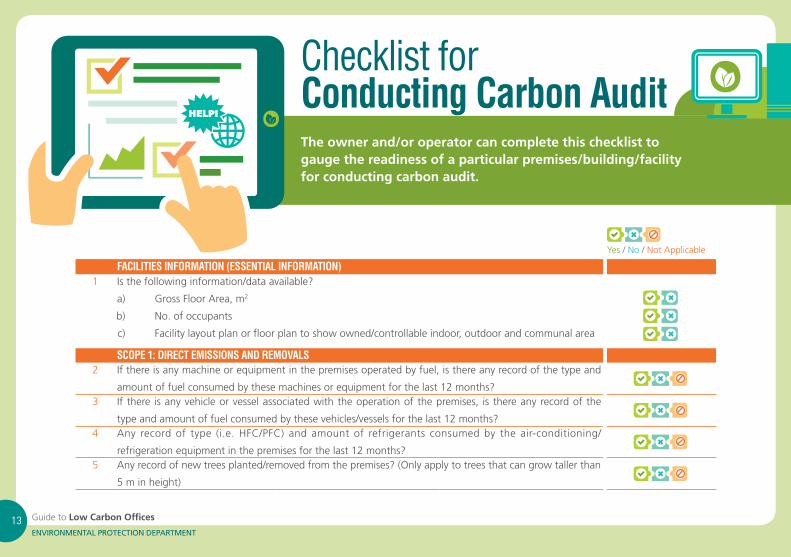
FACILITIES INFORMATION (ESSENTIAL INFORMATION)1 Isthefollowinginformation/dataavailable?
a) Gross Floor Area, m2
b) No. of occupants
c) Facilitylayoutplanorfloorplantoshowowned/controllableindoor,outdoorandcommunalarea
SCOPE 1: DIRECT EMISSIONS AND REMOVALS2 If there is any machine or equipment in the premises operated by fuel, is there any record of the type and
amountoffuelconsumedbythesemachinesorequipmentforthelast12months?3 If there is any vehicle or vessel associated with the operation of the premises, is there any record of the
typeandamountoffuelconsumedbythesevehicles/vesselsforthelast12months?4 Any recordof type (i.e.HFC/PFC) andamountof refrigerants consumedby theair-conditioning/
refrigerationequipmentinthepremisesforthelast12months?5 Anyrecordofnewtreesplanted/removedfromthepremises?(Onlyapplytotreesthatcangrowtallerthan
5 m in height)
Checklist for Conducting Carbon AuditThe owner and/or operator can complete this checklist to gauge the readiness of a particular premises/building/facility for conducting carbon audit.
Yes / No/ Not Applicable
Guide to Low Carbon Offices14ENVIRONMENTAL PROTECTION DEPARTMENT
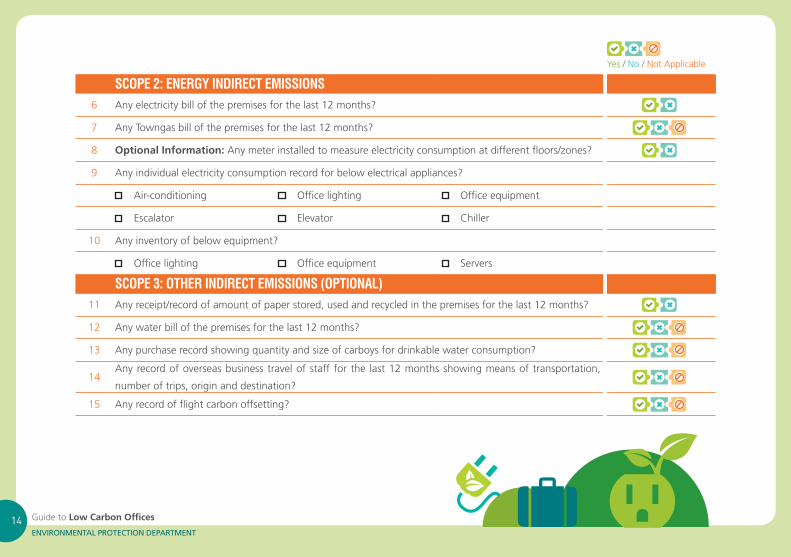
SCOPE 2: ENERGY INDIRECT EMISSIONS6 Anyelectricitybillofthepremisesforthelast12months?
7 AnyTowngasbillofthepremisesforthelast12months?
8 Optional Information: Anymeterinstalledtomeasureelectricityconsumptionatdifferentfloors/zones?
9 Anyindividualelectricityconsumptionrecordforbelowelectricalappliances?
Air-conditioning Office lighting Office equipment
Escalator Elevator Chiller
10 Anyinventoryofbelowequipment?
Office lighting Office equipment Servers
SCOPE 3: OTHER INDIRECT EMISSIONS (OPTIONAL)11 Anyreceipt/recordofamountofpaperstored,usedandrecycledinthepremisesforthelast12months?
12 Anywaterbillofthepremisesforthelast12months?
13 Anypurchaserecordshowingquantityandsizeofcarboysfordrinkablewaterconsumption?
14Any record of overseas business travel of staff for the last 12 months showing means of transportation,
numberoftrips,originanddestination?
15 Anyrecordofflightcarbonoffsetting?
Yes / No/ Not Applicable
Guide to Low Carbon Offices15ENVIRONMENTAL PROTECTION DEPARTMENT
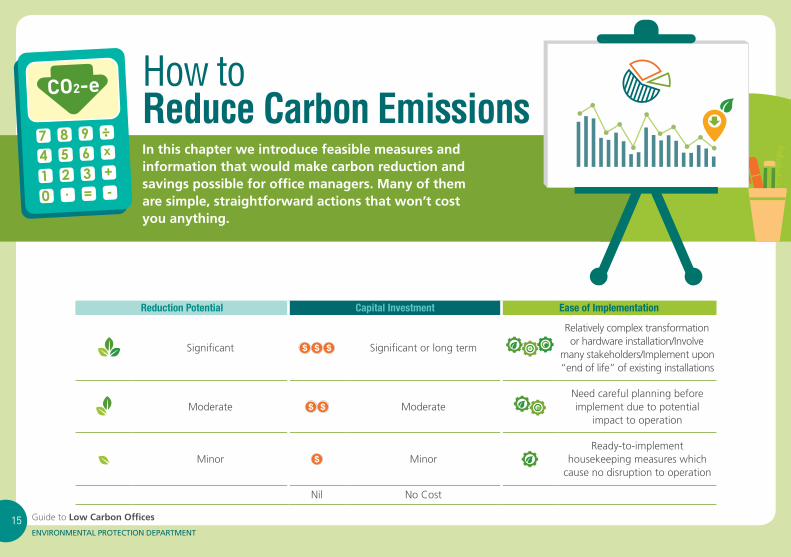
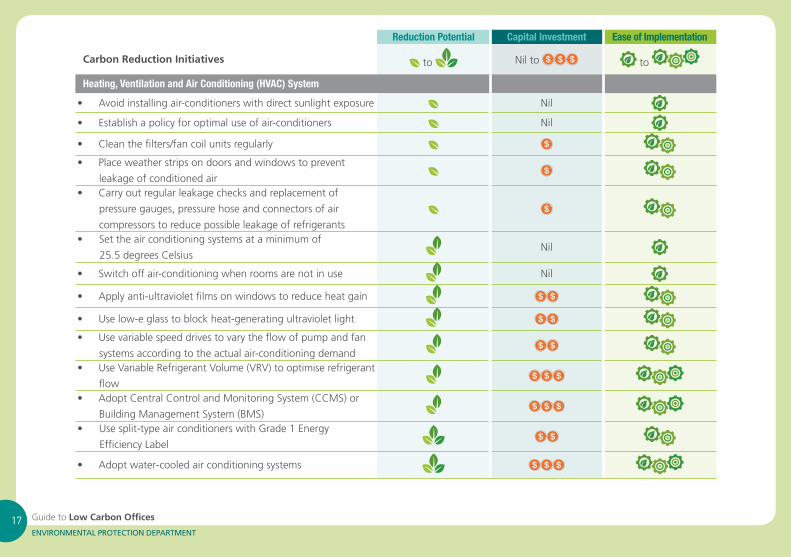
Reduction Potential Capital Investment
Significant Significant or long term
Ease of Implementation
Relativelycomplextransformationorhardwareinstallation/Involve
manystakeholders/Implementupon“endoflife”ofexistinginstallations
Moderate ModerateNeed careful planning before implement due to potential
impact to operation
Minor MinorReady-to-implement
housekeeping measures which cause no disruption to operation
Nil No Cost
How to Reduce Carbon EmissionsIn this chapter we introduce feasible measures and information that would make carbon reduction and savings possible for office managers. Many of them are simple, straightforward actions that won’t cost you anything.
Guide to Low Carbon Offices16ENVIRONMENTAL PROTECTION DEPARTMENT
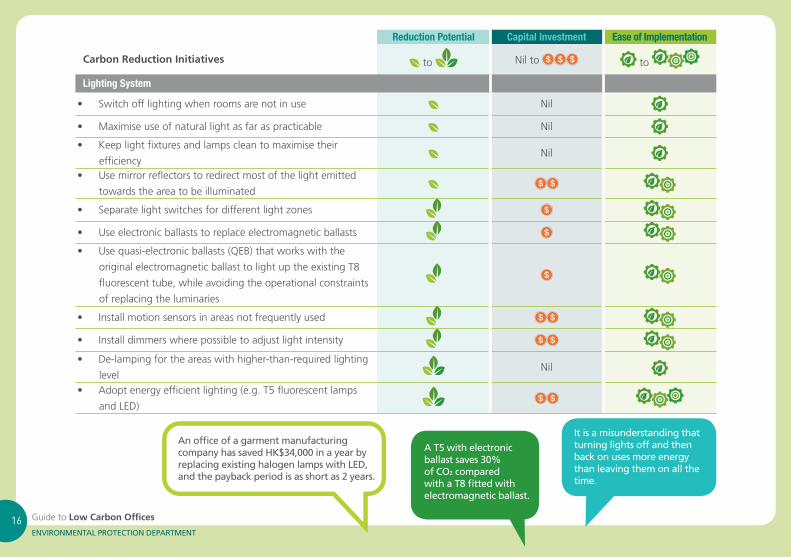
An office of a garment manufacturing company has saved HK$34,000 in a year by replacing existing halogen lamps with LED, and the payback period is as short as 2 years.
It is a misunderstanding that turning lights off and then back on uses more energy than leaving them on all the time.
A T5 with electronic ballast saves 30% of CO2 compared with a T8 fitted with electromagnetic ballast.
Reduction Potential
to
Capital Investment
Nil to
Ease of Implementation
to Carbon Reduction Initiatives
Lighting System
•
•
•
•
•
•
•
•
•
•
•
Switchofflightingwhenroomsarenotinuse Nil
Maximiseuseofnaturallightasfaraspracticable Nil
Keeplightfixturesandlampscleantomaximisetheir
efficiencyNil
Usemirrorreflectorstoredirectmostofthelightemitted
towards the area to be illuminated
Separatelightswitchesfordifferentlightzones
Useelectronicballaststoreplaceelectromagneticballasts
Usequasi-electronicballasts(QEB)thatworkswiththe
original electromagnetic ballast to light up the existing T8
fluorescent tube, while avoiding the operational constraints
of replacing the luminaries
Installmotionsensorsinareasnotfrequentlyused
Installdimmerswherepossibletoadjustlightintensity
De-lampingfortheareaswithhigher-than-requiredlighting
levelNil
Adoptenergyefficientlighting(e.g.T5fluorescentlamps
andLED)
Guide to Low Carbon Offices17ENVIRONMENTAL PROTECTION DEPARTMENT
Reduction Potential
to
Capital Investment
Nil to
Ease of Implementation
to Carbon Reduction Initiatives
Heating, Ventilation and Air Conditioning (HVAC) System
•
•
•
•
•
•
•
•
•
•
•
•
•
•
Avoidinstallingair-conditionerswithdirectsunlightexposure Nil
Establishapolicyforoptimaluseofair-conditioners Nil
Cleanthefilters/fancoilunitsregularly
Placeweatherstripsondoorsandwindowstoprevent
leakage of conditioned airCarryoutregularleakagechecksandreplacementof
pressure gauges, pressure hose and connectors of air
compressors to reduce possible leakage of refrigerantsSettheairconditioningsystemsataminimumof
25.5degrees CelsiusNil
Switchoffair-conditioningwhenroomsarenotinuse Nil
Applyanti-ultravioletfilmsonwindowstoreduceheatgain
Uselow-eglasstoblockheat-generatingultravioletlight
Usevariablespeeddrivestovarytheflowofpumpandfan
systems according to the actual air-conditioning demandUseVariableRefrigerantVolume(VRV)tooptimiserefrigerant
flowAdoptCentralControlandMonitoringSystem(CCMS)or
Building Management System (BMS)Usesplit-typeairconditionerswithGrade1Energy
EfficiencyLabel
Adoptwater-cooledairconditioningsystems
Guide to Low Carbon Offices18ENVIRONMENTAL PROTECTION DEPARTMENT
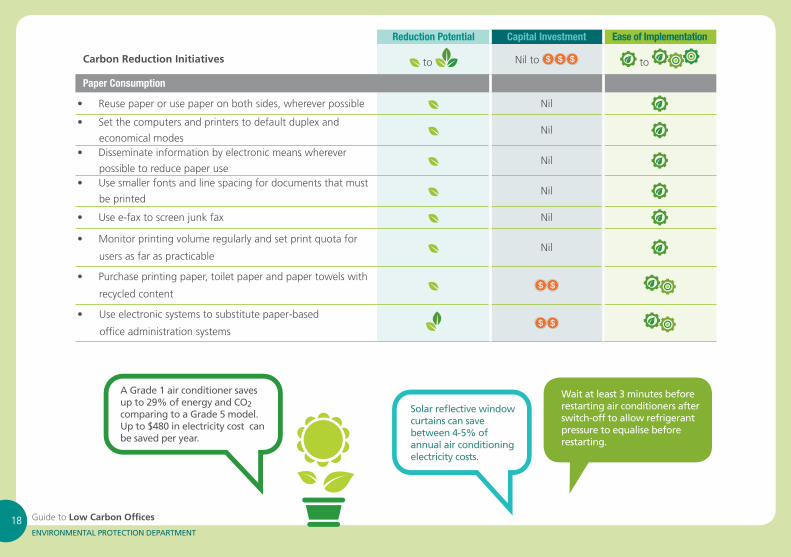
Reduction Potential
to
Capital Investment
Nil to
Ease of Implementation
to Carbon Reduction Initiatives
Paper Consumption
•
•
•
•
•
•
•
•
Reusepaperorusepaperonbothsides,whereverpossible Nil
Setthecomputersandprinterstodefaultduplexand
economical modesNil
Disseminateinformationbyelectronicmeanswherever
possible to reduce paper useNil
Usesmallerfontsandlinespacingfordocumentsthatmust
be printedNil
Usee-faxtoscreenjunkfax Nil
Monitor printing volume regularly and set print quota for
users as far as practicableNil
Purchase printing paper, toilet paper and paper towels with
recycled content
Use electronic systems to substitute paper-based
office administration systems
Solarreflectivewindowcurtains can save between 4-5% of annual air conditioning electricity costs.
Wait at least 3 minutes before restarting air conditioners after switch-off to allow refrigerant pressure to equalise before restarting.
A Grade 1 air conditioner saves up to 29% of energy and CO2 comparing to a Grade 5 model. Up to $480 in electricity cost can be saved per year.
Guide to Low Carbon Offices19ENVIRONMENTAL PROTECTION DEPARTMENT
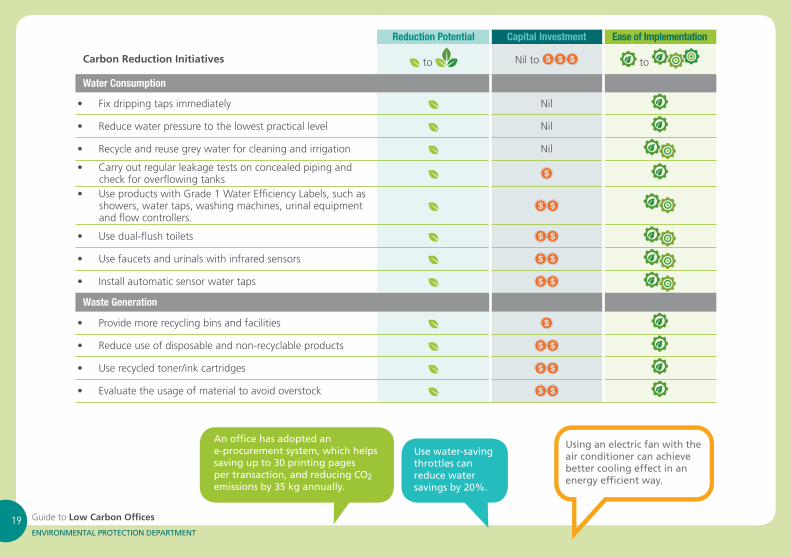
Reduction Potential
to
Capital Investment
Nil to
Ease of Implementation
to Carbon Reduction Initiatives
Water Consumption
•
•
•
•
•
•
•
•
Fixdrippingtapsimmediately Nil
Reducewaterpressuretothelowestpracticallevel Nil
Recycleandreusegreywaterforcleaningandirrigation Nil
Carryoutregularleakagetestsonconcealedpipingandcheck for overflowing tanksUseproductswithGrade1WaterEfficiencyLabels,suchasshowers, water taps, washing machines, urinal equipment and flow controllers.
Usedual-flushtoilets
Usefaucetsandurinalswithinfraredsensors
Installautomaticsensorwatertaps
Waste Generation
•
•
•
•
Providemorerecyclingbinsandfacilities
Reduceuseofdisposableandnon-recyclableproducts
Userecycledtoner/inkcartridges
Evaluatetheusageofmaterialtoavoidoverstock
Using an electric fan with the air conditioner can achieve better cooling effect in an energy efficient way.
Use water-saving throttles can reduce water savings by 20%.
An office has adopted an e-procurement system, which helpssaving up to 30 printing pages per transaction, and reducing CO2 emissions by 35 kg annually.
Guide to Low Carbon Offices20ENVIRONMENTAL PROTECTION DEPARTMENT
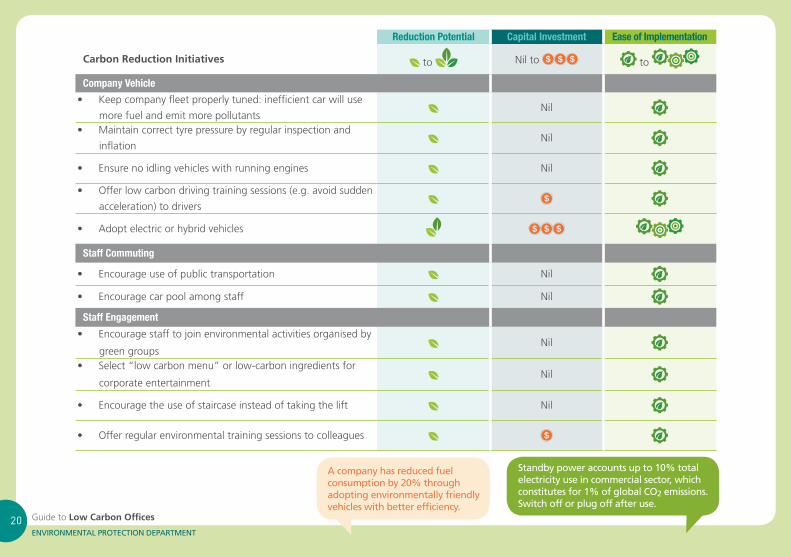
Reduction Potential
to
Capital Investment
Nil to
Ease of Implementation
to Carbon Reduction Initiatives
Company Vehicle
•
•
•
•
•
Keepcompanyfleetproperlytuned:inefficientcarwilluse
more fuel and emit more pollutantsNil
Maintaincorrecttyrepressurebyregularinspectionand
inflationNil
Ensurenoidlingvehicleswithrunningengines Nil
Offerlowcarbondrivingtrainingsessions(e.g.avoidsudden
acceleration) to drivers
Adopt electric or hybrid vehicles
Staff Commuting
•
•
Encourage use of public transportation Nil
Encourage car pool among staff Nil
Staff Engagement
•
•
•
•
Encouragestafftojoinenvironmentalactivitiesorganisedby
green groupsNil
Select“lowcarbonmenu”orlow-carboningredientsfor
corporate entertainmentNil
Encourage the use of staircase instead of taking the lift Nil
Offer regular environmental training sessions to colleagues
Standbypoweraccountsupto10%totalelectricity use in commercial sector, which constitutes for 1% of global CO2 emissions. Switchofforplugoffafteruse.
A company has reduced fuel consumption by 20% through adopting environmentally friendly vehicles with better efficiency.
Guide to Low Carbon Offices21ENVIRONMENTAL PROTECTION DEPARTMENT
Reduction Potential
to
Capital Investment
Nil to
Ease of Implementation
to Carbon Reduction Initiatives
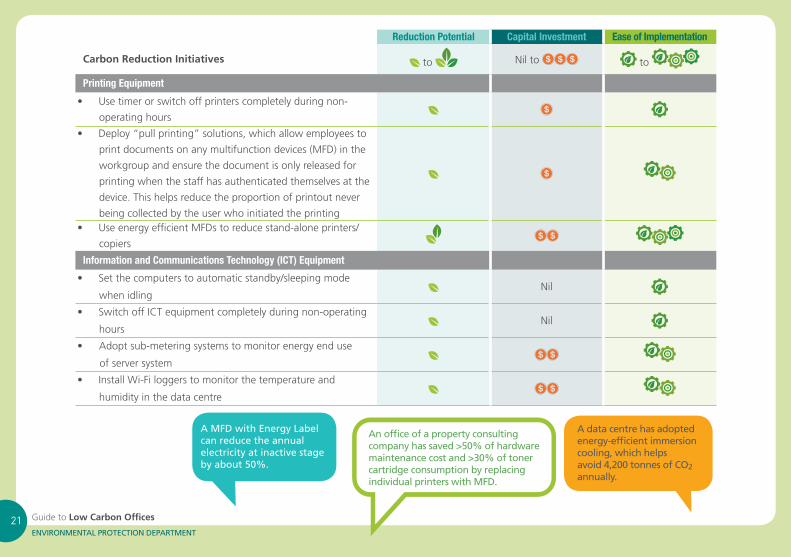
Printing Equipment
•
•
•
Usetimerorswitchoffprinterscompletelyduringnon-
operating hours
Deploy“pullprinting”solutions,whichallowemployeesto
print documents on any multifunction devices (MFD) in the
workgroup and ensure the document is only released for
printing when the staff has authenticated themselves at the
device. This helps reduce the proportion of printout never
being collected by the user who initiated the printing
UseenergyefficientMFDstoreducestand-aloneprinters/
copiers
Information and Communications Technology (ICT) Equipment
• Setthecomputerstoautomaticstandby/sleepingmode
when idlingNil
•
•
•
Switch off ICT equipment completely during non-operating
hoursNil
Adopt sub-metering systems to monitor energy end use
of server system
Install Wi-Fi loggers to monitor the temperature and
humidity in the data centre
An office of a property consulting company has saved >50% of hardware maintenance cost and >30% of toner cartridge consumption by replacing individual printers with MFD.
A MFD with Energy Label can reduce the annual electricity at inactive stage by about 50%.
A data centre has adopted energy-efficient immersion cooling, which helps avoid 4,200 tonnes of CO2 annually.
Guide to Low Carbon Offices22ENVIRONMENTAL PROTECTION DEPARTMENT
Reduction Potential
to
Capital Investment
Nil to
Ease of Implementation
to Carbon Reduction Initiatives
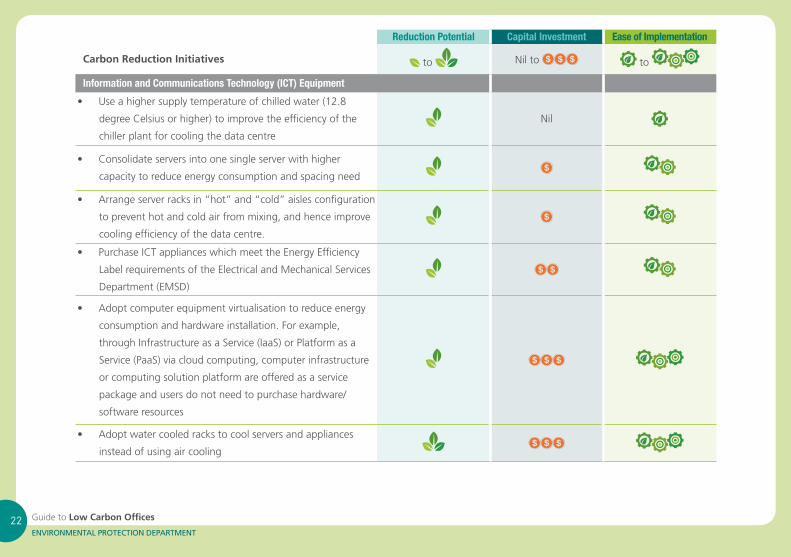
Information and Communications Technology (ICT) Equipment
•
•
•
•
•
•
Use a higher supply temperature of chilled water (12.8
degree Celsius or higher) to improve the efficiency of the
chiller plant for cooling the data centre
Nil
Consolidate servers into one single server with higher
capacity to reduce energy consumption and spacing need
Arrangeserverracksin“hot”and“cold”aislesconfiguration
to prevent hot and cold air from mixing, and hence improve
cooling efficiency of the data centre.
Purchase ICT appliances which meet the Energy Efficiency
LabelrequirementsoftheElectricalandMechanicalServices
Department (EMSD)
Adopt computer equipment virtualisation to reduce energy
consumption and hardware installation. For example,
through Infrastructure as a Service (IaaS) or Platform as a
Service (PaaS) via cloud computing, computer infrastructure
or computing solution platform are offered as a service
packageandusersdonotneedtopurchasehardware/
software resources
Adopt water cooled racks to cool servers and appliances
instead of using air cooling
Guide to Low Carbon Offices23ENVIRONMENTAL PROTECTION DEPARTMENT
Reduction Potential
to
Capital Investment
Nil to
Ease of Implementation
to Carbon Reduction Initiatives
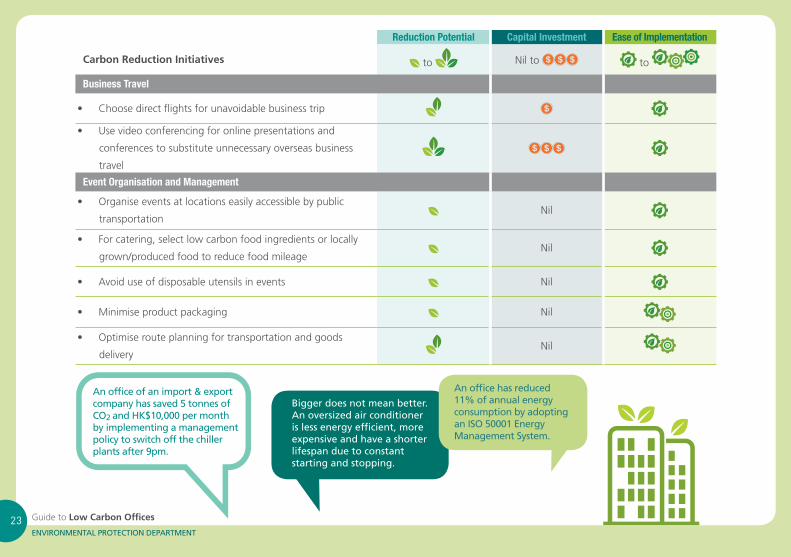
Business Travel
•
•
Choose direct flights for unavoidable business trip
Use video conferencing for online presentations and
conferences to substitute unnecessary overseas business
travel
Event Organisation and Management
•
•
•
•
•
Organise events at locations easily accessible by public
transportationNil
For catering, select low carbon food ingredients or locally
grown/producedfoodtoreducefoodmileageNil
Avoid use of disposable utensils in events Nil
Minimise product packaging Nil
Optimise route planning for transportation and goods
deliveryNil
Bigger does not mean better. An oversized air conditioner is less energy efficient, more expensive and have a shorter lifespan due to constant starting and stopping.
An office of an import & export company has saved 5 tonnes of CO 2 and HK$10,000 per month by implementing a management policy to switch off the chiller plants after 9pm.
An office has reduced 11% of annual energy consumption by adopting anISO50001EnergyManagementSystem.
Guide to Low Carbon Offices24ENVIRONMENTAL PROTECTION DEPARTMENT
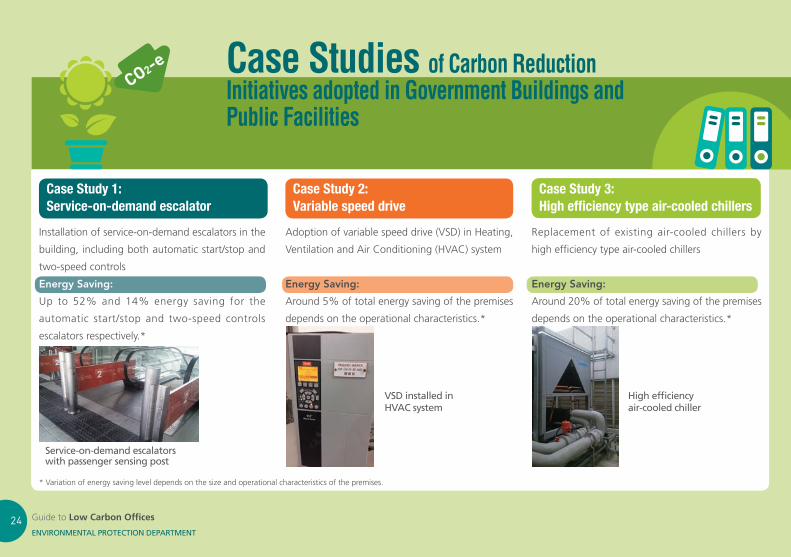
CO2-e Case Studies of Carbon ReductionInitiatives adopted in Government Buildings and Public Facilities
Service-on-demandescalatorswith passenger sensing post
VSDinstalledinHVAC system
High efficiency air-cooled chiller
Case Study 3:High efficiency type air-cooled chillers
Replacementof existing air-cooled chillers by
high efficiency type air-cooled chillers
Energy Saving:
Around 20% of total energy saving of the premises
depends on the operational characteristics.*
Case Study 1:Service-on-demand escalator
Installation of service-on-demand escalators in the
building,includingbothautomaticstart/stopand
two-speed controls
Energy Saving:
Up to 52% and 14% energy saving for the
automatic start/stop and two-speed controls
escalators respectively.*
Case Study 2:Variable speed drive
Adoptionofvariablespeeddrive(VSD)inHeating,
VentilationandAirConditioning(HVAC)system
Energy Saving:
Around 5% of total energy saving of the premises
depends on the operational characteristics.*
*Variationofenergysavingleveldependsonthesizeandoperationalcharacteristicsofthepremises.

Guide to Low Carbon Offices25ENVIRONMENTAL PROTECTION DEPARTMENT
Case Studies
1. EMSD Headquarters
In this chapter we highlight exemplary practices of carbon management in the Government/private sector
Profile••
ThenewEMSDHeadquartersBuildingatKowloonBayopenedin2005Thebuildingexhibitedanexcellentshowcaseofsustainabledevelopmentthroughrenovatingthestructureofaformer air cargo terminal building into an office-cum-workshop building with environmentally friendly design and application of advanced energy efficient technologies
Major Features•
•
••••
Solarphotovoltaicpanelsystemcomprisingover2,300numberofphotovoltaicpanelsonrooftopcapableofgenerating 350kW peak renewable powerOtherrenewable installations includebuilding integratedphotovoltaicpanel,suntrackingphotovoltaicsystem,solar hot water system and solar lamp poleMaximisetheuseofnaturaldaylightincludingadoptionofsunpipestoilluminatebuildinginternalareasOneofthepioneerstousehighenergyefficiencyoil-freechillertoreduceenergyconsumptioninair-conditioningSettingupofgreenwallsinbuildinginternalandexternalforenvironmentalimprovementRecyclerainwaterandwastewaterbyrainwaterharvestingsystemandgreywaterrecyclingsystemforirrigationand toilet flushing
CO2-e
Guide to Low Carbon Offices
ENVIRONMENTAL PROTECTION DEPARTMENT
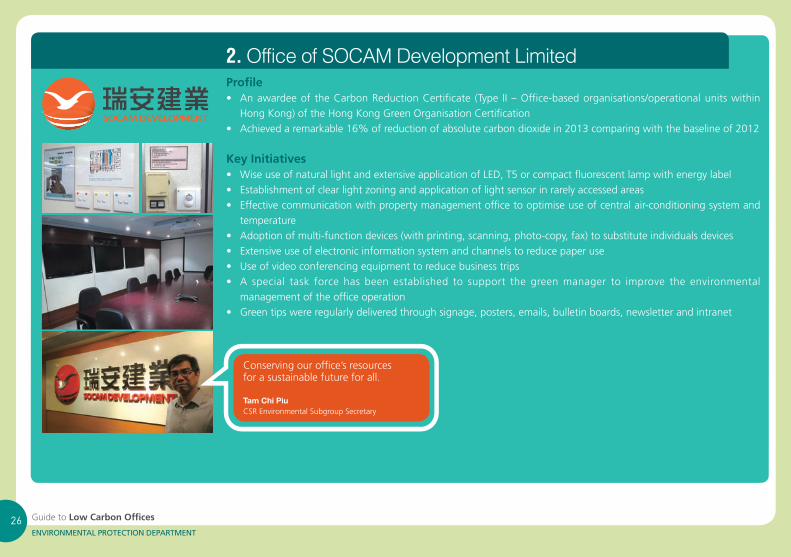
2. Office of SOCAM Development LimitedProfile•
•
Anawardeeof theCarbonReductionCertificate (Type II–Office-basedorganisations/operationalunitswithinHongKong)oftheHongKongGreenOrganisationCertificationAchievedaremarkable16%ofreductionofabsolutecarbondioxidein2013comparingwiththebaselineof2012
Key InitiativesWiseuseofnaturallightandextensiveapplicationofLED,T5orcompactfluorescentlampwithenergylabelEstablishmentofclearlightzoningandapplicationoflightsensorinrarelyaccessedareasEffectivecommunicationwithpropertymanagementofficetooptimiseuseofcentralair-conditioningsystemandtemperatureAdoptionofmulti-functiondevices(withprinting,scanning,photo-copy,fax)tosubstituteindividualsdevicesExtensiveuseofelectronicinformationsystemandchannelstoreducepaperuseUseofvideoconferencingequipmenttoreducebusinesstripsA special task forcehasbeenestablished to support thegreenmanager to improve the environmentalmanagementoftheofficeoperationGreentipswereregularlydeliveredthroughsignage,posters,emails,bulletinboards,newsletterandintranet
•••
••••
•
Conservingouroffice’sresourcesforasustainablefutureforall.
Tam Chi PiuCSREnvironmentalSubgroupSecretary
Pantone Warm Red C
Corporate Logo - 2 Colour Duotone Version
Date: 27-10-201190% Process Black
26
Guide to Low Carbon Offices27ENVIRONMENTAL PROTECTION DEPARTMENT
Useful ResourcesA. General References (in alphabetical order)
•
•
•
•
•
•
CarbonAuditToolkitforSmallandMediumEnterprisesinHongKong
http://www6.cityu.edu.hk/aerc/sme/images/sme_eng.pdf
CarbonReductionCertificatesSchemeofHongKongAwardsforEnvironmentalExcellence(HKAEE)
http://www.hkaee.gov.hk/english/category/carbonless_cert/28.html
ISO14064-1:2006Greenhousegases—Part1:Specificationwithguidanceat theorganisation level forquantificationand
reporting of greenhouse gas emissions and removals
http://www.iso.org/iso/catalogue_detail?csnumber=38381
Greenhousegasemissionsandcarbonintensity
https://www.climateready.gov.hk/files/pdf/HKGHG_CarbonIntensity_201612.pdf
Greenhousegasemissionsbysector
https://www.climateready.gov.hk/files/pdf/HKGHG_Sectors_201612.pdf
Greenhousegasemissiontrend
https://www.climateready.gov.hk/files/pdf/HKGHG_Trend_201612.pdf
Guide to Low Carbon Offices28ENVIRONMENTAL PROTECTION DEPARTMENT
CO2-e
•
•
•
GuidelinestoAccountforAndReportonGreenhouseGasEmissionsandRemovalsforBuildingsinHongKong
https://www.climateready.gov.hk/page.php?id=56&lang=1
HKEENet
http://ee.emsd.gov.hk/eindex.html
TheGHGProtocol—CorporateAccountingandReportingStandard
http://www.ghgprotocol.org
B. Office Specific References (in alphabetical order)
•
•
CarbonTrust—CreatinganAwarenessCampaignGuide
https://www.carbontrust.com/resources/guides/energy-efficiency/creating-an-awareness-campaign-download/
Low-carbonOfficeOperationProgrammeofWWF-HongKong
https://loop.wwf.org.hk
C. Carbon Calculators
There is a wide range of calculators available which help individuals and organisations to measure their carbon footprints.
These calculators also provide useful information about carbon reduction. Some examples (in alphabetical order) are provided
below:
For general use internationally
• CalculationTools—TheGreenhouseGasProtocolInitiative
http://www.ghgprotocol.org/calculation-tools
Guide to Low Carbon Offices29ENVIRONMENTAL PROTECTION DEPARTMENT
For local household and personal use
• CarbonCalculator—HongKongAndChinaGasCompanyLimited
http://www.lowcarbonaction.com/en/footprint.aspx
For local household
• CarbonCalculator—TheHongkongElectricCo.Ltd
https://www.hkelectric.com/en/customer-services/carbon-calculator
For local household, retail, catering, school and office
• CarbonManager—TheCouncilforSustainableDevelopment
http://carbon-manager.hkpc.org/website/eng/index.asp
For local enterprises, especially SMEs
• CGCC-CarbonManagementTool—TheChineseGeneralChamberofCommerce
http://cmt.cgcc.org.hk/eng/home.html
For local household and personal use
• OneTonneChallengeCalculator—KadoorieFarmandBotanicGarden(KFBG)Corporation
http://www.climatechange.hk/eng/join-now.aspx
For buildings of commercial, residential or institutional purposes
• Electronicversion(Excel)oftemplateforconductingcarbonauditandforreportingthefindings
https://www.carbon-footprint.hk/node/52
Guide to Low Carbon Offices30ENVIRONMENTAL PROTECTION DEPARTMENT
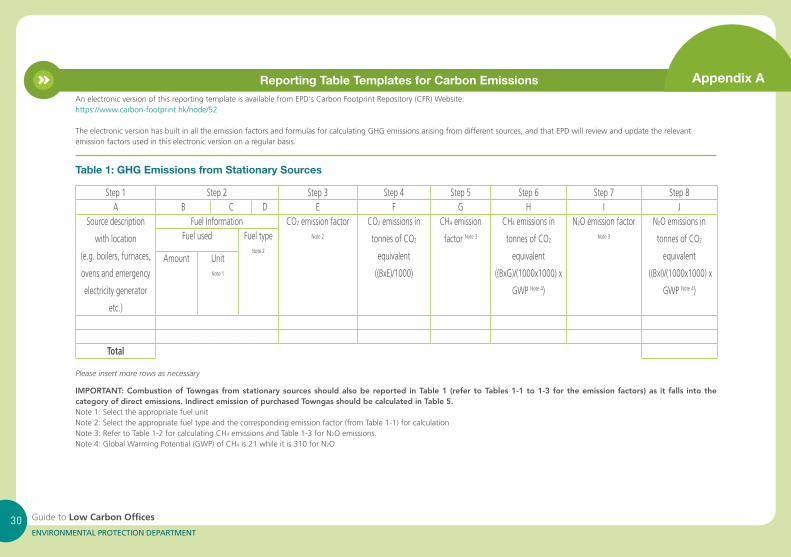
Reporting Table Templates for Carbon EmissionsAnelectronicversionofthisreportingtemplateisavailablefromEPD’s Carbon Footprint Repository (CFR) Website:https://www.carbon-footprint.hk/node/52
The electronic version has built in all the emission factors and formulas for calculating GHG emissions arising from different sources, and that EPD will review and update the relevant emission factors used in this electronic version on a regular basis.
Table 1: GHG Emissions from Stationary Sources
Step 1 Step 2 Step 3 Step 4 Step 5 Step 6 Step 7 Step 8A B C D E F G H I J
Source description
with location
(e.g. boilers, furnaces,
ovens and emergency
electricity generator
etc.)
Fuel Information CO2 emission factor Note 2
CO2 emissions in
tonnes of CO2
equivalent
((BxE)/1000)
CH4 emission
factor Note 3
CH4 emissions in
tonnes of CO2
equivalent
((BxG)/(1000x1000)x
GWP Note 4)
N2O emission factor Note 3
N2O emissions in
tonnes of CO2
equivalent
((BxI)/(1000x1000)x
GWP Note 4)
Fuel used Fuel typeNote 2
Amount UnitNote 1
Total
Please insert more rows as necessary
IMPORTANT: Combustion of Towngas from stationary sources should also be reported in Table 1 (refer to Tables 1-1 to 1-3 for the emission factors) as it falls into the category of direct emissions. Indirect emission of purchased Towngas should be calculated in Table 5.Note 1: Select the appropriate fuel unitNote 2: Select the appropriate fuel type and the corresponding emission factor (from Table 1-1) for calculationNote3:RefertoTable1-2forcalculatingCH4 emissions and Table 1-3 for N2O emissions.Note 4: Global Warming Potential (GWP) of CH4 is 21 while it is 310 for N2O
Appendix A
Guide to Low Carbon Offices31ENVIRONMENTAL PROTECTION DEPARTMENT
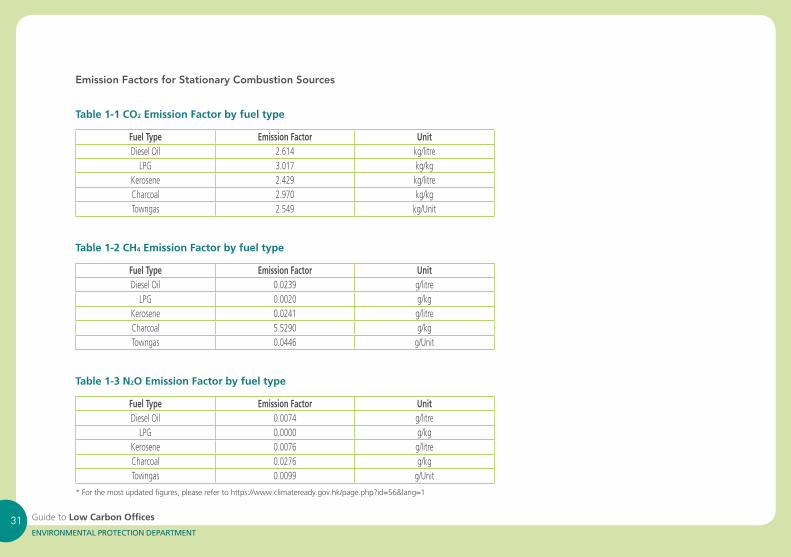
Emission Factors for Stationary Combustion Sources
Table 1-1 CO2 Emission Factor by fuel type
Fuel Type Emission Factor UnitDiesel Oil 2.614 kg/litre
LPG 3.017 kg/kgKerosene 2.429 kg/litreCharcoal 2.970 kg/kgTowngas 2.549 kg/Unit
Table 1-2 CH4 Emission Factor by fuel type
Fuel Type Emission Factor UnitDiesel Oil 0.0239 g/litre
LPG 0.0020 g/kgKerosene 0.0241 g/litreCharcoal 5.5290 g/kgTowngas 0.0446 g/Unit
Table 1-3 N2O Emission Factor by fuel type
Fuel Type Emission Factor UnitDiesel Oil 0.0074 g/litre
LPG 0.0000 g/kgKerosene 0.0076 g/litreCharcoal 0.0276 g/kgTowngas 0.0099 g/Unit
*Forthemostupdatedfigures,pleaserefertohttps://www.climateready.gov.hk/page.php?id=56&lang=1
Guide to Low Carbon Offices32ENVIRONMENTAL PROTECTION DEPARTMENT
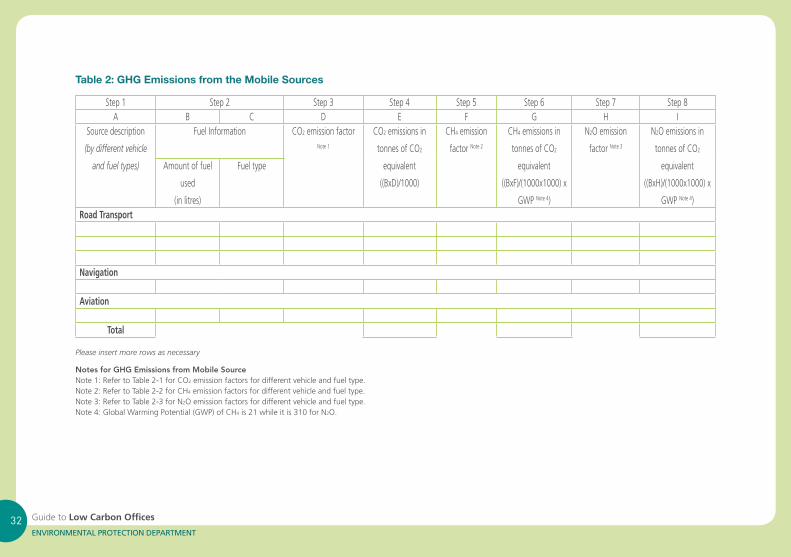
Table 2: GHG Emissions from the Mobile Sources
Step 1 Step 2 Step 3 Step 4 Step 5 Step 6 Step 7 Step 8A B C D E F G H I
Source description
(by different vehicle
and fuel types)
Fuel Information CO2 emission factor Note 1
CO2 emissions in
tonnes of CO2
equivalent
((BxD)/1000)
CH4 emission
factor Note 2
CH4 emissions in
tonnes of CO2
equivalent
((BxF)/(1000x1000)x
GWP Note 4)
N2O emission
factor Note 3
N2O emissions in
tonnes of CO2
equivalent
((BxH)/(1000x1000)x
GWP Note 4)
Amount of fuel
used
(in litres)
Fuel type
Road Transport
Navigation
Aviation
Total
Please insert more rows as necessary
Notes for GHG Emissions from Mobile SourceNote1:RefertoTable2-1forCO2 emission factors for different vehicle and fuel type.Note2:RefertoTable2-2forCH4 emission factors for different vehicle and fuel type.Note3:RefertoTable2-3forN2O emission factors for different vehicle and fuel type.Note 4: Global Warming Potential (GWP) of CH4 is 21 while it is 310 for N2O.
Guide to Low Carbon Offices33ENVIRONMENTAL PROTECTION DEPARTMENT
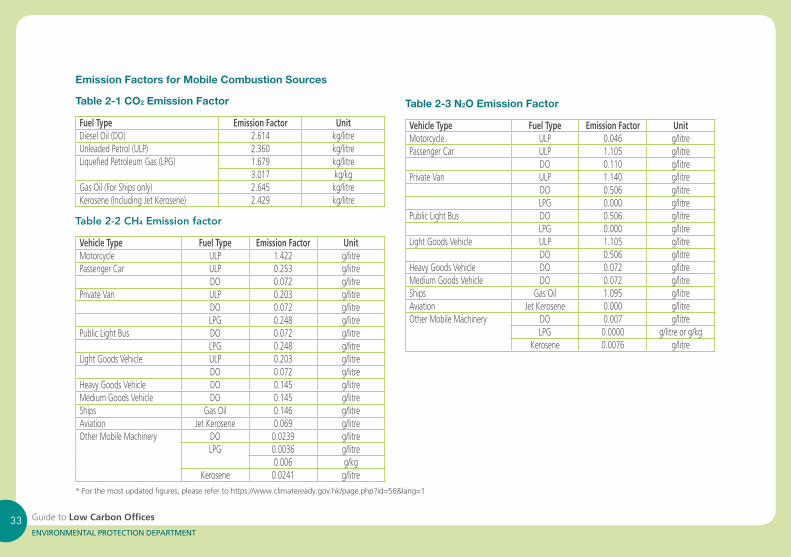
Emission Factors for Mobile Combustion Sources
Table 2-1 CO2 Emission Factor
Fuel Type Emission Factor UnitDiesel Oil (DO) 2.614 kg/litreUnleadedPetrol(ULP) 2.360 kg/litreLiquefiedPetroleumGas(LPG) 1.679 kg/litre
3.017 kg/kgGas Oil (For Ships only) 2.645 kg/litreKerosene (Including Jet Kerosene) 2.429 kg/litre
Table 2-2 CH4 Emission factor
Vehicle Type Fuel Type Emission Factor UnitMotorcycle ULP 1.422 g/litrePassenger Car ULP 0.253 g/litre
DO 0.072 g/litrePrivateVan ULP 0.203 g/litre
DO 0.072 g/litreLPG 0.248 g/litre
PublicLightBus DO 0.072 g/litreLPG 0.248 g/litre
LightGoodsVehicle ULP 0.203 g/litreDO 0.072 g/litre
HeavyGoodsVehicle DO 0.145 g/litreMediumGoodsVehicle DO 0.145 g/litreShips Gas Oil 0.146 g/litreAviation Jet Kerosene 0.069 g/litreOther Mobile Machinery DO 0.0239 g/litre
LPG 0.0036 g/litre0.006 g/kg
Kerosene 0.0241 g/litre*Forthemostupdatedfigures,pleaserefertohttps://www.climateready.gov.hk/page.php?id=56&lang=1
Table 2-3 N2O Emission Factor
Vehicle Type Fuel Type Emission Factor UnitMotorcycle ULP 0.046 g/litrePassenger Car ULP 1.105 g/litre
DO 0.110 g/litrePrivateVan ULP 1.140 g/litre
DO 0.506 g/litreLPG 0.000 g/litre
PublicLightBus DO 0.506 g/litreLPG 0.000 g/litre
LightGoodsVehicle ULP 1.105 g/litreDO 0.506 g/litre
HeavyGoodsVehicle DO 0.072 g/litreMediumGoodsVehicle DO 0.072 g/litreShips Gas Oil 1.095 g/litreAviation Jet Kerosene 0.000 g/litreOther Mobile Machinery DO 0.007 g/litre
LPG 0.0000 g/litreorg/kgKerosene 0.0076 g/litre
Guide to Low Carbon Offices34ENVIRONMENTAL PROTECTION DEPARTMENT
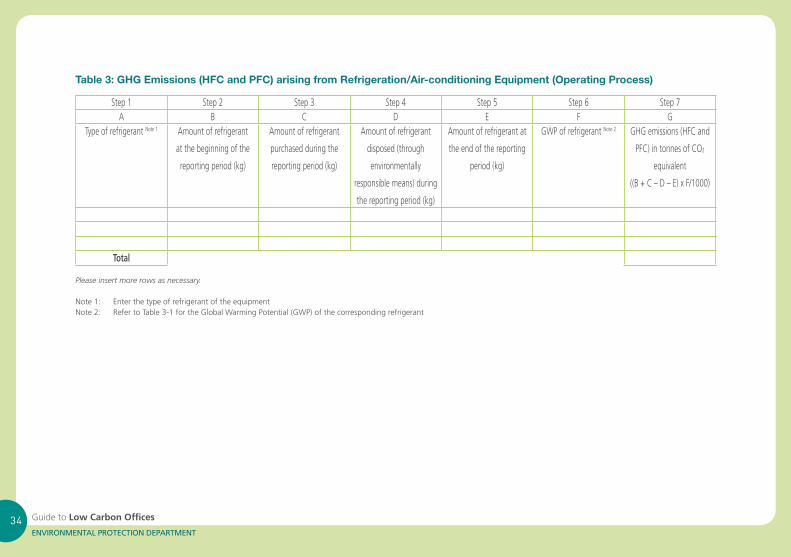
Table 3: GHG Emissions (HFC and PFC) arising from Refrigeration/Air-conditioning Equipment (Operating Process)
Step 1 Step 2 Step 3 Step 4 Step 5 Step 6 Step 7A B C D E F G
Type of refrigerant Note 1 Amount of refrigerant
at the beginning of the
reporting period (kg)
Amount of refrigerant
purchased during the
reporting period (kg)
Amount of refrigerant
disposed (through
environmentally
responsible means) during
the reporting period (kg)
Amount of refrigerant at
the end of the reporting
period (kg)
GWP of refrigerant Note 2 GHG emissions (HFC and
PFC) in tonnes of CO2
equivalent
((B+C–D–E)xF/1000)
Total
Please insert more rows as necessary.
Note 1: Enter the type of refrigerant of the equipmentNote2: RefertoTable3-1fortheGlobalWarmingPotential(GWP)ofthecorrespondingrefrigerant
Guide to Low Carbon Offices35ENVIRONMENTAL PROTECTION DEPARTMENT
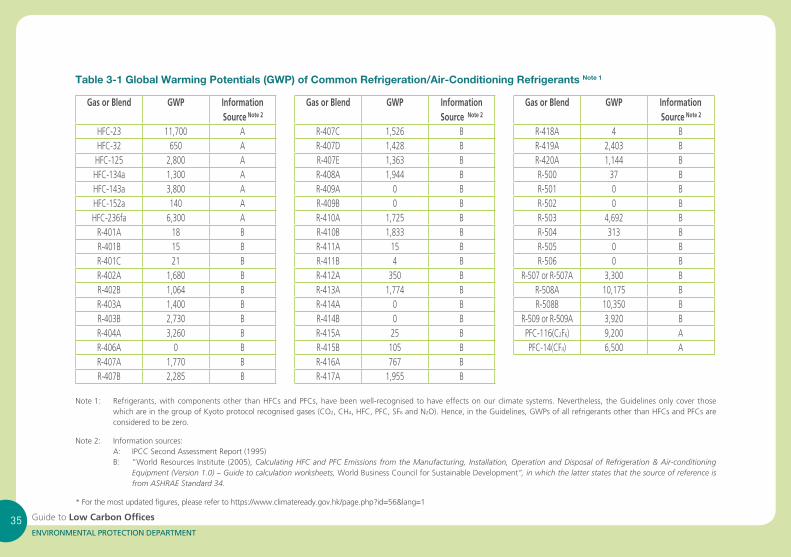
Table 3-1 Global Warming Potentials (GWP) of Common Refrigeration/Air-Conditioning Refrigerants Note 1
Gas or Blend GWP Information Source Note 2
Gas or Blend GWP Information Source Note 2
Gas or Blend GWP Information Source Note 2
HFC-23 11,700 A R-407C 1,526 B R-418A 4 BHFC-32 650 A R-407D 1,428 B R-419A 2,403 B
HFC-125 2,800 A R-407E 1,363 B R-420A 1,144 BHFC-134a 1,300 A R-408A 1,944 B R-500 37 BHFC-143a 3,800 A R-409A 0 B R-501 0 BHFC-152a 140 A R-409B 0 B R-502 0 BHFC-236fa 6,300 A R-410A 1,725 B R-503 4,692 BR-401A 18 B R-410B 1,833 B R-504 313 BR-401B 15 B R-411A 15 B R-505 0 BR-401C 21 B R-411B 4 B R-506 0 BR-402A 1,680 B R-412A 350 B R-507orR-507A 3,300 BR-402B 1,064 B R-413A 1,774 B R-508A 10,175 BR-403A 1,400 B R-414A 0 B R-508B 10,350 BR-403B 2,730 B R-414B 0 B R-509orR-509A 3,920 BR-404A 3,260 B R-415A 25 B PFC-116(C2F6) 9,200 AR-406A 0 B R-415B 105 B PFC-14(CF4) 6,500 AR-407A 1,770 B R-416A 767 BR-407B 2,285 B R-417A 1,955 B
Note1: Refrigerants,withcomponentsotherthanHFCsandPFCs,havebeenwell-recognisedtohaveeffectsonourclimatesystems.Nevertheless,theGuidelinesonlycoverthosewhich are in the group of Kyoto protocol recognised gases (CO2, CH4, HFC, PFC, SF6 and N2O). Hence, in the Guidelines, GWPs of all refrigerants other than HFCs and PFCs are considered to be zero.
Note 2: Information sources:A: IPCCSecondAssessmentReport(1995)B: “WorldResources Institute (2005),Calculating HFC and PFC Emissions from the Manufacturing, Installation, Operation and Disposal of Refrigeration & Air-conditioning
Equipment (Version 1.0) – Guide to calculation worksheets, World Business Council for Sustainable Development”, in which the latter states that the source of reference is from ASHRAE Standard 34.
*Forthemostupdatedfigures,pleaserefertohttps://www.climateready.gov.hk/page.php?id=56&lang=1
Guide to Low Carbon Offices36ENVIRONMENTAL PROTECTION DEPARTMENT
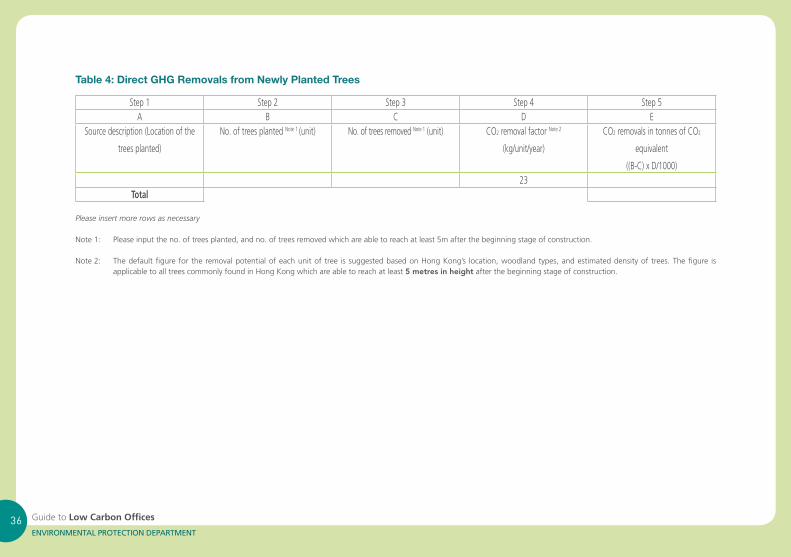
Table 4: Direct GHG Removals from Newly Planted Trees
Step 1 Step 2 Step 3 Step 4 Step 5A B C D E
Sourcedescription(Locationofthe
trees planted)
No. of trees planted Note 1 (unit) No. of trees removed Note 1 (unit) CO2 removal factor Note 2
(kg/unit/year)
CO2 removals in tonnes of CO2
equivalent
((B-C)xD/1000)23
Total
Please insert more rows as necessary
Note 1: Please input the no. of trees planted, and no. of trees removed which are able to reach at least 5m after the beginning stage of construction.
Note 2: The default figure for the removal potential of each unit of tree is suggested based on Hong Kong’s location, woodland types, and estimated density of trees. The figure is applicable to all trees commonly found in Hong Kong which are able to reach at least 5 metres in height after the beginning stage of construction.
Guide to Low Carbon Offices37ENVIRONMENTAL PROTECTION DEPARTMENT
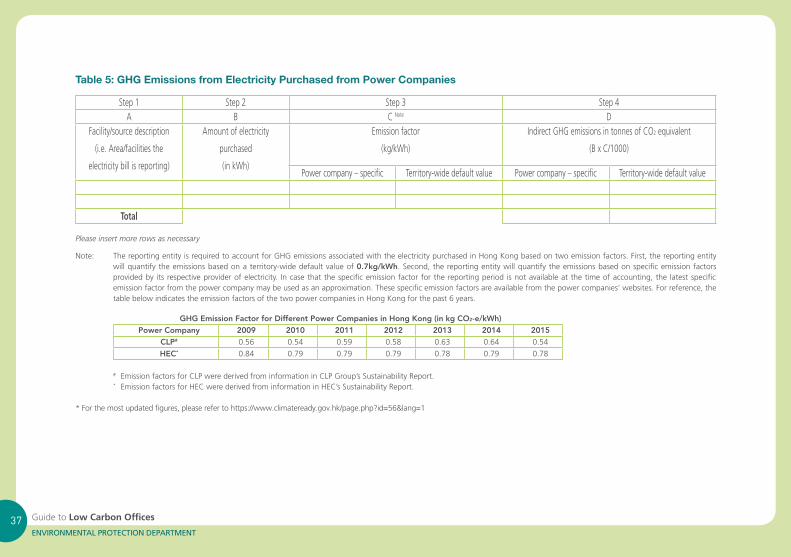
Table 5: GHG Emissions from Electricity Purchased from Power Companies
Step 1 Step 2 Step 3 Step 4A B C Note D
Facility/sourcedescription
(i.e.Area/facilitiesthe
electricity bill is reporting)
Amount of electricity
purchased
(in kWh)
Emission factor
(kg/kWh)
Indirect GHG emissions in tonnes of CO2 equivalent
(BxC/1000)
Powercompany–specific Territory-wide default value Powercompany–specific Territory-wide default value
Total
Please insert more rows as necessary
Note: The reporting entity is required to account for GHG emissions associated with the electricity purchased in Hong Kong based on two emission factors. First, the reporting entity will quantify the emissions based on a territory-wide default value of 0.7kg/kWh. Second, the reporting entity will quantify the emissions based on specific emission factors provided by its respective provider of electricity. In case that the specific emission factor for the reporting period is not available at the time of accounting, the latest specific emission factor from the power company may be used as an approximation. These specific emission factors are available from the power companies’ websites. For reference, the table below indicates the emission factors of the two power companies in Hong Kong for the past 6 years.
GHG Emission Factor for Different Power Companies in Hong Kong (in kg CO2-e/kWh)Power Company 2009 2010 2011 2012 2013 2014 2015
CLP# 0.56 0.54 0.59 0.58 0.63 0.64 0.54
HEC* 0.84 0.79 0.79 0.79 0.78 0.79 0.78
# EmissionfactorsforCLPwerederivedfrominformationinCLPGroup’sSustainabilityReport.* EmissionfactorsforHECwerederivedfrominformationinHEC’sSustainabilityReport.
*Forthemostupdatedfigures,pleaserefertohttps://www.climateready.gov.hk/page.php?id=56&lang=1
Guide to Low Carbon Offices38ENVIRONMENTAL PROTECTION DEPARTMENT
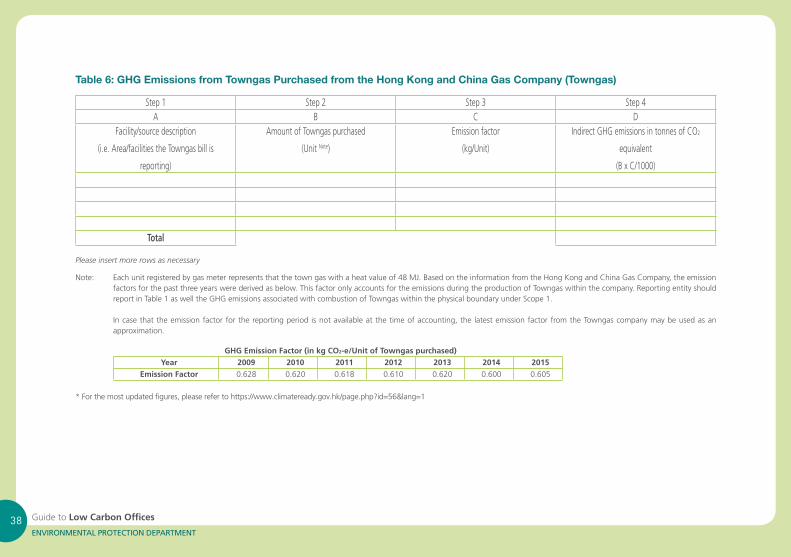
Table 6: GHG Emissions from Towngas Purchased from the Hong Kong and China Gas Company (Towngas)
Step 1 Step 2 Step 3 Step 4A B C D
Facility/sourcedescription
(i.e.Area/facilitiestheTowngasbillis
reporting)
Amount of Towngas purchased
(Unit Note)
Emission factor
(kg/Unit)
Indirect GHG emissions in tonnes of CO2
equivalent
(BxC/1000)
Total
Please insert more rows as necessary
Note: Each unit registered by gas meter represents that the town gas with a heat value of 48 MJ. Based on the information from the Hong Kong and China Gas Company, the emission factorsforthepastthreeyearswerederivedasbelow.ThisfactoronlyaccountsfortheemissionsduringtheproductionofTowngaswithinthecompany.Reportingentityshouldreport in Table 1 as well the GHG emissions associated with combustion of Towngas within the physical boundary under Scope 1.
In case that the emission factor for the reporting period is not available at the time of accounting, the latest emission factor from the Towngas company may be used as an approximation.
GHG Emission Factor (in kg CO2-e/Unit of Towngas purchased)Year 2009 2010 2011 2012 2013 2014 2015
Emission Factor 0.628 0.620 0.618 0.610 0.620 0.600 0.605
*Forthemostupdatedfigures,pleaserefertohttps://www.climateready.gov.hk/page.php?id=56&lang=1
Guide to Low Carbon Offices39ENVIRONMENTAL PROTECTION DEPARTMENT
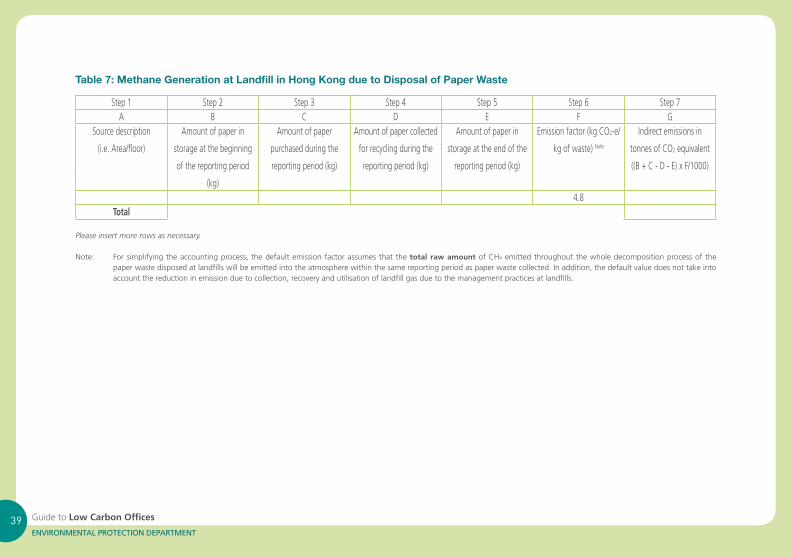
Table 7: Methane Generation at Landfill in Hong Kong due to Disposal of Paper Waste
Step 1 Step 2 Step 3 Step 4 Step 5 Step 6 Step 7A B C D E F G
Source description
(i.e.Area/floor)
Amount of paper in
storage at the beginning
of the reporting period
(kg)
Amount of paper
purchased during the
reporting period (kg)
Amount of paper collected
for recycling during the
reporting period (kg)
Amount of paper in
storage at the end of the
reporting period (kg)
Emission factor (kg CO2-e/
kg of waste) Note
Indirect emissions in
tonnes of CO2 equivalent
((B+C-D-E)xF/1000)
4.8Total
Please insert more rows as necessary.
Note: For simplifying the accounting process, the default emission factor assumes that the total raw amount of CH4 emitted throughout the whole decomposition process of the paper waste disposed at landfills will be emitted into the atmosphere within the same reporting period as paper waste collected. In addition, the default value does not take into account the reduction in emission due to collection, recovery and utilisation of landfill gas due to the management practices at landfills.
Guide to Low Carbon Offices40ENVIRONMENTAL PROTECTION DEPARTMENT
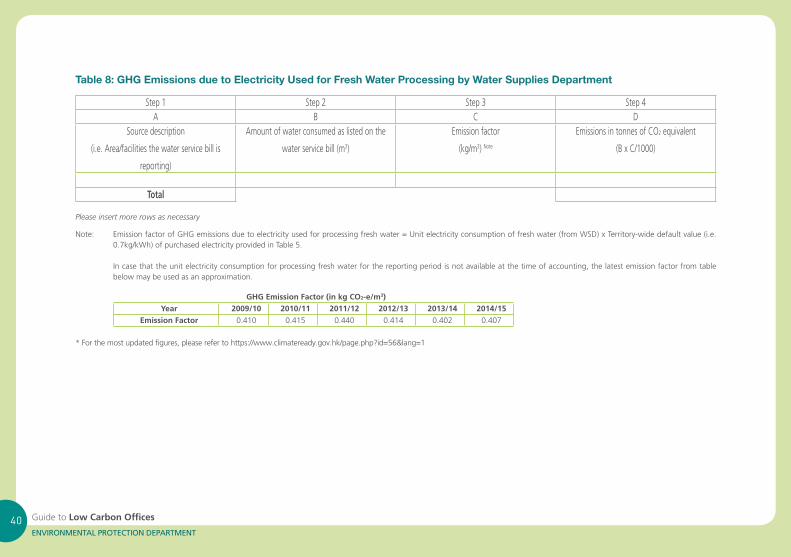
Table 8: GHG Emissions due to Electricity Used for Fresh Water Processing by Water Supplies Department
Step 1 Step 2 Step 3 Step 4A B C D
Source description
(i.e.Area/facilitiesthewaterservicebillis
reporting)
Amount of water consumed as listed on the
water service bill (m3)
Emission factor
(kg/m3) Note
Emissions in tonnes of CO2 equivalent
(BxC/1000)
Total
Please insert more rows as necessary
Note: Emission factor of GHG emissions due to electricity used for processing fresh water = Unit electricity consumption of fresh water (from WSD) x Territory-wide default value (i.e. 0.7kg/kWh)ofpurchasedelectricityprovidedinTable5.
In case that the unit electricity consumption for processing fresh water for the reporting period is not available at the time of accounting, the latest emission factor from table below may be used as an approximation.
GHG Emission Factor (in kg CO2-e/m3)Year 2009/10 2010/11 2011/12 2012/13 2013/14 2014/15
Emission Factor 0.410 0.415 0.440 0.414 0.402 0.407
*Forthemostupdatedfigures,pleaserefertohttps://www.climateready.gov.hk/page.php?id=56&lang=1
Guide to Low Carbon Offices41ENVIRONMENTAL PROTECTION DEPARTMENT
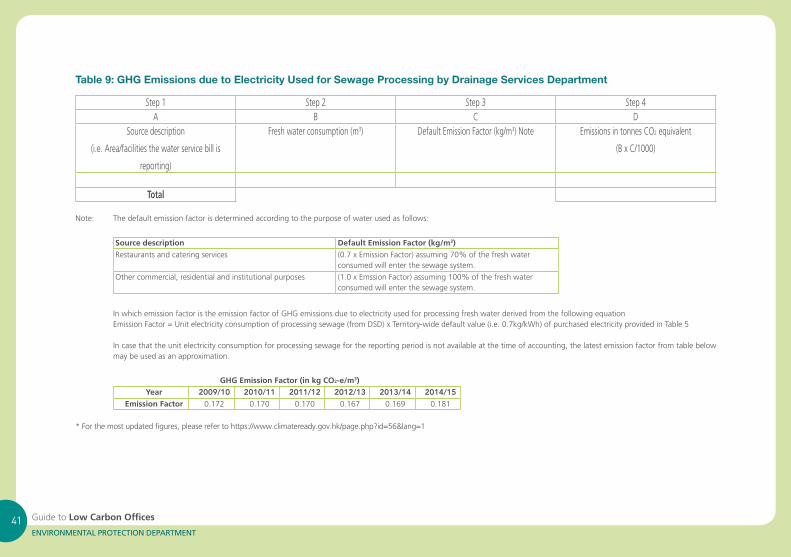
Table 9: GHG Emissions due to Electricity Used for Sewage Processing by Drainage Services Department
Step 1 Step 2 Step 3 Step 4A B C D
Source description
(i.e.Area/facilitiesthewaterservicebillis
reporting)
Fresh water consumption (m3) DefaultEmissionFactor(kg/m3) Note Emissions in tonnes CO2 equivalent
(BxC/1000)
Total
Note: The default emission factor is determined according to the purpose of water used as follows:
Source description Default Emission Factor (kg/m3)Restaurantsandcateringservices (0.7 x Emission Factor) assuming 70% of the fresh water
consumed will enter the sewage system.
Other commercial, residential and institutional purposes (1.0 x Emssion Factor) assuming 100% of the fresh water consumed will enter the sewage system.
In which emission factor is the emission factor of GHG emissions due to electricity used for processing fresh water derived from the following equationEmissionFactor=Unitelectricityconsumptionofprocessingsewage(fromDSD)xTerritory-widedefaultvalue(i.e.0.7kg/kWh)ofpurchasedelectricityprovidedinTable5
In case that the unit electricity consumption for processing sewage for the reporting period is not available at the time of accounting, the latest emission factor from table below may be used as an approximation.
GHG Emission Factor (in kg CO2-e/m3)Year 2009/10 2010/11 2011/12 2012/13 2013/14 2014/15
Emission Factor 0.172 0.170 0.170 0.167 0.169 0.181
*Forthemostupdatedfigures,pleaserefertohttps://www.climateready.gov.hk/page.php?id=56&lang=1
Guide to Low Carbon Offices42ENVIRONMENTAL PROTECTION DEPARTMENT
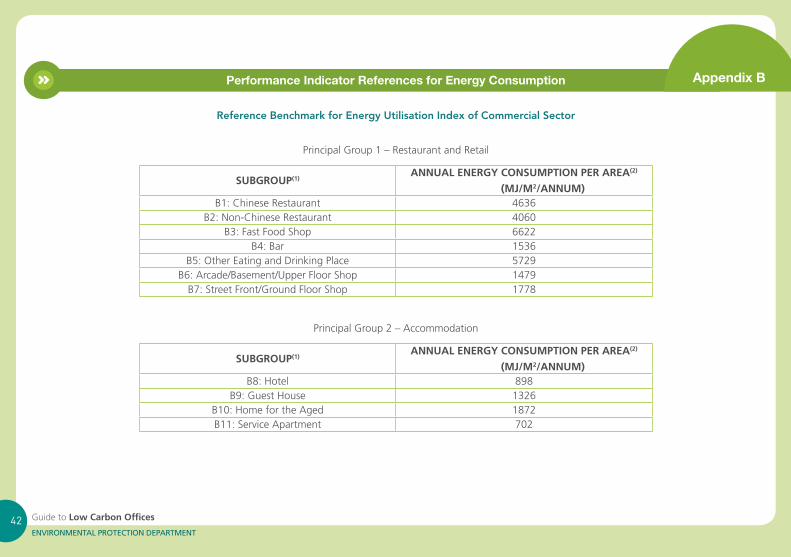
Appendix BPerformance Indicator References for Energy Consumption
Reference Benchmark for Energy Utilisation Index of Commercial Sector
PrincipalGroup1–RestaurantandRetail
SUBGROUP(1)ANNUAL ENERGY CONSUMPTION PER AREA(2)
(MJ/M2/ANNUM)B1:ChineseRestaurant 4636
B2:Non-ChineseRestaurant 4060B3: Fast Food Shop 6622
B4: Bar 1536B5: Other Eating and Drinking Place 5729
B6:Arcade/Basement/UpperFloorShop 1479B7:StreetFront/GroundFloorShop 1778
PrincipalGroup2–Accommodation
SUBGROUP(1)ANNUAL ENERGY CONSUMPTION PER AREA(2)
(MJ/M2/ANNUM)B8: Hotel 898
B9: Guest House 1326B10: Home for the Aged 1872B11: Service Apartment 702
Guide to Low Carbon Offices43ENVIRONMENTAL PROTECTION DEPARTMENT
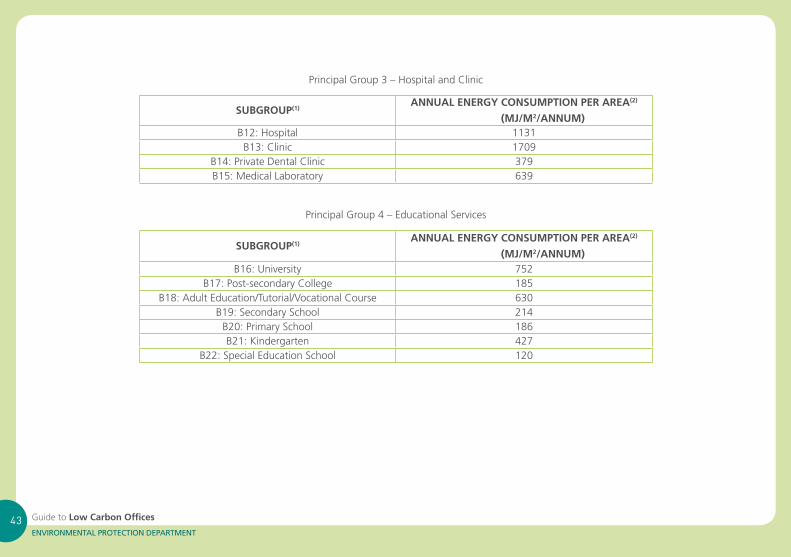
PrincipalGroup3–HospitalandClinic
SUBGROUP(1)ANNUAL ENERGY CONSUMPTION PER AREA(2)
(MJ/M2/ANNUM)B12: Hospital 1131
B13: Clinic 1709B14: Private Dental Clinic 379B15:MedicalLaboratory 639
PrincipalGroup4–EducationalServices
SUBGROUP(1)ANNUAL ENERGY CONSUMPTION PER AREA(2)
(MJ/M2/ANNUM)B16: University 752
B17: Post-secondary College 185B18:AdultEducation/Tutorial/VocationalCourse 630
B19: Secondary School 214B20: Primary School 186B21: Kindergarten 427
B22: Special Education School 120
Guide to Low Carbon Offices44ENVIRONMENTAL PROTECTION DEPARTMENT
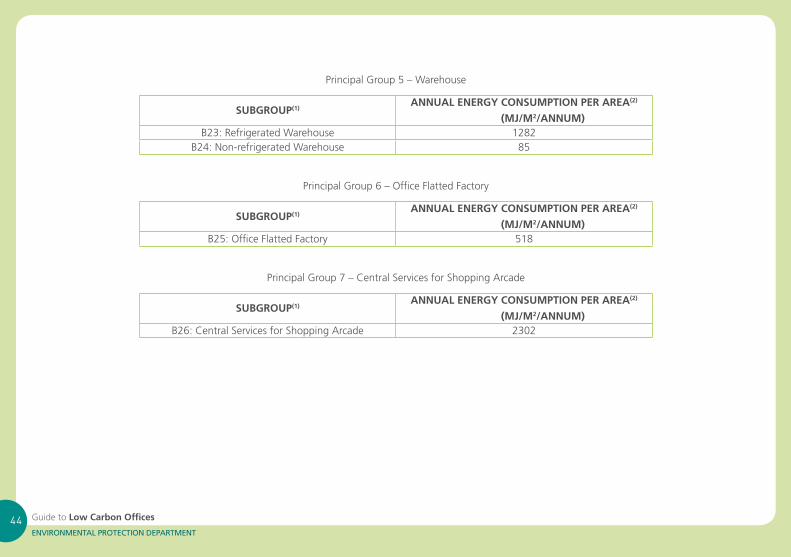
PrincipalGroup5–Warehouse
SUBGROUP(1)ANNUAL ENERGY CONSUMPTION PER AREA(2)
(MJ/M2/ANNUM)B23:RefrigeratedWarehouse 1282
B24: Non-refrigerated Warehouse 85
PrincipalGroup6–OfficeFlattedFactory
SUBGROUP(1)ANNUAL ENERGY CONSUMPTION PER AREA(2)
(MJ/M2/ANNUM)B25: Office Flatted Factory 518
PrincipalGroup7–CentralServicesforShoppingArcade
SUBGROUP(1)ANNUAL ENERGY CONSUMPTION PER AREA(2)
(MJ/M2/ANNUM)B26: Central Services for Shopping Arcade 2302
Guide to Low Carbon Offices45ENVIRONMENTAL PROTECTION DEPARTMENT
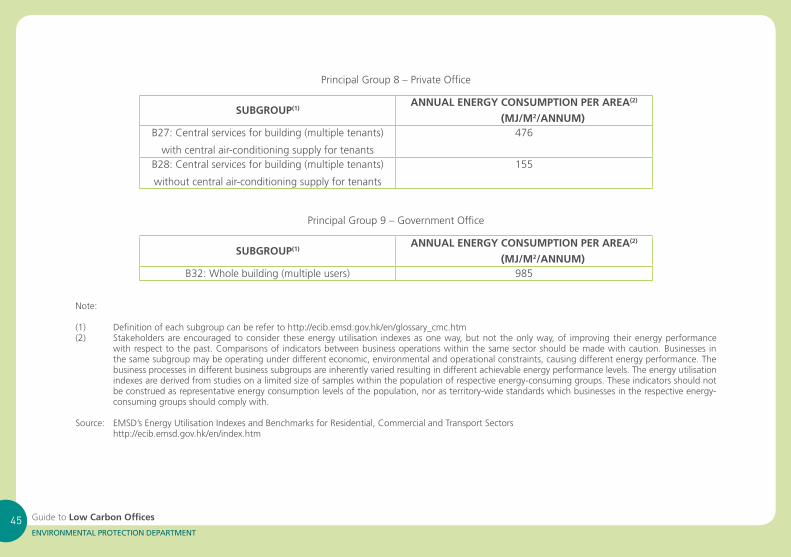
PrincipalGroup8–PrivateOffice
SUBGROUP(1)ANNUAL ENERGY CONSUMPTION PER AREA(2)
(MJ/M2/ANNUM)B27: Central services for building (multiple tenants)
with central air-conditioning supply for tenants
476
B28: Central services for building (multiple tenants)
without central air-conditioning supply for tenants
155
PrincipalGroup9–GovernmentOffice
SUBGROUP(1)ANNUAL ENERGY CONSUMPTION PER AREA(2)
(MJ/M2/ANNUM)B32: Whole building (multiple users) 985
Note:
(1) Definitionofeachsubgroupcanberefertohttp://ecib.emsd.gov.hk/en/glossary_cmc.htm(2) Stakeholders are encouraged to consider these energy utilisation indexes as one way, but not the only way, of improving their energy performance
with respect to the past. Comparisons of indicators between business operations within the same sector should be made with caution. Businesses in the same subgroup may be operating under different economic, environmental and operational constraints, causing different energy performance. The business processes in different business subgroups are inherently varied resulting in different achievable energy performance levels. The energy utilisation indexes are derived from studies on a limited size of samples within the population of respective energy-consuming groups. These indicators should not be construed as representative energy consumption levels of the population, nor as territory-wide standards which businesses in the respective energy-consuming groups should comply with.
Source: EMSD’sEnergyUtilisationIndexesandBenchmarksforResidential,CommercialandTransportSectors http://ecib.emsd.gov.hk/en/index.htm
Guide to Low Carbon Offices46ENVIRONMENTAL PROTECTION DEPARTMENT
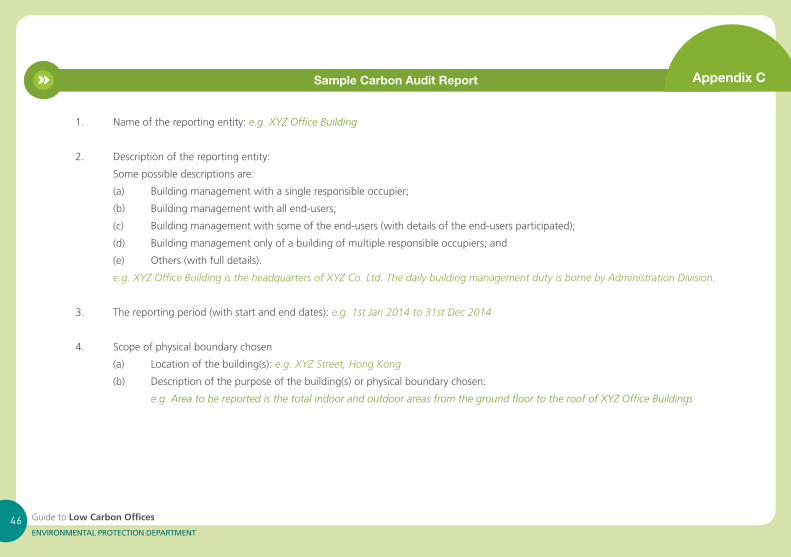
Sample Carbon Audit Report
1. Name of the reporting entity: e.g. XYZ Office Building
2. Description of the reporting entity:
Some possible descriptions are:
(a) Building management with a single responsible occupier;
(b) Building management with all end-users;
(c) Building management with some of the end-users (with details of the end-users participated);
(d) Building management only of a building of multiple responsible occupiers; and
(e) Others (with full details).
e.g. XYZ Office Building is the headquarters of XYZ Co. Ltd. The daily building management duty is borne by Administration Division.
3. The reporting period (with start and end dates): e.g. 1st Jan 2014 to 31st Dec 2014
4. Scope of physical boundary chosen
(a) Locationofthebuilding(s):e.g. XYZ Street, Hong Kong
(b) Description of the purpose of the building(s) or physical boundary chosen:
e.g. Area to be reported is the total indoor and outdoor areas from the ground floor to the roof of XYZ Office Buildings
Appendix C
Guide to Low Carbon Offices47ENVIRONMENTAL PROTECTION DEPARTMENT
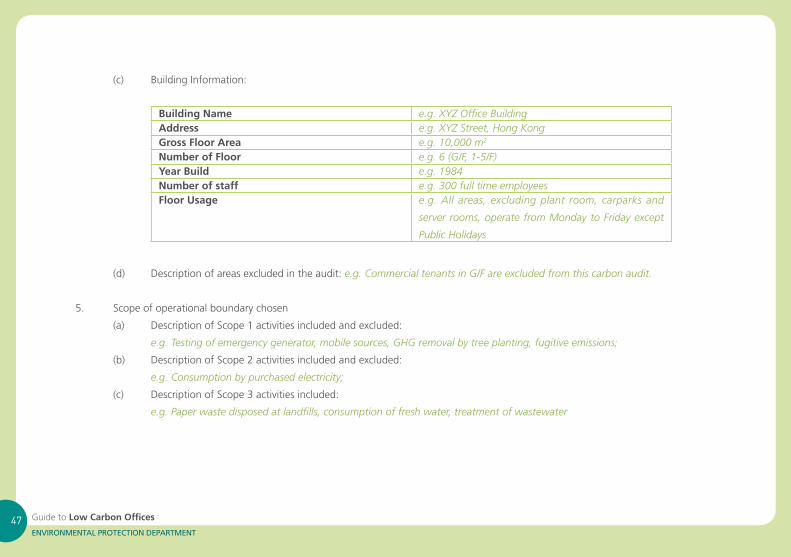
(c) Building Information:
Building Name e.g. XYZ Office BuildingAddress e.g. XYZ Street, Hong KongGross Floor Area e.g. 10,000 m2
Number of Floor e.g. 6 (G/F, 1-5/F)Year Build e.g. 1984Number of staff e.g. 300 full time employeesFloor Usage e.g. All areas, excluding plant room, carparks and
server rooms, operate from Monday to Friday except
Public Holidays
(d) Description of areas excluded in the audit: e.g. Commercial tenants in G/F are excluded from this carbon audit.
5. Scope of operational boundary chosen
(a) Description of Scope 1 activities included and excluded:
e.g. Testing of emergency generator, mobile sources, GHG removal by tree planting, fugitive emissions;
(b) Description of Scope 2 activities included and excluded:
e.g. Consumption by purchased electricity;
(c) Description of Scope 3 activities included:
e.g. Paper waste disposed at landfills, consumption of fresh water, treatment of wastewater
Guide to Low Carbon Offices48ENVIRONMENTAL PROTECTION DEPARTMENT
6. Methodologies
(a) ListofactivitiesforwhichsimplifiedmethodologiesandconversionfactorsintheGuidelinesareusedforquantification
(b) Details (including necessary reference) of other methodologies and conversion factors used for quantification
(c) Details of any changes in methodologies and conversion factors since the last report
(d) Details on any re-calculation of previously reported emissions and removals because of changes in methodologies and
conversion factors
e.g. The reporting and working procedures for calculating GHG emissions and removals as detailed in the “Guidelines to Account for
and Report on Greenhouse Gas Emissions and Removals for Building(Commercial, Residential or Institutional Purposes) in Hong Kong
– 2010 Edition” compiled by EPD and EMSD were adopted.
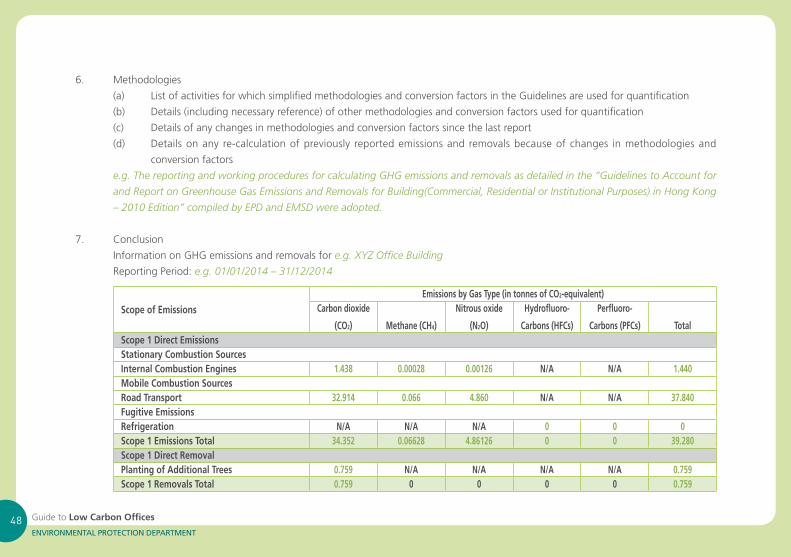
7. Conclusion
Information on GHG emissions and removals for e.g. XYZ Office Building
ReportingPeriod:e.g. 01/01/2014 – 31/12/2014
Scope of Emissions
Emissions by Gas Type (in tonnes of CO2-equivalent)Carbon dioxide
(CO2) Methane (CH4)
Nitrous oxide
(N2O)
Hydrofluoro-
Carbons (HFCs)
Perfluoro-
Carbons (PFCs) TotalScope 1 Direct EmissionsStationary Combustion SourcesInternal Combustion Engines 1.438 0.00028 0.00126 N/A N/A 1.440Mobile Combustion SourcesRoad Transport 32.914 0.066 4.860 N/A N/A 37.840Fugitive EmissionsRefrigeration N/A N/A N/A 0 0 0Scope 1 Emissions Total 34.352 0.06628 4.86126 0 0 39.280Scope 1 Direct RemovalPlanting of Additional Trees 0.759 N/A N/A N/A N/A 0.759Scope 1 Removals Total 0.759 0 0 0 0 0.759
Guide to Low Carbon Offices49ENVIRONMENTAL PROTECTION DEPARTMENT
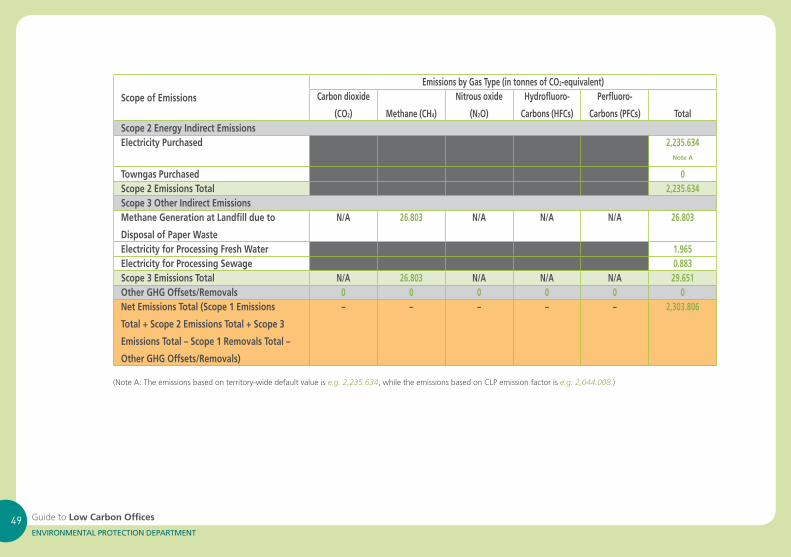
Scope of Emissions
Emissions by Gas Type (in tonnes of CO2-equivalent)Carbon dioxide
(CO2) Methane (CH4)
Nitrous oxide
(N2O)
Hydrofluoro-
Carbons (HFCs)
Perfluoro-
Carbons (PFCs) TotalScope 2 Energy Indirect EmissionsElectricity Purchased 2,235.634
Note A
Towngas Purchased 0Scope 2 Emissions Total 2,235.634Scope 3 Other Indirect EmissionsMethane Generation at Landfill due to
Disposal of Paper Waste
N/A 26.803 N/A N/A N/A 26.803
Electricity for Processing Fresh Water 1.965Electricity for Processing Sewage 0.883Scope 3 Emissions Total N/A 26.803 N/A N/A N/A 29.651Other GHG Offsets/Removals 0 0 0 0 0 0Net Emissions Total (Scope 1 Emissions
Total + Scope 2 Emissions Total + Scope 3
Emissions Total – Scope 1 Removals Total –
Other GHG Offsets/Removals)
– – – – – 2,303.806
(Note A: The emissions based on territory-wide default value is e.g. 2,235.634,whiletheemissionsbasedonCLPemissionfactorise.g. 2,044.008.)
Guide to Low Carbon Offices50ENVIRONMENTAL PROTECTION DEPARTMENT
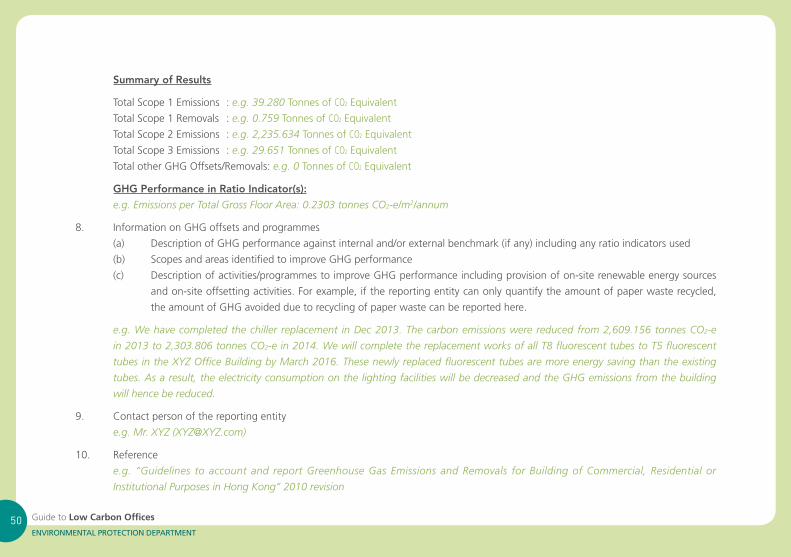
Summary of Results
Total Scope 1 Emissions : e.g. 39.280 Tonnes of CO2 Equivalent
TotalScope1Removals :e.g. 0.759 Tonnes of CO2 Equivalent
Total Scope 2 Emissions : e.g. 2,235.634 Tonnes of CO2 Equivalent
Total Scope 3 Emissions : e.g. 29.651 Tonnes of CO2 Equivalent
TotalotherGHGOffsets/Removals:e.g. 0 Tonnes of CO2 Equivalent
GHG Performance in Ratio Indicator(s):
e.g. Emissions per Total Gross Floor Area: 0.2303 tonnes CO2-e/m2/annum
8. Information on GHG offsets and programmes
(a) DescriptionofGHGperformanceagainstinternaland/orexternalbenchmark(ifany)includinganyratioindicatorsused
(b) Scopes and areas identified to improve GHG performance
(c) Descriptionofactivities/programmestoimproveGHGperformanceincludingprovisionofon-siterenewableenergysources
and on-site offsetting activities. For example, if the reporting entity can only quantify the amount of paper waste recycled,
the amount of GHG avoided due to recycling of paper waste can be reported here.
e.g. We have completed the chiller replacement in Dec 2013. The carbon emissions were reduced from 2,609.156 tonnes CO2-e
in 2013 to 2,303.806 tonnes CO2-e in 2014. We will complete the replacement works of all T8 fluorescent tubes to T5 fluorescent
tubes in the XYZ Office Building by March 2016. These newly replaced fluorescent tubes are more energy saving than the existing
tubes. As a result, the electricity consumption on the lighting facilities will be decreased and the GHG emissions from the building
will hence be reduced.
9. Contact person of the reporting entity
e.g. Mr. XYZ ([email protected])
10. Reference
e.g. “Guidelines to account and report Greenhouse Gas Emissions and Removals for Building of Commercial, Residential or
Institutional Purposes in Hong Kong” 2010 revision
https://www.climateready.gov.hk/?lang=1
DISCLAIMER The materials in this guide are provided for informational purpose only. While the Government endeavours to provide accurate, up-to-date and timely information, there is no guarantee that such information will continue to be accurate in the future. The Government cannot accept responsibility for any damage or claim resulting from use of the information in the guide;Any opinions, �ndings, conclusions or recommendations expressed or quoted in the guide do not necessarily re�ect the views of the Government, nor are the opinions expressed within endorsed by the Government; andThe Government holds the copyright to the information in this guide, unless otherwise stated.
Recommended