Growth, Poverty and Inequality in Ethiopia, 2000-2013: A Macroeconomic
Appraisal
Alemayehu Geda
Addis Yimer
Department of Economics
Addis Ababa University
May, 2014
(A Chapter in Book to be Published by Forum for Social Studies, FSS)
Introduction
Official government reports on growth, poverty and inequality show that Ethiopia has registered
a two-digit rate of growth in the last decade and has made immense progress in poverty
reduction. In terms of poverty, the official reports indicate that the head count ratio of poverty
(the percent of population below the poverty line) has declined from 45 percent in 1994/95 to 30
percent in 2010/11. If we base our analysis on this data, this is an impressive record. However, a
cursory look at people‘s livelihoods across the country (including Addis Ababa) reveals that
things are not as rosy as it is made out in the official reports and that many are unable to sustain
themselves, especially following the rampant inflation that began in 2005. This observation is in
line with the findings of the multidimensional poverty measure discussed later in this chapter.
Notwithstanding this, however, there is no scientific or independent basis to substantiate or
challenge the official claim. Thus, the task of an independent observer is daunting. The best
he/she can do is to critically examine the evidence in the light of empirical observations and
alternative measures of poverty, and come up with the most likely state of growth, poverty and
inequality in the country. In this chapter we will attempt to do that.
The political economy of growth, poverty and inequality is a sensitive and difficult subject in
today‘s Ethiopia, partly because of the lack of accurate information and the uncertainty
surrounding initiating dialogue on the subject. Notwithstanding this, in this work, we will
attempt to do the following. First, in the face of conflicting information and data unreliability
regarding the country‘s growth and development, it is imperative to make an educated guess of
what is the most likely state of growth in the last decade. This is done in the next section. In the
remaining sections we shall examine the nature of poverty, the implications of the reported
growth on poverty and inequality, and finally, by way of conclusion, how growth, poverty and
inequality are generally evolving and are related to the politics of the country.
The nature of rapid economic growth in the last decade and half

We begin the appraisal by briefly highlighting positive developments that the government has
brought about in the last decade and half (see Alemayehu 2013 for details). In this period, using
the official data, Ethiopia saw one of the best economic performances since the early 1990s (see
Table 1). The growth of the economy was quite impressive with an average growth rate of about
9 percent per annum since 2000. If the abnormal first three years are left out and the growth rate
is computed from the year 2003, the average annual growth rate will be about 11 percent for
consecutive 9 years. Except for the last five years where inflation, owing to lack of prudent
monetary and fiscal policy, was a major problem (see Alemayehu and Kibrom 2008), the
macroeconomic performance was very good too (Table 1). Given the dependence of growth on
rain-fed agriculture as well as low level of domestic resource mobilization (including shortage of
foreign exchange), the sustainability of this growth is questionable, however. In general, growth
is central for poverty reduction, and macroeconomic stability is a necessary condition for growth.
Since 2005, however, although growth remained strong, macroeconomic management had its fair
share of problems resulting in higher inflation, and problems with the balance of payments.
Table 1. Some indicators of the macroeconomic environment
Sector/Indicator 2000/
01
2001/
02
2002/0
3
2003/
04
2004/
05
2005/
06
2006/
07
2007/
08
2008/
09
2009
/10
2010/
11
Real GDP Growth Rate (%)* 7.4 1.6 -2.1 11.7 12.6 11.5 11.8 11.2 9.9 10.4 11.5
Inflation (CPI, % Change)** (0.3) (10.6) 10.9 7.3 6.1 10.6 15.8 25.3 36.4 2.8 18.1
Resere (Month of Imports) 2.5 2.0 2.2 1.1 2.4 2.5 2.4 2.8
Gross Domestic Saving
(%GDP) 10.0 6.0 4.0 11.9 5.9 4.6 8.7 5.2 6.4 5.2 8.8
Gross Domestic Investment
( % of GDP) 21.5 24.1 22.2 26.5 23.8 25.2 22.1 22.4 22.7 24.7 25.5
Overall Budget Deficit
excluding grants (%GDP) (8.2) (10.9) (12.8) (7.6) (8.7) (7.5) (8) (6.9) (3.6) (4.6) (4.8)
Overall Budget Deficit
including grants ( % GDP) (4.4) (7.2) 6.6 (3) (4.4) (4.6) (3.6) (2.9) (2.3) (1.3) (1.6)
Balance of Paymts (%GDP) 0.4 3.6 3.5 1.4 -0.8 -1.1 0.6 -1.0 1.7 0.9 4.5
Source: MOFED (2012) and NBE (2012). *See Table 2 for a more accurate picture. ** For the years 2007/08 and
2008/09 CSA data for inflation is 18.4 and 40.6 % respectively.
On the positive side and on the social front, there is an encouraging sign of declining absolute
poverty as well as impressive record on education, health provision (notwithstanding the
quality), power development as well as road construction. Generally, infrastructure development
in the last decade has been quite encouraging. The government has invested both in physical and
human (albeit of low quality) capital formation. The share of total spending on poverty-targeted
sectors (both recurrent and capital) increased from about 42 percent of total expenditure in
2002/03 to over 66 percent in 2009/10. This steady increase in spending on poverty-oriented
sectors as well as the on-going Federal food security program was also important in ensuring
food security for an extremely vulnerable section of the society (see Alemayehu 2013 for details
on these positive developments). In sum, there are a number of positive developments that will
help the current growth to persist well into the future. Notwithstanding these developments, the
change in overall welfare or growth so far has not been sufficient enough to lead to a significant
decline in poverty. This is partly related to a rise in income inequality during this period. It is
also related to lack of structural transformation in the economy. Moreover, the growth figures
may not be as high as officially reported. This underscores the need to look at the link between
economic growth, inequality, and poverty reduction in the country.
The growth record given above is the highest not only in the long history of Ethiopia but also is
the highest even by world standards. In contrast to this double digit growth for nearly a decade,
the country is still one of the poorest in the world. Apart from casual observation of the pervasive
poverty in the country, international data sources such as the recent (2013) human development
index of the UNDP and the multidimensional measures of poverty noted below corroborate this
observation (see below). In addition, International Financial Institutions (IFIs) such as the World
Bank and IMF have reported a significant discrepancy with the growth figures of the government
(Tables 1and 2). This obviously leads to doubts regarding both the official growth figures as well
as the related official measure of income poverty.
Checking the consistency and scientific accuracy of the National Accounts (NA) of a country is
quite demanding. In addition, access to detailed data and how it is generated is usually difficult
for an independent researcher. The lesson from previous studies about Ethiopian data (see
Alemayehu 1996, 1998) is to be extremely cautious about growth figures since the estimates are
made on old benchmark surveys and do not obey the national accounting consistency rule. The
recent IMF report (2012), we believe, corroborates this observation. In the face of such
problems, we can resort to a simple test to gauge the accuracy of the reported figures of the last
decade. If the NA is consistent then one would expect data from different institutions (such as
NBE and MOFED) to be consistent and add-up. For instance, one can check whether the ―net
factor payment and current transfer‖, as computed by the National Bank of Ethiopia (NBE) in its
balance of payments report, is equal to the same figure that is obtained as the difference between
national and domestic savings from the national accounts of the Ministry of Finance and
Economic Development (MOFED). This figure, as percentage of GDP for the last decade is
given in Table 2. As can be seen from the Table, there is a significant difference between the
two, except for 2005/06 to 2007/08. This shows the existence of a consistency problem, even
without investigating in detail the accuracy and hence the politics of the actual generation of the
figures.
Moreover, Table 2 also shows a big gap between the IMF growth forecast and the official
government growth figures. Although the IFIs, such as the IMF, base their growth figures on
data provided by the government, one observes a significant discrepancy between the two
regarding growth forecasts. This might be related to the fact that the IMF forecast is most likely
prepared by its own experts using models such as MULTIMoD1 while it is formally expected to
use the actual figures offered by the government. The politics of growth and related statistics in
Africa should not be a surprise. Jerven, in his recent book on the subject (2013), for instance,
notes that this game of numbers is becoming dangerously misleading and critical decisions are
made on them. He states that any ranking of African countries using GDP figures is misleading.
He maintains that such GDP/national income data is the result of pragmatic decisions at
1 My effort to find how the IMF does these forecasts was a failure. What I have noted here is my educated guess based on my earlier work
on such global macroeconometric models. IMF generally use an array of country, regional as well as international experts as well as global
macroeconometric models such its own Multicounty Econometric Model called MULTIMOD
statistical offices that are subject to paucity of data, shortage of financial resources and to
political pressure. Ethiopia is no different in this respect.
Another angle to examine the accuracy of the growth data is to make an educated guess of what
the potential growth rate of the country is. This can be done either using growth accounting, as
has been done in Alemayehu (2008) and IMF (2012), discussed below, or by estimating the
potential using the experience of fast-growing countries both in Africa and East Asia. After an
exhaustive examination of the economic history and experience of these countries, Alemayehu et
al (2004) have estimated that the potential maximum growth rate in Ethiopia is between 5 to 8
percent per annum – Ethiopia‘s official figure is about 50 percent higher.
We can also further check the arithmetic consistency of the growth figures using what is called
the ―doubling rule‖ or the ―rule of 72/70‖. In finance, the rule of 72 is a method for estimating an
investment‘s doubling time. The number (e.g. 72) is divided by the interest rate per period to
obtain the approximate number of periods (usually years) required for doubling. There are a
number of variations to the rules that improve accuracy2. To apply this simple method, we took
the government‘s GDP growth figure of 11 percent per annum for the years 2002/03 - 2010/11.
In the same period, agriculture, industry and the service sectors also grew by 10.2, 10.8 and 12.9
percent, respectively. This implies that it takes only 6.3 years for the doubling of the GDP. The
doubling of agricultural output should take about 7.2 years, while the industrial and service
sectors should double in 6.6 and 5.6 years, respectively. An examination of the data after these
years however shows that the GDP figure is less than double, and, on average, is 80 percent of
the estimated amount using the formula. This exercise shows that, first there is some kind of
inconsistency in the data, and second that the actual growth rate must be lower than the reported
one. With this in mind, we can compute the growth rate backward to arrive at the rate consistent
with the doubling rule. This gives a growth rate of about 8.8 percent as the maximum.
2 . For periodic compounding, the exact doubling time for an interest rate of r per period is
,
Where T is the number of periods/years required. The formula above can be used for calculating the doubling time. If we want to know the tripling
time, for example, we need to replace the constant 2 in the numerator with 3. As another example, if you want to know the number of periods it
takes for the initial value to rise by 50%, replace the constant 2 with 1.5 etc
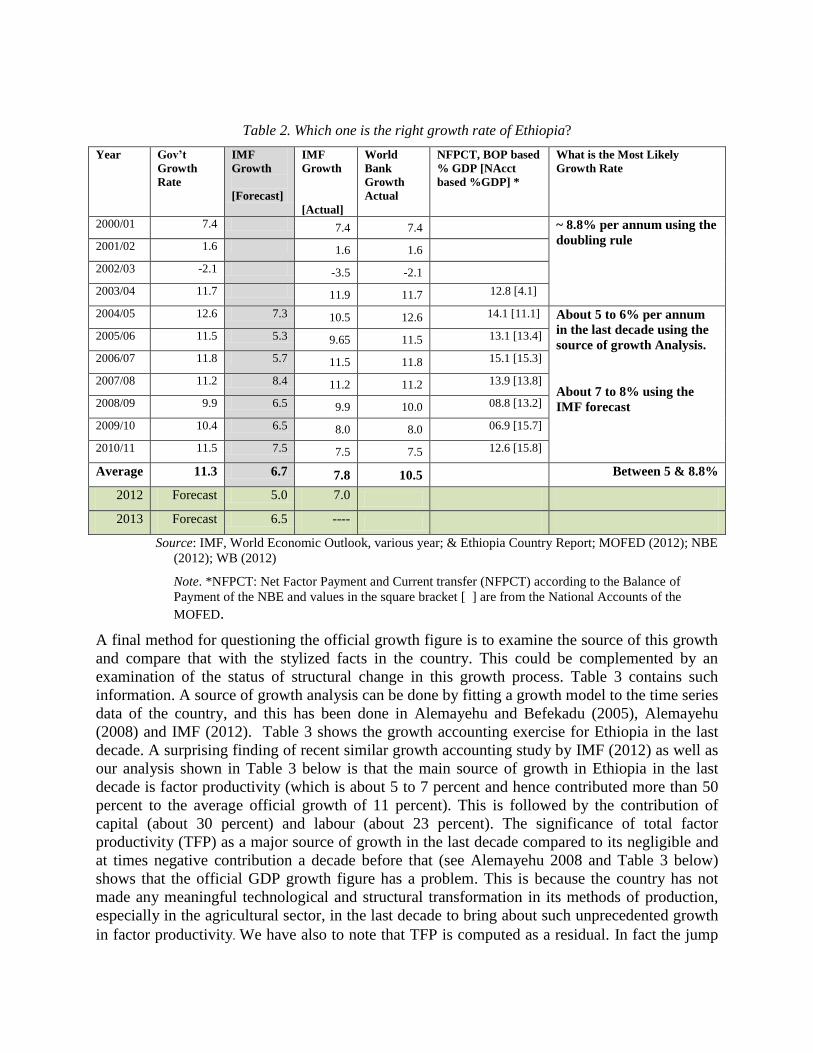
Table 2. Which one is the right growth rate of Ethiopia?
Year Gov’t
Growth
Rate
IMF
Growth
[Forecast]
IMF
Growth
[Actual]
World
Bank
Growth
Actual
NFPCT, BOP based
% GDP [NAcct
based %GDP] *
What is the Most Likely
Growth Rate
2000/01 7.4 7.4 7.4 ~ 8.8% per annum using the
doubling rule 2001/02 1.6 1.6 1.6
2002/03 -2.1 -3.5 -2.1
2003/04 11.7 11.9 11.7 12.8 [4.1]
2004/05 12.6 7.3 10.5 12.6 14.1 [11.1] About 5 to 6% per annum
in the last decade using the
source of growth Analysis.
About 7 to 8% using the
IMF forecast
2005/06 11.5 5.3 9.65 11.5 13.1 [13.4]
2006/07 11.8 5.7 11.5 11.8 15.1 [15.3]
2007/08 11.2 8.4 11.2 11.2 13.9 [13.8]
2008/09 9.9 6.5 9.9 10.0 08.8 [13.2]
2009/10 10.4 6.5 8.0 8.0 06.9 [15.7]
2010/11 11.5 7.5 7.5 7.5 12.6 [15.8]
Average 11.3 6.7 7.8 10.5 Between 5 & 8.8%
2012 Forecast 5.0 7.0
2013 Forecast 6.5 ----
Source: IMF, World Economic Outlook, various year; & Ethiopia Country Report; MOFED (2012); NBE
(2012); WB (2012)
Note. *NFPCT: Net Factor Payment and Current transfer (NFPCT) according to the Balance of
Payment of the NBE and values in the square bracket [ ] are from the National Accounts of the
MOFED.
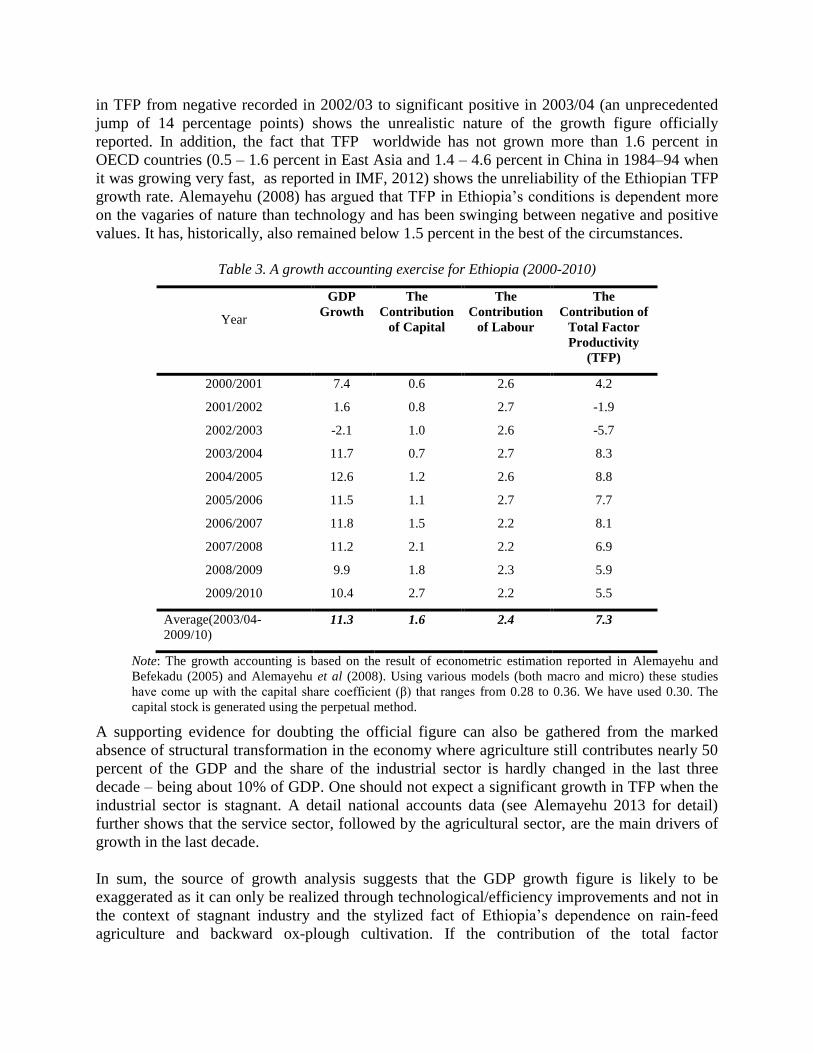
A final method for questioning the official growth figure is to examine the source of this growth
and compare that with the stylized facts in the country. This could be complemented by an
examination of the status of structural change in this growth process. Table 3 contains such
information. A source of growth analysis can be done by fitting a growth model to the time series
data of the country, and this has been done in Alemayehu and Befekadu (2005), Alemayehu
(2008) and IMF (2012). Table 3 shows the growth accounting exercise for Ethiopia in the last
decade. A surprising finding of recent similar growth accounting study by IMF (2012) as well as
our analysis shown in Table 3 below is that the main source of growth in Ethiopia in the last
decade is factor productivity (which is about 5 to 7 percent and hence contributed more than 50
percent to the average official growth of 11 percent). This is followed by the contribution of
capital (about 30 percent) and labour (about 23 percent). The significance of total factor
productivity (TFP) as a major source of growth in the last decade compared to its negligible and
at times negative contribution a decade before that (see Alemayehu 2008 and Table 3 below)
shows that the official GDP growth figure has a problem. This is because the country has not
made any meaningful technological and structural transformation in its methods of production,
especially in the agricultural sector, in the last decade to bring about such unprecedented growth
in factor productivity. We have also to note that TFP is computed as a residual. In fact the jump
in TFP from negative recorded in 2002/03 to significant positive in 2003/04 (an unprecedented
jump of 14 percentage points) shows the unrealistic nature of the growth figure officially
reported. In addition, the fact that TFP worldwide has not grown more than 1.6 percent in
OECD countries (0.5 – 1.6 percent in East Asia and 1.4 – 4.6 percent in China in 1984–94 when
it was growing very fast, as reported in IMF, 2012) shows the unreliability of the Ethiopian TFP
growth rate. Alemayehu (2008) has argued that TFP in Ethiopia‘s conditions is dependent more
on the vagaries of nature than technology and has been swinging between negative and positive
values. It has, historically, also remained below 1.5 percent in the best of the circumstances.
Table 3. A growth accounting exercise for Ethiopia (2000-2010)
Year
GDP
Growth
The
Contribution
of Capital
The
Contribution
of Labour
The
Contribution of
Total Factor
Productivity
(TFP)
2000/2001 7.4 0.6 2.6 4.2
2001/2002 1.6 0.8 2.7 -1.9
2002/2003 -2.1 1.0 2.6 -5.7
2003/2004 11.7 0.7 2.7 8.3
2004/2005 12.6 1.2 2.6 8.8
2005/2006 11.5 1.1 2.7 7.7
2006/2007 11.8 1.5 2.2 8.1
2007/2008 11.2 2.1 2.2 6.9
2008/2009 9.9 1.8 2.3 5.9
2009/2010 10.4 2.7 2.2 5.5
Average(2003/04-
2009/10) 11.3 1.6 2.4 7.3
Note: The growth accounting is based on the result of econometric estimation reported in Alemayehu and
Befekadu (2005) and Alemayehu et al (2008). Using various models (both macro and micro) these studies
have come up with the capital share coefficient (β) that ranges from 0.28 to 0.36. We have used 0.30. The
capital stock is generated using the perpetual method.
A supporting evidence for doubting the official figure can also be gathered from the marked
absence of structural transformation in the economy where agriculture still contributes nearly 50
percent of the GDP and the share of the industrial sector is hardly changed in the last three
decade – being about 10% of GDP. One should not expect a significant growth in TFP when the
industrial sector is stagnant. A detail national accounts data (see Alemayehu 2013 for detail)
further shows that the service sector, followed by the agricultural sector, are the main drivers of
growth in the last decade.
In sum, the source of growth analysis suggests that the GDP growth figure is likely to be
exaggerated as it can only be realized through technological/efficiency improvements and not in
the context of stagnant industry and the stylized fact of Ethiopia‘s dependence on rain-feed
agriculture and backward ox-plough cultivation. If the contribution of the total factor

productivity is limited to its historic value of about 1 to 1.5 percent, or less, as argued in
Alemayehu (2008), the actual GDP growth will be about 5 to 6 percent per annum. In fact,
Dercon et al (2009) have documented, focusing on agriculture, the lack of a robust source of
growth in Ethiopia and hence the possibility that the exaggerated growth figure might be a
statistical artifact. In their excellent study, they note that according to government data, cereal
output has doubled in the last ten years (writing in 2009), land cultivated with cereals has
increased by 44 percent and yield by 40 percent. They further note that in the year 2004 to 2009,
government data show 12 percent increase in cereal production per year, yield growth of 6
percent per year and area growth of 55 percent per year. However, the authors‘ point out, the
same data source shows no evidence of intensification of agriculture such as increase in fertilizer
use, irrigation or significant extension program expansion. From this they sarcastically conclude,
―Ethiopian yields have grown faster than recorded elsewhere, even compared to the green
revolution in India, China or Vietnam. If the data are correct, this is the fastest green revolution
in history, and its mechanism should be analyzed…lessons learned, as they would be immensely
important for other part of the country and beyond‖. They also caution that if the data are not
correct it would suggest that food production is considerably lower than reported which has
significant implications for policy, specially about the poor (Dercon et al, 2009).
In sum, in view of the critical analysis presented above regarding the inconsistency of the
national account data and the big gap between official growth forecasts and those by IMF and
others, we argue that the likely growth rate may range between 5 to 8 percent. It has to be noted,
however, that even a growth rate of about 5 percent is one of the best in the continent and there is
no need to resort to an exaggerated growth performance. Be that as it may, in future, we believe
there is a need for data generating institutions such as the Central Statistical Agency (CSA),
MOFED and NBE to be independent and transparent. There is also a need for a proper peer
review process of research methods and outcomes from these institutions. In addition, the
depoliticization of statistics, as well as the development of detailed macro models of forecasting
by different research and academic institutions is necessary. Finally, whatever the level, growth
has been accompanied by rising inequality, especially in urban areas with detrimental impact on
poverty reduction. These issues are discussed in the rest of the chapter.
The nature of poverty in the period 1995-2013
The nature and extent of (income) poverty
Table 4 shows the trend in poverty in Ethiopia in the last decade. It is based on detailed
household level data collected both by the government and the Department of Economics of
Addis Ababa University in collaboration with various partners (University of Oxford,
Gothenburg University and IFPRI). The government‘s official income poverty level in 2010/11
is computed based on a poverty line of Birr 3,781 per year per adult equivalent. This is a daily
equivalent of Birr 10.50 per adult equivalent (about 0.50 United States dollar, USD) (The food
poverty line is Birr 5.4 (0.27 USD)). Given the galloping inflation in the country since 2005, this
is an extremely small amount of money to live on, even by Ethiopian standards. Notwithstanding
this, using the official income based measure (head count ratio, called P0 index), the latest
information shows that in 2010/11, 30 percent of Ethiopians (about 27 million people) were poor
- a significant fall from 2004/5 when the figure was 38.7 percent. Poverty is slightly higher in
rural (30 percent) than urban areas (26.1 percent). Over the same period, the poverty gap index
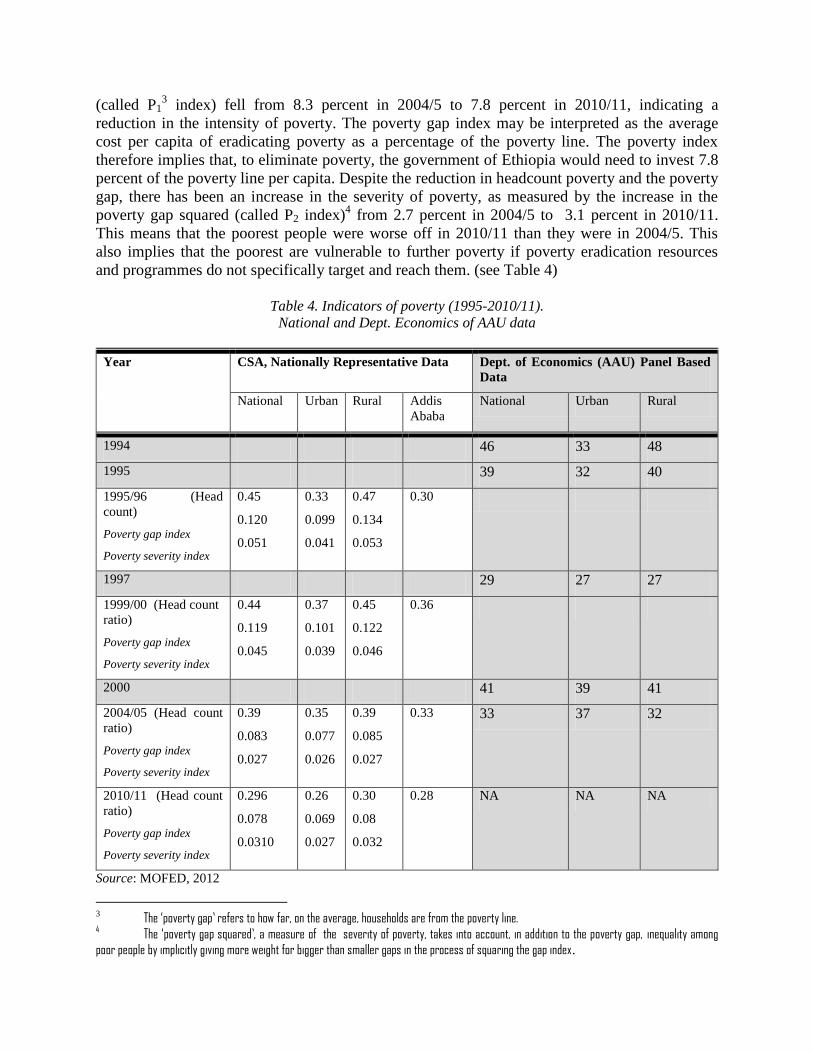
(called P13 index) fell from 8.3 percent in 2004/5 to 7.8 percent in 2010/11, indicating a
reduction in the intensity of poverty. The poverty gap index may be interpreted as the average
cost per capita of eradicating poverty as a percentage of the poverty line. The poverty index
therefore implies that, to eliminate poverty, the government of Ethiopia would need to invest 7.8
percent of the poverty line per capita. Despite the reduction in headcount poverty and the poverty
gap, there has been an increase in the severity of poverty, as measured by the increase in the
poverty gap squared (called P2 index)4 from 2.7 percent in 2004/5 to 3.1 percent in 2010/11.
This means that the poorest people were worse off in 2010/11 than they were in 2004/5. This
also implies that the poorest are vulnerable to further poverty if poverty eradication resources
and programmes do not specifically target and reach them. (see Table 4)
Table 4. Indicators of poverty (1995-2010/11).
National and Dept. Economics of AAU data
Year CSA, Nationally Representative Data Dept. of Economics (AAU) Panel Based
Data
National Urban Rural Addis
Ababa
National Urban Rural
1994 46 33 48
1995 39 32 40
1995/96 (Head
count)
Poverty gap index
Poverty severity index
0.45
0.120
0.051
0.33
0.099
0.041
0.47
0.134
0.053
0.30
1997 29 27 27
1999/00 (Head count
ratio)
Poverty gap index
Poverty severity index
0.44
0.119
0.045
0.37
0.101
0.039
0.45
0.122
0.046
0.36
2000 41 39 41
2004/05 (Head count
ratio)
Poverty gap index
Poverty severity index
0.39
0.083
0.027
0.35
0.077
0.026
0.39
0.085
0.027
0.33 33 37 32
2010/11 (Head count
ratio)
Poverty gap index
Poverty severity index
0.296
0.078
0.0310
0.26
0.069
0.027
0.30
0.08
0.032
0.28 NA NA NA
Source: MOFED, 2012
3 The „poverty gap‟ refers to how far, on the average, households are from the poverty line.
4 The „poverty gap squared‟, a measure of the severity of poverty, takes into account, in addition to the poverty gap, inequality among
poor people by implicitly giving more weight for bigger than smaller gaps in the process of squaring the gap index.

Notwithstanding the official rosy picture about poverty reduction noted thus far, the
pervasiveness and enormity of the poverty level in the country is obvious. The calculations of the
national poverty line are based, as has been noted above, on Birr 10.75 per adult per day which is
half the commonly used rate of one US dollar (USD) a day. Thus, assuming, optimistically, that
the registered income growth is fairly equally distributed (see below, however), and that a rate of
one USD (or 20 Birr) a day is used instead, those below the poverty line will be about 60 percent
of the population5. Doubling the government‘s nominal poverty line of USD 0.50 (or Birr 10.75)
shows that it is equivalent to about 2.50 USD at purchasing power parity (PPP). Using this rate,
the World Bank has computed the level of poverty to be 71.4 percent (see Figure 1 below). This
simple exercise suggests the need to question the official poverty (and inequality) indicators as
we have done of the growth figures of the last decade in the section above, with the aim of
coming up with the most probable state of poverty in the country. Table 5 shows the result of
such an attempt. The Table basically compares the official (income) poverty figures with that of
the international poverty line. It also shows the likely level of (income) poverty in the country
which takes on board the most probable growth rate of the country as discussed above as well as
the effect of inequality on poverty reduction. This is given in column 5 of the Table (explained in
detail below). Note in passing that this figure would have been much higher if it were not based
on the official level of the poverty line at the initial years of the projection.
Table 5. What are the actual and most probable levels of poverty and inequality?
Year Gov’t
Figures
(Nominal
$0.50/day)
Using Nominal
$1.25/day
(Comparable to the
Gov’t Figure given to
the left/column 2)
Using USD 1.25
a day
(In PPP terms)
**Using The Likely
Growth Rate Figure
(Base on Official
Poverty data but
scaled down GDP
growth & rising
inequality)
1995/96
45.5 60.52 [1995]
1999/00 44.2 55.58 [2000]
2004/05 38.7 >77.4 [2004/05]* 38.96 [2005] 39.1 [47]
2010/11 29.6 71.4 [2011] 30.65 [2011] 34.5 [42]
*Note: the poverty line had been Birr 1075 per adult per annum (& Exchange rate of $1=9). We assumed it is
at best half a dollar per day.** Is based on projection (see Figure 3) and the value in bracket [ ] is if the
average gap b/n the panel and official data is taken on board.
Source: MOFED, 2012 and World Bank 2012 and Authors‘ estimation
Following the availability of the household and panel data since 1995, a number of analytical
poverty studies have been conducted in the country. These were preceded by the pioneer
quantitative study of Mekonnen who was instrumental in producing systemic poverty data at the
department of Economics of Addis Ababa University (AAU data henceforth)6. Mekonnen (1996)
5 This seems to contradict the World Bank‟s (2012) similar computation. However, the World Bank computation is based on PPP. With that it
found the headcount poverty to be the same 30% at PPP US$1.25. This apparently conflicting indicators emerged because the government‟s poverty
line of US$0.50 is equal to the World Bank‟s level of PPP $1.25 which is computed at PPP price (See Figure 1 and Table 5 ) 6 To my knowledge the only exception as the first quantitative, household based, poverty analysis in Ethiopia is that of Alemayehu (1993).
examined urban poverty in Ethiopia using the 1994 AAU Urban Households Survey (AAU-
EUHS). His analysis focused on food poverty, recognizing that in Ethiopia, access to basic food
is a major factor of household welfare. The study confirmed that Ethiopia indeed suffers from
extreme food poverty. In addition, using the 1994, 1995 and 1997 rounds of AAU data,
Mekonnen (1999) analyzed the dynamics and determinants of urban poverty in the country.
Using poverty lines estimated by the Cost of Basics Needs (CBN) approach and consumption per
adult equivalent7 as a measure of welfare, he indicated an increase in poverty between 1994 and
1995 and then a decline from 1995 to 1997. Following this, Bevan and Joireman (1997) adopted
a sociological approach to the measurement of poverty, focusing on the meaning and use of
different measurements. They argued that in rural Ethiopia non-economic forms of capital, such
as social and human capital, are very important in determining life chances. They further argued
that entitlement norms which include such things as right of access to productive resources,
political voice, right to leisure, inheritance rules and access to community support are crucial in
determining household poverty (Bevan and Joireman 1997). Such an approach to poverty
analysis has been employed earlier by Dessalegn (1992) and Solomon (1995).
Dercon and Krishnan (1998) assessed changes in poverty between 1989 and 1995 and tested the
robustness of measured changes to the problems of choice of poverty lines and the impact of
uncertainty in measured inflation rates. They found that, poverty declined between 1989 and
1994 but remained virtually unchanged between 1994 and 1995. Moreover, households with
substantial human and physical capital and better access to roads and towns have both lower
poverty levels and are more likely to get better off over time. In addition, they also observed that
human capital building and access to roads and towns reduce the fluctuations in poverty across
seasons. The next study that sought to examine what happened to poverty was that of Dercon and
Mekonnen (1999) which made a comparison between rural and urban poverty using the 1994
rounds of the AAU Rural and Urban Households Survey (AAU-ERHS) and AAU-EUHS data.
Dercon and Mekonnen derived different poverty lines to overcome potential problems that could
arise due to differences in household needs, prices and tastes across rural and urban areas. Thus,
poverty lines were defined using four different food baskets; one national, one each for cereal
and enset growing regions, and one for urban areas. The authors‘ findings show that urban
poverty is much higher than rural poverty when region-specific food baskets, as opposed to a
single national basket, are used. This finding is consistent with the hypothesis that expensive
sources of calories are consumed in urban areas. Enset growing rural regions were found to be
much poorer when a single basket was used, confirming the role of Enset as a low-cost calorie
source. Nevertheless, the difference in poverty between urban and rural areas was found to be
small on average (Dercon and Mekonnen 1999).
Abbi (2000) focused on 900 households in Addis-Ababa, using the 1994 AAU-EUHS, and
adopted the poverty lines developed by Mekonnen (1997) to analyze the determinants of poverty
in Addis-Ababa. He found that labour market participation and education were the most
significant determinants of poverty in the capital city. Similar findings about the role of the
labour market and education are also reported in Alemayehu and Alem (2006) that used the same
AAU urban data and a micro simulation approach.
7 A consumption basket that would meet a minimum energy requirement of 2200 kcal of energy per adult per day was constructed and its
cost calculated at region specific prices to obtain the food poverty line.
The study of poverty in Ethiopia in the 1990s has continued into the turn of the century virtually
with similar findings. This time, however, the focus of the studies was to link poverty with
growth and inequality. The studies also began to search for determinants of poverty. Dercon
(2001 & 2006), using the then emerging AAU micro level panel data from villages in rural
Ethiopia, analysed the determinants of growth and changes in poverty during the initial phase of
the EPRDF economic reform (1989-1995) using a standard decomposition of income and
poverty changes. He found that, overall, consumption grew and poverty fell substantially during
the period considered and that on average poor households benefited more from the reforms than
non-poor households, though the reforms did not benefit similarly all the poor. In addition, he
identified relative price changes affecting returns on labour, land, human capital and location, as
the main driving factors in income levels (Dercon, 2001 and 2006). Alemayehu and Alem (2006)
did a similar study by examining the impact of the 1992 reform on poverty and inequality in
urban Ethiopia. They, however, used a data-exploration and micro-simulation approach. Their
finding contradicts the findings of Dercon (2001; 2006) in rural areas, however. Alemayehu and
Alem found that following the 1992 reform aggregate indicators of poverty and inequality
remained unchanged. This unchanged state, despite fundamental changes in macroeconomic
policy, is because aggregate changes hide enormous changes across income categories which in
turn are dependent on structure of returns to labour, distribution of income and occupational
choices that households make.
A report on the state of poverty at the beginning of the 21st century was prepared by the
government on the basis of the 1999/2000 Household Income and Consumption Expenditure
(HICE) and Welfare Monitoring Surveys (WMS). The conclusion reached is that the incidence
of poverty is higher in rural than in urban areas with a poverty head count ratio of 45.4 and 36.9
percent, respectively (MOFED, 2002). The same report also noted that compared to the 1995/96
level, poverty incidence increased by 11.4 percent in urban areas and declined by 4.42 percent in
rural areas, with the overall poverty incidence decreasing by 2.86 percent. In the same period,
Abbi and McKay (2003) analysed the dynamics of chronic poverty in Ethiopia using the panel
data of AAU for 1994-1997. They defined the chronically poor as households with real total
expenditure per adult per month below the poverty line in all three years and the transient poor as
those with real total expenditure per adult per month below the poverty line in one or two of the
years. They found that the proportion of the transient poor was higher than the chronically poor.
Using multinomial logit regression, Abbi and McKay (2003) argued that chronic poverty is
associated with household composition, unemployment, lack of asset ownership, casual
employment, lack of education, ethnicity, the age of the household-head, and households headed
by females. Focusing on the same subject and using the same AAU data, Bigsten and Abebe
(2005), analysed the state of poverty in urban and rural Ethiopia between 1994 and 2004. They
also studied the persistence of poverty during this period. Their result showed that poverty in its
absolute sense had declined between 1994 and 1997, increased significantly until 2000 and
declined in 2004. They also found that rural households had made more rapid progress than
urban ones in getting out of poverty between 1994 and 2004, with poverty having declined by
more than 10 percentage points. Their study further showed that only a relatively small number
in both the rural and urban areas managed to exit poverty completely during the decade under
study, suggesting that a considerable number of the population had been in poverty at least once
during the same decade -72 per cent in rural and 60 per cent in urban areas (Bigsten and Abebe
(2005).
In another study, Bigsten and Abebe (2008) analyzed poverty transition and persistence in
Ethiopia, using a panel data of ten years (1994-2004). They employed consumption expenditure
to measure poverty and the spells approach to analyze poverty dynamics. They found that there
is a higher probability (61 percent) of poverty transition, of both movements into and out of
poverty, in rural areas. They also found substantial persistence of poverty: it is harder to get out
of poverty once in it, and it is less probable to re-enter poverty once one has escaped from it too.
In addition, the same study shows that household size, primary education of the household head
and spouse, access to markets, as well as changes in rainfall levels and variability are prominent
factors in both facilitating the exit out of poverty and preventing re-entry into poverty across
rural areas. Another study about poverty dynamics is that of Swanepoel (2005) who used the
same AAU panel rural data from 1994-1997. Swanepoel found that movements of households
into poverty are associated with life cycle effects and incidence of crop failures, while
movements out of poverty are related to household size. The study shows that transiently poor
households have a higher dependency ratio, face more frequent crop failures, and have smaller
areas of land available for cultivation. The chronically poor households also own fewer assets
and earn less from the sale of livestock. A study by Bigsten et al (2003), also using the same
panel data found that cultivation of Khat, an export cash crop, decreases the probability of
households falling into poverty while increasing the chances of escaping poverty in rural areas.
What one can learn from these studies is that fighting poverty in Ethiopia is still contingent not
only on the development of the agricultural sector but more importantly in transiting out of rain-
fed agriculture, with an educated peasant that has an optimal household size.
Using a different set of panel data from that of the AAU, Ayalneh et al (2005) attempted to
investigate the determinants of rural poverty in Ethiopia, based on information gathered from
a three-round survey of 149 rural households in three districts of Ethiopia during the 1999/2000
cropping season. They found that nearly 40 per cent of the sample households live below the
poverty line with an average poverty gap of 0.047. In addition, using a binary logit model, the
authors found that rural poverty is strongly associated with entitlement failures which is defined
as lack of household resource endowments -crucial assets such as land, human capital and oxen.
Finally, the latest study using the AAU panel data is that of Dercon et al (2007) which examines
the process of growth, poverty and poverty persistence in a panel data set covering 15
communities across rural Ethiopia from 1994 to 2004. The authors indicate the existence of both
considerable growth and poverty reduction for the period in question. In addition, they highlight
the presence and persistence of ‗chronic‘ poverty. Using a statistical dynamic fixed effect growth
model, they found that road infrastructure and the (slow) spread of extension services has
contributed to this growth, even though a high sensitivity of consumption to rainfall shocks is
noted as well. They also show that changes in poverty are affected by the same factors. There is
no clear evidence that the chronically poor are differently affected by these factors in the sample.
However, they show that there is a ‗fixed‘ latent growth effect that is highly correlated with
chronic poverty, which suggests a serious growth handicap for the chronically poor. Dercon et al
further found that chronic poverty and this latent growth effect correlates highly with initial
physical assets (such as land or livestock), education and remoteness. Ayaleneh (2011) also
analysed the extent and determinants of rural household poverty in the eastern highlands of
Ethiopia, using other micro data. The study examines 216 households using a household
consumption expenditure survey data. The findings suggest that poverty is location specific,
depends on access to irrigated land (not land per se) and access to non-farm income. The result
also shows that household wellbeing is negatively affected by household size, and positively
affected by age of household head. Involvement in governance, social and production related
networks are also found to be strongly associated with the probability of a household being out
of poverty.
In contrast to the picture that may be drawn from the official sources, noted above, the poverty
studies reviewed briefly here suggest the pervasive and chronic nature of poverty in the country
although it is generally declining over time. The literature also shows significant differences
regarding the level of poverty between the official and independent data sources. This suggests
the need to examine other approaches to measuring poverty.
Multidimensional poverty in Ethiopia
Although the probable level of (income) poverty offered in Table 5 is what one could come up
with by examining the existing official information, it is not the best indicator of the state of
poverty in the country. A more comprehensive indicator is what is referred to as the
―Multidimensional Poverty Index‖ (MPI). Alkire and Foster (2007) proposed this index which
they argue reflects better human deprivations. The basic idea behind the MPI is that the well-
being of a household or an individual depends not just on income or consumption, but also on
several other dimensions or capabilities such as health, education, and standard of living. Alkire
and Foster (2009; 2010), Alkire and Santos (2010), then, developed a strategy to identify the
multidimensional poor. They introduced an intuitive approach to identifying the poor that
uses two forms of cutoffs. The first is the traditional dimension-specific line or cutoff, which identifies whether a person is deprived with respect to that dimension. The seconddelineates how widely deprived a person must be in order to be considered poor. Their benchmark procedure uses a counting methodology in which the second cutoff is a minimum number of dimensions of deprivation. This procedure readily generalizes to situations in which dimensions have differential weights. This ‘dual cutoff’ identification system gives clear priority to those suffering multiple deprivations and works well in situations with many dimensions.. Alkire and Santos (2010) argument behind the choice of
dimensions for multidimensional poverty measure is based on Sen‘s idea that the choice of
relevant functioning and capabilities for any poverty measure is a value judgment rather than a
technical exercise. According to them, the broad dimensions that a measure of poverty might
need to reflect include, but are not limited to, health, education, standard of living,
empowerment, work, environment, safety from violence, social relationships, and culture (Alkire
and Santos, 2010; see also Hulme and Shepherd, 2003). [Alemayehu: I don‘t quite understand
this passage; I read it many times] I HOPE IT IS CLEAR NOW. IF NOT YOU MAY AS WELL
DELETED.
Such multi-dimensional poverty measure is more likely to underpin long-term poverty (Hulme
and Shepherd, 2003). In the use of MPI, consumption expenditure, as a flow variable, is more
likely to capture mobility of households into and out of poverty while the general MPI poverty
indices capture long-term well-being (Hulme and Shepherd, 2003).
In concrete terms, the MPI reflects both the incidence or headcount ratio (H) of poverty – the
proportion of the population that is multidimensionally poor – and the average intensity (A) of
their poverty – the average proportion of indicators in which poor people are deprived. The MPI
is then computed by multiplying the incidence of poverty by the average intensity across the
poor (H×A). A person is identified as poor if he or she is deprived in at least one third of the
weighted indicators (see OPHI 2013).The MPI also identifies multiple deprivations in the same
household in education, health and living standards (Ethiopia Demographic and Health Survey,
EDHS 2011).
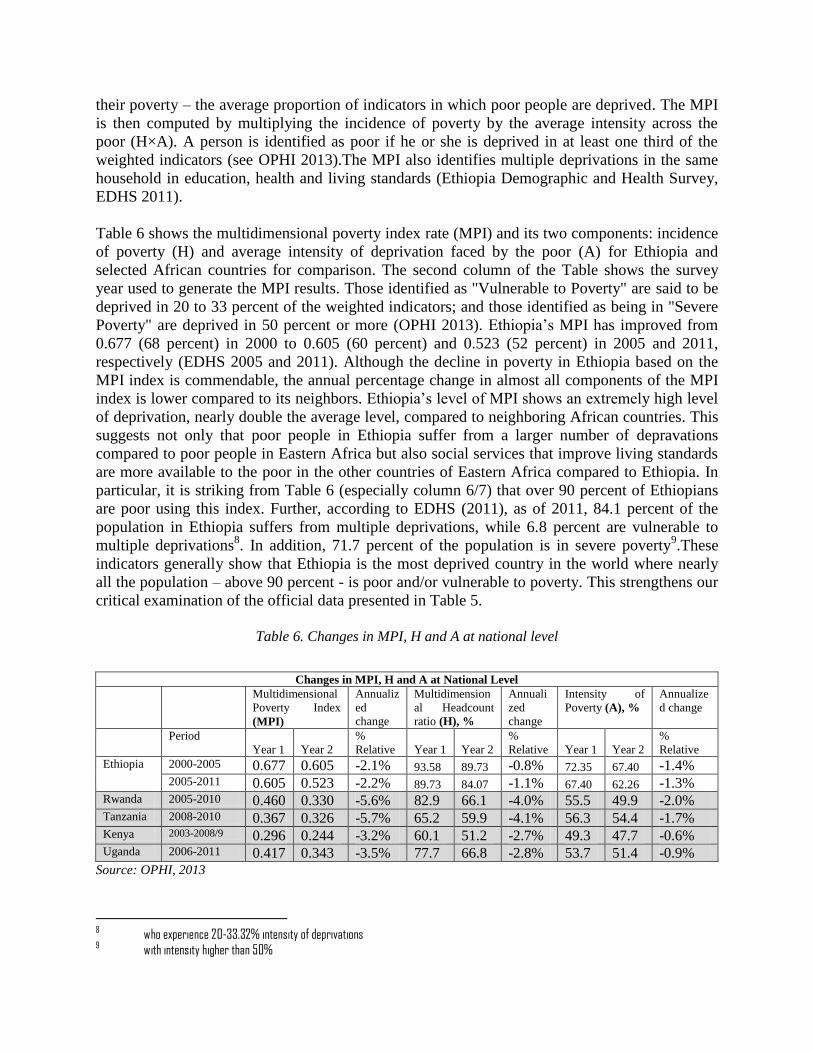
Table 6 shows the multidimensional poverty index rate (MPI) and its two components: incidence
of poverty (H) and average intensity of deprivation faced by the poor (A) for Ethiopia and
selected African countries for comparison. The second column of the Table shows the survey
year used to generate the MPI results. Those identified as "Vulnerable to Poverty" are said to be
deprived in 20 to 33 percent of the weighted indicators; and those identified as being in "Severe
Poverty" are deprived in 50 percent or more (OPHI 2013). Ethiopia‘s MPI has improved from
0.677 (68 percent) in 2000 to 0.605 (60 percent) and 0.523 (52 percent) in 2005 and 2011,
respectively (EDHS 2005 and 2011). Although the decline in poverty in Ethiopia based on the
MPI index is commendable, the annual percentage change in almost all components of the MPI
index is lower compared to its neighbors. Ethiopia‘s level of MPI shows an extremely high level
of deprivation, nearly double the average level, compared to neighboring African countries. This
suggests not only that poor people in Ethiopia suffer from a larger number of depravations
compared to poor people in Eastern Africa but also social services that improve living standards
are more available to the poor in the other countries of Eastern Africa compared to Ethiopia. In
particular, it is striking from Table 6 (especially column 6/7) that over 90 percent of Ethiopians
are poor using this index. Further, according to EDHS (2011), as of 2011, 84.1 percent of the
population in Ethiopia suffers from multiple deprivations, while 6.8 percent are vulnerable to
multiple deprivations8. In addition, 71.7 percent of the population is in severe poverty
9.These
indicators generally show that Ethiopia is the most deprived country in the world where nearly
all the population – above 90 percent - is poor and/or vulnerable to poverty. This strengthens our
critical examination of the official data presented in Table 5.
Table 6. Changes in MPI, H and A at national level
Changes in MPI, H and A at National Level
Multidimensional
Poverty Index
(MPI)
Annualiz
ed
change
Multidimension
al Headcount
ratio (H), %
Annuali
zed
change
Intensity of
Poverty (A), %
Annualize
d change
Period
Year 1 Year 2
%
Relative Year 1 Year 2
%
Relative Year 1 Year 2
%
Relative
Ethiopia 2000-2005 0.677 0.605 -2.1% 93.58 89.73 -0.8% 72.35 67.40 -1.4% 2005-2011 0.605 0.523 -2.2% 89.73 84.07 -1.1% 67.40 62.26 -1.3%
Rwanda 2005-2010 0.460 0.330 -5.6% 82.9 66.1 -4.0% 55.5 49.9 -2.0% Tanzania 2008-2010 0.367 0.326 -5.7% 65.2 59.9 -4.1% 56.3 54.4 -1.7% Kenya 2003-2008/9 0.296 0.244 -3.2% 60.1 51.2 -2.7% 49.3 47.7 -0.6% Uganda 2006-2011 0.417 0.343 -3.5% 77.7 66.8 -2.8% 53.7 51.4 -0.9%
Source: OPHI, 2013
8 who experience 20-33.32% intensity of deprivations 9 with intensity higher than 50%

Note: MPI – A number between 0 and 1 that reflects the level of acute poverty. A high number shows higher
poverty. The MPI is the product of H x A.H – the Headcount Ratio or percentage of people who are identified as
multidimensional poor; sometimes referred to as the ‗rate‘ of poverty. It ranges from 0 to 100 percent and a
higher figure shows worsening poverty. A – The intensity or average percentage of deprivations is what poor
people experience together, measured from 33 to 100 percent in the case of MPI. A higher figure shows
worsening of poverty. Absolute: The reduction is calculated by subtracting one measure from another. For
example, a 5 percentage point reduction of H could mean that H decreased from 75 to 70 percent or from 10 to 5
percent. Relative: This is the absolute reduction divided by the original poverty level, thus showing the
percentage change. Annualized: show the changes per year, the total change is divided by the number of years
between the surveys.
This extremely high level of the MPI measure of poverty in Ethiopia may be put in perspective
using a summary of other measures of poverty as shown in Figure 1 below. Figure 1 compares
the poverty rate, using the MPI, with three other commonly used poverty measures. As can be
seen from the figure, the proportion of people who are MPI poor in Ethiopia in the year 2011 is
about 85 percent, while the percentage of people below the national (income) poverty line,
according to the government, is about 30 percent. On the other hand, the percentages of people
who are poor according to USD 1.25 and 2.00 PPP a day income-poverty line are 30.65 percent
and 66 percent of the population, respectively, in the same year. As we have noted earlier, the
World Bank‘s income poverty line of 30.65 percent, using USD 1.25 per day offers the same
figure to that of the official government figure of 29.6 percent although this official figure is
based on a poverty line of USD 0.50. However, the World Bank‘s figure of USD 1.25 is in PPP
terms (which implies that a nominal 1.25 USD could be equivalent to over USD 3.1 in PPP
terms, to which a head count ratio of between 71.4 and 84.1 percent is associated, as shown in
Figure 1)
Figure 1. Comparison of poverty in Ethiopia using different measures
Source: Author‘s computation using OPHI, 2013: MOFED, 2012; PovCalNet (World Bank) 2013
0
10
20
30
40
50
60
70
80
90
MPI (H) UsingNationalPoverty
Line
Poverty at$1.25 PPP
(WB)
Poverty at$2.0 PPP
(WB)
Poverty at$2.5 PPP
(WB)
Poverty at$4.0 PPP
(WB)
84.7
29.6 30.65
66 71.4
84.1
In %
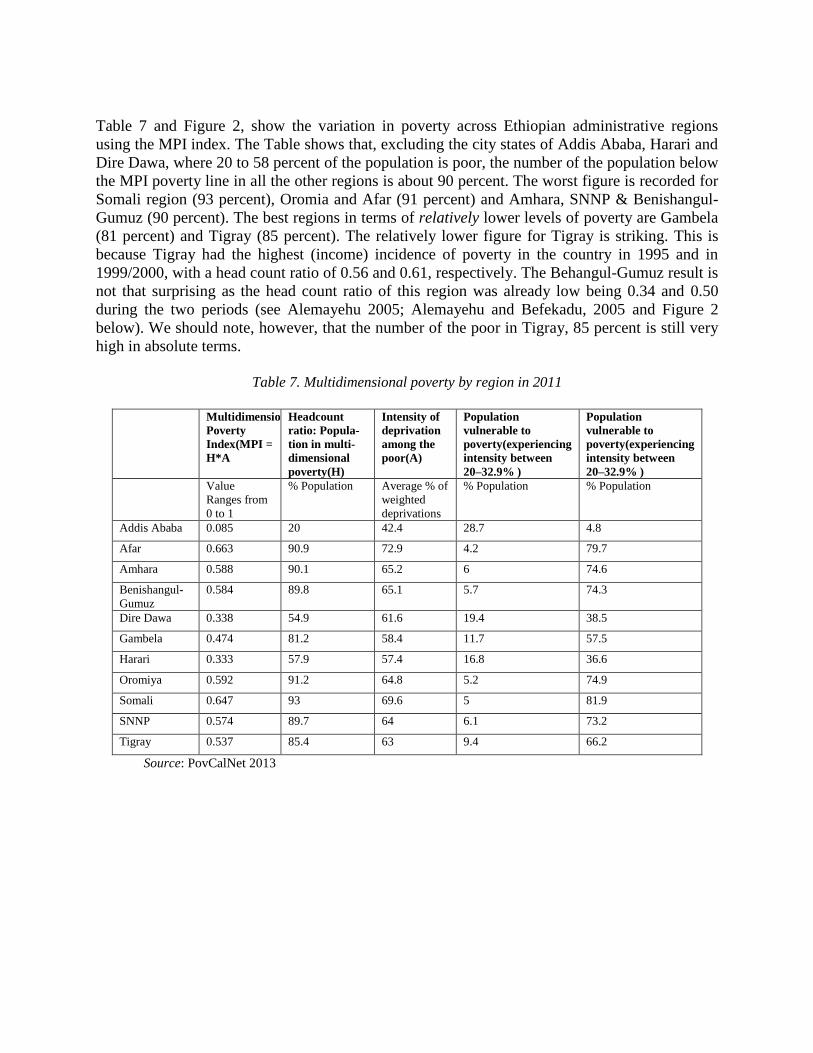
Table 7 and Figure 2, show the variation in poverty across Ethiopian administrative regions
using the MPI index. The Table shows that, excluding the city states of Addis Ababa, Harari and
Dire Dawa, where 20 to 58 percent of the population is poor, the number of the population below
the MPI poverty line in all the other regions is about 90 percent. The worst figure is recorded for
Somali region (93 percent), Oromia and Afar (91 percent) and Amhara, SNNP & Benishangul-
Gumuz (90 percent). The best regions in terms of relatively lower levels of poverty are Gambela
(81 percent) and Tigray (85 percent). The relatively lower figure for Tigray is striking. This is
because Tigray had the highest (income) incidence of poverty in the country in 1995 and in
1999/2000, with a head count ratio of 0.56 and 0.61, respectively. The Behangul-Gumuz result is
not that surprising as the head count ratio of this region was already low being 0.34 and 0.50
during the two periods (see Alemayehu 2005; Alemayehu and Befekadu, 2005 and Figure 2
below). We should note, however, that the number of the poor in Tigray, 85 percent is still very
high in absolute terms.
Table 7. Multidimensional poverty by region in 2011
Multidimensional
Poverty
Index(MPI =
H*A
Headcount
ratio: Popula-
tion in multi-
dimensional
poverty(H)
Intensity of
deprivation
among the
poor(A)
Population
vulnerable to
poverty(experiencing
intensity between
20–32.9% )
Population
vulnerable to
poverty(experiencing
intensity between
20–32.9% )
Value
Ranges from
0 to 1
% Population
Average % of
weighted
deprivations
% Population % Population
Addis Ababa 0.085 20 42.4 28.7 4.8
Afar 0.663 90.9 72.9 4.2 79.7
Amhara 0.588 90.1 65.2 6 74.6
Benishangul-
Gumuz
0.584 89.8 65.1 5.7 74.3
Dire Dawa 0.338 54.9 61.6 19.4 38.5
Gambela 0.474 81.2 58.4 11.7 57.5
Harari 0.333 57.9 57.4 16.8 36.6
Oromiya 0.592 91.2 64.8 5.2 74.9
Somali 0.647 93 69.6 5 81.9
SNNP 0.574 89.7 64 6.1 73.2
Tigray 0.537 85.4 63 9.4 66.2
Source: PovCalNet 2013
Source: Author‘s computation using MOFED 2012
How does the reported growth relate to poverty and inequality?
Growth, inequality and poverty reduction
Growth is a necessary but not sufficient condition for poverty reduction. This is chiefly because
the distribution of income associated with growth may have a negative bearing on poverty
reduction. This effect is not small either. As White and Anderson (2001) (cited in Naschold
2002) demonstrate, a small change in income distribution can have a large effect on poverty
reduction: a redistribution of one quarter of one per cent that goes to the poorest 20 percent of the
population would have the same effect as doubling of the growth rate10
. Thus, we need to look
not only at growth but also to the nature of that growth. As has been demonstrated in Alemayehu
et al (2008) for Ethiopia, assuming the income distribution to be relatively continuous,11
any
distribution-neutral growth in per capita income, no matter how low, will reduce the intensity of
poverty. However, redistribution reduces poverty only to the extent that it moves a person above
a defined poverty line.12
Even confronted with the condition of low per capita income, which
Ethiopia finds itself in, Alemayehu et al. (2008) have shown that simple redistribution rules –
10
A simple arithmetical example of White and Anderson (2001), as quoted in Naschold (2002), can help visualise this “… Imagine a country
where the share of national income that goes to the poorest 20% of the population increases from 6% to 6.25%. A change in income distribution of
one quarter of one per cent would barely affect the Gini coefficient, but for the poor this represents a 4% increase in their total income. Such a
small redistribution would have the same effect on poverty as doubling the annual growth of national income from 4%, which is the projected
growth rate of many African countries, to 8%, which is necessary to achieve the income poverty Millennium Development Goal (MDG)” 11 That is, we assume there are no „gaps‟ in the distribution below and near the poverty line. 12 A redistribution of one percentage point of GDP from the richest ten per cent of the population to the poorest ten per cent, equally
distributed among the latter, would improve the incomes of all those in the lowest decile, but might shift none of them above the poverty line.
0
0.05
0.1
0.15
0.2
0.25
0.3
0.35
0.4
0.45
0.5
0.361
0.111
0.281 0.283 0.296
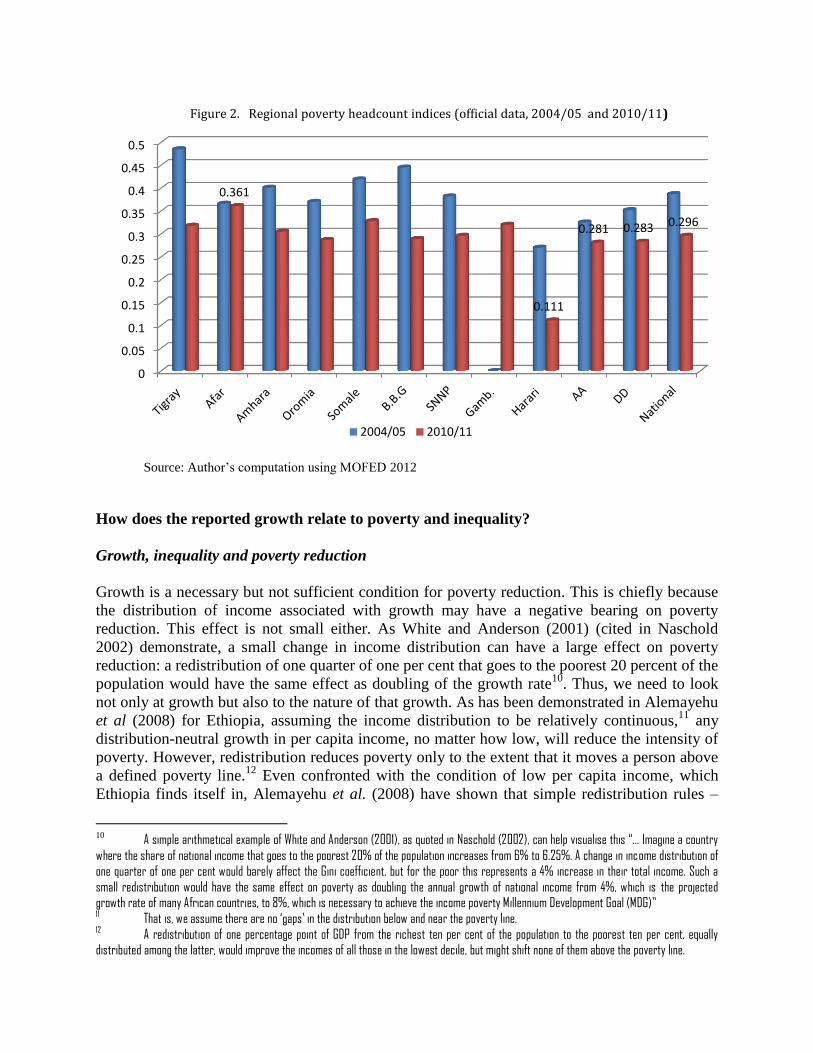
Figure 2. Regional poverty headcount indices (official data, 2004/05 and 2010/11)
2004/05 2010/11

such as equal absolute increments across all percentiles, top to bottom, –that follow the Chenery
et. al. (1974) approach -could reduce poverty significantly. These rules could be viewed as
relatively minimalist, with alternative redistribution rules considerably more progressive,
resulting in powerful outcomes for poverty reduction.
Despite earlier empirical evidence (e.g. Anand and Kanbur 1993, Bruno, Ravallion and Squire
1998, Fields 1998, Dollar 2001, and Dollar and Kraay (200013
) on the absence of any systematic
relationship between income inequality and economic growth, interest on this inter-linkage has
resurfaced, as noted by Alemayehu et al. (2008), due mainly to the following factors. One is the
growing empirical evidence that explored the relationship between high initial income inequality
and subsequent economic growth (see Kanbur, 1999, 2000 for review) using the new
endogenous growth theory and insights from political economy. In this connection, Ravallion‘s
(1997) findings state that at any level of economic growth, the higher is income inequality, the
lower income-poverty falls. Moreover, it is possible for income inequality to be sufficiently high
to lead to higher poverty. The other main factor is the sharp increase in income inequality that is
observed in many developing countries following growth and liberalization (see for instance, Li,
Squire and Zou 1998 and Kanbur, 1999; Alemayehu and Abebe, 2006; also Besley and Burguess
2003, Burgingnon 2003).). Barro (2000) also argued that in economies where the initial pattern
of income distribution is highly unequal and vertical mobility is restricted by economic, social
and institutional hurdles, economic growth –if it happens at all- tends to have limited impact on
reducing poverty (Barro, 2000). Whereas redistribution policies, when cautiously implemented,
might be used to address immediate crisis situations, they have limited effectiveness in reducing
poverty on a sustainable basis, however. Even economies with remarkable growth rates could not
achieve sustainable poverty reduction if the growth process does not generate productive job
opportunities, mobility, asset accumulation, and productive engagement of an increasing number
of the population (Easterly et al, 2004). The pattern, characteristics and sector composition and
sustainability of growth are as important for poverty reduction as the pace of growth
performance (Romer 1986).
Another strand in the theoretical literature provides two contradictory views on the link between
inequality and growth. The classical approach argues that there is a higher marginal propensity to
save among the rich than among the poor. The implication is that a higher inequality will result
in a higher saving. This will result in a higher capital accumulation and growth (Nissanke and
Thorbecke 2008). The opposing view, the so-called new political economy, links greater
inequality with reduced growth. Such a relation arises due to: (1) the dissemination of political
and social instability leading to greater uncertainty and lower investment, (2) unproductive rent
seeking activities reducing the security of property, and (3) wide income and wealth gaps
adversely influencing education and health, and giving rise to widespread crime (Nissanke and
Thorbecke 2008). The underdevelopment in human capital and malnutrition leads to lower long-
term growth. This latter view of the link between growth and inequality is recently gaining
momentum as some empirical findings reject the Kuznet‘s hypothesis of inverted U-shaped
relationship between growth and inequality (Nissanke and Thorbecke 2008).
The empirical literature on Africa shows the negative impact of inequality on the poverty
reduction effect of growth (see Alemayehu and Abebe 2006; Alemayehu et al 2008; Fosu 2009,
13 See Dagdeviren et al (2000) for analytical critics of the Dollar-Kay approach and the possibility of getting the opposite result, however.

for instance). Fosu (2009) found that in sub-Saharan Africa, the impact of GDP growth on
poverty reduction is a decreasing function of initial inequality. Ravallion (2001) and Bigsten and
Abebe (2007) argued that initial inequalities determine how much the poor share in aggregate
growth or contraction. Ravallion (2005) found poverty to be inversely correlated with relative
inequality, but that the relationship depends on how inequality is measured. Ferreira et al. (2008)
repoorted negative correlations between both poverty and inequality indices, on the one hand,
and mean income per capita on the other and noted that inequality tends to reduce the growth
elasticity of poverty reduction. Adams (2004) argued that though economic growth reduces
poverty, the actual extent of poverty reduction depends on how economic growth is measured.
Baye (2006) found that growth components dominated the redistribution components in
explaining poverty at the national and regional levels. This finding is consistent with earlier
findings by Datt and Ravallion (1992). Odedokun and Round (2004) also found that high
inequality reduces growth and that the channels through which inequality affect growth included
reduction in secondary and tertiary education investments, reduced political stability, and
increased fertility rate. This doesn‘t mean, however, that there are no studies that do not
contradict such findings, though they seem to be rare in Africa. For instance, Arndt et al. (2006)
used generalized entropy class of inequality decomposition in Mozambique and showed that
inequality between provinces and regions diminished over time as income grew. However, such
findings are not many.
In an earlier study on Ethiopia, Bigsten et al. (2003) found that potential poverty-reduction due
to the increase in real per capita income was to some extent counteracted by worsening income
distribution. Alemayehu et al. (2008) and Tassew et al (2008) have confirmed the significance of
distribution of income in alleviating poverty, particularly for poor countries like Ethiopia.
Tassew et al. (2008) reported that the prevalence of higher inequality in urban areas increases the
incidence of poverty. Using a household panel data, Alemayehu et al. (2008) showed the
existence of a strong positive correlation between growth and inequality. On the basis of realistic
assumptions, the study further showed that from a baseline in 2000 of a 44 percent poverty level,
over ten years at growth of 4 percent per capita, poverty would decline from 44 to 26 percent for
distribution-neutral growth (i.e., no change in the aggregate income distribution). In contrast,
were the growth increment distributed equally across percentiles (equally distributed gains of
growth, EDG) poverty would decline by over half, to 15 percent, a difference of almost eleven
percentage points. Thus, ‗distribution matters‘, even, or especially in a poor country like
Ethiopia. Finally, with regard to the source of such inequality, Bigsten and Abebe (2006)
attempted to decompose the determinants of income inequality in Ethiopia using a regression
model of consumption expenditure at the household level. The result indicated that in rural areas
a large part of the variation in income inequality could be explained by differences in village
level characteristics and other unobserved factors. For urban areas, significant factors that played
a role in determining inequality were household characteristics such as occupation of the head of
the household, educational level of the head of the household and other unobserved
characteristics. For rural areas during the period 1994-2004, after controlling for village level
differences (through village dummies), average land holding size and its variance, and education
of the key members of the household (the head and the wife) seem to be a very important factor
driving inequality (see Bigsten and Abebe, 2006; and also Alemayehu et al. 2008).

Given such analytical link between growth, poverty and inequality, it is imperative to see the
recent record on inequality and its effect on poverty reduction in Ethiopia. In the context of
Ethiopia, the evidence on inequality over the decade, obtained from the national household
income and consumption surveys, as well as the panel data of the AAU, indicates that it has been
clearly rising in urban areas, and remained more or less at its initial level in rural areas though it
exhibited considerable variations across time according to the panel data (Table 4.1 [8]) (see
Alemayehu et al. 2008). Urban inequality, apart from its political imperative (discussed at length
in Alemayehu 2013), has a detrimental effect on poverty reduction. That is, the rise in inequality
in urban Ethiopia in particular, has wiped out the poverty-reducing effect of growth.
The nature and extent of inequality in Ethiopia
Compared to 1995/96 inequality has increased in 2004/05 across all regions in Ethiopia although
its magnitude is not that significant. In 2004/05 inequality, measured by Gini, is the highest for
Addis Ababa (0.46) followed by Dire Dawa (0.39) and Tigray (0.37). It was the least for Amhara
(0.27). If urban inequality is taken, however, Tigray ranks first (0.49) followed by Addis Ababa
(0.46) and Dire Dawa (0.43). In SNNP and Amhara, significant growth in consumption occurred
with relatively little change in the distribution of consumption with the result that poverty fell
considerably in both places. Poverty also fell in Tigray and in Benishangul-Gumuz, but in these
regions the poverty reducing impact of consumption growth is offset by increased inequality.
According to the latest information available, HICE (2010/11), regionally, poverty is highest in
Afar (36.0 percent), followed by Somali (32.8 percent) and Tigray (31.8 percent), while it is
lowest in Harari (11.0 percent), followed by Addis Ababa (28.1 percent) (See Figure 2).
Table 8. Indicators of inequality (1995-2010/11). Based on
national and Dept of Economics data
Year CSA, Nationally Representative Data Dept. of Economics, AAU, Panel Based
Data
National Urban Rural Addis
Ababa
National Urban Rural
1994 48 43 49
1995 0.29 0.34 0.27 48 42 49
1995/96
1997 42 46 41
1999/00 0.28 0.38 0.26
2000 51 49 51
2004 45 46 45
2004/05 0.30 0.44 0.26
2010/11 0.30 0.37 0.27 NA NA NA
Source: MOFED 2012, Dept. of Economics, AAU data.
This trend of urban inequality has not fundamentally changed in 2011 (see Table 8) and Figure
2), and the national head count figure remains at 0.30 while inequality in the rural areas
increased just by one percentage point, compared to 2004/05, registering a Gini of 0.26. Still the
urban inequality remains the highest at 0.37 although this shows a significant drop of 07
percentage points compared to 2004/05. Notwithstanding this trend, the inequality indicators in
Table 8 are very high, in particular, considering that the AAU panel data-based indicators in the
past have been about 10 percentage points above the national figure (see Table 8, shaded
columns). If we assume that the official data is not reliable and the small sample size of the AAU
data is not a major problem, this may suggest the current urban Gini coefficient to be over 47
percent and the national one to be about 40 percent. In fact, the official low figure and its
aggregate nature might hide the high inequality that should be expected in cases such as we have
here of high growth and increased global integration (see Alemayehu et al. 2008, Alemayehu and
Abebe 2006, Alemayehu and Alem 2006). For instance, detailed data analysis shows that the
bottom 20 percent of the population has only about one-sixth (about 16 percent) of the income of
the top 20 percent. Contrary to the government report, the World Bank (2013) has found an
increase in nationwide inequality levels, as measured by the Gini coefficient, of 0.298 in 2005 to
0.336 in 2011. In addition, we also observe that inequality among community groups (and across
ethno-linguistic lines) is also growing significantly, threatening the social fabric of the country
(discussed in detail in Alemayehu 2013). A supporting evidence for our doubt of the official data
may be inferred from Table 9 below.
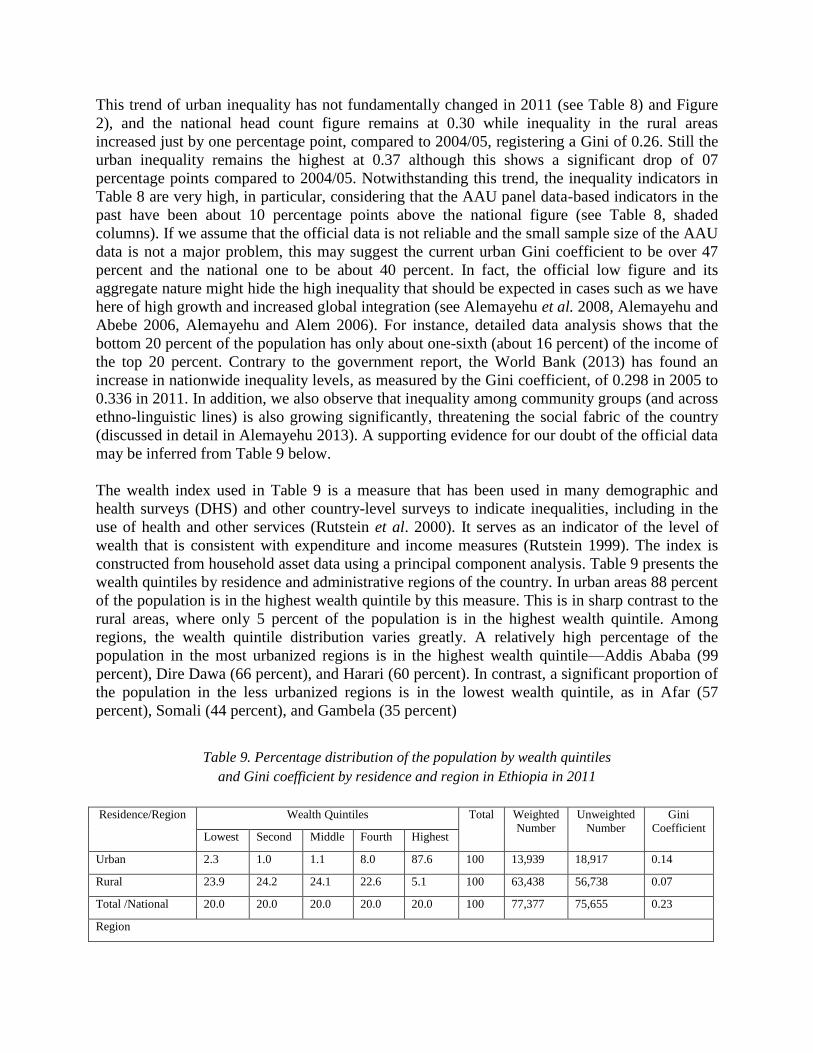
The wealth index used in Table 9 is a measure that has been used in many demographic and
health surveys (DHS) and other country-level surveys to indicate inequalities, including in the
use of health and other services (Rutstein et al. 2000). It serves as an indicator of the level of
wealth that is consistent with expenditure and income measures (Rutstein 1999). The index is
constructed from household asset data using a principal component analysis. Table 9 presents the
wealth quintiles by residence and administrative regions of the country. In urban areas 88 percent
of the population is in the highest wealth quintile by this measure. This is in sharp contrast to the
rural areas, where only 5 percent of the population is in the highest wealth quintile. Among
regions, the wealth quintile distribution varies greatly. A relatively high percentage of the
population in the most urbanized regions is in the highest wealth quintile—Addis Ababa (99
percent), Dire Dawa (66 percent), and Harari (60 percent). In contrast, a significant proportion of
the population in the less urbanized regions is in the lowest wealth quintile, as in Afar (57
percent), Somali (44 percent), and Gambela (35 percent)
Table 9. Percentage distribution of the population by wealth quintiles
and Gini coefficient by residence and region in Ethiopia in 2011
Residence/Region Wealth Quintiles Total Weighted
Number
Unweighted
Number
Gini
Coefficient Lowest Second Middle Fourth Highest
Urban 2.3 1.0 1.1 8.0 87.6 100 13,939 18,917 0.14
Rural 23.9 24.2 24.1 22.6 5.1 100 63,438 56,738 0.07
Total /National 20.0 20.0 20.0 20.0 20.0 100 77,377 75,655 0.23
Region

Tigray 25.8 22.3 16.1 13.1 22.7 100 5,035 7,794 0.26
Afar 57.0 9.5 4.9 6.9 21.7 100 667 6,048 0.29
Amhara 22.4 22.7 21.8 17.1 16.0 100 19,478 9,264 0.20
Oromiya 16.0 20.9 22.4 25.3 15.4 100 29,800 10,325 0.19
Somali 43.9 8.0 9.7 11.6 26.8 100 1,810 5,150 0.20
Benishangul-
Gumuz
29.7 18.7 1 19.0 20.2 12.3 100 809 5,978 0.18
SNNP 21.7 20.4 20.6 21.0 16.2 100 16,069 10,169 0.17
Gambela 34.9 7.5 8.0 22.7 26.9 100 284 5,473 0.29
Harari 2.0 6.5 10.0 21.4 60.1 100 213 4,865 0.26
Addis Ababa 0.3 0 0.2 0 0.1 0.4 98.9 100 2,919 5,710 0.02
Dire Dawa 8.0 9 9.7 1 11.0 5.7 65.7 100 291 4,879 0.23
Source: EDHS (2011)
Having established that the distribution of income is important for reducing poverty, it is
necessary to conclude this section by providing the possible effect of it on poverty reduction in
Ethiopia. Using the 2004/05 data, Alemayehu et al. (2008) computed the elasticity of poverty to
growth and inequality in Ethiopia to be about -2.2 and 1.7, respectively. Using this elasticity and
the likely level of growth as reported in Table 2 and the level of inequality given in Table 8, we
have computed the most likely level of (income) poverty in the country. For this purpose we
have used an average economic growth of 5 to 8 percent (average 6.5 percent) in the last decade.
With an estimated population growth of about 2.5 percent this will give a per capita income
growth of about 4 percent. The average national inequality/ Gini coefficient is assumed to be
0.37, which is an average of the national and the panel data estimates, assuming the latest panel
based estimate is unchanged as that of the year 2004/05. The result of this exercise is given in
Figure 3 (and also shown in Table 5). The result shows that the most likely level of income
poverty in the country is about 33 percent. On the other hand, if the average gap of the panel and
the national data of 10 percentage points are taken on board, the figure will be about 42 percent.

Figure 3. The most likely trend of income poverty head count ratio in Ethiopia
Source: Authors projection based on Initial poverty level of 39.1 &48.1 in 2004/05
Note: *The top 2 lines are valid if the initial poverty level is assumed to be adjusted upward using the AAU panel
data.
Conclusion:
In this study an attempt was made to look at the macroeconomic evolution of the country, as well
as its growth, poverty and inequality. The study began by examining the official data on the rate
of growth, poverty and inequality in the country, and went on to analyze the gap between the
official data and those of international institutions, and the apparent contradiction of high rates of
growth and strong evidence of pervasive poverty. The conclusions to be drawn from this attempt
are the following. First, even the modest growth rate that we came up with (which is about half
the official figure) as well as the positive development in building infrastructure in the last
decade are excellent achievements by African standards as well as those of many developing
countries. Thus, there is no reason to make data on national accounts, such as GDP growth,
political. Second, it is essential that data generating institutions, such as the CSA, MOFED and
NBE, be staffed by professionals and their research methods and data be subject to review by an
independent peer-review process on a regular basis. They need also to be autonomous and
transparent, and, to the extent possible, insulated from politics and pressure from the
government.
After questioning the official data and its likely implications, the study attempted to offer what is
the most likely picture of growth, poverty and inequality in the country. In this regard the
conclusion is that there is a good deal of growth but the growth rate is modest. There is also a
39.1 36.7
34.5 33.2 32.5 31.9
48.1 45.8
43.7 42.3 41.6 41.0
0.0
10.0
20.0
30.0
40.0
50.0
60.02
00
4/0
5
20
05
/06
20
06
/07
20
07
/08
20
08
/09
20
09
/10
20
10
/11
20
11
/12
20
12
/13
20
13
/14
20
14
/15
He
ad c
ou
nt
rati
o (
%)
Trends of Poverty Head Count Ratio, P0 (%)
P0 If Inequality is Not a problem
*Trends of Poverty Head Count Ratio, P0(%)
*P0 If Inequality is Not a problem

marked absence of structural transformation in the country in the last four decades. We also
noted that growth and distribution are found to be important determinants of the change in
poverty. In rural areas poverty reduction is fully accounted by growth (inequality was not
significant). While in urban areas the poverty reduction effect of growth is more than wiped out
by the inequality that has accompanied it, and this underscores the need to address the challenges
of inequality. Thus, achieving poverty reduction entails meeting, in addition to growth, the
challenges of: (i) growth and vulnerability both at household and country level and (ii)
addressing both vertical and horizontal inequality. In particular, addressing the issue of emerging
horizontal inequality is central not only for poverty reduction but also for ensuring a politically
stable country, free from recurrent conflicts.
Finally, the study has shown that the Ethiopian economy and the country‘s poor are extremely
vulnerable to external shocks, which may include conflict, climate change (rainfall variability or
drought), world price of exports and imports (such as coffee, and fuel) as well as aid and
remittances. The challenge of vulnerability has also a micro dimension. Poverty studies in the
country show that the poor are extremely vulnerable, and the chances of slipping back into
poverty both in rural and urban areas following shocks such as drought or the death of the head
of the household are very high. The level of poverty would have dropped nearly by half had it
not been for risks associated with vulnerability of households. This vulnerability and the
associated persistence of poverty is often related to the lack of structural transformation that is in
turn related to lack of technical progress in agriculture, lack of strong institutions, access to
markets, as well as low asset accumulation in the country. Addressing these structural issues is
important to achieve a sustainable reduction in poverty. This could be done in the medium term
by tackling the dependence on rain-feed agriculture through expansion of small and large-scale
irrigation. Structural transformation also requires raising the competitiveness of the industrial
and export sectors through the provision of increased physical infrastructure, human capital
formation, an enabling macroeconomic environment and developing a cadre of management
professionals with a sensible incentive structure. The government is doing much in the area of
infrastructure, however inefficient it might be, but seems to fail in the other areas and in
particular in the professionalization of the work force and institutions. Thus, capacity building
and decoupling politics and professionalism is important.
References
Abbi Mamo Kedir and Mckay, A. 2003. Chronic Poverty in Urban Ethiopia: Panel Data Evidence. Paper Prepared
for International Conference on Staying Poor: Chronic Poverty and Development. UK: Institute for
Development Policy and Management
Abbi Mamo Kedir and McKay, A. 2004. Chronic poverty in Ethiopia: Panel Data Evidence. Paper prepared for the
Workshop on Chronic Urban Poverty in Ethiopia, 16-18 August, 2004, Addis Ababa, Ethiopia.
Abbi Mamo Kedir 2000. ―Modelling Poverty and Its Determinants for Urban Ethiopia: The Multinomial Logit
Selection Model‖, Ethiopian Journal of Economics, Vol. 6(2): 1-36.
Adams, Richard Jr. 2004. "Economic Growth, Inequality and Poverty: Estimating the Growth Elasticity of Poverty,"
World Development, Vol. 32(12), pages 1989-2014, December
Alemayehu Geda 1993. ‗Quantitative Measurement of Poverty in Ethiopia‘, Ethiopian Journal of Development
Research, 15(2):17-53.)
Alemayehu Geda 1996. ‗Macro Data and Macroeconomic Analysis: The Relevance of A Consistent Macroeconomic
Database in Ethiopia‘ (Ethiopian Journal of Economics)
Alemayehu Geda 1998. ‘A Consistent Macro Database for Ethiopia (1970-1999)’, Ethiopian Economic Association,
A Research Report.

Alemayehu Geda, John Weeks, Daniel Zerfu and Jonse Degefa 2004. ‗Source of Growth in Ethiopia: A Background
Paper for Government of Ethiopia, MOFED, Addis Ababa.
Alemayehu Geda 2005. Does Conflict Explain Ethiopian Backwardness? Yes and Significantly. In Alemayehu Geda
(2001). Readings on Ethiopian Economy. Addis Ababa: Addis Ababa University Press.
Alemayehu Geda 2008. ‗The Political Economy of Growth in Ethiopia‘ in Benno Ndulu, Stephen A.O‘connell,
Jean_Paul Azam, Rober H.Bates, Augustin K. Fosu, Jan Willem Gunning and Dominique Njinkeu (eds).
The Political Economy of Growth in Africa: 1960-2000. Cambridge: Cambridge University Press).
Alemayehu Geda 2013. ‗The Political Economy of Growth, Poverty and Inequality in Ethiopian in the last Decade:
2000-2013‘. (Unprocessed, Department of Economics, AAU/IAES Working Paper, available at
www.Alemayehu.com
Alemayehu Geda and Alem Abereha 2006. ‗Macro Policy Reform, Labour Market, Poverty and Inequlaity in Urban
Ethiopia: A Micro-Simulation Approach‘, Ethiopian Journal of Economics, 13(2): 1-35.
Alemayehu Geda and Befekadu Degefe 2005. Conflict and Economic Performance in Ethiopia. In A.Fosu and P.
Collier (eds). Conflict and Post Conflict Economies in Africa. Basingstoke: Palgrave-Macmillan.
Alemayehu Geda, Abebe Shimeles and John Weeks 2008. Growth, Poverty and Inequality in Ethiopia: Which way
for Pro Poor Growth. Journal of International Development, 2008
Alemayehu Geda and Kibrom Tafere 2008. The Galloping Inflation in Ethiopia, Department of Economics,
Mimeo/IEAS WP, available at www.Alemayehu.com
Alkire, S. and Foster, J. 2007. Counting and multidimensional poverty measurement. OPHI working paper series
No. 07, Oxford Poverty and Human Development Initiative (OPHI), University of Oxford.
Alkire, S. and Foster, J. 2009. Counting and multidimensional poverty measurement. OPHI working paper series
No. 32, Oxford Poverty and Human Development Initiative (OPHI), University of Oxford.
Alkire, S. and J. Foster 2011. Counting and multidimensional poverty measurement. Journal of public economics,
95(7-8):476-487.
Alkire, S. and J.M. Roche. 2013. How MPI Went Down: Dynamics and Comparisons. Oxford Poverty & Human
Development Initiative, University of Oxford.
Alkire, S. and M. E. Santos 2010. Acute multidimensional poverty: A new index for developing countries. Human
development research paper, 2010/2011. UNDP.
Anandt, S., and R. Kanbur. 1993. The Kuznets Process and the Inequality-Development Relationship. Journal of
Development Economics 40:25–52.
Arndt, Channing, Robert C. James and Kenneth R. Simler 2006. Has Economic Growth in Mozambique been Pro-
Poor?, Journal of African Economies, 15(4), 571-602, December
Ayalneh Bogale 2011. Analysis of poverty and its covariates among smallholder farmers in the Eastern Hararghe
highlands of Ethiopia. Journal of Development and Agricultural Economics Vol. 3(4), pp. 157-164, April
2011
Ayalneh Bogale, Konrad Hagedorn,and Benedikt Korf 2005. Determinants of poverty in rural Ethiopia, Quarterly
Journal of International Agriculture 44, 2: 101 120.
Barro, R. 1999. Inequality, Growth, and Investment. NBER Working Paper No. 7038. National Bureau of Economic
Research, Cambridge, MA, 1999.
Barro, R. J. 2000. Inequality and Growth in a Panel of Countries. Journal of Economic Growth vol. 5, no 1: 5-32.
Baye, F.M. 2006. Growth, Redistribution and Poverty Changes in Cameroon: A Shapley Decomposition Analysis,
Journal of African Economies, 15(4), 543-570.
Bevan, P. and S.F. Joirmann 1997. The Perils of Measuring Poverty: Identifying the Poor in Rural Ethiopia, Oxford
Development Studies 25 (3): 315-337.
Besley, Timothy and Robin Burgess 2003. Halving Global Poverty, The Journal of Economic Perspective, 17(3):3-
22.
Bigsten, A., Bereket Kebede, Abebe Shimelis and Mekonnen Taddesse 2003. Growth and poverty reduction in
Ethiopia: Evidence from households panel surveys. World Development, 31 (1): 87-106.
Bigsten, Arne and Abebe Shimeles 2005. Poverty and Income Distribution in Ethiopia: 1994-2000. Department of
Economics, Gothenburg University, Gothenburg, Sweden.
Bigsten, A. and Abebe Shimeles 2006. Poverty and income distribution in Ethiopia: 1994-2000, in Abebe Shimeles
Essays on poverty, risk and consumption dynamics in Ethiopia‖, Economic Studies, no 155, Department of
Economics, University of Göteborg.
Bigsten, Arne and Abebe, Shimeles 2007. Poverty transition and persistence in Ethiopia: 1994-2004. Goteborg
University, School of Business, Economics and Law.

Bigsten, A. and Abebe Shimeles 2008. Poverty transition and persistence in Ethiopia: 1994- 2004. World
Development, 36(9), 1559-1584.
Bruno, M., M. Ravallion and L. Squire, 1996. Equity and Growth in Developing Countries: Old and New
Perspectives on the Policy Issues, Policy Research Working Paper, No. 1563, The World Bank, Washington
D.C.
Burgingnon, Francois 2003. The Growth Elasticity of Poverty Reduction Explaining Heterogeneity among
Countries and Time Period‘ World Bank Research Group (Mimeo)
Chenery, H, M. S. Ahluwalia, C. L. G. Bell, J. H. Duloy and R. Jolly 1974. Redistribution with Growth: Policies to
Improve Income Distribution in Developing Countries in the Context of Economic Growth. Oxford: Oxford
University Press
Datt,G. and Ravallion ,M 1992. Growth and Redistribution Components of Changes in Poverty Measures : A
Decomposition with Applications to Brazil and India in the 1980s, Journal of Development Economics,
38:275-295
Dercon, S. 2001. Economic reform, growth and the poor: Evidence from rural Ethiopia. Working Paper Series 2001:
8, Centre for the Study of African Economies, Oxford, Oxford University.
Dercon, S. 2006. Economic reform, Growth and the Poor: Evidence from Rural Ethiopia. Journal of Development
Economics, vol. 81, issue 1, pp.1-24
Dercon, S. and Krishnan, P. 1998. Changes in poverty in rural Ethiopia 1989-1995: Measurement, robustness tests
and decomposition. Working Paper Series, 98:7, Centre for the Study of African Economies, Oxford,
Oxford University.
Dercon, Stefan, Ruth V. Hill and Andrew Zeitin 2009. Rethinking Agricultural-led Growth in Ethiopia. Synthesis
Paper Prepared as Part of a Study on Agriculture and Growth in Ethiopia Conducted for DFID, University
of Oxford, Unprocessed.
Dercon , S., Hoddinott ,J. ,and Tassew Woldehanna 2007. Growth and Poverty in Rural Ethiopia: Evidence from 15
Communities 1994-2004. Background Paper for the Chronic Poverty Report 2008-09. Chronic Poverty
Research Centre
Dercon, S., and Mekonnen Tadesse 1999. A Comparison of Poverty in Rural and Urban Ethiopia. Ethiopian Journal
of Economics 8, no. 1: 83-98.
Desalegne Rahmato 1992. The Dynamics of Rural Poverty: Case Studies from a District in Southern Ethiopia‘
CODESRIA Monograph Series, 2/92, Dakar, Senegal.
Dagdeviren, H., John Weeks and Rolph van der Hoeven 2000. Redistribution Matters: Growth for Poverty
Reduction, SOAS Department of Economics Working Papers, No. 99, (London: School of Oriental and
African Studies)
Dollar, David 2001.Globalization, Inequality, and Poverty since 1980. Background Paper, Development Research
Group, World Bank, November
Dollar, D and A. Kraay, 2000. Growth is Good for the Poor. World Bank Policy Research Working Paper No. 2587
Easterly, William, Ross Levine, and David Roodman 2004. New Data, New Doubts: A Comment on Burnside and
Dollar‘s ―Aid, Policies, and Growth‘, American Economic Review, 94, no. 3, June.
EDHS (Ethiopian Demographic and Health Survey) 2011. Addis Ababa: Central Statistics Agency
Fields, Gary 1980. Poverty, Inequality and Development. Cambridge: Cambridge University Press
Fields, G. S. 1998. Do inequality measures measure inequality? [Electronic version]. In S. P. Jenkins, A. Kapteyn, &
B. M. S. Van Praag (Eds.) The distribution of welfare and household production. Cambridge: Cambridge
University Press, pp. 233-249
Foster, J., Greer, J., and Thorbecke, E. (1984). Notes and comments: a class of decomposable poverty measures.
Econometrica, 52(3), 761-766.
Fosu, Augustin Kwasi 2009. Inequality and the Impact of Growth on Poverty: Comparative Evidence for Sub-
Saharan Africa, Journal of Development Studies, 45(5), pp 726-745
Hulme, D.; Shepherd, A 2003. Conceptualizing Chronic Poverty, World Development, Volume 31, Number 3,
March 2003 , pp.403-423.
IMF (International Monetary Fund) 2012. IMF Country Report on Ethiopian, No. 12/287. Washington, D.C.,
October
Jerven, Morten (2013). Poor Numbers: How We are Misled by African Development Statistics and What to Do
About IT. Ithaca: Cornel University Press.
Kanbur, R. (1999). Income Distribution and Growth, World Bank Working Papers: 98-13, Washington: The World
Bank)

Kuznets, Simon 1953. Shares of upper-income groups in income and savings, National Bureau of Economic
Research, New York.
Li, H., L. Squire and H.F. Zou 1998. Explaining International Inequality and Intertemporal Variations in Income
Inequality, Economic Journal, 108: 26-43.
Mekonnen Tadesse 1996. Food Consumption and Poverty in Urban Ethiopia: A Preliminary Assessment. In
Proceedings of the Fifth Annual Conference on the Ethiopian Economy, Kebede, B., and M. Tadesse (eds),
Addis Ababa.
Mekonnen Tadesse 1999. Determinants and Dynamics of Urban Poverty in Ethiopia. Ethiopian Journal of
Economics 8, 1: 61-82.
MOFED (Ministry of Finance and Economic Development) 2006. Ethiopia: Building on Progress - A Plan for
Accelerated and Sustained Development to End Poverty (PASDEP) (2005/06- 2009/10) Volume I: Main
Text, Addis Ababa.
______ 2002. Poverty Profile of Ethiopia: Analysis based on the 1999/00 HICE & WM Survey Results. Welfare
Monitoring Unit (WMU), Ministry of Finance and Economic Development (MOFED), Federal Democratic
Republic of Ethiopia.
_______ 2003. Ethiopia: Sustainable Development and Poverty Reduction Program-Annual Progress Report
(2002/2003), December, Addis Ababa.
______ 2008. Dynamics of growth and poverty in Ethiopia (1995/96-2004/05). Development Planning and Research
Department, Ministry of Finance and Economic Development. April, Addis Ababa
______ 2012. Ethiopia`s Progress Towards Eradicating Poverty: An Interim Report on Poverty Analysis Study
(2010/11), May, Addis Ababa.
_______ 2013. National Economic Accounts Statistics of Ethiopia, Estimates of the 2010/11 Base Year Series,
April, Addis Ababa
Naschold, Felix 2002. Why Inequality Matters for Poverty. Department for International Development (DFID)
Inequality Briefing, London
Nissanke, Machiko and Thorbecke, Eric 2008. Globalization and Poverty in Asia: Can Shared Growth be Sustained?
In: Nissanke, Machiko and and Erik Thorbecke, eds. (2010) The Poor under Globalization in Asia, Latin
America and Africa. Oxford: Oxford University Press.
Odedokun ,M.O. and Jeffery I. Round 2004. Determinants of Income Inequality and its Effects on Economic
Growth: Evidence from African Countries, African Development Review, 16(2), pp 287-327.
OPHI (Oxford Povertyand Human Development Iinitiative) 2013. How Multidimensional Poverty Went Down:
Dynamics and Comparisons. University of Oxford.
PovcalNet 2013.World Bank data, http://povertydata.worldbank.org and
http://iresearch.worldbank.org/PovcalNet/index
Ravallion, Martin, 1997. Can high-inequality developing countries escape absolute poverty?, Economics Letters, 56
(1), pp 51-57, September
Ravallion, M. 2001. Growth, Inequality and Poverty: Looking Beyond Averages, World Development 29, 1803-
1815.
Ravallion, Martin, 2005. A poverty-inequality trade-off?, Policy Research Working Paper Series 3579, The World
Bank
Ravallion, M., and B. Bidani 1994. How Robust is a Poverty Profile? The World Bank Economic Review 8, 1:75-102
Romer, P. 1986. Increasing Returns and Long-Run Growth, Journal of Political Economy, 94:5, 1002-37
Rutstein, S. Gwatkin, D.R,K. Johnson, R.P. Pande, and A. Wagstaff (2000). Socio-economic Differences in Health,
Nutrition and Population, HNP Poverty Thematic Group of the World Bank.
Solomon Gebre 1995.The Condition of the Poor in Addis Ababa: A Social Problem Not Yet Addressed in Asfaw
Desta and Desalegn Rahamato (eds.), Dialogue, Journal of Addis Ababa University Teachers Associaiton,
Vol 2, No 1.
Stewart, F. 2002. Horizontal Inequalities: A neglected dimension of development. QEH Working Paper Series,
Centre for Research on Inequality, Human Security and Ethnicity (CRISE) Oxford: CRISE.
Swanepoel, C. 2005. Poverty and Poverty Dynamics in Rural Ethiopia, Stellenbosch Economic Working Papers, 3 /
2005, University of Stellenbosch
Tassew Woldehanna and Tekie Alemu 2000. Poverty Profile of Ethiopia. A Report for Welfare Monitoring Unit
(WMU), Ministry of Finance and Economic Development (MOFED), Federal Democratic Republic of
Ethiopia (FDRE), Addis Ababa
Tassew Woldehanna, John Hoddinott and Stefan Dercon 2008. Poverty and Inequality in Ethiopia: 1995/96 –
2004/05.

UNDP 2013. The Rise of the South: Human Progress in a Diverse World. Explanatory note on 2013 HDR composite
indices. Violence in Multiethnic Societies. Frances Stewart (ed.) New York: Palgrave MacMillan.
White, H. and Anderson, E. 2001. Growth versus Distribution: Does the Pattern of Growth Matter? Development
Policy Review, 19: 267–289.
World Bank (2012). World Development Indicators. Washington,DC: World Bank.
World Bank (2013). World Development Report. Washington,DC: World Bank
Recommended