
Group Professionals Concept
Robbin Brugman – MD Group Professionals Concept
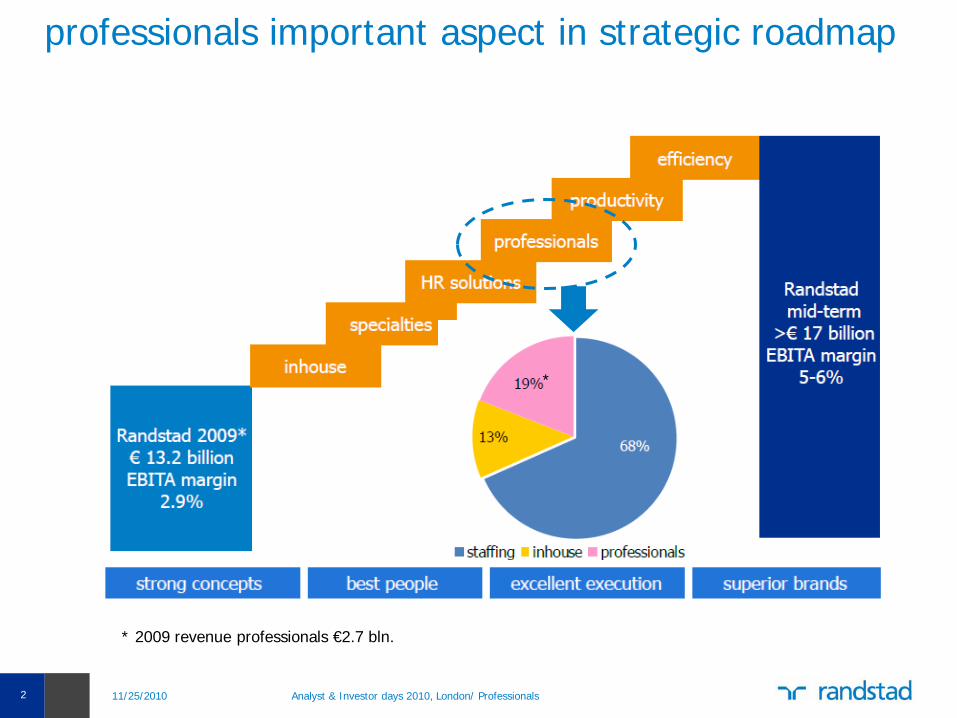
professionals important aspect in strategic roadmap
11/25/2010 Analyst & Investor days 2010, London/ Professionals 2
* 2009 revenue professionals €2.7 bln.
*
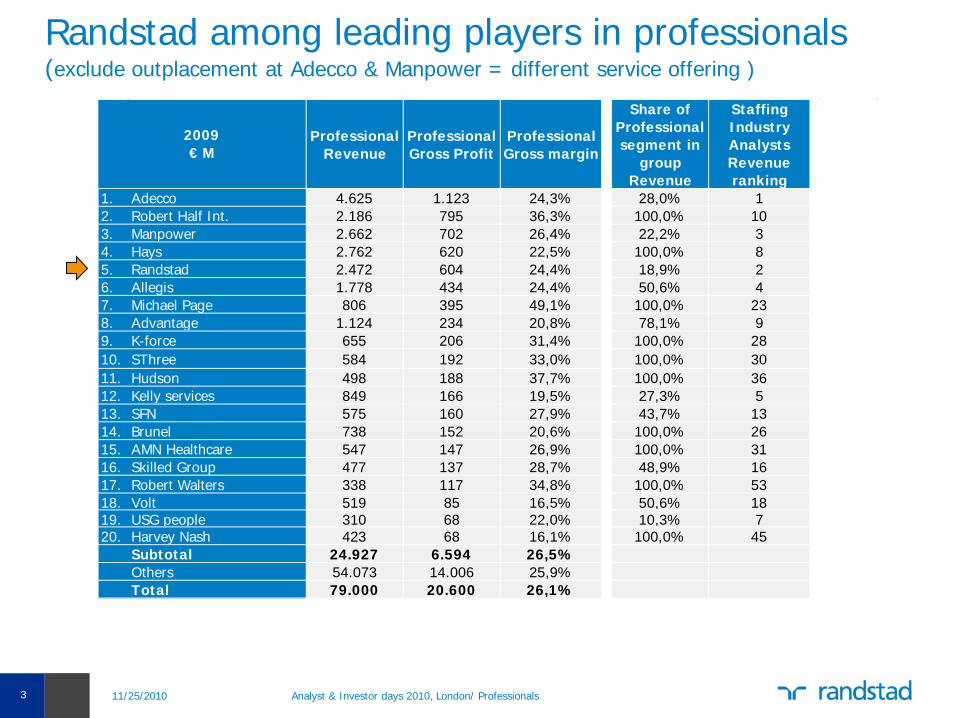
Randstad among leading players in professionals (exclude outplacement at Adecco & Manpower = different service offering )
3
ProfessionalRevenue
ProfessionalGross Profit
ProfessionalGross margin
Share of Professional segment in
group Revenue
Staffing Industry Analysts Revenue ranking
1. Adecco 4.625 1.123 24,3% 28,0% 12. Robert Half Int. 2.186 795 36,3% 100,0% 103. Manpower 2.662 702 26,4% 22,2% 34. Hays 2.762 620 22,5% 100,0% 85. Randstad 2.472 604 24,4% 18,9% 26. Allegis 1.778 434 24,4% 50,6% 47. Michael Page 806 395 49,1% 100,0% 238. Advantage 1.124 234 20,8% 78,1% 99. K-force 655 206 31,4% 100,0% 2810. SThree 584 192 33,0% 100,0% 3011. Hudson 498 188 37,7% 100,0% 3612. Kelly services 849 166 19,5% 27,3% 513. SFN 575 160 27,9% 43,7% 1314. Brunel 738 152 20,6% 100,0% 2615. AMN Healthcare 547 147 26,9% 100,0% 3116. Skilled Group 477 137 28,7% 48,9% 1617. Robert Walters 338 117 34,8% 100,0% 5318. Volt 519 85 16,5% 50,6% 1819. USG people 310 68 22,0% 10,3% 720. Harvey Nash 423 68 16,1% 100,0% 45
Subtotal 24.927 6.594 26,5%Others 54.073 14.006 25,9%Total 79.000 20.600 26,1%
2009€ M
11/25/2010 Analyst & Investor days 2010, London/ Professionals

4
Randstad Professionals global operations 2009
11/25/2010 Analyst & Investor days 2010, London/ Professionals
Revenue
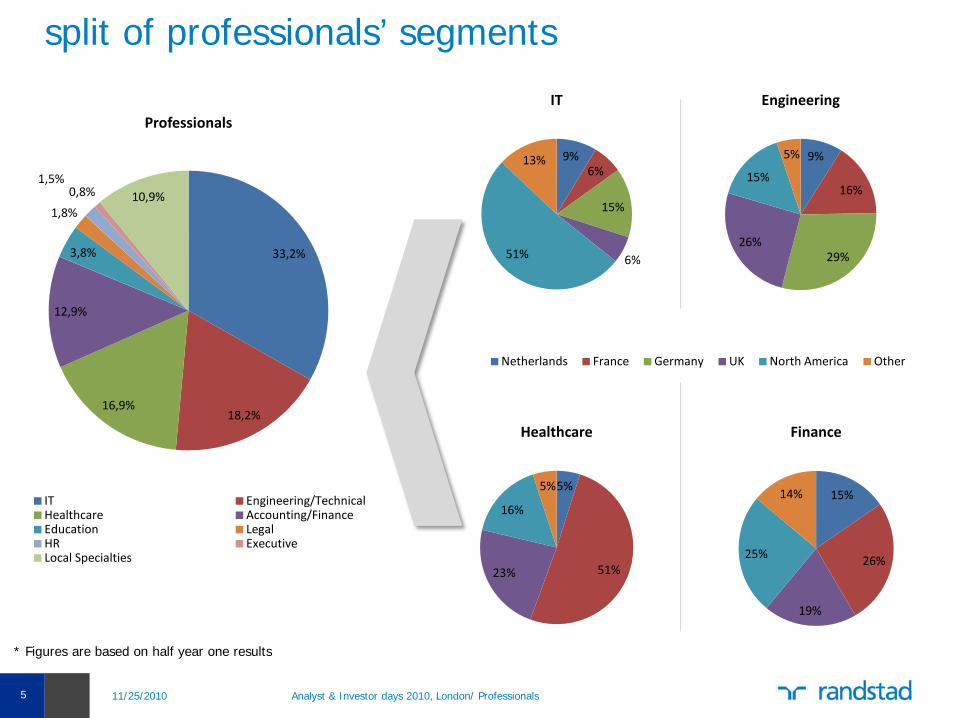
split of professionals’ segments
33,2%
18,2%16,9%
12,9%
3,8%
1,8%
1,5%0,8% 10,9%
Professionals
IT Engineering/TechnicalHealthcare Accounting/FinanceEducation LegalHR ExecutiveLocal Specialties
9%6%
15%
6%51%
13%
IT
9%
16%
29%26%
15%
5%
Engineering
5%
51%23%
16%
5%
Healthcare
15%
26%
19%
25%
14%
Finance
Netherlands France Germany UK North America Other
* Figures are based on half year one results
Analyst & Investor days 2010, London/ Professionals 11/25/20105
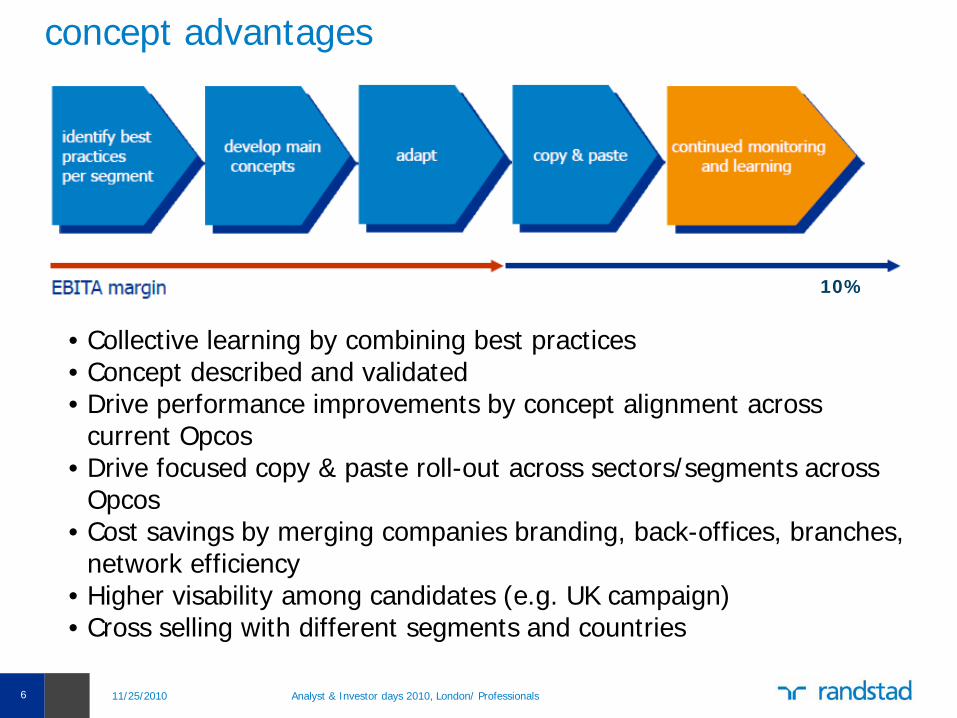
concept advantages
• Collective learning by combining best practices • Concept described and validated • Drive performance improvements by concept alignment across
current Opcos• Drive focused copy & paste roll-out across sectors/segments across
Opcos • Cost savings by merging companies branding, back-offices, branches,
network efficiency• Higher visability among candidates (e.g. UK campaign)• Cross selling with different segments and countries
11/25/2010 Analyst & Investor days 2010, London/ Professionals 6
10%

11/25/2010 Analyst & Investor days 2010, London/ Professionals 7
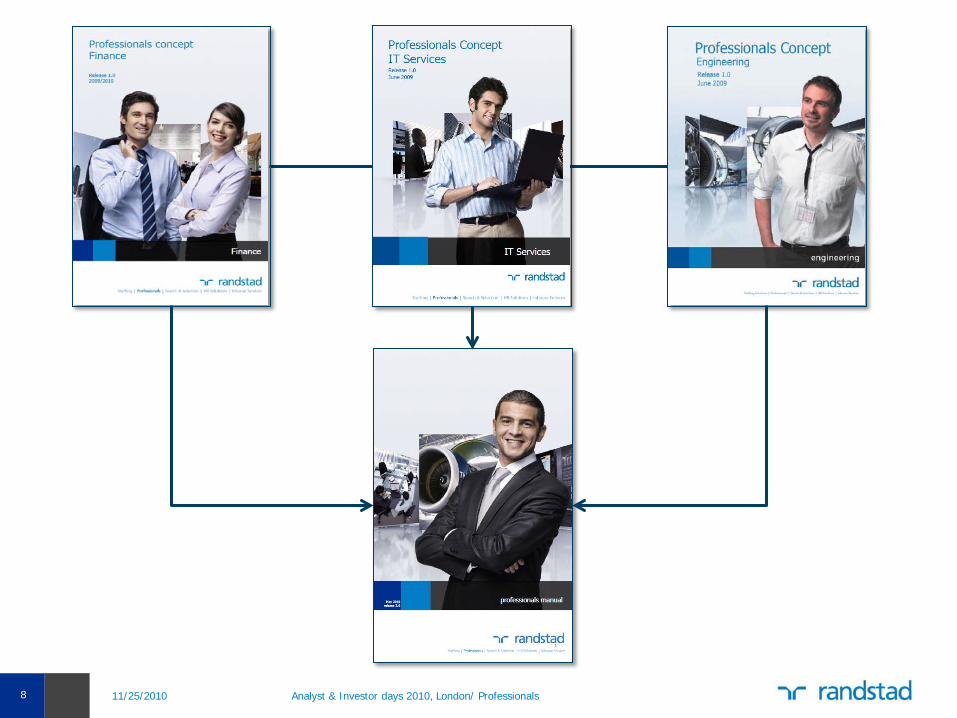
Professionals conceptbuild on best practices (e.g. Finance)
Business model A> Market & Process > ....
Business model B> Market & Process> ....
Business model C> Market & Process> ....
Business model D> Market & Process > ....
Business model E> Market & Process > ....
Business model F> Market & Process> ....
BEST PRACTICE
11/25/2010 Analyst & Investor days 2010, London/ Professionals 8
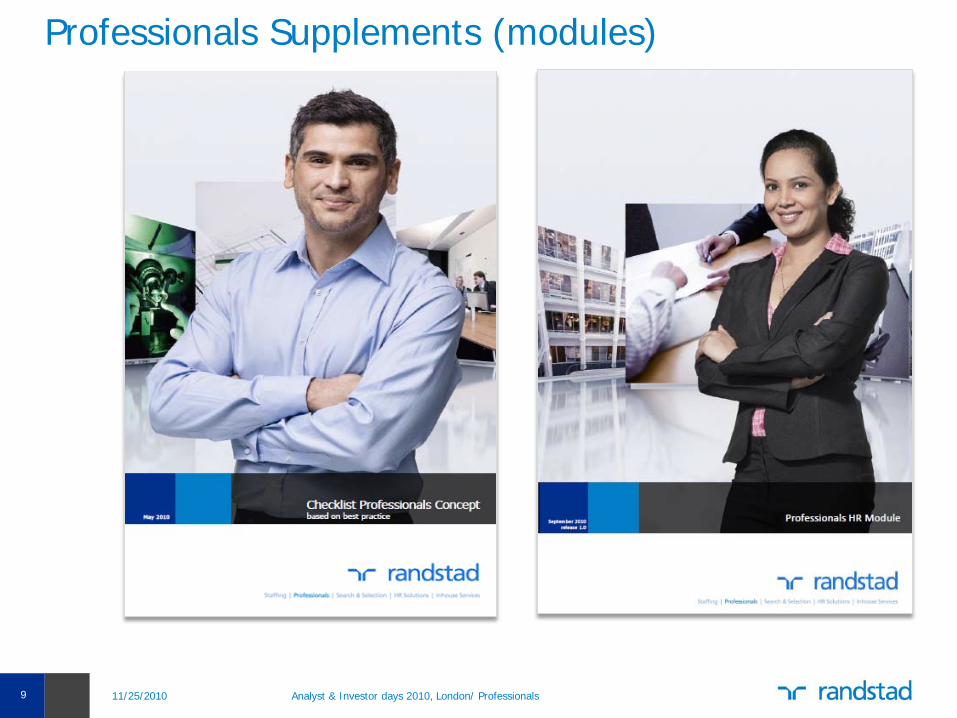
Professionals Supplements (modules)
11/25/2010 Analyst & Investor days 2010, London/ Professionals 9
11/25/2010 Analyst & Investor days 2010, London/ Professionals 10
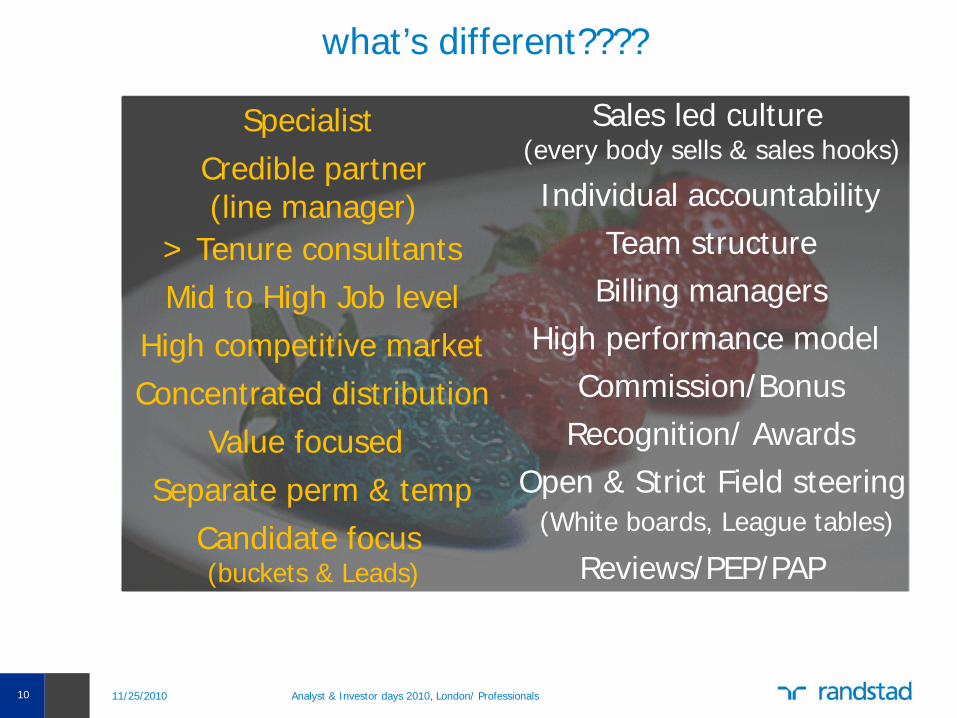
what’s different????
Specialist Credible partner (line manager)
> Tenure consultants
Value focused
Mid to High Job level
Individual accountability
Sales led culture (every body sells & sales hooks)
Commission/BonusRecognition/ Awards
Team structureBilling managers
Candidate focus (buckets & Leads)
Separate perm & temp Open & Strict Field steering(White boards, League tables)
High performance model High competitive marketConcentrated distribution
Reviews/PEP/PAP
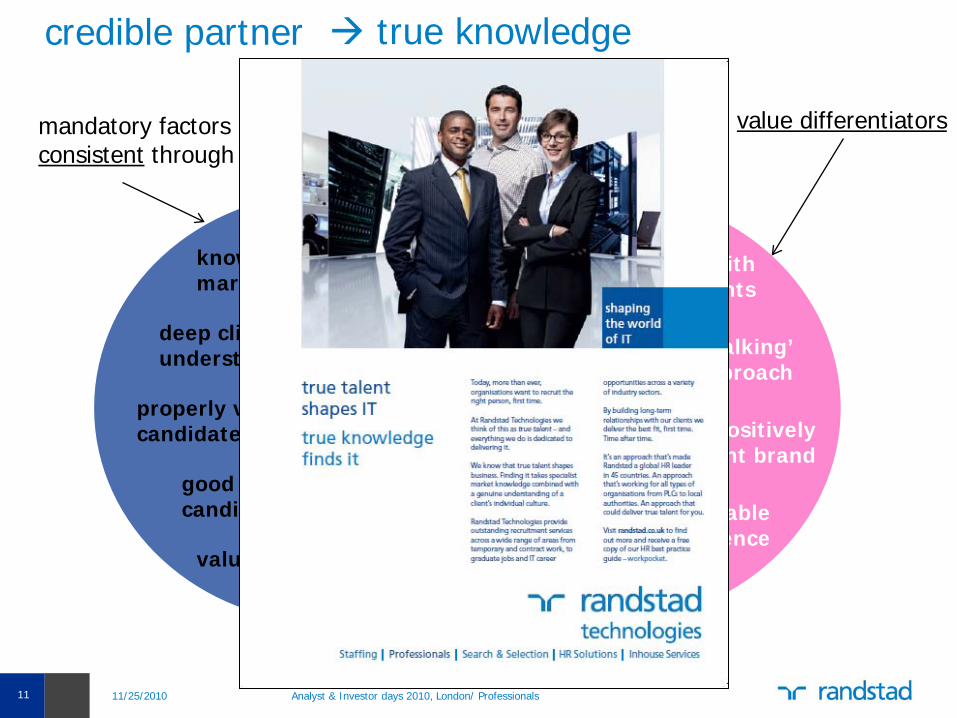
credible partner
good quality candidates
properly vetted candidates
knowledge of our market
value for money
credibility with line manager
relationship with individual consultants
‘straight talking’ approach
ability to positively ‘represent’ client brand
provision of valuable market intelligence
deep client understanding
value differentiatorsmandatory factors but not consistent through opcos
desirable
11 Analyst & Investor days 2010, London/ Professionals 11/25/2010
true knowledge
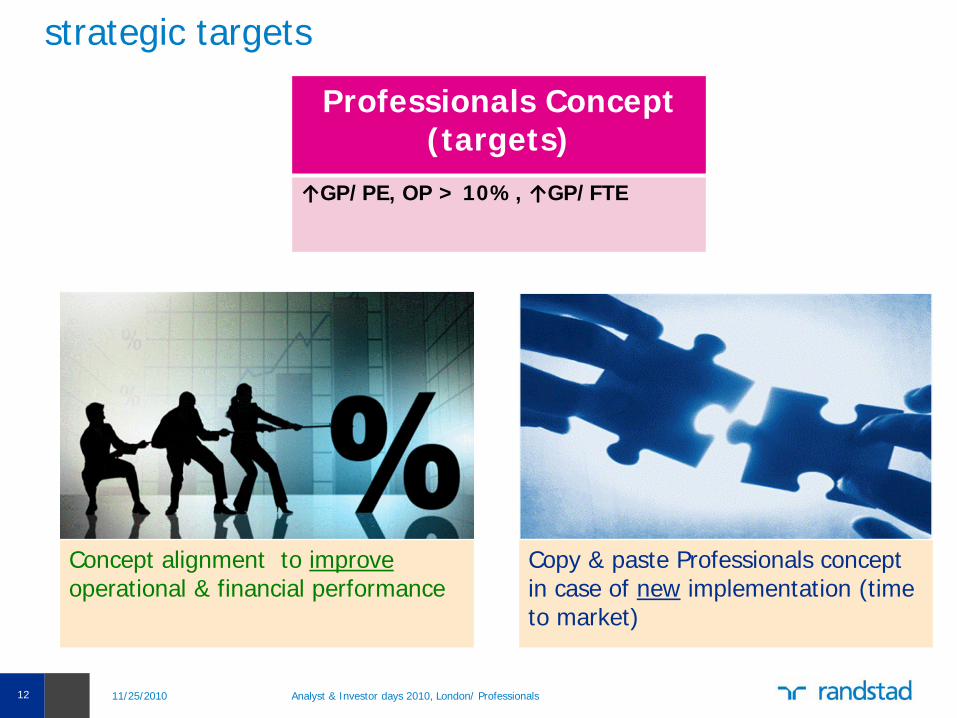
strategic targets
11/25/2010 Analyst & Investor days 2010, London/ Professionals 12
Professionals Concept (targets)
↑GP/PE, OP > 10%, ↑GP/FTE
Copy & paste Professionals concept in case of new implementation (time to market)
Concept alignment to improveoperational & financial performance
11/25/2010 Analyst & Investor days 2010, London/ Professionals 13
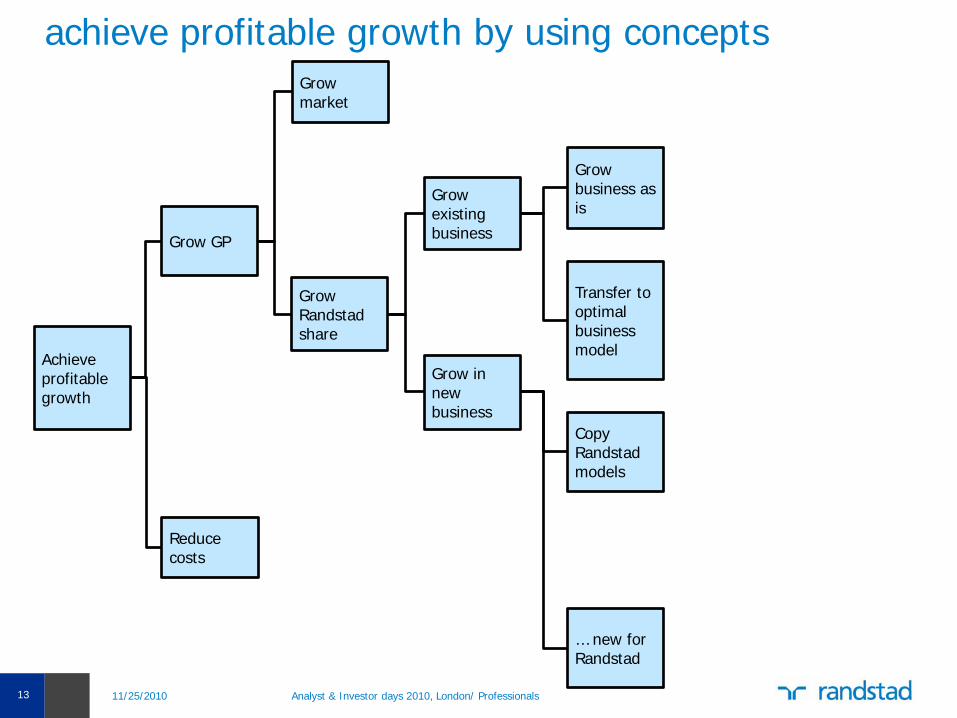
achieve profitable growth by using concepts
Achieveprofitablegrowth
Grow GP
Reducecosts
Growexistingbusiness
Grow in newbusiness
Growmarket
GrowRandstad share
CopyRandstad models
… new forRandstad
Growbusiness as is
Transfer to optimalbusiness model
11/25/2010 Analyst & Investor days 2010, London/ Professionals 14
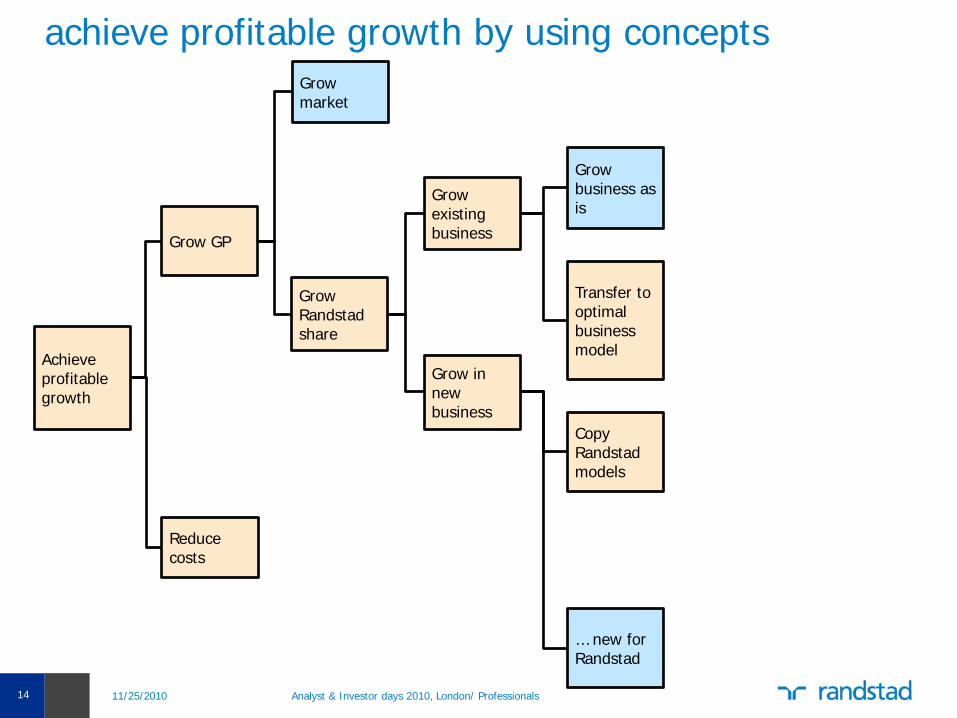
achieve profitable growth by using concepts
Achieveprofitablegrowth
Grow GP
Reducecosts
Growexistingbusiness
Grow in newbusiness
Growmarket
GrowRandstad share
CopyRandstad models
… new forRandstad
Growbusiness as is
Transfer to optimalbusiness model
11/25/2010 Analyst & Investor days 2010, London/ Professionals 15
> Control the professional recruitment engine> KPI and process driven approach
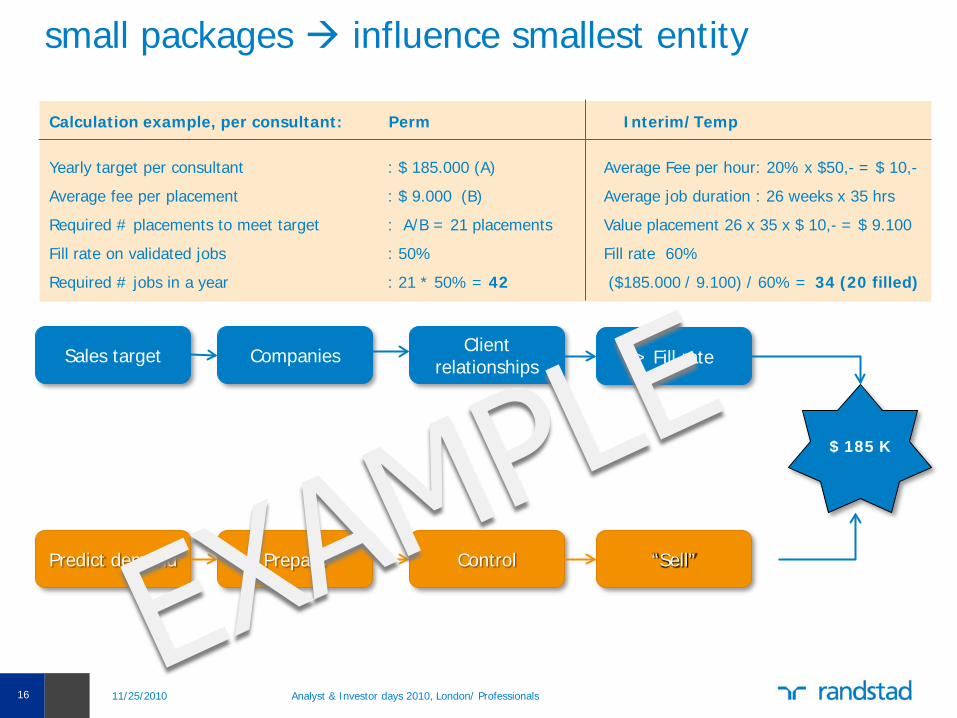
small packages influence smallest entity
16
Sales target Companies Client relationships > Fill rate
Predict demand Prepare Control “Sell”
$ 185 K
Analyst & Investor days 2010, London/ Professionals
Calculation example, per consultant: Perm Interim/Temp
Yearly target per consultant : $ 185.000 (A) Average Fee per hour: 20% x $50,- = $ 10,-
Average fee per placement : $ 9.000 (B) Average job duration : 26 weeks x 35 hrs
Required # placements to meet target : A/B = 21 placements Value placement 26 x 35 x $ 10,- = $ 9.100
Fill rate on validated jobs : 50% Fill rate 60%
Required # jobs in a year : 21 * 50% = 42 ($185.000 / 9.100) / 60% = 34 (20 filled)
11/25/2010
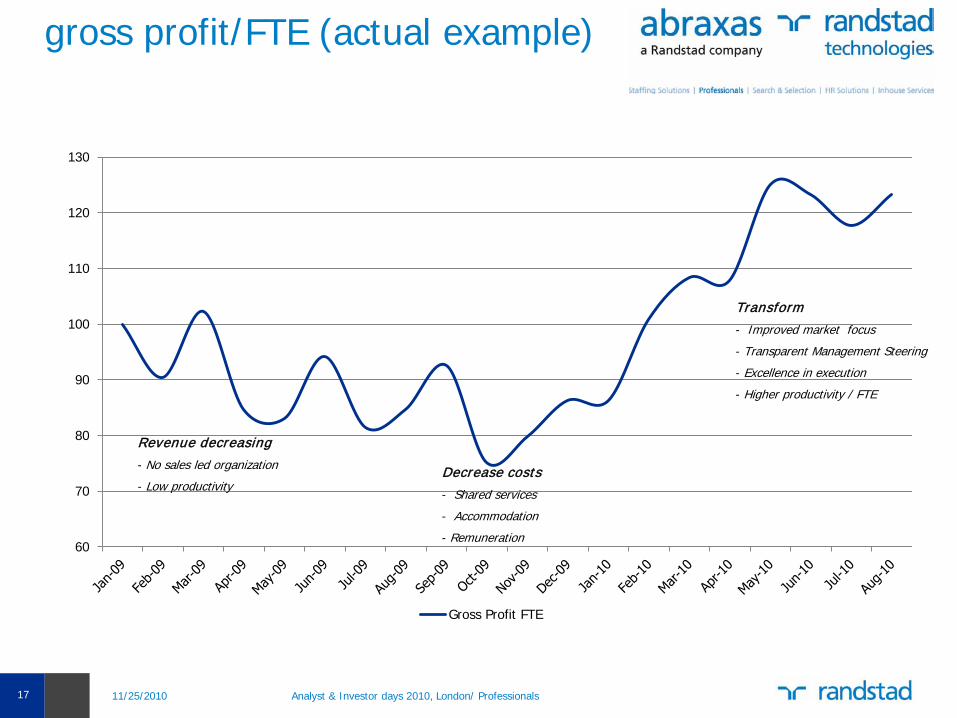
gross profit/FTE (actual example)
17
60
70
80
90
100
110
120
130
Gross Profit FTE
11/25/2010 Analyst & Investor days 2010, London/ Professionals
Decrease costs
- Shared services
- Accommodation
- Remuneration
Revenue decreasing
- No sales led organization
- Low productivity
Transform
- Improved market focus
- Transparent Management Steering
- Excellence in execution
- Higher productivity / FTE
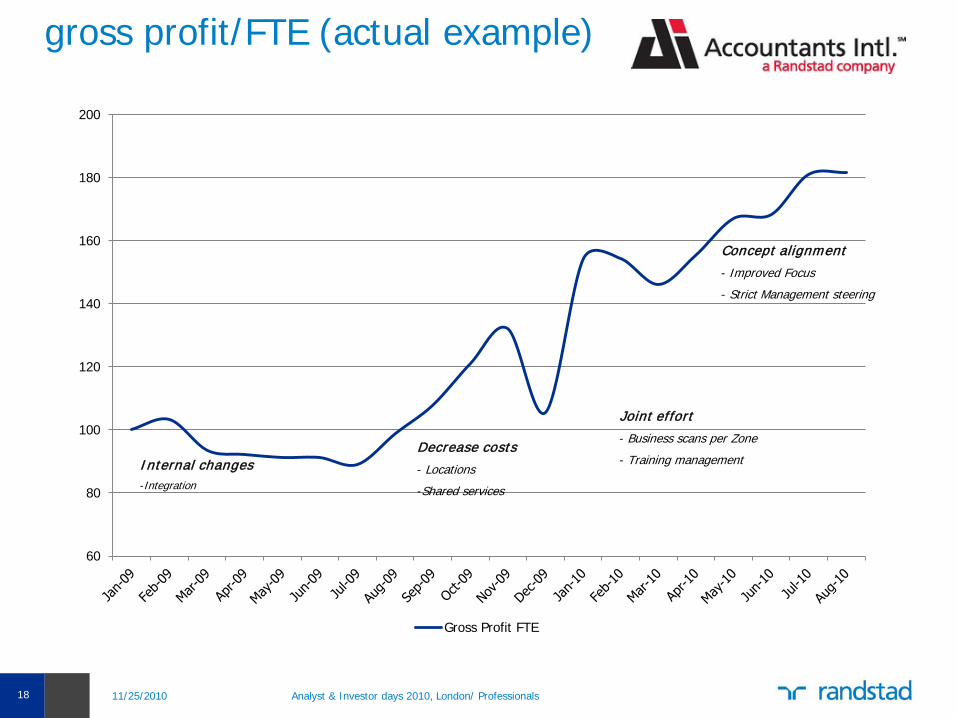
gross profit/FTE (actual example)
18
60
80
100
120
140
160
180
200
Gross Profit FTE
11/25/2010 Analyst & Investor days 2010, London/ Professionals
Internal changes-Integration
Decrease costs
- Locations
-Shared services
Joint effort
- Business scans per Zone
- Training management
Concept alignment
- Improved Focus
- Strict Management steering
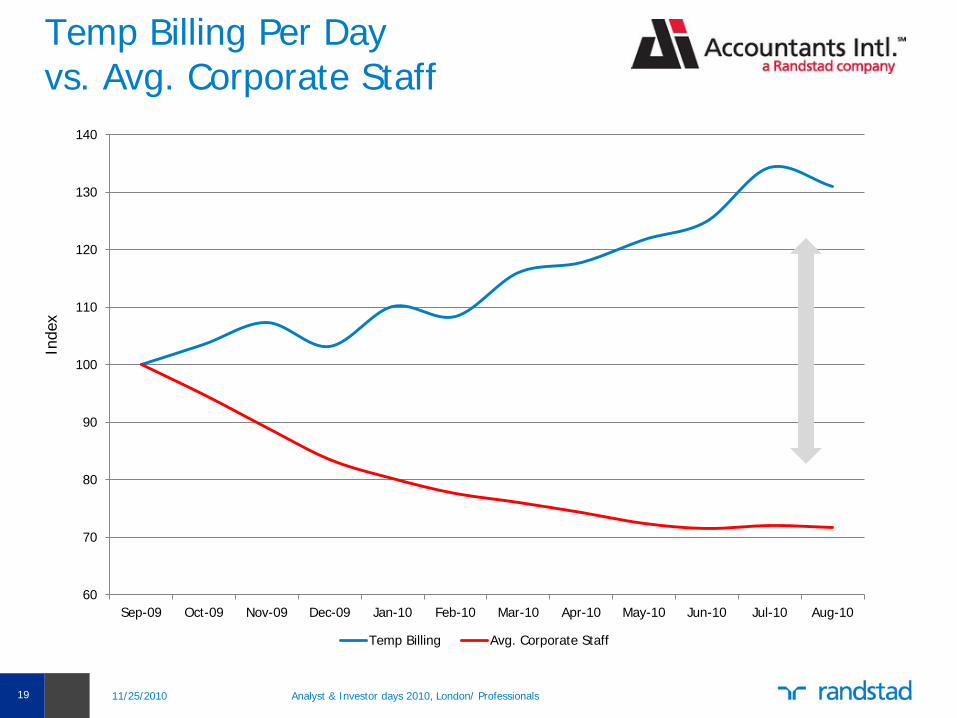
Temp Billing Per Day vs. Avg. Corporate Staff
60
70
80
90
100
110
120
130
140
Sep-09 Oct-09 Nov-09 Dec-09 Jan-10 Feb-10 Mar-10 Apr-10 May-10 Jun-10 Jul-10 Aug-10
Temp Billing Avg. Corporate Staff
Inde
x
11/25/201019 Analyst & Investor days 2010, London/ Professionals
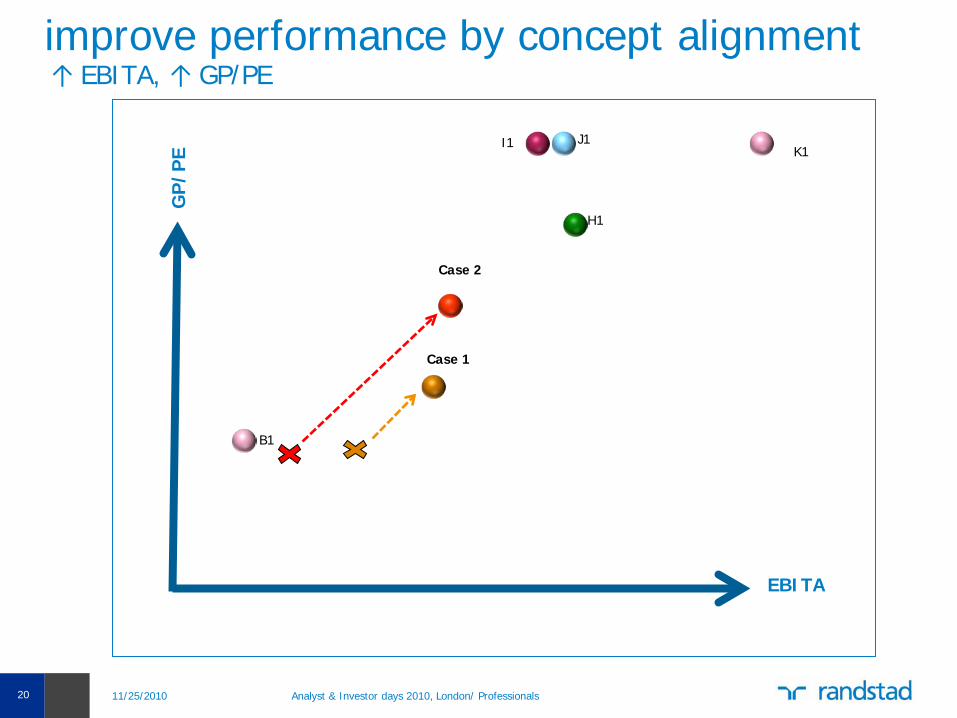
improve performance by concept alignment↑ EBITA, ↑ GP/PE
11/25/2010 Analyst & Investor days 2010, London/ Professionals 20
Case 1
Case 2
J1I1
H1
B1
K1
GP
/PE
EBITA
21
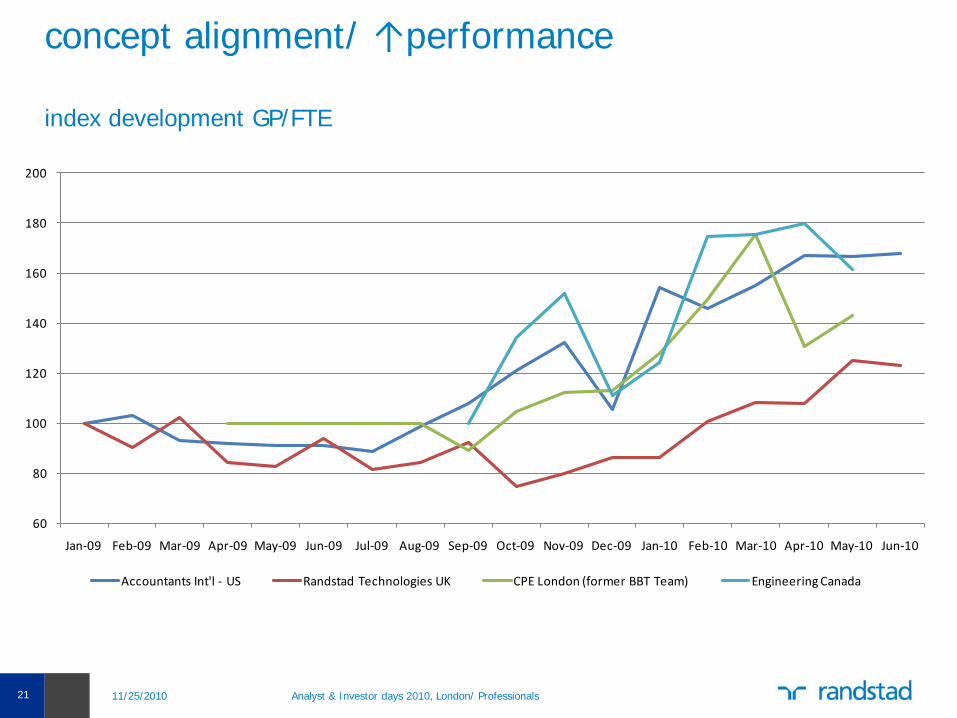
concept alignment/ ↑performance
index development GP/FTE
60
80
100
120
140
160
180
200
Jan-09 Feb-09 Mar-09 Apr-09 May-09 Jun-09 Jul-09 Aug-09 Sep-09 Oct-09 Nov-09 Dec-09 Jan-10 Feb-10 Mar-10 Apr-10 May-10 Jun-10
Accountants Int'l - US Randstad Technologies UK CPE London (former BBT Team) Engineering Canada
Analyst & Investor days 2010, London/ Professionals 11/25/2010
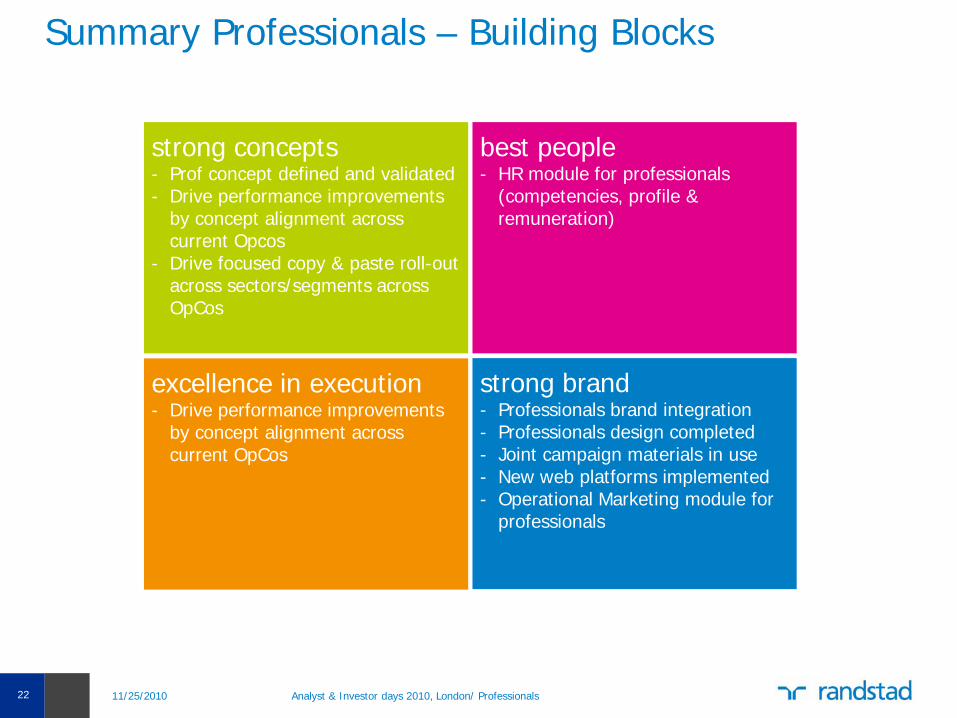
Summary Professionals – Building Blocks
11/25/2010 Analyst & Investor days 2010, London/ Professionals 22
strong concepts - Prof concept defined and validated- Drive performance improvements
by concept alignment across current Opcos
- Drive focused copy & paste roll-out across sectors/segments across OpCos
best people - HR module for professionals
(competencies, profile & remuneration)
excellence in execution - Drive performance improvements
by concept alignment across current OpCos
strong brand - Professionals brand integration - Professionals design completed- Joint campaign materials in use- New web platforms implemented- Operational Marketing module for
professionals
Recommended


![CR-1 : @TAWAS B LIB.TAWAS B(SCH 1):PAGE1 TAWASnotebookschematic.org/data/NOTEBOOK/attachments/SC... · resume gp[6] gp[7] gp[8] gp[9] 3.3v 3.3v 3.3v 3.3v gp[23] gp[24] gp[25] gp[26]](https://img.pdfslide.us/doc/110x75/5f812ff679030c23f20de0bd/cr-1-tawas-b-libtawas-bsch-1page1-ta-resume-gp6-gp7-gp8-gp9-33v.jpg)