NAMIBIA
Department of Water Affairs DWA
Windhoek
FEDERAL REPUBLIC OF GERMANY Federal Institute for Geosciences
and Natural Resources BGR
Hannover
TECHNICAL COOPERATION
PROJECT NO.: 2001.2475.0
Investigation of Groundwater Resources and Airborne-Geophysical Investigation of Selected
Mineral Targets in Namibia
Volume IV.GW.3.1
Groundwater Investigations in the Eiseb Graben
Main Hydrogeological Report
Windhoek
December 2004

Technical Cooperation Project Investigation of Groundwater Resources and Airborne-Geophysical Investigation of Selected Mineral Targets in Namibia Groundwater Investigations in the Eiseb Graben Main Hydrogeological Report
Page I
Volume IV.GW.3.1
Groundwater Investigations in the Eiseb Graben
Main Hydrogeological Report Authors: Dr. Armin Margane (BGR), Dr. Jens Wrabel (DWA), Dr. Frieder
Schildknecht (BGR), Annelise Wierenga (AGES); with contributions from Balt Verhagen (Schonland Research Institute for Nuclear Sciences of the University of the Witwatersrand, South Africa)
Commissioned by: Federal Ministry for Economic Cooperation and Development (Bundesministerium für wirtschaftliche Zusammenarbeit und Entwicklung, BMZ)
Project: Investigation of Groundwater Resources and Airborne-Geophysical Investigation of Selected Mineral Targets in Namibia
BMZ-No.: 2001.2475.0 BGR-Archive No.: Date of issuance: December 2004 No. of pages: 72

Technical Cooperation Project Investigation of Groundwater Resources and Airborne-Geophysical Investigation of Selected Mineral Targets in Namibia Groundwater Investigations in the Eiseb Graben Main Hydrogeological Report
Page II
Table of Contents FOREWORD .......................................................................................................................................... 1 1 SUMMARY ......................................................................................................................................... 2 2 INTRODUCTION............................................................................................................................... 2 3 GENERAL CONDITIONS................................................................................................................. 8
3.1 CLIMATIC CONDITIONS................................................................................................................... 8 3.2 SOCIO-ECONOMIC CONDITIONS .................................................................................................. 13 3.3 HYDROLOGY................................................................................................................................. 15 3.4 GEOLOGICAL SETUP .................................................................................................................... 15 3.5 STRUCTURAL SETUP ................................................................................................................... 24 3.6 PREVIOUS INVESTIGATIONS......................................................................................................... 26 3.7 SUMMARY OF DRILLING RESULTS ............................................................................................... 27
4 GROUNDWATER RESOURCES................................................................................................... 29 4.1 DESCRIPTION OF AQUIFER SYSTEM ............................................................................................ 29
4.1.1 Information from Water and Exploration Wells (Hydrogeological Database) ................... 29 4.1.2 Information from Geophysical Surveys .................................................................................. 31 4.1.3 Lateral and Vertical Extent of the Eiseb Graben Aquifer System ...................................... 34
4.2 GROUNDWATER FLOW PATTERN ................................................................................................ 35 4.3 HYDRAULIC PARAMETERS ........................................................................................................... 38 4.4 HYDROCHEMICAL CHARACTERISTICS ......................................................................................... 41
4.4.1 Groundwater Quality ................................................................................................................. 41 4.4.2 Isotopic Composition................................................................................................................. 53
4.5 GROUNDWATER MONITORING ..................................................................................................... 59 4.6 GROUNDWATER EXPLOITATION POTENTIAL................................................................................ 59
5 WATER DEMAND .......................................................................................................................... 60 6 RECOMMENDATIONS AND CONCLUSIONS.............................................................................. 62 7 REFERENCES................................................................................................................................ 65 ANNEX 1: BOREHOLE DATA ............................................................................................................. 67 ANNEX 2: HYDROCHEMICAL DATA.................................................................................................. 69

Technical Cooperation Project Investigation of Groundwater Resources and Airborne-Geophysical Investigation of Selected Mineral Targets in Namibia Groundwater Investigations in the Eiseb Graben Main Hydrogeological Report
Page III
List of Figures Figure 1: General Topography in the Eiseb Graben Region....................................... 4 Figure 2: General Topography in the Eiseb Graben Region: a) based on Wireframe
Feature (SURFER; 10 m intervals); b) based on Contours Feature (SURFER; 5m intervals); for Legend see Figure 1; vertical exaggeration: 100 ..................... 5
Figure 3: General Topographic Conditions in the Eiseb Graben Area (modified after KLOCK, 2001; project area marked in light blue, Eiseb Graben Catchment Area marked in orange). .............................................................................................. 6
Figure 4: Landsat TM 7 Satellite Image of the Eiseb Graben Region showing Longitudinal W-E stretching Dunes (color composite of channels 7(red)-4(green)-1(blue); project area marked in blue) .................................................... 7
Figure 5: Spatial Distribution of Precipitation in Namibia (adopted from NEW et al., 1999; blue line: Investigation Area) .................................................................... 8
Figure 6: Location of Rainfall Stations in the Eiseb Region (name – time period – average rainfall)................................................................................................. 10
Figure 7: Annual Rainfall at Epukiro ......................................................................... 11 Figure 8: Average Monthly Rainfall at Epukiro.......................................................... 11 Figure 9: Annual Potential Evaporation at Ghanzi/Botswana ................................... 12 Figure 10: Monthly Potential Evaporation at Ghanzi/Botswana................................ 12 Figure 11: Spatial Distribution of Potential Evaporation in Namibia (adopted from
DWA, unpublished data).................................................................................... 13 Figure 12: Projection of Rural Population in the Omaheke Region (adopted from
AFRICON, 2002) ............................................................................................... 14 Figure 13: Map showing the Regional Geological Setup (based on 1:1,000,000
Geological Map of Namibia) .............................................................................. 17 Figure 14: Thickness of Omingonde Formation (project area marked in blue) ......... 18 Figure 15: Thickness of Etjo and Rundu Formations (project area marked in blue) . 19 Figure 16: Generalized Profile of the Kalahari Group in Northeastern Namibia
(adopted from KLOCK, 2001)............................................................................ 21 Figure 17: Isopachs of Kalahari Group sediments and Proposed Graben Structures in
NE-Namibia (adopted from KLOCK, 2001; project area marked in blue) .......... 22 Figure 18: Occurrence of Karoo and Basement Rocks under Kalahari Cover in
Northwestern Botswana .................................................................................... 23 Figure 19: Tectonic Interpretation of Landsat 7 TM Satellite Image with assumed
Limit of Eiseb Graben Aquifer System and Location of Boreholes .................... 24 Figure 20: Generalized Tectonic Features in Northeastern Namibia and Northwestern
Botswana (modified after AQUALOGIC & WATER SURVEYS BOTSWANA, 2003; light blue line: DWA-BGR project area Eiseb) ......................................... 25
Figure 21: INTERCONSULT (1996) Satellite Image Interpretation (lineaments with names in green color) and Location of boreholes matched with BGR Satellite Image Interpretation (lineaments in red color; graben extent in purple color).... 26
Figure 22: Borehole Location Map of the Eiseb Graben Region............................... 30 Figure 23: Location of TEM Soundings and Resistivities Interpolated for a Depth
Interval of 150-200 m bgl (red line: assumed extent of Graben based on TEM soundings and satellite image lineament interpretation, circles: DWA-BGR boreholes) ......................................................................................................... 32

Technical Cooperation Project Investigation of Groundwater Resources and Airborne-Geophysical Investigation of Selected Mineral Targets in Namibia Groundwater Investigations in the Eiseb Graben Main Hydrogeological Report
Page IV
Figure 24: Cross Section along TEM Line 2 showing Locations of TEM Soundings and Interpolated Resistivities together with the Locations of Boreholes and the Distribution of Hydraulic Heads (blue line: assumed, blue triangles: measured)33
Figure 25: Boreholes with Lithological Logs, Lithology and Assumed Graben Extent.......................................................................................................................... 34
Figure 26: Groundwater Flow Pattern in the Eiseb Graben Region.......................... 36 Figure 27: Generalized Regional Piezometric Map of Northwestern Botswana
(adopted from AQUALOGIC & WATER SURVEYS BOTSWANA, 2003; project area marked in blue, blue arrows: direction of groundwater flow) ..................... 37
Figure 28: Recommended Yields (m³/h) of Boreholes drilled by DWA/BGR and those drilled by INTERCONSULT (1996) in the Eiseb Graben Aquifer System (values as reported by INTERCONSULT) ..................................................................... 39
Figure 29: Transmissivities (m²/d) of Boreholes drilled by DWA/BGR ...................... 40 Figure 30: Locations of Boreholes with Chemical Analyses (<10% analytical error) 41 Figure 31: Spatial Distribution of TDS Contents ....................................................... 43 Figure 32: Piper Diagram of all Hydrochemical Analyses (samples with <10%
analytical error only) .......................................................................................... 44 Figure 33: Spatial Distribution of Percentages of Selected Cations and Anions of the
Total (samples with <10% analytical error only) ................................................ 45 Figure 34: Spatial Distribution of Nitrate Contents.................................................... 47 Figure 35: Spatial Distribution of Sodium Contents .................................................. 48 Figure 36: Predominance of Sodium (meq%)........................................................... 49 Figure 37: Spatial Distribution of Sulphate Contents ................................................ 50 Figure 38: Predominance of Sulphate (meq%)......................................................... 51 Figure 39: Predominance of Hydrogen Carbonate (meq%)...................................... 52 Figure 40: Spatial Distribution of Delta Deuterium Values (‰) in the Eiseb Graben
Region ............................................................................................................... 54 Figure 41: Spatial Distribution of Delta Oxygen-18 (‰) Values in the Eiseb Graben
Region ............................................................................................................... 55 Figure 42: Spatial Distribution of Tritium Values (TU) in the Eiseb Graben Region.. 55 Figure 43: Spatial Distribution of Carbon-14 Values (pMC) in the Eiseb Graben
Region ............................................................................................................... 56 Figure 44: Spatial Distribution of Delta Carbon-13 Values (‰) in the Eiseb Graben
Region ............................................................................................................... 56 Figure 45: Correlation Carbon-14 – Delta Carbon-13............................................... 57 Figure 46: Correlation Tritium – Carbon-14 .............................................................. 57 Figure 47: Correlation Delta Deuterium – Delta Oxygen-18 ..................................... 58 Figure 48: Correlation Carbon-14 (pMC) – Delta Oxygen-18 (‰) ............................ 58 Figure 49: Water Supply Network in NE-Namibia..................................................... 61 Figure 50: Locations of New Proposed TEM-Soundings and Boreholes .................. 63 in the Eiseb Graben.................................................................................................. 63

Technical Cooperation Project Investigation of Groundwater Resources and Airborne-Geophysical Investigation of Selected Mineral Targets in Namibia Groundwater Investigations in the Eiseb Graben Main Hydrogeological Report
Page V
List of Tables Table 1: Estimated Population Numbers for the Omaheke Region (Central Bureau of
Statistics)........................................................................................................... 14 Table 2: Stratigraphy in NE-Namibia (modified after STRUCKMEIER & CHRISTELIS,
2001) ................................................................................................................. 15 Table 3: Lithostratigraphy of Northwest Ngamiland/Botswana (adopted from
AQUALOGIC & WATER SURVEYS BOTSWANA, 2003) ................................. 16 Table 4: Basic Data of Boreholes Drilled within the Framework of the Project (CDT:
constant discharge test) .................................................................................... 28 Table 5: Design of Step Tests .................................................................................. 38 Table 6: Results of Step Tests.................................................................................. 38 Table 7: Design of Constant Discharge Tests .......................................................... 39 Table 8: Results of Constant Discharge Tests.......................................................... 39 Table 9: Water Types (samples with <10% analytical error only) ............................. 46 Table 10: Results of Isotope Analyses in the Eiseb Graben Region......................... 53

Technical Cooperation Project Investigation of Groundwater Resources and Airborne-Geophysical Investigation of Selected Mineral Targets in Namibia Groundwater Investigations in the Eiseb Graben Main Hydrogeological Report
Page VI
Abbreviations asl above (mean) sea level bgl below ground level B Linear well-loss coefficient (h/m2) C Non-linear well-loss coefficient (h2/m5) CD Constant discharge D deuterium excess E Well efficiency (%) GMWL global meteoric water line K hydraulic conductivity (m/d) L Leakage factor (m) Lat Latitude Long Longitude RWL Rest water level (m below datum) P Exponent in non-linear well loss term or P Factor in Stallman’s evaluation method describing the distance to a
boundary PID Pump intake depth (m bgl) PWL Pumped water level (m below datum) Q Pumping rate (m³/h) Qn Pumping (abstraction) rate during the n-th step Qrec Recommended maximum abstraction (m³/h) S Storage coefficient s drawdown (observed) (m) sn Total (steady state) drawdown sn during the n-th step (m) smax Maximum drawdown during pumping test (m) sres Residual drawdown after recovery (m) SACS South African Committee for Stratigraphy
(Council for Geoscience of South Africa) SRTM Shuttle Radar Topography Mission T Transmissivity (m²/d) or T Temperature TD Total depth UTM Universal Transverse Mercator

Technical Cooperation Project Investigation of Groundwater Resources and Airborne-Geophysical Investigation of Selected Mineral Targets in Namibia Groundwater Investigations in the Eiseb Graben Main Hydrogeological Report
Page 1
Foreword
This report is part of a series of Technical Reports published by the Technical Cooperation Project “Investigation of Groundwater Resources and Airborne-Geophysical Investigation of Selected Mineral Targets in Namibia”, which is being implemented by the Federal Institute of Geosciences and Natural Resources (BGR), Germany, and the Department of Water Affairs (DWA), Windhoek, Namibia . This project started in October 2002 and ends with its first phase in March 2005. This report documents the hydrogeological situation in the Eiseb Graben of the Omaheke region as it is known to date. Within the framework of the project 4 exploration boreholes have been drilled with the aim to tap the Eiseb Graben Aquifer, to determine the hydraulic properties of this aquifer, and to delineate the extent of the Eiseb Graben. All basic data related to the drilling program are documented in Volume IV.GW.3.2: Groundwater Investigations in the Eiseb Graben – Documentation Compendium on the 2004 Drilling Campaign. The pumping test evaluations are documented in Volume IV.GW.3.3: Groundwater Investigations in the Eiseb Graben – Evaluation of Pumping Tests.
Technical Cooperation Project Investigation of Groundwater Resources and Airborne-Geophysical Investigation of Selected Mineral Targets in Namibia Groundwater Investigations in the Eiseb Graben Main Hydrogeological Report
Page 2
1 Summary
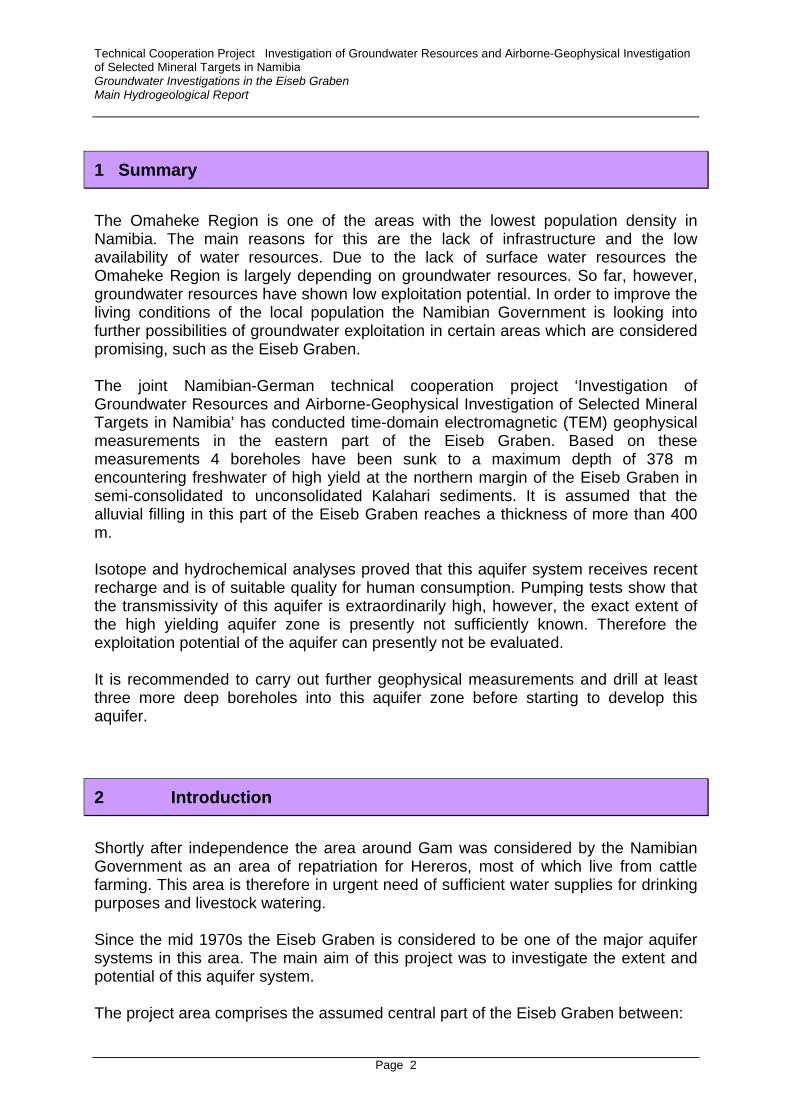
The Omaheke Region is one of the areas with the lowest population density in Namibia. The main reasons for this are the lack of infrastructure and the low availability of water resources. Due to the lack of surface water resources the Omaheke Region is largely depending on groundwater resources. So far, however, groundwater resources have shown low exploitation potential. In order to improve the living conditions of the local population the Namibian Government is looking into further possibilities of groundwater exploitation in certain areas which are considered promising, such as the Eiseb Graben. The joint Namibian-German technical cooperation project ‘Investigation of Groundwater Resources and Airborne-Geophysical Investigation of Selected Mineral Targets in Namibia’ has conducted time-domain electromagnetic (TEM) geophysical measurements in the eastern part of the Eiseb Graben. Based on these measurements 4 boreholes have been sunk to a maximum depth of 378 m encountering freshwater of high yield at the northern margin of the Eiseb Graben in semi-consolidated to unconsolidated Kalahari sediments. It is assumed that the alluvial filling in this part of the Eiseb Graben reaches a thickness of more than 400 m. Isotope and hydrochemical analyses proved that this aquifer system receives recent recharge and is of suitable quality for human consumption. Pumping tests show that the transmissivity of this aquifer is extraordinarily high, however, the exact extent of the high yielding aquifer zone is presently not sufficiently known. Therefore the exploitation potential of the aquifer can presently not be evaluated. It is recommended to carry out further geophysical measurements and drill at least three more deep boreholes into this aquifer zone before starting to develop this aquifer.
2 Introduction
Shortly after independence the area around Gam was considered by the Namibian Government as an area of repatriation for Hereros, most of which live from cattle farming. This area is therefore in urgent need of sufficient water supplies for drinking purposes and livestock watering. Since the mid 1970s the Eiseb Graben is considered to be one of the major aquifer systems in this area. The main aim of this project was to investigate the extent and potential of this aquifer system. The project area comprises the assumed central part of the Eiseb Graben between:

Technical Cooperation Project Investigation of Groundwater Resources and Airborne-Geophysical Investigation of Selected Mineral Targets in Namibia Groundwater Investigations in the Eiseb Graben Main Hydrogeological Report
Page 3
UTM-E 400,000 – 520,000 UTM-N 7,640,000 – 7,750,000
equivalent to (lower left – upper right) LAT -21.33874 – -20.34737 LONG 20.03680 – 21.19289
of UTM zone 34S. The regional topographic conditions governing the project area are shown in Figures 1 and 2. These maps were prepared based on Shuttle Radar Topography Mission (SRTM) data which were recorded in February 2000. Data represent a 90 m grid and elevation accuracy is estimated at around 4 m. Topography in the project area varies between approximately 1300 and 980 m asl. Surface water drainage is generally directed from West to East and is controlled by the Omurambas Otjozondjou, Eiseb, Rooiboklaagte, Elandslaagte and Epukiro, all of which are incised into unconsolidated Kalahari sediments. The combined catchment area of the ephemeral rivers collecting surface water runoff to the Eiseb Graben has a size of approximately 43,800 km² (Figure 3). The Eiseb and Otjozondjou Rivers flow towards the Okavango Delta in Botswana connecting at some 80 km east of the border whereas the Epukiro River flows towards Ngami Lake, located south of the Okavango Delta.

Tech
nica
l Coo
pera
tion
Pro
ject
In
vest
igat
ion
of G
roun
dwat
er R
esou
rces
and
Airb
orne
-Geo
phys
ical
Inve
stig
atio
n of
Sel
ecte
d M
iner
al T
arge
ts in
Nam
ibia
G
roun
dwat
er In
vest
igat
ions
in th
e E
iseb
Gra
ben
Mai
n H
ydro
geol
ogic
al R
epor
t
Page
4
Fi
gure
1: G
ener
al T
opog
raph
y in
the
Eis
eb G
rabe
n R
egio
n

Technical Cooperation Project Investigation of Groundwater Resources and Airborne-Geophysical Investigation of Selected Mineral Targets in Namibia Groundwater Investigations in the Eiseb Graben Main Hydrogeological Report
Page 5
a)
b)
Figure 2: General Topography in the Eiseb Graben Region: a) based on Wireframe Feature (SURFER; 10 m intervals); b) based on Contours Feature (SURFER; 5m intervals); for Legend see Figure 1; vertical exaggeration: 100

Technical Cooperation Project Investigation of Groundwater Resources and Airborne-Geophysical Investigation of Selected Mineral Targets in Namibia Groundwater Investigations in the Eiseb Graben Main Hydrogeological Report
Page 6
The topographic maps as well as the satellite image reveal the presence of longitudinal dunes stretching in a W-E direction in most of the area (Figure 4).
Figure 3: General Topographic Conditions in the Eiseb Graben Area (modified after KLOCK, 2001; project area marked in light blue, Eiseb Graben Catchment Area marked in orange).

Technical Cooperation Project Investigation of Groundwater Resources and Airborne-Geophysical Investigation of Selected Mineral Targets in Namibia Groundwater Investigations in the Eiseb Graben Main Hydrogeological Report
Page 7
Figure 4: Landsat TM 7 Satellite Image of the Eiseb Graben Region showing Longitudinal W-E stretching Dunes (color composite of channels 7(red)-4(green)-1(blue); project area marked in blue)
During the field survey of INTERCONSULT (1996) the total population of this area was recorded as around 140 in 6 settlements and the number of cattle as around 1,800.

Technical Cooperation Project Investigation of Groundwater Resources and Airborne-Geophysical Investigation of Selected Mineral Targets in Namibia Groundwater Investigations in the Eiseb Graben Main Hydrogeological Report
Page 8
3 General Conditions
3.1 Climatic Conditions
The general distribution of precipitation in Namibia is shown in Figure 5.
Figure 5: Spatial Distribution of Precipitation in Namibia (adopted from NEW et al., 1999; blue line: Investigation Area)

Technical Cooperation Project Investigation of Groundwater Resources and Airborne-Geophysical Investigation of Selected Mineral Targets in Namibia Groundwater Investigations in the Eiseb Graben Main Hydrogeological Report
Page 9
There are only few rainfall stations in the area. Rainfall is/was registered at : • Epukiro Reserve (station 0833753; approx. 175 km towards SW) between
1927 and 1989 (average 1930-1989: 341 mm/a); • Epukiro (station 0833222; approx. 175 km towards SW) between 1906 and
recent (average 1944-2000: 414 mm/a); • Tsumkwe (station 1015035; approx. 150 km towards N) between 1961 and
recent (average 1961-2002: 460 mm/a); • Frisgewagt (station 0834697; approx. 100 km towards SW) between 1983 and
1996 (average 1983-1996: 366 mm/a); • Rietfontein/Talismanis (station 0836348; approx. 110 km towards S) between
1974 and 1979 (average 1974-1979: 388 mm/a); Figure 6 shows the location of these stations. Because there is no matching time span with complete records over at least 20 years for these stations it is difficult to draw a meaningful rainfall distribution map for the area. Based on the available data annual rainfall in the project area is estimated to be in the order of 330-460 mm/a. As the graphs from Tsumkwe and Epukiro show, rainfall varies largely from year to year, from little over 100 mm (minimum: at Tsumkwe in 1964: 127 mm) to more than twice the long-term average (maximum: at Tsumkwe in 1977: 997 mm). The rainfall peak is commonly reached during the months of January and February. There is commonly no precipitation during the months of June to August. The station Epukiro shows a significant increase in its long-term trend.

Technical Cooperation Project Investigation of Groundwater Resources and Airborne-Geophysical Investigation of Selected Mineral Targets in Namibia Groundwater Investigations in the Eiseb Graben Main Hydrogeological Report
Page 10
Figure 6: Location of Rainfall Stations in the Eiseb Region (name – time period – average rainfall) (remark: the average of 173 mm at Epukiro Reserve seems unrealistically low since the average at Epukiro for the same time period is around twice as high)

Technical Cooperation Project Investigation of Groundwater Resources and Airborne-Geophysical Investigation of Selected Mineral Targets in Namibia Groundwater Investigations in the Eiseb Graben Main Hydrogeological Report
Page 11
Annual Rainfall at Station 0833222 Epukiro
(1944-2000)
155.4
894.7
0
100
200
300
400
500
600
700
800
900
1000
1944
1946
1948
1950
1952
1954
1956
1958
1960
1962
1964
1966
1968
1970
1972
1974
1976
1978
1980
1982
1984
1986
1988
1990
1992
1994
1996
1998
2000
time
rain
fall
(mm
/a)
annual rainfall linear trend
Figure 7: Annual Rainfall at Epukiro
Average Monthly Rainfall
Station 19275 Epukiro(1944-2000)
93.990.4
64.0
34.8
6.8
1.4 0.2 0.6
6.8
16.3
41.1
59.3
0.0
10.0
20.0
30.0
40.0
50.0
60.0
70.0
80.0
90.0
100.0
JAN FEB MARCH APRIL MAY JUNE JULY AUG SEPT OCT NOV DEC
Figure 8: Average Monthly Rainfall at Epukiro
Some limited evaporation measurements are available from Ghanzi/Botswana, located some 100 km to the SSE of the project area. They indicate a relatively

Technical Cooperation Project Investigation of Groundwater Resources and Airborne-Geophysical Investigation of Selected Mineral Targets in Namibia Groundwater Investigations in the Eiseb Graben Main Hydrogeological Report
Page 12
constant potential evaporation of around 3,000 mm/a (Figure 9), ranging between 180 mm/month in June and 320 mm/month in October (Figure 10).
Annual Potential Evaporation at Station 0838E252 Ghanzi BotswanaWater Years 1950/51 - 1984/85
(Class A Pan)
0
500
1000
1500
2000
2500
3000
3500
4000
1950
/51
1951
/52
1952
/53
1953
/54
1954
/55
1955
/56
1956
/57
1957
/58
1958
/59
1959
/60
1960
/61
1961
/62
1962
/63
1963
/64
1964
/65
1965
/66
1966
/67
1967
/68
1968
/69
1969
/70
1970
/71
1971
/72
1972
/73
1973
/74
1974
/75
1975
/76
1976
/77
1977
/78
1978
/79
1979
/80
1980
/81
1981
/82
1982
/83
1983
/84
1984
/85
time
evap
orat
ion
(mm
/a)
3008.1long-term average: mm/a
Figure 9: Annual Potential Evaporation at Ghanzi/Botswana
Potential Evaporation at Station 0838E252 Ghanzi/Botswana
Monthly Average of Water Years 1950/51 - 1984/85(Class A Pan)
320 314305
295
248 244
210198
180189
230
275
0
50
100
150
200
250
300
350
OCT NOV DEC JAN FEB MAR APR MAY JUN JUL AUG SEP
time
evap
orat
ion
(mm
)
Figure 10: Monthly Potential Evaporation at Ghanzi/Botswana

Technical Cooperation Project Investigation of Groundwater Resources and Airborne-Geophysical Investigation of Selected Mineral Targets in Namibia Groundwater Investigations in the Eiseb Graben Main Hydrogeological Report
Page 13
Based on global data from Namibia (Figure 11) potential evaporation would be in the range of 2800 to 3200 mm/a.
Figure 11: Spatial Distribution of Potential Evaporation in Namibia (adopted from DWA, unpublished data)
3.2 Socio-Economic Conditions
A ‘Rural Water Supply Development Plan for the Omaheke Region’ was prepared in 2002 by AFRICON. For the establishment of this plan a socio-economic survey and water demand analysis and projection was carried out (compare chapter 5). The main findings of this study were:
• Population density is 0.8 capita per km²; • The total population in 2001 in the entire Omaheke Region was 71,800 and is
expected to increase to 106,400 until 2021;
Technical Cooperation Project Investigation of Groundwater Resources and Airborne-Geophysical Investigation of Selected Mineral Targets in Namibia Groundwater Investigations in the Eiseb Graben Main Hydrogeological Report
Page 14
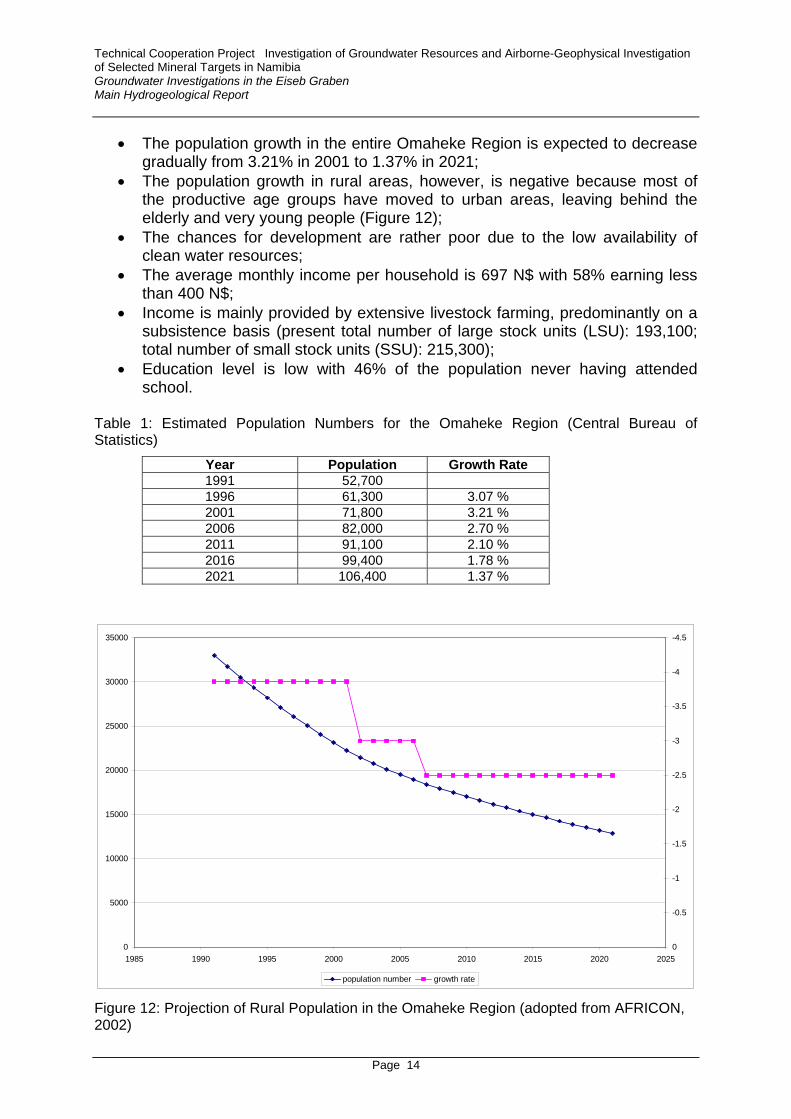
• The population growth in the entire Omaheke Region is expected to decrease gradually from 3.21% in 2001 to 1.37% in 2021;
• The population growth in rural areas, however, is negative because most of the productive age groups have moved to urban areas, leaving behind the elderly and very young people (Figure 12);
• The chances for development are rather poor due to the low availability of clean water resources;
• The average monthly income per household is 697 N$ with 58% earning less than 400 N$;
• Income is mainly provided by extensive livestock farming, predominantly on a subsistence basis (present total number of large stock units (LSU): 193,100; total number of small stock units (SSU): 215,300);
• Education level is low with 46% of the population never having attended school.
Table 1: Estimated Population Numbers for the Omaheke Region (Central Bureau of Statistics)
Year Population Growth Rate 1991 52,700 1996 61,300 3.07 % 2001 71,800 3.21 % 2006 82,000 2.70 % 2011 91,100 2.10 % 2016 99,400 1.78 % 2021 106,400 1.37 %
0
5000
10000
15000
20000
25000
30000
35000
1985 1990 1995 2000 2005 2010 2015 2020 2025
-4.5
-4
-3.5
-3
-2.5
-2
-1.5
-1
-0.5
0
population number growth rate Figure 12: Projection of Rural Population in the Omaheke Region (adopted from AFRICON, 2002)

Technical Cooperation Project Investigation of Groundwater Resources and Airborne-Geophysical Investigation of Selected Mineral Targets in Namibia Groundwater Investigations in the Eiseb Graben Main Hydrogeological Report
Page 15
3.3 Hydrology
The surface water courses in the project area are part of the Okavango Delta surface water catchment area. There are four main ephemeral water courses in the area, the
• Omuramba Otjozondjou, • Omuramba Eiseb, • Omuramba Rooibooklagte and • Omuramba Epukiro.
There are no streamflow monitoring gauges in the area and therefore there is no information available on the surface water runoff in these water courses.
3.4 Geological Setup
The geological setup in the project area is not very well known since most of the area is covered by Kalahari sediments and only few deeper penetrating wells exist. Based on the succession further to the West, the lithostratigraphic succession in the project area is expected to be as follows: Table 2: Stratigraphy in NE-Namibia (modified after STRUCKMEIER & CHRISTELIS, 2001)
Group Formation Age Age (Ma) Kalahari Recent –
Tertiary/? Upper Cretaceous
0-65 (135)
Disconformity (65-130 Ma) Karoo Rundu Fm./Kalkrand Fm. (Basalt)
Etjo Fm. (Sst) Omingonde Fm.
Jurassic - Permian
135-300
Erosion (300-500 Ma) Damara Mulden Group
Otavi Group Nosib Group
Namibian – Early Cambrian
500-1000
Pre-Damara Gamsberg Suite Abbabis Complex Grootfontein Complex Hohenwarte Complex
Cambrian - Precambian

Technical Cooperation Project Investigation of Groundwater Resources and Airborne-Geophysical Investigation of Selected Mineral Targets in Namibia Groundwater Investigations in the Eiseb Graben Main Hydrogeological Report
Page 16
Table 3: Lithostratigraphy of Northwest Ngamiland/Botswana (adopted from AQUALOGIC & WATER SURVEYS BOTSWANA, 2003)

Tech
nica
l Coo
pera
tion
Pro
ject
In
vest
igat
ion
of G
roun
dwat
er R
esou
rces
and
Airb
orne
-Geo
phys
ical
Inve
stig
atio
n of
Sel
ecte
d M
iner
al T
arge
ts in
Nam
ibia
G
roun
dwat
er In
vest
igat
ions
in th
e E
iseb
Gra
ben
Mai
n H
ydro
geol
ogic
al R
epor
t
Page
17
Fi
gure
13:
Map
sho
win
g th
e R
egio
nal G
eolo
gica
l Set
up (b
ased
on
1:1,
000,
000
Geo
logi
cal M
ap o
f Nam
ibia
)

Technical Cooperation Project Investigation of Groundwater Resources and Airborne-Geophysical Investigation of Selected Mineral Targets in Namibia Groundwater Investigations in the Eiseb Graben Main Hydrogeological Report
Page 18
Most of the project area is believed to be underlain by formations of the Damara orogenic belt which trends ENE-WSW. These formations were deposited in an intercontinental environment (MILLER, 1983) and were later deformed and metamorphosed. Pre-Damara basement is included into the thrust belt, as are granites intruded during and after the main orogenetic events. The red beds of the Lower Karoo were deposited during a period of uplifting. The Ecca Group, dominated by shales, was deposited during a marine transgression from the South. Sediments of the Beaufort Group and the Omingonde Fm. were deposited in a continental environment. The overlying Etjo Fm. documents a continental environment with dry climate. During late Karoo times the breakup of the Gondwana Continent took place evidenced by the occurrence of flood basalts (Kalkrand Fm.). KLOCK (2001) has elaborated the thicknesses of the Karoo rock units as documented in Figures 14 and 15.
Figure 14: Thickness of Omingonde Formation (project area marked in blue)

Technical Cooperation Project Investigation of Groundwater Resources and Airborne-Geophysical Investigation of Selected Mineral Targets in Namibia Groundwater Investigations in the Eiseb Graben Main Hydrogeological Report
Page 19
Figure 15: Thickness of Etjo and Rundu Formations (project area marked in blue)
At the base of the Kalahari sediments often conglomerates (e.g. carbonate cemented conglomeratic sandstones in the Tsumkwe district) and breccias (in the Eiseb Omuramba area) are found forming evidence of an extensive unconformity (KLOCK, 2001). At the Omuramba Epukiro alluvial breccias are found overlying the basement and overlain by fluvial deposits of a braided river system. These are termed Tsumkwe Fm., which at the same location is overlain by fluvial sand of the Eiseb Fm. The Tsumkwe Fm. may be equivalent to the Beiseb Fm. found in the Owambo Basin (MILLER, 1997). As part of the Eiseb Fm., KLOCK mentions the occurrence of :
• Massive limestones, laminated limestones and limestones with a silici-clastic component, especially in the Omuramba Epukiro;

Technical Cooperation Project Investigation of Groundwater Resources and Airborne-Geophysical Investigation of Selected Mineral Targets in Namibia Groundwater Investigations in the Eiseb Graben Main Hydrogeological Report
Page 20
• Pebbly sandstones and immature sandstones (white to cream colored quartz sandstones; poorly sorted, angular to sub-rounded quartz grains, mostly clear quartz; exposed in the central part of Omuramba Eiseb);
• Pipe sandstone (sandstone with a network by interconnected pipes; e.g. at the upper cliff of the Omuramba Eiseb; light-grey or cream colored; comprises immature and sometimes pebbly, dominantly silica-cemented sandstones; sand component includes fine to coarse sub-rounded quartz grains; discontinuous, massive pebble bands occur sporadically (reddish sub-angular quartz-sandstone clasts or angular chert clasts); intense silicification);
• Silcretes with internal lamination. According to the lithostratigraphy set up by SACS (1980), the Eiseb Fm. is overlain by the Omatako Fm., however, this unit does not occur within the project area but is restricted to the Omuramba Omatako, further to the North of it. KLOCK (2001) presents the following typical section as generalized Kalahari Group profile in northeastern Namibia:

Technical Cooperation Project Investigation of Groundwater Resources and Airborne-Geophysical Investigation of Selected Mineral Targets in Namibia Groundwater Investigations in the Eiseb Graben Main Hydrogeological Report
Page 21
Figure 16: Generalized Profile of the Kalahari Group in Northeastern Namibia (adopted from KLOCK, 2001)
The thickness distribution of Kalahari sediments in NE-Namibia is shown in Figure 17. However, the therein depicted thickness distribution cannot be confirmed in the

Technical Cooperation Project Investigation of Groundwater Resources and Airborne-Geophysical Investigation of Selected Mineral Targets in Namibia Groundwater Investigations in the Eiseb Graben Main Hydrogeological Report
Page 22
vicinity of the Eiseb Graben. Firstly, most boreholes in the vicinity of the graben did not reach the base of the Kalahari so that based on present data a thickness distribution map of Kalahari sediments in the project area cannot be drawn. Secondly, based on the TEM soundings conducted and boreholes drilled by the project it must be assumed that the graben structure is much more narrow than shown on Figure 17.
Figure 17: Isopachs of Kalahari Group sediments and Proposed Graben Structures in NE-Namibia (adopted from KLOCK, 2001; project area marked in blue)
According to AQUALOGIC & WATER SURVEYS BOTSWANA (2003) Karoo deposits underlie Kalahari sediments to the East of the Eiseb Graben Region in Botswana (Figure 18) and the Karoo is believed to form a major aquifer underneath the Kalahari sediment cover.

Technical Cooperation Project Investigation of Groundwater Resources and Airborne-Geophysical Investigation of Selected Mineral Targets in Namibia Groundwater Investigations in the Eiseb Graben Main Hydrogeological Report
Page 23
Figure 18: Occurrence of Karoo and Basement Rocks under Kalahari Cover in Northwestern Botswana

Technical Cooperation Project Investigation of Groundwater Resources and Airborne-Geophysical Investigation of Selected Mineral Targets in Namibia Groundwater Investigations in the Eiseb Graben Main Hydrogeological Report
Page 24
3.5 Structural Setup
A tectonic analysis of Landsat TM 7 image scenes, was carried out by BGR (SCHEAFFER, 2003). The result is depicted in Figure 19. It shows predominantly SW-NE (60°) trending lineaments intersected by a more or less perpendicular set of NW-SE (150°) trending lineaments. If considering the former as force of dilatation (σ1 = 60°), the compressional force would be σ3 = 150°. Another direction which is typically found is trending around 20° and may correspond to right lateral shear faults.
400000 410000 420000 430000 440000 450000 460000 470000 480000 490000 500000 510000 5200007640000
7650000
7660000
7670000
7680000
7690000
7700000
7710000
7720000
7730000
7740000
7750000
boreholes drilled by DWA/BGR
boreholes drilled by Interconsult
lineaments
assumed limit of Eiseb Graben aquifer system
boreholes in DWA database
boreholes retrieved during hydrocensus 2004
TEM soundings of DWA/BGR
UTM zone 34S
Eiseb Graben
Figure 19: Tectonic Interpretation of Landsat 7 TM Satellite Image with assumed Limit of Eiseb Graben Aquifer System and Location of Boreholes
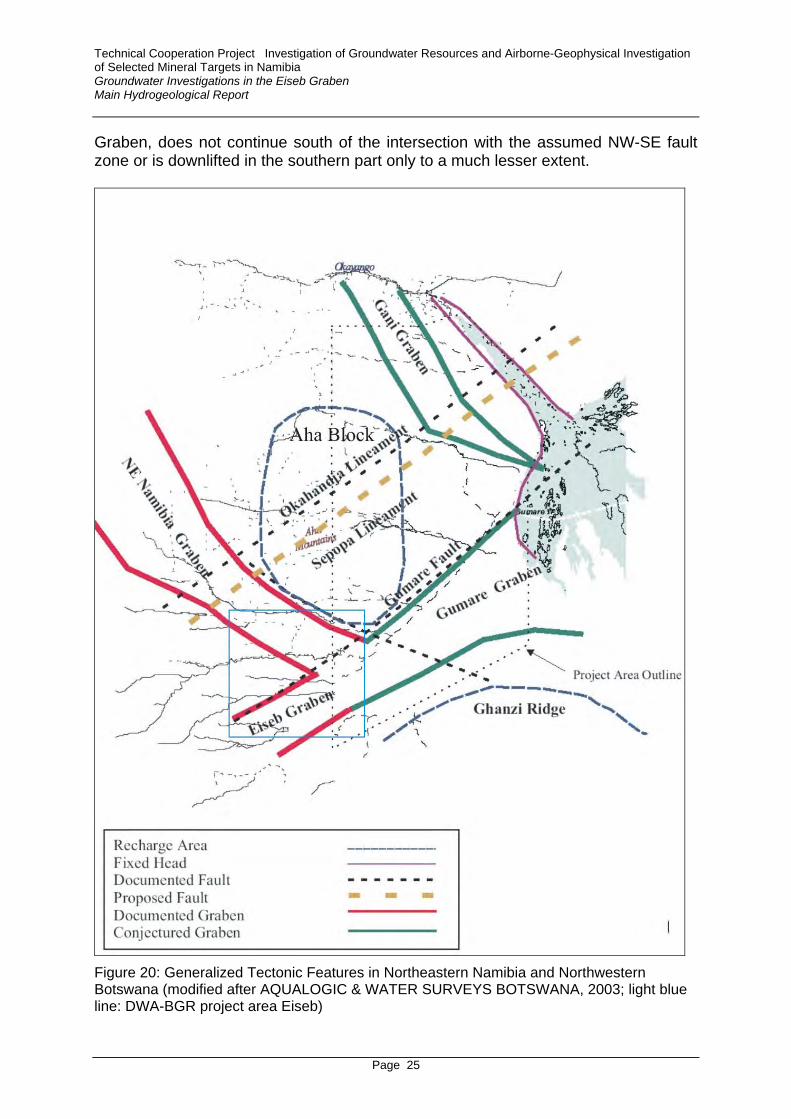
KLOCK (2001) assumes an overall tectonic setting as depicted in Figure 17. According to this hypothesis, the Eiseb Graben may be connected to a structure which extends perpendicular to the graben itself, forming the axis of the Kalahari Basin. This idea is mentioned in the report to a hydrogeological investigation conducted in northwestern Botswana (Figure 20; AQUALOGIC & WATER SURVEYS BOTSWANA, 2003). However, this so-called NE-Namibia Graben was not identified in the TEM soundings, but may coincide with a set of NW-SE trending lineaments identified by the project on satellite images in the western part of the graben (Figure 19). In respect of the hydrogeological significance of these features, it is likely, based on the results of the TEM soundings conducted within the framework of the project, that the deeply downlifted block, which was identified in the northern part of the Eiseb
Technical Cooperation Project Investigation of Groundwater Resources and Airborne-Geophysical Investigation of Selected Mineral Targets in Namibia Groundwater Investigations in the Eiseb Graben Main Hydrogeological Report
Page 25
Graben, does not continue south of the intersection with the assumed NW-SE fault zone or is downlifted in the southern part only to a much lesser extent.
Figure 20: Generalized Tectonic Features in Northeastern Namibia and Northwestern Botswana (modified after AQUALOGIC & WATER SURVEYS BOTSWANA, 2003; light blue line: DWA-BGR project area Eiseb)

Technical Cooperation Project Investigation of Groundwater Resources and Airborne-Geophysical Investigation of Selected Mineral Targets in Namibia Groundwater Investigations in the Eiseb Graben Main Hydrogeological Report
Page 26
3.6 Previous Investigations
Few groundwater investigations have been conducted in this remote area until present. Investigations by SCHOLZ (1976) had suggested that a graben-like structure exists between two main faults, both trending in a NE-SW direction. These faults were believed to be connected to those in the Okavango Delta. In the late 1970s and early 1980s vertical electrical soundings (VES) for the siting of 6 boreholes along the Omuramba Eiseb were carried out by CSIR. Between the late 1980s and the early 1990s gravity and EM surveys were conducted by CSIR and consultants in the Epukiro and Omuramba Elandslaagte area for the siting of 9 boreholes.
Figure 21: INTERCONSULT (1996) Satellite Image Interpretation (lineaments with names in green color) and Location of boreholes matched with BGR Satellite Image Interpretation (lineaments in red color; graben extent in purple color)

Technical Cooperation Project Investigation of Groundwater Resources and Airborne-Geophysical Investigation of Selected Mineral Targets in Namibia Groundwater Investigations in the Eiseb Graben Main Hydrogeological Report
Page 27
The most significant investigation was undertaken by INTERCONSULT (1996). Within this project 10 boreholes were drilled in the lower Eiseb Graben. The aim of this drilling program was to provide water for the resettlement of some 4000 Herero and Mbandero exiles from Botswana to the Gam area and south of it. Some 20 VES were performed during the investigation. Pumping tests (probably blow tests) and hydrochemical analyses for those boreholes were undertaken, however, no evaluation of the pumping tests was carried out. The INTERCONSULT boreholes were mainly sited along SW-NE trending assumed faults (compare Figure 21), the so-called Eiseb Lineament – Gomare Fault and the Police Camp Fault, situated some 10 km to the South of the former. Yields of the boreholes drilled by INTERCONSULT are relatively low, being in the range of 0.5 - > 3.5 m³/h. Total depth of these boreholes is between 151 and 209 m. EC varied from 74 to 147 mS/m. Transmissivity values were not evaluated. Another major investigation has been undertaken in the adjacent area in north-western Botswana (AQUALOGIC & WATER SURVEYS BOTSWANA, 2003). This study identified the Eiseb Graben as a possible groundwater resource of moderate potential. However, only one borehole has been drilled nearby the project area (borehole no. 9896: TD: 149 m; yield 0.5 m³/h; TDS: 2,300 mg/l). Based on aeromagnetic and geomagnetic surveys it concludes that Karoo deposits underlie Kalahari sediments in this area (Figure 18). Borehole 9896, however, encountered biotite schist at a depth of 123 m. According to the regional groundwater flow pattern (Figure 27), it is assumed that a local groundwater recharge mound exists to the north of the project area in the Aha Mountains. Although this groundwater contour map is rather schematic, it seems possible that flow from this area is directed to the Eiseb Graben.
3.7 Summary of Drilling Results
Four boreholes were drilled within the framework of this project. Their location and some essential base data are documented in Figure 22 and Table 4. Borehole WW41023 was exceptionally successful with a recommended yield of approximately 120 m³/h, a transmissivity of 553 m²/d and an electric conductivity of 43 mS/m. The aquifer consists of fine to coarse grained sandstone which is partly calcareous and partly gravelly, and conglomerate (247-257 m bgl). The pumping test clearly shows boundary effects, however, the distance to the boundary/-ies could not be defined yet. Based on the TEM findings, it is assumed that this borehole is located in a deep reaching trench along the northern margin of the graben. It is not clear yet whether this finding indicates an isolated resource resulting from coarse grained deposition in an alluvial fan or rather a more extended resource bound to an aquifer in a channel-like structure. However, isotope data (see below) indicate a relatively young water age so that the hypothesis of an extended trench being in connection with a source that receives present-day recharge seems quite likely.

Technical Cooperation Project Investigation of Groundwater Resources and Airborne-Geophysical Investigation of Selected Mineral Targets in Namibia Groundwater Investigations in the Eiseb Graben Main Hydrogeological Report
Page 28
Table 4: Basic Data of Boreholes Drilled within the Framework of the Project (CDT: constant discharge test)
WW-NoGeophysical_Sounding UTM-E UTM-S Lat Long
Elevation_TEM TD Started Completed
m m ° ° m mWW41023 2_23 470250 7713970 20.67284 20.71558 1068 378 29-06-2004 05-07-2004WW41024 2_50 476136 7703930 20.76365 20.77197 1072 300 09-07-2004 17-07-2004WW41025 3_23 451067 7703396 20.76799 20.5311 1122 244 17-07-2004 27-07-2004WW41026 4_110 454808 7659556 21.16423 20.5659 1125 230 30-07-2004 06-08-2004
WW-No RWL_CDT RWL_asl Yield_CDT EC_CDT Transmissivity Yield_recomm m m³/h µS/cm m²/d m³/h
WW41023 150.00 918.00 49.7 430 553 123WW41024 149.54 922.46 5.4 1380 52.1 2.5WW41025 172.91 949.09 960 < 0.5WW41026 137.65 987.35 750 < 0.5 Borehole WW41024 struck a 50 m thick aquiferous, predominantly fine to medium grained sandstone above thick clay deposits. Transmissivity is much less than in WW41023 and EC is considerably higher (138 mS/m), comparable to that of the boreholes drilled by INTERCONSULT (1996), all of which are in the range of 74 to 147 mS/m. The low EC in WW41023 may indicate that this water originates from a different source and was possibly recharged other than the more shallow aquifer struck at WW41024. Due to the fact that borehole WW41023 is screened or open between 148 and 378 m, it may also be that the water in the lower part of the aquifer has a different hydrochemical composition than in the upper part. Borehole WW41025 which was also targeted at the assumed trench immediately south of the northern margin of the Eiseb Graben unfortunately did not tap the aquifer although it penetrated sediments which generally looked promising to constitute a suitable aquifer, i.e. fine to medium grained sandstone mostly with gravel but also commonly with a slightly clayey matrix. No pumping test could be carried out because the yield was below 1 m³/h. The well was drilled down to 244 m and stopped after entering a clay layer, believed to represent the Tsumkwe Fm. Borehole WW41026 was targeted at a zone of high resistivity immediately north of the southern margin of the Eiseb Graben, believed to represent a freshwater bearing zone. This well encountered metamorphic schists below 115 m bgl and is believed to be already situated on the southern graben shoulder. For further information it is referred to Volume IV.BG.3.2 of this series of reports.

Technical Cooperation Project Investigation of Groundwater Resources and Airborne-Geophysical Investigation of Selected Mineral Targets in Namibia Groundwater Investigations in the Eiseb Graben Main Hydrogeological Report
Page 29
4 Groundwater Resources
4.1 Description of Aquifer System
4.1.1 Information from Water and Exploration Wells (Hydrogeological Database)
A hydrocensus was conducted by A. Wierenga (AGES Consult) in order to improve the database for the project area. Altogether 43 wells were visited, 24 of which were previously not in the database. Altogether there are 83 boreholes in the project area (the entire database set up for the project purposes contains 153 wells and is documented in Annex 1). Of those, 43 are situated in the graben itself. During the hydrocensus 20 water samples were collected and later on analyzed. Figure 22 shows the locations of all boreholes in the project area.

Tech
nica
l Coo
pera
tion
Pro
ject
In
vest
igat
ion
of G
roun
dwat
er R
esou
rces
and
Airb
orne
-Geo
phys
ical
Inve
stig
atio
n of
Sel
ecte
d M
iner
al T
arge
ts in
Nam
ibia
G
roun
dwat
er In
vest
igat
ions
in th
e E
iseb
Gra
ben
Mai
n H
ydro
geol
ogic
al R
epor
t
Page
30
Fi
gure
22:
Bor
ehol
e Lo
catio
n M
ap o
f the
Eis
eb G
rabe
n R
egio
n

Technical Cooperation Project Investigation of Groundwater Resources and Airborne-Geophysical Investigation of Selected Mineral Targets in Namibia Groundwater Investigations in the Eiseb Graben Main Hydrogeological Report
Page 31
4.1.2 Information from Geophysical Surveys Ground geophysical surveys were conducted by INTERCONSULT (1996) to determine the depth to bedrock, especially in the Eiseb Graben using Schlummberger array and VES techniques. Based on the results, INTERCONSULT assumes that the thickness of Kalahari sediments in the center of the Graben exceeds 750 m. The interpreted sounding curves are documented in the INTERCONSULT report. Previous investigations of CSIR and other consultants, which were described by INTERCONSULT, could not be made available. Numerous geophysical investigations have been undertaken in northwestern Botswana (AQUALOGIC & WATER SURVEYS BOTSWANA, 2003) at a more regional scale. However, no detailed studies are available from the immediate vicinity of the project area. On behalf of the DWA-BGR technical cooperation project POSEIDON/Botswana conducted a total of 54 time-domain electromagnetic (TEM) soundings across the Eiseb Graben, located on an array of four lines with a spacing of approximately 20 km between lines and a spacing ranging from 1.5 to 7.5 km between TEM measurements. Figure 23 shows the location of these measurements relative to the lineaments mapped by satellite image interpretation conducted by the project. The results of the TEM measurements are documented in FIELITZ et al. (2004) of this series of project reports. Two boreholes were drilled on TEM line 2 (Figure 24). The third borehole (WW41025) was drilled towards the northern end of TEM line 3, whereas the forth borehole (WW41026) was drilled towards the southern end of TEM line 4. The aim of the first three boreholes was to tap an expected aquifer in a formation with relatively high resistivities (30 – 80 Ωm) at the northern margin of the Eiseb Graben. It was expected that Kalahari sediments had been deposited at the northern margin in a deeply downlifted trench. It was assumed that the forth borehole may penetrate a similar sequence of high resistive layers at the southern margin of the Eiseb Graben. The former assumption was confirmed by the first borehole (WW41023) which penetrated Kalahari sediments of high yield down to a depth of 378 m, while the latter assumption could not be confirmed. Borehole WW41026 entered into basement rocks (gneiss) at a depth of 115 m. It was furthermore assumed that the resistivities below 20 Ωm, which occur in the central and southern parts of the northern part of the Eiseb Graben as well as almost throughout the southern part of the Eiseb Graben with the exception of a very narrow stretch towards its southern margin, represent aquitards. This could be confirmed by borehole WW41024 which penetrated clays between a depth of 251 and 300 m after encountering a saturated aquifer between 149 and 251 m of sufficiently high yield.

Technical Cooperation Project Investigation of Groundwater Resources and Airborne-Geophysical Investigation of Selected Mineral Targets in Namibia Groundwater Investigations in the Eiseb Graben Main Hydrogeological Report
Page 32
1
2
3.2
5
8
13
20
32
50
80
130
200
1000
Res
istiv
ity[o
hm-m
]
420000E 440000E 460000E 480000E 500000E
Eiseb: averaged resistivities at 150 m to 200 m below surface and lineaments
7660000N
7680000N
7700000N
7720000N
0 5 10 km
1
2
34
WW41023
WW41024WW41025
WW41026
Figure 23: Location of TEM Soundings and Resistivities Interpolated for a Depth Interval of 150-200 m bgl (red line: assumed extent of Graben based on TEM soundings and satellite image lineament interpretation, circles: DWA-BGR boreholes)

Technical Cooperation Project Investigation of Groundwater Resources and Airborne-Geophysical Investigation of Selected Mineral Targets in Namibia Groundwater Investigations in the Eiseb Graben Main Hydrogeological Report
Page 33
Figure 24: Cross Section along TEM Line 2 showing Locations of TEM Soundings and Interpolated Resistivities together with the Locations of Boreholes and the Distribution of Hydraulic Heads (blue line: assumed, blue triangles: measured)
Borehole geophysical logging was conducted in 17 boreholes in the project area, most of them being located in the graben. However, to only 5 of them there is a lithological borehole log available. Many of the logged boreholes were partly cased so that the geophysical log yields only information for lithological interpretation about the lower part of the borehole. Lithological logs are available for 29 boreholes in the project area as depicted in Figure 25, most of which are located in the northern part of the graben. However, most of the boreholes in the graben are only 150 to 200 m deep so that a comparison with the new findings is difficult. Almost all of those were described as sandstone forming the main aquifer. From two boreholes, one at the northern (WW40393) and one at the southern margin (WW16653), metamorphic rocks were described to be present in the lower section, possibly constituting the graben shoulders. It was not possible to make a meaningful correlation of lithological logs due to the strong lithological differences over short distances apart from some general doubts over the correctness of the lithological descriptions in general.

Technical Cooperation Project Investigation of Groundwater Resources and Airborne-Geophysical Investigation of Selected Mineral Targets in Namibia Groundwater Investigations in the Eiseb Graben Main Hydrogeological Report
Page 34
Figure 25: Boreholes with Lithological Logs, Lithology and Assumed Graben Extent
4.1.3 Lateral and Vertical Extent of the Eiseb Graben Aquifer System The interpolated resistivity section in Figure 24 which was obtained from TEM soundings shows high resistivities exceeding 100 Ωm on the supposed graben shoulders. Based on the resistivity distribution, it could be assumed that within the graben there would be either layers of low resistivity or water with a high salinity. The latter was not confirmed and from the hydrogeological viewpoint not expected since all boreholes drilled by INTERCONSULT (1996) showed low salinities (EC ranging between 75 and 150 mS/m, equivalent to a TDS of between 500 and 1,000 mg/l). According to borehole WW41024, the low resistivities of between 5 and 20 Ωm,
Technical Cooperation Project Investigation of Groundwater Resources and Airborne-Geophysical Investigation of Selected Mineral Targets in Namibia Groundwater Investigations in the Eiseb Graben Main Hydrogeological Report
Page 35
which were measured by borehole logging below 150 m bgl, represent a clay layer encountered below a depth of 205 m bgl (with around 10 Ωm in the borehole geophysical log). At borehole WW41026 the graben shoulder (metamorphic schist) was reached at a depth of 115 m bgl (having a resistivity of around 15 Ωm). Altogether the distribution of geophysical measurements is still insufficient so that it is presently difficult to truly delineate the graben area. Furthermore it is not known whether gneiss is forming the boundary of the graben throughout the area or if other rock units may also occur on the graben shoulders. Those other units may have considerably different resistivities. It is presently also not possible to describe the vertical and horizontal extent of aquifers and aquitards within the graben area due to the limited number and depth of boreholes.
4.2 Groundwater Flow Pattern
For most boreholes in the project area there was no reliable information concerning their elevation. Such data, if existing, was commonly compiled based on elevations estimated from topographic map information. Since elevation intervals usually are 20 m these data are in most cases inadequate for the establishment of a piezometric map. A major problem that hampers the establishment of such a map is the non-existence of benchmarks in the area. A complete topographic survey of all water wells in the project area would have been too costly to conduct. Another problem is that such a map would require conducting a survey of water levels during a specific time period, which in such a remote area where almost no roads exist is extreme time consuming and costly. This idea was therefore not pursued. A much better solution proved to be the use of elevation data based on SRTM data (compare above). The piezometric map shown in Figure 26 is therefore based on elevations taken from SRTM images. However, due to missing elevation or water level data, there are altogether only 49 piezometric heads so that the base for this piezometric map is rather weak. The piezometric heads in the Omuramba Otjozondjou are considerably higher than those in the Eiseb Graben. This is possibly due to the fact that groundwater resources are trapped in very local aquifers which are often of limited thickness, directly overlying bedrock, and are not connected to a main aquifer due to the undulating features of the non-aquiferous bedrock. In the Eiseb Graben there seems to be a coherent piezometric head in its lower part only. Groundwater recharge to the Eiseb Graben Aquifer is assumed to take place through lateral inflow from localized aquifers in the main omurambas (Eiseb, Rooiboklaagte, Epukiro) and possibly through lateral inflow from localized aquifers in surrounding Kalahari deposits. However, little is known about the process in detail and the overall recharge amount.

Technical Cooperation Project Investigation of Groundwater Resources and Airborne-Geophysical Investigation of Selected Mineral Targets in Namibia Groundwater Investigations in the Eiseb Graben Main Hydrogeological Report
Page 36
Figure 26: Groundwater Flow Pattern in the Eiseb Graben Region
In the lower part of the Eiseb Graben the hydraulic gradient is around 0.5 to 2 ‰. The regional, strongly generalized piezometry is shown in Figure 27. According to this groundwater flow from the project area would be directed towards Lake Ngami in Botswana. Figure 27 indicates a local groundwater recharge mound in the Aha Mountains. Groundwater flow from this region may reach the Eiseb Graben.

Technical Cooperation Project Investigation of Groundwater Resources and Airborne-Geophysical Investigation of Selected Mineral Targets in Namibia Groundwater Investigations in the Eiseb Graben Main Hydrogeological Report
Page 37
Figure 27: Generalized Regional Piezometric Map of Northwestern Botswana (adopted from AQUALOGIC & WATER SURVEYS BOTSWANA, 2003; project area marked in blue, blue arrows: direction of groundwater flow)

Technical Cooperation Project Investigation of Groundwater Resources and Airborne-Geophysical Investigation of Selected Mineral Targets in Namibia Groundwater Investigations in the Eiseb Graben Main Hydrogeological Report
Page 38
4.3 Hydraulic Parameters
No documents are available on pumping tests of previously drilled wells. Not even drawdowns during pumping tests are reported, so that not even maps showing the potential exploitation potential can be drawn. Therefore, the only hydraulic parameters available for this area are those recorded during the current project. Only in two of the four drilled wells pumping tests could be carried out, in WW41023 and WW41024. The yields of WW41025 and WW41026 were too low, i.e. below 1 m³/h. Pumping test data are documented in Volume IV.GW.3.2 of this series of reports. The evaluation of the pumping tests is documented in Volume IV.GW.3.3. The results are summarized in Tables 5 to 8 and Figures 28 and 29. Since no observation boreholes were located close enough to the boreholes drilled within the framework of the project storage coefficients and distances to boundaries could not be determined. Only transmissivities could be evaluated. Pumping test data at borehole WW41023 clearly shows boundary effects after a pumping duration of 600 minutes. Table 5: Design of Step Tests
Pumped Well
Aquifer Date No. of steps
Duration of steps [h]
Duration of recovery [h]
Range of pumping rate Qn [m3/h]
Pump test crew
WW41023 Kalahari 24-08-2004 5 1-3 1 10.3 – 49.3 DWA WW41024 Kalahari 13-08-2004 6 1-2 6 1.1 – 7.7 Metzger WW41025 - not tested - - - yield too low - WW41026 - not tested - - - yield too low - Table 6: Results of Step Tests
Pumped Well
RWL [m]
Max. PWL [m]
smax [m]
sres [m]
B [h/m2]
C [h2/m5]
P [-]
Qrec [m3/h]
Evaluation Method
Determination of drawdown sn
WW41023 150.00 155.88 5.88 0.13 0.129 1.1E-4 2 123 Jacob (1947)
Observed steady state drawdown
WW41024 149.62 162.85 13.23 0.08 0.7 1.1E-1 2 2.5 Jacob (1947)
Hantush- Bierschenk (1964)
WW41025 - - - - - - - < 0.5 - - WW41026 - - - - - - - < 0.5 - -

Technical Cooperation Project Investigation of Groundwater Resources and Airborne-Geophysical Investigation of Selected Mineral Targets in Namibia Groundwater Investigations in the Eiseb Graben Main Hydrogeological Report
Page 39
400000 410000 420000 430000 440000 450000 460000 470000 480000 490000 500000 510000 5200007640000
7650000
7660000
7670000
7680000
7690000
7700000
7710000
7720000
7730000
7740000
7750000
23
3.5
3.51.71.5
0.5
2
3.53
123
2.5< 0.5
< 0.5
boreholes drilled by DWA/BGR
boreholes drilled by Interconsult
lineaments
assumed limit of Eiseb Graben aquifer system
boreholes in DWA database
boreholes retrieved during hydrocensus 2004
TEM soundings of DWA/BGR
UTM zone 34S
Eiseb Graben
Bot
swan
a
Figure 28: Recommended Yields (m³/h) of Boreholes drilled by DWA/BGR and those drilled by INTERCONSULT (1996) in the Eiseb Graben Aquifer System (values as reported by INTERCONSULT)
Table 7: Design of Constant Discharge Tests
Pumped Well
Aquifer Observation Well (s)
Date Duration of pumping [h]
Duration of recovery [h]
Pumping rate Q [m3/h]
Pump test crew
WW41023 Kalahari - 25-08-2004 72 72 49.7 DWA WW41024 Kalahari - 15-08-2004 36 12 5.4 Metzger WW41025 - - not tested - - yield too
low -
WW41026 - - not tested - - yield too low
-
Table 8: Results of Constant Discharge Tests
Pumped Well
RWL [m]
Max. PWL [m]
smax [m]
sres [m]
EC [mS/m]
T [m2/d]
Evaluation Method
Comments
WW41023 150.00 156.50 6.50 0.12 43.7 553 Theis (1935) boundary effects observed
WW41024 149.54 157.69 8.15 0.33 138 52.1 Theis (1935) boundary effects likely – test too short
WW41025 - - - - - - yield too low WW41026 - - - - - - yield too low

Technical Cooperation Project Investigation of Groundwater Resources and Airborne-Geophysical Investigation of Selected Mineral Targets in Namibia Groundwater Investigations in the Eiseb Graben Main Hydrogeological Report
Page 40
400000 410000 420000 430000 440000 450000 460000 470000 480000 490000 500000 510000 5200007640000
7650000
7660000
7670000
7680000
7690000
7700000
7710000
7720000
7730000
7740000
7750000
553
52.1
boreholes drilled by DWA/BGR
boreholes drilled by Interconsult
lineaments
assumed limit of Eiseb Graben aquifer system
boreholes in DWA database
boreholes retrieved during hydrocensus 2004
TEM soundings of DWA/BGR
UTM zone 34S
Eiseb Graben
Bot
swan
a
Figure 29: Transmissivities (m²/d) of Boreholes drilled by DWA/BGR
The combined saturated screened and open section of the aquifer at well WW41023 is 222.1 m long, so that the hydraulic conductivity of the aquifer is around 2.49 m/d (2.9E-5 m/s). The saturated screened section can therefore be characterized as a good aquifer. At WW41024 the aquifer thickness is around 81.6 m, so that the hydraulic conductivity is around 0.64 m/d (7.4E-6 m/s). The screened section can be characterized as a moderate aquifer. No other hydraulic parameters are available for the area because no pumping tests for the boreholes in the area could be made available. Concerning the boreholes drilled by INTERCONSULT (1996), it seems that pumping tests (probably blow tests) were carried out but were not documented in the report. Since it was doubted that the yields reported by INTERCONSULT referred to true recommended yields, a step test was carried out at WW35432 (Pos. 2). This test showed that the recommended yield of this well is much higher (11 m³/h) than the reported value (3 m³/h). The yield would be even higher (around 20 m³/h) if the borehole would be deeper (around 200 m; compare Volume IV.GW.3.3). In view of these findings it is strongly recommended to conduct step tests and constant discharge tests at all INTERCONSULT boreholes drilled in the Eiseb Graben. The two pumping tests carried out at the DWA-BGR boreholes in the framework of this investigation show that the hydraulic parameters vary considerably over short distances in the graben area.

Technical Cooperation Project Investigation of Groundwater Resources and Airborne-Geophysical Investigation of Selected Mineral Targets in Namibia Groundwater Investigations in the Eiseb Graben Main Hydrogeological Report
Page 41
4.4 Hydrochemical Characteristics
Water samples of 21 wells were analyzed within the framework of this project. Previously 19 analyses were available, however, only 7 of those are within the acceptable limit of 10% analytical error. The results of all analyses are listed in Annex 2. The locations of these samples are shown in Figure 30.
Figure 30: Locations of Boreholes with Chemical Analyses (<10% analytical error)
4.4.1 Groundwater Quality Water quality varies strongly over the Eiseb Graben Region as depicted in Figure 31. In the lower part of the Omuramba Eiseb and Omuramba Epukiro TDS contents are mostly low, meeting class A standard (<1,500 mg/l) of the Namibian drinking water guideline. In the lower part of the Eiseb Graben class B standard (1,500-2,000 mg/l) is generally met. The lowest TDS value constitutes that of the newly drilled borehole WW41023 (230 mg/l). High salinities occur in the eastern part of Omuramba Eiseb, the eastern part of Omuramba Rooiboklaagte and north of the Epukiro/Rooiboklaagte confluence at the border to Botswana.

Technical Cooperation Project Investigation of Groundwater Resources and Airborne-Geophysical Investigation of Selected Mineral Targets in Namibia Groundwater Investigations in the Eiseb Graben Main Hydrogeological Report
Page 42
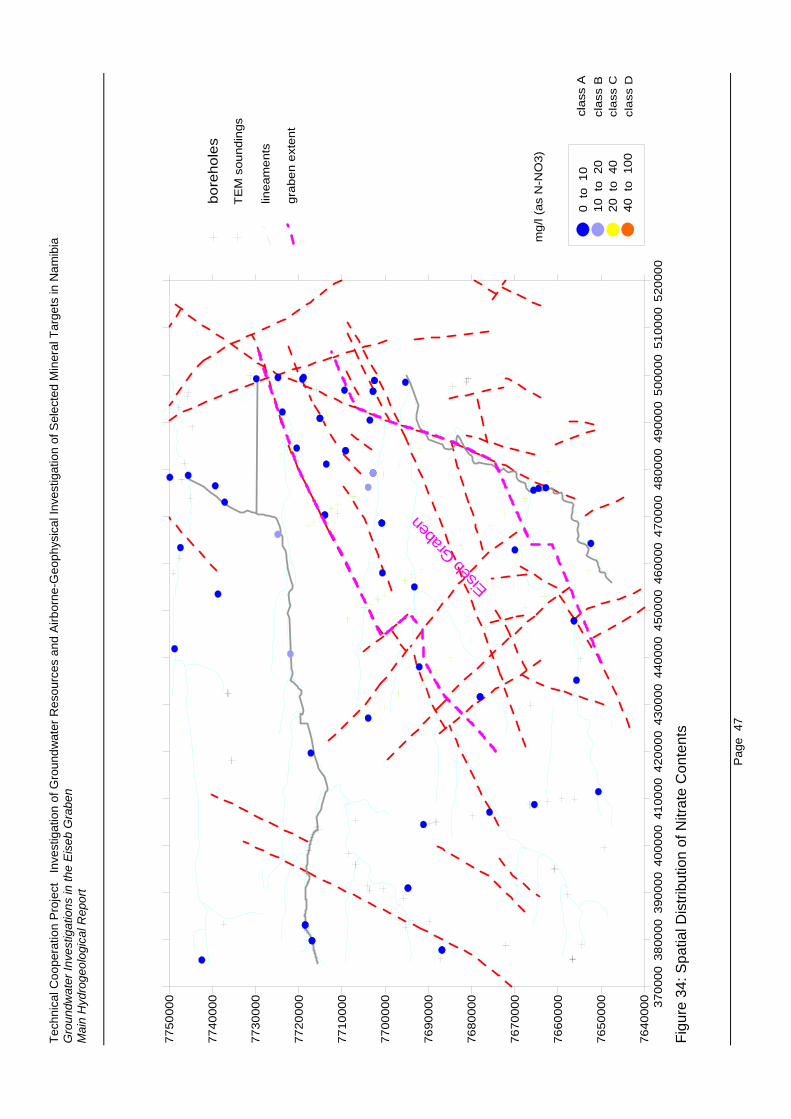
Concerning the water types, Figures 32 and 35 and Table 9 show that sodium type waters predominate. Bicarbonate and sulphate dominated waters seem to be equally distributed over the area (Figures 33, 38 and 39). The main components which may constitute health risks are: nitrate, sodium and sulphate. Nitrate contents (as N-NO3; Figure 34) entirely fall into categories A (<10 mg/l) and B (10-20 mg/l) and thus conform with the Namibian drinking water standard. However, especially in the lower part of the Eiseb Graben high nitrate contents have been encountered (WW35434: 72.2 mg/l and WW41024: 68.0 mg/l; as NO3 !), far exceeding the maximum allowable limit of the European drinking water guidelines (50 mg/l). High values are also reported from the lower reaches of the Omuramba Eiseb (maximum of 75.3 mg/l in borehole Ovie; as NO3). Sodium contents are relatively high in some parts of the area, exceeding class C limits (400 mg/l) north of the confluence of the Epukiro/Rooiboklaagte Rivers, in the eastern part of the Eiseb Graben, in the eastern reaches of the Omuramba Eiseb, and in the Omuramba Otjozondjou. As can be seen on the Piper diagram and on Figures 35 and 36, sodium is the predominant cation especially in the Eiseb Graben. Sulphate concentrations are relatively high throughout the area. Values exceeding class B limit (600 mg/l) are recorded at the area north of the confluence of the Epukiro/Rooiboklaagte Rivers, in the eastern part of the Eiseb Graben, in the eastern reaches of the Omuramba Eiseb, and in the Omuramba Otjozondjou (Figure 37). Figure 38 shows that sulphate exceeds 60% of the anions at many locations in the southeastern part of the project area and near the confluence of the Omurambas Epukiro/Rooiboklaagte. Fluoride concentrations entirely fall into class A (<1.5 mg/l). Iron contents are commonly below 0.5 mg/l, thus falling into class A (<0.1 mg/l) or B (0.1-1 mg/l). Bicarbonate often constitutes more than 40% of the anions and therefore dominates many of the samples. The same is valid for Ca+Mg. This, together with the fact that nitrate contents are relatively high in the lower reaches of the Eiseb Graben can be seen as an indication of local groundwater recharge in this area.

Tech
nica
l Coo
pera
tion
Pro
ject
In
vest
igat
ion
of G
roun
dwat
er R
esou
rces
and
Airb
orne
-Geo
phys
ical
Inve
stig
atio
n of
Sel
ecte
d M
iner
al T
arge
ts in
Nam
ibia
G
roun
dwat
er In
vest
igat
ions
in th
e E
iseb
Gra
ben
Mai
n H
ydro
geol
ogic
al R
epor
t
Page
43
3700
0038
0000
3900
0040
0000
4100
0042
0000
4300
0044
0000
4500
0046
0000
4700
0048
0000
4900
0050
0000
5100
0052
0000
7640
000
7650
000
7660
000
7670
000
7680
000
7690
000
7700
000
7710
000
7720
000
7730
000
7740
000
7750
000
12
2 to
750
75
0 to
150
0
1500
to
200
0
2000
to
300
0
3000
to
460
1
mg/
l
clas
s A
clas
s B
clas
s C
clas
s D
Eiseb G
rabe
n
bore
hole
s
TEM
sou
ndin
gs
linea
men
ts
grab
en e
xten
t
Fi
gure
31:
Spa
tial D
istri
butio
n of
TD
S C
onte
nts

Technical Cooperation Project Investigation of Groundwater Resources and Airborne-Geophysical Investigation of Selected Mineral Targets in Namibia Groundwater Investigations in the Eiseb Graben Main Hydrogeological Report
Page 44
Figure 32: Piper Diagram of all Hydrochemical Analyses (samples with <10% analytical error only)

Technical Cooperation Project Investigation of Groundwater Resources and Airborne-Geophysical Investigation of Selected Mineral Targets in Namibia Groundwater Investigations in the Eiseb Graben Main Hydrogeological Report
Page 45
Figure 33: Spatial Distribution of Percentages of Selected Cations and Anions of the Total (samples with <10% analytical error only)

Technical Cooperation Project Investigation of Groundwater Resources and Airborne-Geophysical Investigation of Selected Mineral Targets in Namibia Groundwater Investigations in the Eiseb Graben Main Hydrogeological Report
Page 46
Table 9: Water Types (samples with <10% analytical error only) Name WW-No. UTM-E UTM-S Water TypeAgarop Pos WW 10413 498446.80 7695323.00 Na-Ca-SO4BE-1 A WW 41023 470250.00 7713970.00 Ca-Mg-HCO3BE-1 B WW 41023 470250.00 7713970.00 Ca-Mg-HCO3BE-2 WW 41024 476136.00 7703930.00 Na-Ca-Mg-SO4-HCO3Embonde south - 435152.80 7655702.00 Na-Ca-HCO3KARAPI borehole found by consultants in 1991 ? 431624.40 7678018.00 Na-Ca-SO4OTJINOKO WW25462 377835.90 7686852.00 Mg-Na-Ca-SO4OTJINOKO WW25462 377835.90 7686852.00 Na-Ca-Mg-SO4Otjiparu - 419676.80 7717197.00 Ca-Mg-Na-HCO3-SO4-ClOtjitazu WW 33168 447780.50 7656297.00 Na-HCO3Otjoahe - 440751.60 7721942.00 Ca-Mg-HCO3Otjora - 462839.30 7669966.00 Na-HCO3Otjovakura 1 - 454973.80 7693232.00 Na-Ca-SO4-HCO3Otjovakuru 2 - 437994.80 7692092.00 Na-Ca-HCO3Otjovazandu - 427107.30 7703931.00 Ca-Mg-Na-SO4Ovie - 466128.70 7724871.00 Ca-Na-Mg-HCO3-SO4Pos 1 WW 35431 499122.90 7719143.00 Na-Ca-SO4-HCO3Pos 10 WW 35440 484468.50 7720482.00 Ca-Mg-Na-SO4-HCO3Pos 11 WW 39907 481064.20 7713630.00 Na-Ca-HCO3Pos 2 WW 35432 490791.10 7715102.00 Na-Ca-Mg-HCO3-SO4Pos 3 WW 35433 483906.20 7709158.00 Na-SO4-HCO3Pos 4 WW 35434 479176.90 7702808.00 Na-Ca-Mg-HCO3Pos 5 WW 35435 468547.30 7700781.00 Na-Ca-Mg-HCO3-SO4Pos 9 WW 35439 492127.60 7723792.00 Na-Ca-Mg-SO4-HCO3ROOIBOKLAG WW16666 498829.10 7702481.00 Na-SO4ROOIBOKLAG-87M KAL. TSUMIS WW16653 496539.50 7702813.00 Na-Mg-SO4WW25241 WW25241 379815.60 7716928.00 Na-Ca-SO4-ClWW25442 WW25442 383169.90 7718501.00 Na-Ca-SO4-Cl (remark: blue: Ca-HCO3 or Ca-Mg-HCO3 type waters; orange: waters with SO4 predominance; green: waters with Na and HCO3 predominance)
Tech
nica
l Coo
pera
tion
Pro
ject
In
vest
igat
ion
of G
roun
dwat
er R
esou
rces
and
Airb
orne
-Geo
phys
ical
Inve
stig
atio
n of
Sel
ecte
d M
iner
al T
arge
ts in
Nam
ibia
G
roun
dwat
er In
vest
igat
ions
in th
e E
iseb
Gra
ben
Mai
n H
ydro
geol
ogic
al R
epor
t
Page
47
3700
0038
0000
3900
0040
0000
4100
0042
0000
4300
0044
0000
4500
0046
0000
4700
0048
0000
4900
0050
0000
5100
0052
0000
7640
000
7650
000
7660
000
7670
000
7680
000
7690
000
7700
000
7710
000
7720
000
7730
000
7740
000
7750
000
0
to 1
0
10 t
o 2
0
20 t
o 4
0
40 t
o 1
00
mg/
l (as
N-N
O3)
clas
s A
clas
s B
clas
s C
clas
s D
Eiseb G
rabe
n
bore
hole
s
TE
M s
ound
ings
linea
men
ts
grab
en e
xten
t
Fi
gure
34:
Spa
tial D
istri
butio
n of
Nitr
ate
Con
tent
s

Tech
nica
l Coo
pera
tion
Pro
ject
In
vest
igat
ion
of G
roun
dwat
er R
esou
rces
and
Airb
orne
-Geo
phys
ical
Inve
stig
atio
n of
Sel
ecte
d M
iner
al T
arge
ts in
Nam
ibia
G
roun
dwat
er In
vest
igat
ions
in th
e E
iseb
Gra
ben
Mai
n H
ydro
geol
ogic
al R
epor
t
Page
48
3700
0038
0000
3900
0040
0000
4100
0042
0000
4300
0044
0000
4500
0046
0000
4700
0048
0000
4900
0050
0000
5100
0052
0000
7640
000
7650
000
7660
000
7670
000
7680
000
7690
000
7700
000
7710
000
7720
000
7730
000
7740
000
7750
000
0
to 1
00
100
to 4
00
400
to 8
00
800
to 2
000
mg/
l
clas
s A
clas
s B
clas
s C
clas
s D
Eiseb G
rabe
n
bore
hole
s
TE
M s
ound
ings
linea
men
ts
grab
en e
xten
t
Fi
gure
35:
Spa
tial D
istri
butio
n of
Sod
ium
Con
tent
s

Tech
nica
l Coo
pera
tion
Pro
ject
In
vest
igat
ion
of G
roun
dwat
er R
esou
rces
and
Airb
orne
-Geo
phys
ical
Inve
stig
atio
n of
Sel
ecte
d M
iner
al T
arge
ts in
Nam
ibia
G
roun
dwat
er In
vest
igat
ions
in th
e E
iseb
Gra
ben
Mai
n H
ydro
geol
ogic
al R
epor
t
Page
49
3700
0038
0000
3900
0040
0000
4100
0042
0000
4300
0044
0000
4500
0046
0000
4700
0048
0000
4900
0050
0000
5100
0052
0000
7640
000
7650
000
7660
000
7670
000
7680
000
7690
000
7700
000
7710
000
7720
000
7730
000
7740
000
7750
000
0
to 2
0
20 t
o 4
0
40 t
o 6
0
60 t
o 8
0
80 t
o 1
00
meq
%
TE
M s
ound
ings
linea
men
ts
grab
en e
xten
t
Fi
gure
36:
Pre
dom
inan
ce o
f Sod
ium
(meq
%)

Tech
nica
l Coo
pera
tion
Pro
ject
In
vest
igat
ion
of G
roun
dwat
er R
esou
rces
and
Airb
orne
-Geo
phys
ical
Inve
stig
atio
n of
Sel
ecte
d M
iner
al T
arge
ts in
Nam
ibia
G
roun
dwat
er In
vest
igat
ions
in th
e E
iseb
Gra
ben
Mai
n H
ydro
geol
ogic
al R
epor
t
Page
50
3700
0038
0000
3900
0040
0000
4100
0042
0000
4300
0044
0000
4500
0046
0000
4700
0048
0000
4900
0050
0000
5100
0052
0000
7640
000
7650
000
7660
000
7670
000
7680
000
7690
000
7700
000
7710
000
7720
000
7730
000
7740
000
7750
000
0
to 2
00
200
to 6
00
600
to 1
200
12
00 t
o 2
000
20
00 t
o 2
100
mg/
l
clas
s A
clas
s B
clas
s C
clas
s D
Eiseb G
rabe
n
bore
hole
s
TEM
sou
ndin
gs
linea
men
ts
grab
en e
xten
t
> c
lass
D
Figu
re 3
7: S
patia
l Dis
tribu
tion
of S
ulph
ate
Con
tent
s
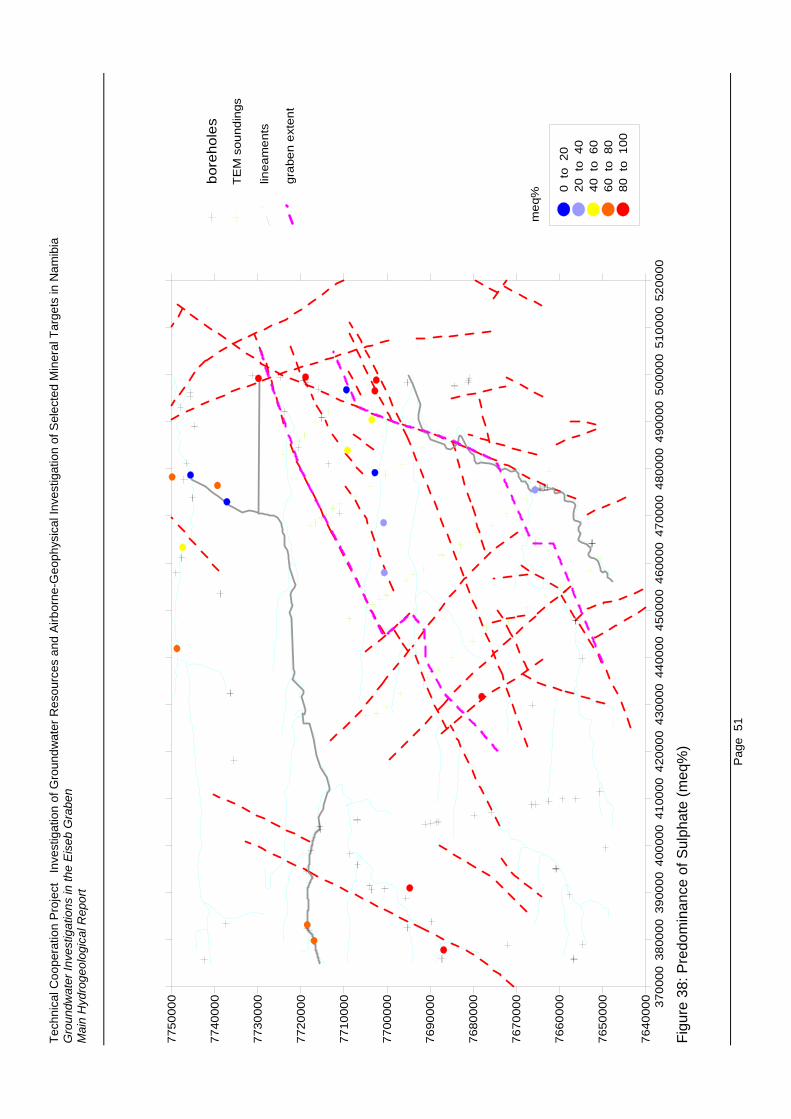
Tech
nica
l Coo
pera
tion
Pro
ject
In
vest
igat
ion
of G
roun
dwat
er R
esou
rces
and
Airb
orne
-Geo
phys
ical
Inve
stig
atio
n of
Sel
ecte
d M
iner
al T
arge
ts in
Nam
ibia
G
roun
dwat
er In
vest
igat
ions
in th
e E
iseb
Gra
ben
Mai
n H
ydro
geol
ogic
al R
epor
t
Page
51
3700
0038
0000
3900
0040
0000
4100
0042
0000
4300
0044
0000
4500
0046
0000
4700
0048
0000
4900
0050
0000
5100
0052
0000
7640
000
7650
000
7660
000
7670
000
7680
000
7690
000
7700
000
7710
000
7720
000
7730
000
7740
000
7750
000
0
to 2
0
20 t
o 4
0
40 t
o 6
0
60 t
o 8
0
80 t
o 1
00
meq
%
bore
hole
s
TE
M s
ound
ings
linea
men
ts
grab
en e
xten
t
Fi
gure
38:
Pre
dom
inan
ce o
f Sul
phat
e (m
eq%
)

Tech
nica
l Coo
pera
tion
Pro
ject
In
vest
igat
ion
of G
roun
dwat
er R
esou
rces
and
Airb
orne
-Geo
phys
ical
Inve
stig
atio
n of
Sel
ecte
d M
iner
al T
arge
ts in
Nam
ibia
G
roun
dwat
er In
vest
igat
ions
in th
e E
iseb
Gra
ben
Mai
n H
ydro
geol
ogic
al R
epor
t
Page
52
3700
0038
0000
3900
0040
0000
4100
0042
0000
4300
0044
0000
4500
0046
0000
4700
0048
0000
4900
0050
0000
5100
0052
0000
7640
000
7650
000
7660
000
7670
000
7680
000
7690
000
7700
000
7710
000
7720
000
7730
000
7740
000
7750
000
0
to 2
0
20 t
o 4
0
40 t
o 6
0
60 t
o 8
0
80 t
o 1
00
meq
%
bore
hole
s
TE
M s
ound
ings
linea
men
ts
grab
en e
xten
t
Fi
gure
39:
Pre
dom
inan
ce o
f Hyd
roge
n C
arbo
nate
(meq
%)

Technical Cooperation Project Investigation of Groundwater Resources and Airborne-Geophysical Investigation of Selected Mineral Targets in Namibia Groundwater Investigations in the Eiseb Graben Main Hydrogeological Report
Page 53
4.4.2 Isotopic Composition Twenty-one groundwater samples from the project area were analyzed for stable and radioactive isotopes (deuterium, oxygen-18, tritium, carbon-14 and carbon-13) at Schonland Research Institute for Nuclear Sciences of the University of the Witwatersrand, South Africa. The results are compiled in Table 10 and Figures 40 to 48. Table 10: Results of Isotope Analyses in the Eiseb Graben Region
IDN Name Latitude Longitude UTM-E UTM-S d D (‰) d18O (‰)Tritium
(TU) accuracyCarbon-14
(pmc) accuracy d13C (‰)WW39907 Pos 11 -20.67613 20.81942 481064.16 7713621.69 -54.6 -7.93 0.0 ±0.2 30.9 ±1.9 -9.46WW35433 Pos 3 -20.71652 20.84666 483905.18 7709155.07 -55.0 -7.90 0.2 ±0.2 12.5 ±1.6 -6.87WW35434 Pos 4 -20.77389 20.80109 479168.55 7702801.34 -54.3 -7.53 0.2 ±0.2 53.9 ±2.1 -9.52
WW10413Agaroppos (Nam/Botswana Border) -20.84159 20.98632 498446.75 7695322.31
-53.2 -7.560.0 ±0.2 40.2 ±2.0 -8.74
WW35431 Pos 1 -20.62806 20.99292 499132.30 7718951.49 -54.7 -7.81 0.0 ±0.2 15.8 ±1.7 -7.08WW35432 Pos 2 -20.66277 20.91318 490827.59 7715108.13 -53.3 -7.62 0.5 ±0.2 63.3 ±2.2 -9.72WW35439 Pos 9 -20.58423 20.92551 492107.77 7723799.87 -53.3 -7.90 0.0 ±0.2 19.6 ±1.7 -10.24WW35440 Pos 10 -20.61157 20.84741 483972.35 7720768.80 -54.8 -7.87 0.2 ±0.2 10.7 ±1.6 -10.33WW35435 Pos 5 -20.79203 20.69919 468567.12 7700777.54 -49.8 -7.03 0.0 ±0.2 62.1 ±2.2 -9.50
Rooiboklaagte Omuramba - Otjovakuru -20.85994 20.56837 454973.77 7693231.52
-53.5 -7.280.1 ±0.2 47.5 ±2.0 -8.67
Rooiboklaagte Omuramba - Otjovakuru No.2 -20.86975 20.40510 437994.83 7692091.72
-44.9 -6.150.1 ±0.2 47.4 ±2.0 -9.70
Ovie -20.57427 20.67622 466128.72 7724870.28 -59.6 -8.76 0.6 ±0.2 60.9 ±2.2 -7.81Otjoahe -20.60011 20.43261 440751.57 7721941.40 -58.8 -8.49 0.0 ±0.2 49.0 ±2.1 -10.18Otjiparu -20.64220 20.23014 419676.75 7717196.85 -59.5 -8.57 0.3 ±0.2 62.0 ±2.2 -9.65Ojovazandu -20.76238 20.30092 427107.27 7703930.41 -54.4 -7.94 0.2 ±0.2 49.7 ±2.5 -9.60
WW33168 Ojtitazu -21.19489 20.49659 447624.29 7656142.08 -54.2 -7.92 0.7 ±0.2 13.5 ±1.7 -9.17Embonde (South) -21.19847 20.37641 435152.85 7655701.53 -54.2 -8.12 0.1 ±0.2 18.7 ±1.7 -9.35Otjora -21.07035 20.64349 462839.32 7669965.82 -48.4 -6.94 0.1 ±0.2 0.0 ±1.5 -7.32
WW41023 BE-1 -20.67284 20.71558 470249.52 7713970.26 -55.1 -7.87 0.3 ±0.2 60.7 ±2.2 -9.88WW41023 BE-1 -20.67284 20.71558 470249.52 7713970.26 -54.0 -7.85 0.1 ±0.2 55.2 ±2.1 -9.73WW41024 BE-2 -20.76365 20.77197 476136.32 7703930.50 -52.8 -7.62 0.0 ±0.2 51.1 ±2.1 -9.65 Tritium values above 0.2 (accuracy) have been found at 5 locations in the area, three of them inside the graben area, the remainder outside. They indicate that some level of recent recharge reaches the graben area. Important in this regard is the detection of 0.3 TU in borehole WW41023. The 14C values cover a wide range, from 0 pMC to 63 pMC, i.e. from completely static (old) to dynamic (sub-recent) groundwater. There is no clear correlation with δ13C values (Figure 45). Old water is present at the southern margin of the graben, around borehole WW41026 (Figure 43). However, at the same time tritium is recorded in some of these wells. Difficult to explain is the presence of old water near the point where the Omuramba Eiseb reaches the Eiseb Graben. Some of these boreholes are even devoid of tritium, despite the fact that recharge must take place in the Omuramba Eiseb as evidenced by the tritium content there (Figure 42). The tritium – 14C correlation (Figure 46) shows that mostly high carbon-14 levels coincide with high tritium levels, indicating relatively young groundwater that was sub-recently recharged. On the other hand low carbon-14 values commonly coincide with tritium contents around the detection level. There are, however, four samples containing low amounts of carbon-14 but some tritium, in one case even 0.7 TU. It is assumed that
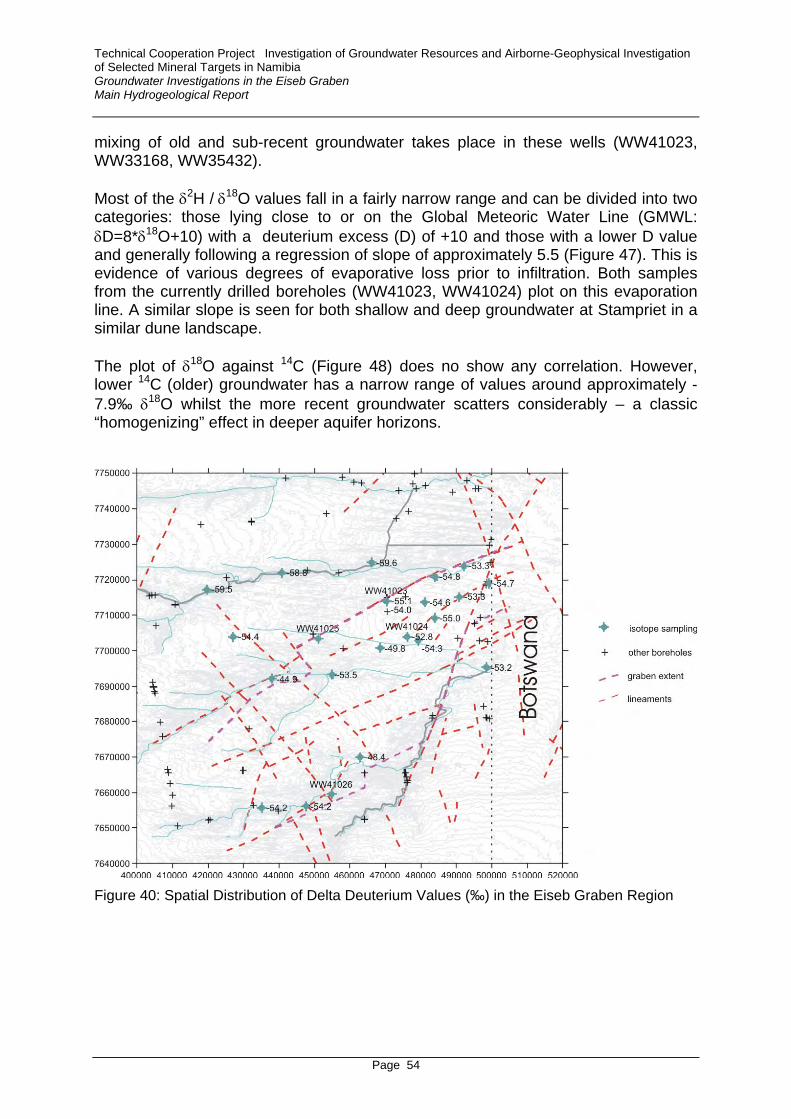
Technical Cooperation Project Investigation of Groundwater Resources and Airborne-Geophysical Investigation of Selected Mineral Targets in Namibia Groundwater Investigations in the Eiseb Graben Main Hydrogeological Report
Page 54
mixing of old and sub-recent groundwater takes place in these wells (WW41023, WW33168, WW35432). Most of the δ2H / δ18O values fall in a fairly narrow range and can be divided into two categories: those lying close to or on the Global Meteoric Water Line (GMWL: δD=8*δ18O+10) with a deuterium excess (D) of +10 and those with a lower D value and generally following a regression of slope of approximately 5.5 (Figure 47). This is evidence of various degrees of evaporative loss prior to infiltration. Both samples from the currently drilled boreholes (WW41023, WW41024) plot on this evaporation line. A similar slope is seen for both shallow and deep groundwater at Stampriet in a similar dune landscape. The plot of δ18O against 14C (Figure 48) does no show any correlation. However, lower 14C (older) groundwater has a narrow range of values around approximately -7.9‰ δ18O whilst the more recent groundwater scatters considerably – a classic “homogenizing” effect in deeper aquifer horizons.
Figure 40: Spatial Distribution of Delta Deuterium Values (‰) in the Eiseb Graben Region
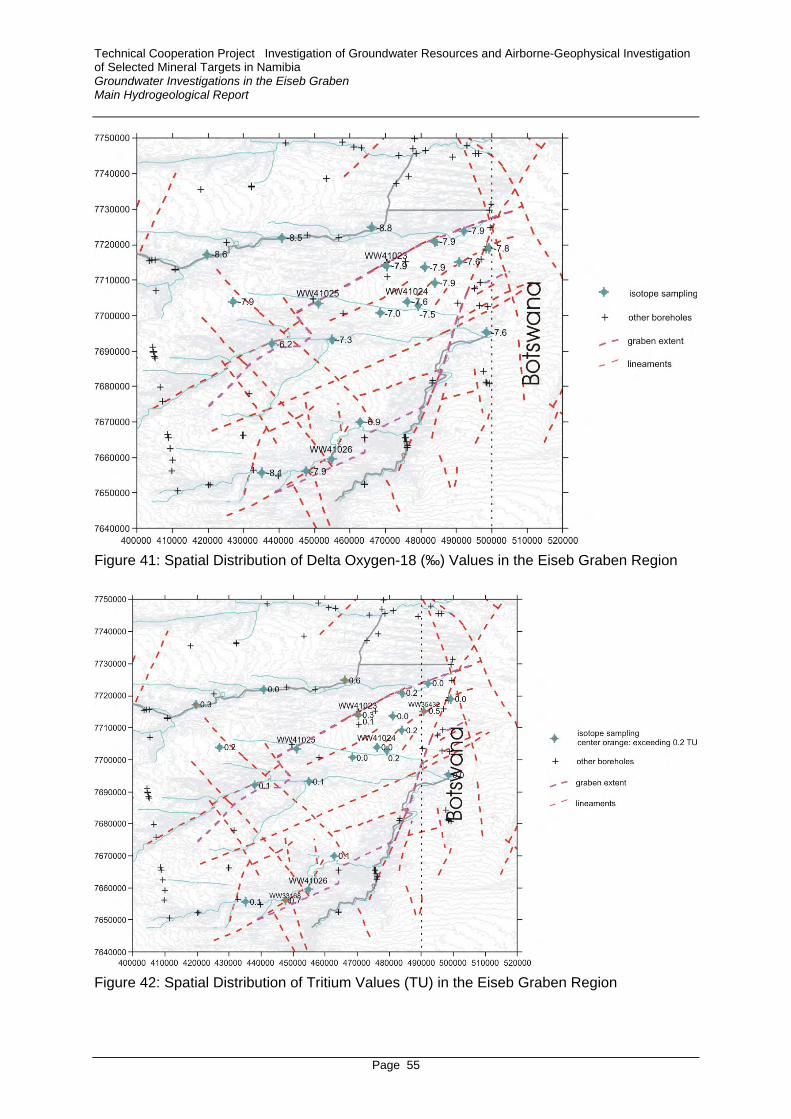
Technical Cooperation Project Investigation of Groundwater Resources and Airborne-Geophysical Investigation of Selected Mineral Targets in Namibia Groundwater Investigations in the Eiseb Graben Main Hydrogeological Report
Page 55
Figure 41: Spatial Distribution of Delta Oxygen-18 (‰) Values in the Eiseb Graben Region
Figure 42: Spatial Distribution of Tritium Values (TU) in the Eiseb Graben Region

Technical Cooperation Project Investigation of Groundwater Resources and Airborne-Geophysical Investigation of Selected Mineral Targets in Namibia Groundwater Investigations in the Eiseb Graben Main Hydrogeological Report
Page 56
Figure 43: Spatial Distribution of Carbon-14 Values (pMC) in the Eiseb Graben Region
Figure 44: Spatial Distribution of Delta Carbon-13 Values (‰) in the Eiseb Graben Region

Technical Cooperation Project Investigation of Groundwater Resources and Airborne-Geophysical Investigation of Selected Mineral Targets in Namibia Groundwater Investigations in the Eiseb Graben Main Hydrogeological Report
Page 57
Correlation Carbon-14 Delta Carbon-13
-12.00
-10.00
-8.00
-6.00
-4.00
-2.00
0.000.0 10.0 20.0 30.0 40.0 50.0 60.0 70.0
carbon-14 (pMC)
δ ca
rbon
-13
(‰)
Figure 45: Correlation Carbon-14 – Delta Carbon-13
0.80.60.40.20.010
20
30
40
50
60
70
TU
pMC
Figure 46: Correlation Tritium – Carbon-14

Technical Cooperation Project Investigation of Groundwater Resources and Airborne-Geophysical Investigation of Selected Mineral Targets in Namibia Groundwater Investigations in the Eiseb Graben Main Hydrogeological Report
Page 58
Correlation Delta Deuterium - Delta Oxygen-18
y = 5.5x - 10.7R2 = 0.92
y = 8x + 10
-70.0
-65.0
-60.0
-55.0
-50.0
-45.0
-40.0
-35.0
-30.0
-25.0
-20.0-11.00 -10.00 -9.00 -8.00 -7.00 -6.00 -5.00
δ oxygen-18 (‰)
δ D
eute
rium
(‰)
GWML
WW41023
WW41024
Figure 47: Correlation Delta Deuterium – Delta Oxygen-18
806040200-9
-8
-7
-6
14C
d18O
Figure 48: Correlation Carbon-14 (pMC) – Delta Oxygen-18 (‰)

Technical Cooperation Project Investigation of Groundwater Resources and Airborne-Geophysical Investigation of Selected Mineral Targets in Namibia Groundwater Investigations in the Eiseb Graben Main Hydrogeological Report
Page 59
4.5 Groundwater Monitoring
Presently there are no wells for monitoring of groundwater levels or groundwater quality in the area, with the exception of borehole no. 8857 on the Botswana side, near the border (UTM-E 500040, UTM-S 7723649; TD 179 m; Karoo sandstone aquifer). However, no meaningful monitoring data could be made available for this borehole. Before development of the newly detected groundwater resources it is strongly recommended to use the newly drilled boreholes WW41023 and WW41024 for monitoring purposes over a sufficiently long time period in order to provide data on the range of water level fluctuations and possible fluctuations in the chemical composition of the water. It is recommended to use data loggers for this purpose in order to save time and reduce costs. From the water level rise after rainfall and the time lag between rainfall events and peak water levels it may be possible to draw conclusions about the mechanism and amount of groundwater recharge.
4.6 Groundwater Exploitation Potential
In the absence of sufficient information on the correct geometry of the aquifer system, the horizontal and vertical distribution of hydraulic conductivities and the hydraulic gradient it is difficult to properly estimate the exploitation potential of the aquifer. Figure 24 suggests that the graben at section 2 is around 26 km wide, with the area of the deep trench being around 9 km wide. At borehole WW41024 the saturated graben filling is only around 100 m thick, possibly thinning towards the southern graben margin. The maximum saturated thickness of the graben filling, which is possibly reached at its northern margin, exceeds 228 m. Assuming an area along a vertical throughflow section of around 2.6E+6 m², a gradient of 0.75 ‰ and a hydraulic conductivity of on average 1 m/d one would arrive at a throughflow of around 0.7 MCM/a. Even though this estimation is based on conservative assumptions, this figure should presently only be considered as a very rough estimate.

Technical Cooperation Project Investigation of Groundwater Resources and Airborne-Geophysical Investigation of Selected Mineral Targets in Namibia Groundwater Investigations in the Eiseb Graben Main Hydrogeological Report
Page 60
5 Water Demand
The Water Supply and Sanitation Policy (WASP) was approved by the Government of Namibia in 1993 and is implemented by the Department of Rural Water Supply (DRWS) of the Department of Water Affairs. The WASP plan states that 80% of the rural population should have access to improved water supply by 2007. In 1997 the Namibian Cabinet issued the Community Based Management Strategy according to which responsibility for water points is to be handed over to communities in 2007. The Rural Development Plan for the Omaheke Region envisions to “raise living standards and reduce poverty through the equitable, sustainable and decentralized provision of education, health, human resources development and the creation of economic opportunity for all, emphasizing the removal of gender discrimination and the development of marginalized groups, whilst improving infrastructure, preserving culture and heritage, reducing crime and ensuring peace, reconciliation and stability.” The implementation of the WASP plan will mean that communities will have to bear considerable costs for operation and maintenance in the future and must technically be enabled to do so. In order to prepare the communities for this takeover process a ‘Rural Water Supply Development Plan for the Omaheke Region’ was prepared in 2002 by AFRICON. For the establishment of this plan 25% of the 481 water points were surveyed and at 10% of the water points water samples were taken and analyzed. The main findings of this study were:
• The current water infrastructure at water points is in a poor condition; • The average distance from water points to households is 507 m. The
maximum distance is 2.5 km and thus within the acceptable limit of the Namibian guidelines;
• Sanitation systems are almost non-existent (only 4% have pit latrines and 96% no facility at all);
• Only 71% of the water points have elevated tanks for water storage for human consumption;
• Open storage tanks for livestock watering and irrigation exist at 92% of the water points with many of them leaking;
• Total rural water demand is expected to decrease due to declining population numbers (12,946 m³/d in 2001).
The study suggested to rehabilitate the present water supply system and to improve the infrastructure at water points. According to AFRICON there are currently no bulk water supply schemes in the Omaheke Region and there are presently no plans to construct any such schemes in the short or medium term. In the past years it was considered to supply the Omaheke Region by a pipeline connected to the Eastern National Water Carrier (Figure 49).

Technical Cooperation Project Investigation of Groundwater Resources and Airborne-Geophysical Investigation of Selected Mineral Targets in Namibia Groundwater Investigations in the Eiseb Graben Main Hydrogeological Report
Page 61
Figure 49: Water Supply Network in NE-Namibia

Technical Cooperation Project Investigation of Groundwater Resources and Airborne-Geophysical Investigation of Selected Mineral Targets in Namibia Groundwater Investigations in the Eiseb Graben Main Hydrogeological Report
Page 62
6 Recommendations and Conclusions
Within the framework of this investigation one borehole penetrated a high yielding rock unit at the northern margin of the central part of the Eiseb Graben. The yield encountered there is exceptionally high. However, the extent of this high yielding aquifer unit is still unknown. It could be limited to a rather small area, being deposited in the form of an alluvial fan, so that the long-term sustainable yield may be low or it could be part of an alluvial channel. Presently the latter hypothesis seems more likely. It is also still unknown whether the assumed alluvial channel extends further to the southwest. Isotope data indicate that water in the graben is partly young, so that it is assumed that there is some recent recharge to the Eiseb Graben. In order to more precisely delineate the deep reaching trench at the northern margin of the Eiseb Graben and to improve the basis for decisions on further drilling sites it is recommended to carry out more TEM soundings. A total of 23 new TEM sites were proposed and measurements will be conducted during a later stage of this project phase, possibly in early 2005, on 4 lines (Figure 50). These additional measurements will decrease the spacing between lines to around 7 km and the spacing between measurement points to around 2.5 km. It is envisaged thereafter to drill two more deep boreholes (approximately 400 m deep) in the northeastern part of the Eiseb Graben with the aim to tap the aquifer in the assumed northern channel-like structure. The boreholes drilled by INTERCONSULT in the lower part of the Eiseb Graben should be properly pump tested. The individual steps of step tests should last between 1 and 2 hours, depending on constant discharge tests should be performed over a pumping duration of at least 24 hours. It should also be envisaged to conduct a packer test in the open part of borehole WW41023 in order to more precisely locate the depths of the water strikes. More hydrochemical and isotope analyses should be conducted in order to determine whether, to what extent and where from the Eiseb Graben Aquifer receives present-day recharge. Before development of the Eiseb Graben Aquifer it is strongly recommended to monitor the water level and hydrochemical composition over an extended period of time (at least one year). Based on the results of the proposed new investigations the long-term sustainable yield should be reevaluated. The drilling concept of the present investigation proved to be suitable, i.e. the uppermost part of the borehole should be drilled with a large enough diameter (e.g. 311 mm) down to a depth where the Kalahari sediments become sufficiently consolidated. This section should be cased off with steel casing and drilling should then be continued using reverse circulation down to the final depth with a large enough drilling diameter (e.g. 250 mm). The lower section, if sufficiently consolidated,

Technical Cooperation Project Investigation of Groundwater Resources and Airborne-Geophysical Investigation of Selected Mineral Targets in Namibia Groundwater Investigations in the Eiseb Graben Main Hydrogeological Report
Page 63
may be kept open while in the upper section plain/perforated uPVC casing should be installed.
1
2
3.2
5
8
13
20
32
50
80
130
200
1000
Res
istiv
ity [o
hm-m
]
420000E 440000E 460000E 480000E 500000E
Eiseb: averaged resistivities at 150 m to 200 m below surface
7660000N
7680000N
7700000N
7720000N
1_101_121_15
1_171_20
1_30
1_35
1_40
1_50
2_102_15
2_202_23
2_272_30
2_40
2_50
2_60
2_70
2_80
2_90
3_10
3_203_23
3_273_30
3_40
3_50
3_60
3_70
3_80
3_90
3_100
3_1103_120
3_130
4_-10
4_0
4_10
4_20
4_304_33
4_374_40
4_50
4_60
4_70
4_80
4_90
4_100
4_110
4_120
4_130 0 5 10 km
1
2
34
1_45
WW41023
WW41024WW41025
WW41026
BGR-2
BGR-1
Figure 50: Locations of New Proposed TEM-Soundings and Boreholes in the Eiseb Graben

Technical Cooperation Project Investigation of Groundwater Resources and Airborne-Geophysical Investigation of Selected Mineral Targets in Namibia Groundwater Investigations in the Eiseb Graben Main Hydrogeological Report
Page 64
FEDERAL REPUBLIC OF GERMANY
Federal Institute for Geosciences and Natural Resources
BGR Hannover
NAMIBIA Department of Water Affairs
DWA Windhoek
Windhoek, December 14, 2005 Authors:
Dr. Armin Margane Dr. Jens Wrabel (BGR) (DWA)
>>>>>>>>>>>>>>><<<<<<<<<<<<<<< Approved by:
Dr. Frieder Schildknecht Greg Christelis (BGR Project Team Leader) (Deputy-Director of
Geohydrology Division of DWA)

Technical Cooperation Project Investigation of Groundwater Resources and Airborne-Geophysical Investigation of Selected Mineral Targets in Namibia Groundwater Investigations in the Eiseb Graben Main Hydrogeological Report
Page 65
7 References
AFRICON (2002): Regional Rural Water Supply Development Plan for the Omaheke
Region. – Prepared for MAWRD, 177 p.; Windhoek.
AQUALOGIC & WATER SURVEYS BOTSWANA (2003): Northwest Ngamiland TGLP Groundwater Potential Study TB 10/2/19/2000-2001. – Prepared for Department of Geological Survey (DGS) of Botswana, 9 Vols.; Lobatse/Botswana.
FIELITZ, K. , STADTLER, C. & SCHILDKNECHT, F. (2004): Results of Time-Domain Electromagnetic Soundings and Direct Current Soundings for Groundwater Exploration in Three Regions in Namibia. – Report prepared for Technical Cooperation Project Investigation of Groundwater Resources and Airborne-Geophysical Investigation of Selected Mineral Targets in Namibia, BGR archive no. 124259, 17 p.; Hannover.
HUTCHINS, D.G., HUTTON, L.G., HUTTON, S.M., JONES, C.R. & LOENHERT, E.P. (1976): A Summary of the Geology, Seismicity, Geomorphology and Hydrogeology of the Okavango Delta. – Bull.Geol.Survey Botswana; Lobatse.
INTERCONSULT (1996): Groundwater Exploration in the Gam Area of Eastern Namibia. – Report prepared for Department of Water Affairs, 27 p; Windhoek.
INTERCONSULT (1996): Groundwater Exploration in the Eiseb Block of Eastern Namibia – Phase 1 – Final Report. – Report prepared for Department of Water Affairs, 15 p; Windhoek.
KLOCK, H. (2001): Hydrogeology of the Kalahari in North-Eastern Namibia with Special Emphasis on Groundwater Recharge, Flow Modelling and Hydrochemistry. – PhD, University of Wuerzburg, 239 p.; Wuerzburg/ Germany.
MILLER, R. M. (1983): The Pan-African orogen in South West Africa/Namibia. - In: Evolution of the Damara Orogen of South West Africa/Namibia (Ed. by R. M. Miller), pp. 431-512. Special Publ. Geol. Soc. S. Africa, 11; Johannesburg.
MILLER, R. M. (1997): The Owambo basin of northern Namibia. - In: African basins (Ed. by R. C. Selley; Sedimentary basins of the world, vol. 4), pp. 237-258; Amsterdam (Elsevier).
NEW, M., HULME, M. & JONES, P. (1999): Representing twentieth-century space-time climate variability. Part I: development of 1961-1990 mean monthly terrestrial climatology. - Journal of Climate, 12: 829-56.
SACS (1980): Code of Stratigraphic Terminology and Nomenclature for South Africa. – 2nd edition; Pretoria (Council for Geoscience).

Technical Cooperation Project Investigation of Groundwater Resources and Airborne-Geophysical Investigation of Selected Mineral Targets in Namibia Groundwater Investigations in the Eiseb Graben Main Hydrogeological Report
Page 66
SCHAEFFER, U. (2003): Grundwassererkundung im Nordosten Namibias und aerogeophysikalische Untersuchungen ausgewaehlter mineralhoeffiger Zonen - Bericht über eine Dienstreise vom 02.10. - 14.11.2003. – Rerpot prepared for
SCHOLZ, C.H., KOCZYNSKI, T.A. & HUTCHINS, D.G. (1976): Evidence for Incipient Rifting in Southern Africa – A Study of Microearthquakes in Northern Botswana. - Royal Astronomical Society Geophysical Journal, 44: 135-144; Oxford/UK.
SIMMONDS, A.L.E. & SMALLEY, T.J. (2000): Kalahari Aquifers in the Gam area of North-Eastern Namibia. – Communs Geol. Survey Namibia, 12, pp. 409-414; Windhoek.
SMITH (1984): The Lithostratigraphy of the Karoo Supergroup in Botswana. – Geol.Survey Dep. Botswana, Bull. Series, Bulletin 26, 239 p.; Lobatse.
STRUCKMEIER, W. & CHRISTELIS, G. (2001): Groundwater in Namibia – An Explanation to the Hydrogeological Map. – 128 p.; Windhoek (MAWRD).
VERHAGEN, B.Th., BREDENKAMP, D.B., van RENSBURG, H.J., FARR, J.L. (1999): Recharge Quantification with Radiocarbon: Independent Corroboration in Three Karoo Aquifer Studies in Botswana. – Proceedings, IAEA Symposium on Isotope Techniques in Water Resources Development and Management; Vienna.

Tech
nica
l Coo
pera
tion
Pro
ject
In
vest
igat
ion
of G
roun
dwat
er R
esou
rces
and
Airb
orne
-Geo
phys
ical
Inve
stig
atio
n of
Sel
ecte
d M
iner
al T
arge
ts in
Nam
ibia
G
roun
dwat
er In
vest
igat
ions
in th
e E
iseb
Gra
ben
Mai
n H
ydro
geol
ogic
al R
epor
t
Page
67
Ann
ex 1
: Bor
ehol
e D
ata

Tech
nica
l Coo
pera
tion
Pro
ject
In
vest
igat
ion
of G
roun
dwat
er R
esou
rces
and
Airb
orne
-Geo
phys
ical
Inve
stig
atio
n of
Sel
ecte
d M
iner
al T
arge
ts in
Nam
ibia
G
roun
dwat
er In
vest
igat
ions
in th
e E
iseb
Gra
ben
Mai
n H
ydro
geol
ogic
al R
epor
t
Page
68

Tech
nica
l Coo
pera
tion
Pro
ject
In
vest
igat
ion
of G
roun
dwat
er R
esou
rces
and
Airb
orne
-Geo
phys
ical
Inve
stig
atio
n of
Sel
ecte
d M
iner
al T
arge
ts in
Nam
ibia
G
roun
dwat
er In
vest
igat
ions
in th
e E
iseb
Gra
ben
Mai
n H
ydro
geol
ogic
al R
epor
t
Page
69
Ann
ex 2
: Hyd
roch
emic
al D
ata
Par
t 1: C
onte
nts
in m
g/l (
only
sam
ples
with
< 1
0% a
naly
tical
erro
r)
Gen
eral
Dat
a P
K_I
DBH
NO
NA
ME
LAT
LON
GU
TM-E
UTM
-SD
ate_
sam
plin
gpH
EC
TDS
1405
6?
KAR
AP
I bor
ehol
e fo
und
by c
onsu
ltant
s in
199
1-2
0.99
670
20.3
4330
4316
24.4
176
7801
7.46
0.0
0.0
0.0
1408
3W
W16
653
RO
OIB
OK
LAG
-87M
KA
L. T
SUM
IS-2
0.77
390
20.9
6800
4965
39.4
977
0281
2.65
-W
W16
666
RO
OIB
OK
LAG
-20.
7769
020
.990
0049
8829
.13
7702
480.
9744
417
WW
2524
1W
W25
241
-20.
6425
019
.847
5037
9815
.59
7716
927.
8888
41W
W25
442
WW
2544
2-2
0.62
850
19.8
7980
3831
69.8
877
1850
0.85
8842
WW
2546
2O
TJIN
OK
O-2
0.91
410
19.8
2640
3778
35.8
776
8685
2.11
8843
WW
2546
6O
TJIN
OK
O
-20.
8438
019
.953
4039
0992
.17
7694
723.
94W
W 1
0413
Agar
op P
os-2
0.84
159
20.9
8632
4984
46.7
576
9532
2.31
08/2
004
7.4
373.
029
68.8
WW
410
24BE
-2-2
0.76
365
20.7
7197
4761
36.0
077
0393
0.00
08/2
004
7.5
140.
810
15.8
WW
410
23BE
-1 A
(afte
r CD
test
)-2
0.67
284
20.7
1558
4702
50.0
077
1397
0.00
28/0
8/20
048.
048
.322
9.7
WW
410
23BE
-1 B
(afte
r ste
p te
st)
-20.
6728
420
.715
5847
0250
.00
7713
970.
0024
/08/
2004
7.9
45.4
341.
3-
Embo
nde
sout
h-2
1.19
847
20.3
7641
4351
52.8
576
5570
1.53
08/2
004
8.0
45.5
282.
8-
Otji
paru
-20.
6422
020
.230
1441
9676
.75
7717
196.
8508
/200
47.
413
3.0
837.
6W
W 3
3168
Otji
tazu
-21.
1948
920
.496
5944
7780
.52
7656
296.
4108
/200
48.
561
.040
0.4
-O
tjoah
e-2
0.60
011
20.4
3261
4407
51.5
777
2194
1.40
08/2
004
7.4
86.7
554.
2-
Otjo
ra-2
1.07
035
20.6
4349
4628
39.3
276
6996
5.82
08/2
004
8.0
37.9
264.
9-
Otjo
vaku
ra 1
-20.
8599
420
.568
3745
4973
.77
7693
231.
5208
/200
47.
519
8.3
1386
.6-
Otjo
vaku
ru 2
-20.
8697
520
.405
1043
7994
.83
7692
091.
7208
/200
48.
145
.730
3.0
-O
tjova
zand
u-2
0.76
238
20.3
0092
4271
07.2
777
0393
0.41
08/2
004
7.8
226.
918
27.0
-O
vie
-20.
5742
720
.676
2246
6128
.72
7724
870.
2808
/200
47.
313
0.3
912.
4W
W 3
5431
Pos
1-2
0.62
806
20.9
9292
4991
22.9
177
1914
2.93
08/2
004
7.8
117.
780
0.5
WW
354
40Po
s 10
-20.
6115
720
.847
4148
4468
.53
7720
481.
5508
/200
47.
414
7.2
1052
.9W
W 3
9907
Pos
11-2
0.67
613
20.8
1942
4810
64.1
577
1362
9.43
08/2
004
7.9
41.9
245.
6W
W 3
5432
Pos
2-2
0.66
277
20.9
1318
4907
91.1
477
1510
1.47
08/2
004
7.5
103.
174
2.8
WW
354
33Po
s 3
-20.
7165
220
.846
6648
3906
.22
7709
157.
2908
/200
48.
099
.966
6.1
WW
354
34Po
s 4
-20.
7738
920
.801
0947
9176
.87
7702
807.
9908
/200
47.
774
.347
8.1
WW
354
35Po
s 5
-20.
7920
320
.699
1946
8547
.35
7700
780.
8208
/200
47.
699
.665
8.7
WW
354
39Po
s 9
-20.
5842
320
.925
5149
2127
.57
7723
792.
1308
/200
47.
412
2.0
805.
3

Tech
nica
l Coo
pera
tion
Pro
ject
In
vest
igat
ion
of G
roun
dwat
er R
esou
rces
and
Airb
orne
-Geo
phys
ical
Inve
stig
atio
n of
Sel
ecte
d M
iner
al T
arge
ts in
Nam
ibia
G
roun
dwat
er In
vest
igat
ions
in th
e E
iseb
Gra
ben
Mai
n H
ydro
geol
ogic
al R
epor
t
Page
70
Con
tent
s in
mg/
l B
HN
ON
AM
EN
aK
Ca
Mg
FeM
nC
lS
O4
HC
O3
NO
3N
O3-
NN
O2_
N?
KAR
AP
I bor
ehol
e fo
und
by c
onsu
ltant
s in
199
162
0.0
19.0
190.
012
.00.
00.
015
0.0
1500
.03.
017
.74.
00.
0W
W16
653
RO
OIB
OK
LAG
-87M
KA
L. T
SU
MIS
450.
019
.075
.010
0.0
165.
014
50.0
5.6
15.5
3.5
WW
1666
6R
OO
IBO
KLA
G69
5.0
30.0
75.0
105.
070
.021
00.0
6.3
2.2
0.5
WW
2524
1W
W25
241
320.
013
.019
0.0
60.0
290.
012
10.0
3.8
4.4
1.0
WW
2544
2W
W25
442
450.
014
.013
0.0
35.0
300.
012
00.0
4.9
15.5
3.5
WW
2546
2O
TJIN
OK
O78
.011
.065
.045
.040
.036
0.0
7.1
8.9
2.0
WW
2546
6O
TJIN
OK
O
122.
012
.084
.039
.035
.053
0.0
5.7
2.2
0.5
WW
104
13A
garo
p P
os47
6.0
18.0
269.
095
.00.
118
1.0
1516
.026
2.1
28.5
6.4
0.0
WW
410
24B
E-2
133.
08.
894
.049
.00.
045
.034
8.0
292.
668
.015
.30.
2W
W 4
1023
BE-
1 A
(afte
r CD
test
)21
.04.
944
.021
.00.
012
.04.
424
3.8
17.4
3.9
0.7
WW
410
23B
E-1
B (a
fter s
tep
test
)19
.04.
142
.019
.00.
011
.03.
022
1.9
26.3
5.9
0.1
-E
mbo
nde
sout
h77
.05.
620
.05.
60.
114
.038
.019
7.5
7.8
1.8
0.0
-O
tjipa
ru10
1.0
6.9
101.
061
.00.
110
7.0
202.
034
3.8
20.1
4.5
0.0
WW
331
68O
tjita
zu12
6.0
21.0
4.0
2.8
0.1
10.0
10.0
319.
417
.74.
00.
1-
Otjo
ahe
43.0
8.1
82.0
44.0
0.1
20.0
14.0
460.
850
.811
.50.
1-
Otjo
ra63
.06.
614
.06.
20.
110
.012
.018
6.5
6.9
1.6
0.0
-O
tjova
kura
128
9.0
16.0
89.0
44.0
0.0
0.0
51.0
670.
036
5.7
19.2
4.3
0.3
-O
tjova
kuru
265
.05.
920
.09.
50.
00.
011
.014
.022
5.5
12.8
2.9
0.0
-O
tjova
zand
u17
3.0
15.0
234.
010
4.0
0.3
0.0
72.0
1080
.025
6.0
6.0
1.4
-O
vie
101.
07.
110
2.0
36.0
86.0
175.
035
5.9
75.3
17.0
0.1
WW
354
31P
os 1
148.
07.
774
.024
.038
.037
5.0
204.
89.
42.
10.
0W
W 3
5440
Pos
10
99.0
8.6
141.
060
.00.
20.
060
.042
2.0
292.
618
.04.
10.
0W
W 3
9907
Pos
11
51.0
3.8
24.0
9.8
0.0
11.0
25.0
182.
912
.62.
90.
1W
W 3
5432
Pos
211
4.0
8.9
64.0
31.0
0.0
21.0
210.
035
5.9
6.5
1.5
0.1
WW
354
33P
os 3
188.
05.
115
.06.
60.
123
.023
0.0
243.
811
.22.
50.
0W
W 3
5434
Pos
479
.06.
645
.019
.00.
032
.013
.031
6.9
72.2
16.3
0.1
WW
354
35P
os 5
107.
06.
960
.032
.00.
10.
030
.017
0.0
326.
734
.67.
80.
0W
W 3
5439
Pos
911
8.0
7.4
100.
039
.00.
055
.033
0.0
262.
18.
82.
0

Tech
nica
l Coo
pera
tion
Pro
ject
In
vest
igat
ion
of G
roun
dwat
er R
esou
rces
and
Airb
orne
-Geo
phys
ical
Inve
stig
atio
n of
Sel
ecte
d M
iner
al T
arge
ts in
Nam
ibia
G
roun
dwat
er In
vest
igat
ions
in th
e E
iseb
Gra
ben
Mai
n H
ydro
geol
ogic
al R
epor
t
Page
71
Par
t 2: C
onte
nts
in m
eq/l
(onl
y sa
mpl
es w
ith <
10%
ana
lytic
al e
rror)
PK_
IDBH
NO
BHN
OTE
Na_
meq
-lK
_meq
-lC
a_m
eq-l
Mg_
meq
-lFe
_meq
-lM
n_m
eq-l
Cl_
meq
-lS
O4_
meq
-lH
CO
3_m
eq-l
NO
3_m
eq-l
NO
2_m
eq-l
1405
6?
KAR
AP
I bor
ehol
e fo
und
by c
onsu
ltant
s in
199
126
.97
0.49
9.48
0.99
4.23
31.2
30.
050.
2914
083
WW
1665
3R
OO
IBO
KLA
G-8
7M K
AL.
TSU
MIS
19.5
70.
493.
748.
234.
6530
.19
0.09
0.25
-W
W16
666
RO
OIB
OK
LAG
30.2
30.
773.
748.
641.
9743
.72
0.10
0.04
4441
7W
W25
241
13.9
20.
339.
484.
948.
1825
.19
0.06
0.07
8841
WW
2544
219
.57
0.36
6.49
2.88
8.46
24.9
80.
080.
2588
42W
W25
462
OTJ
INO
KO
3.39
0.28
3.24
3.70
1.13
7.50
0.12
0.14
8843
WW
2546
6O
TJIN
OK
O
5.31
0.31
4.19
3.21
0.99
11.0
30.
090.
04W
W 1
0413
Agar
op P
os20
.70
0.46
13.4
27.
820.
000.
005.
1131
.56
4.30
0.46
0.00
WW
410
24BE
-25.
790.
234.
694.
030.
000.
001.
277.
254.
791.
100.
00W
W 4
1023
BE-1
A0.
910.
132.
201.
730.
000.
000.
340.
094.
000.
280.
01W
W 4
1023
BE-1
B0.
830.
102.
101.
560.
000.
000.
310.
063.
640.
420.
00-
Embo
nde
sout
h3.
350.
141.
000.
460.
000.
000.
390.
793.
240.
130.
00-
Otji
paru
4.39
0.18
5.04
5.02
0.00
0.00
3.02
4.21
5.63
0.32
0.00
WW
331
68O
tjita
zu5.
480.
540.
200.
230.
000.
000.
280.
215.
230.
290.
00-
Otjo
ahe
1.87
0.21
4.09
3.62
0.00
0.00
0.56
0.29
7.55
0.82
0.00
-O
tjora
2.74
0.17
0.70
0.51
0.00
0.00
0.28
0.25
3.06
0.11
0.00
-O
tjova
kura
112
.57
0.41
4.44
3.62
0.00
0.00
1.44
13.9
55.
990.
310.
01-
Otjo
vaku
ru 2
2.83
0.15
1.00
0.78
0.00
0.00
0.31
0.29
3.70
0.21
0.00
-O
tjova
zand
u7.
530.
3811
.68
8.56
0.01
0.00
2.03
22.4
94.
200.
100.
00-
Ovi
e4.
390.
185.
092.
960.
000.
002.
433.
645.
831.
210.
00W
W 3
5431
Pos
16.
440.
203.
691.
970.
000.
001.
077.
813.
360.
150.
00W
W 3
5440
Pos
104.
310.
227.
044.
940.
010.
001.
698.
794.
790.
290.
00W
W 3
9907
Pos
112.
220.
101.
200.
810.
000.
000.
310.
523.
000.
200.
00W
W 3
5432
Pos
24.
960.
233.
192.
550.
000.
000.
594.
375.
830.
110.
00W
W 3
5433
Pos
38.
180.
130.
750.
540.
000.
000.
654.
794.
000.
180.
00W
W 3
5434
Pos
43.
440.
172.
251.
560.
000.
000.
900.
275.
191.
160.
00W
W 3
5435
Pos
54.
650.
182.
992.
630.
000.
000.
853.
545.
350.
560.
00W
W 3
5439
Pos
95.
130.
194.
993.
210.
000.
001.
556.
874.
300.
140.
00

Tech
nica
l Coo
pera
tion
Pro
ject
In
vest
igat
ion
of G
roun
dwat
er R
esou
rces
and
Airb
orne
-Geo
phys
ical
Inve
stig
atio
n of
Sel
ecte
d M
iner
al T
arge
ts in
Nam
ibia
G
roun
dwat
er In
vest
igat
ions
in th
e E
iseb
Gra
ben
Mai
n H
ydro
geol
ogic
al R
epor
t
Page
72
Par
t 2: C
onte
nts
in m
eq%
(onl
y sa
mpl
es w
ith <
10%
ana
lytic
al e
rror
) P
K_I
DB
HN
OB
HN
OTE
Na_
meq
%K
_meq
%C
a_m
eq%
Mg_
meq
%Fe
_meq
%M
n_m
eq%
Cl_
meq
%S
O4_
meq
%H
CO
3_m
eq%
NO
3_m
eq%
1405
6?
KA
RA
PI b
oreh
ole
foun
d by
con
sulta
nts
in 1
991
71.1
11.
2825
.00
2.60
0.00
0.00
11.8
287
.24
0.14
0.80
1408
3W
W16
653
RO
OIB
OK
LAG
-87M
KA
L. T
SU
MIS
61.1
11.
5211
.68
25.6
90.
000.
0013
.23
85.8
00.
260.
71-
WW
1666
6R
OO
IBO
KLA
G69
.69
1.77
8.63
19.9
20.
000.
004.
3195
.39
0.23
0.08
4441
7W
W25
241
48.5
51.
1633
.07
17.2
20.
000.
0024
.39
75.1
30.
180.
2188
41W
W25
442
66.8
11.
2222
.14
9.83
0.00
0.00
25.0
473
.92
0.24
0.74
8842
WW
2546
2O
TJIN
OK
O31
.95
2.65
30.5
434
.87
0.00
0.00
12.6
483
.99
1.30
1.60
8843
WW
2546
6O
TJIN
OK
O
40.7
72.
3632
.21
24.6
60.
000.
008.
1190
.69
0.77
0.29
WW
104
13A
garo
p P
os48
.82
1.09
31.6
518
.43
0.00
0.00
12.3
276
.16
10.3
61.
11W
W 4
1024
BE
-239
.27
1.53
31.8
427
.37
0.00
0.00
8.80
50.2
333
.24
7.60
WW
410
23B
E-1
A18
.40
2.52
44.2
434
.81
0.02
0.00
7.16
1.94
84.5
45.
95W
W 4
1023
BE
-1 B
18.0
02.
2845
.64
34.0
50.
030.
006.
981.
4081
.78
9.56
-E
mbo
nde
sout
h67
.62
2.89
20.1
59.
300.
040.
008.
6517
.33
70.9
02.
75-
Otji
paru
30.0
31.
2134
.45
34.3
10.
010.
0022
.89
31.8
942
.72
2.46
WW
331
68O
tjita
zu84
.95
8.33
3.09
3.57
0.06
0.00
4.66
3.44
86.3
84.
72-
Otjo
ahe
19.1
02.
1241
.78
36.9
70.
040.
006.
113.
1681
.78
8.88
-O
tjora
66.4
94.
1016
.95
12.3
80.
090.
007.
596.
7282
.26
2.99
-O
tjova
kura
159
.73
1.94
21.1
017
.20
0.01
0.01
6.63
64.2
627
.61
1.43
-O
tjova
kuru
259
.41
3.17
20.9
716
.43
0.01
0.01
6.85
6.43
81.5
74.
55-
Otjo
vaza
ndu
26.7
31.
3641
.47
30.4
00.
040.
017.
0578
.04
14.5
60.
34-
Ovi
e34
.79
1.44
40.3
123
.46
0.00
0.00
18.4
827
.75
44.4
39.
25W
W 3
5431
Pos
152
.33
1.60
30.0
216
.05
0.00
0.00
8.65
63.0
027
.08
1.23
WW
354
40P
os 1
026
.09
1.33
42.6
329
.91
0.04
0.00
10.8
756
.43
30.8
01.
86W
W 3
9907
Pos
11
51.3
52.
2527
.72
18.6
70.
010.
007.
6712
.87
74.1
25.
04W
W 3
5432
Pos
245
.36
2.08
29.2
123
.33
0.01
0.00
5.43
40.0
653
.44
0.96
WW
354
33P
os 3
85.1
71.
367.
805.
660.
020.
006.
7349
.65
41.4
31.
87W
W 3
5434
Pos
446
.34
2.28
30.2
921
.09
0.01
0.00
11.9
63.
5968
.85
15.4
4W
W 3
5435
Pos
544
.49
1.69
28.6
225
.17
0.02
0.01
8.21
34.3
351
.94
5.41
WW
354
39P
os 9
37.9
61.
4036
.90
23.7
30.
010.
0012
.06
53.3
933
.38
1.10
Recommended