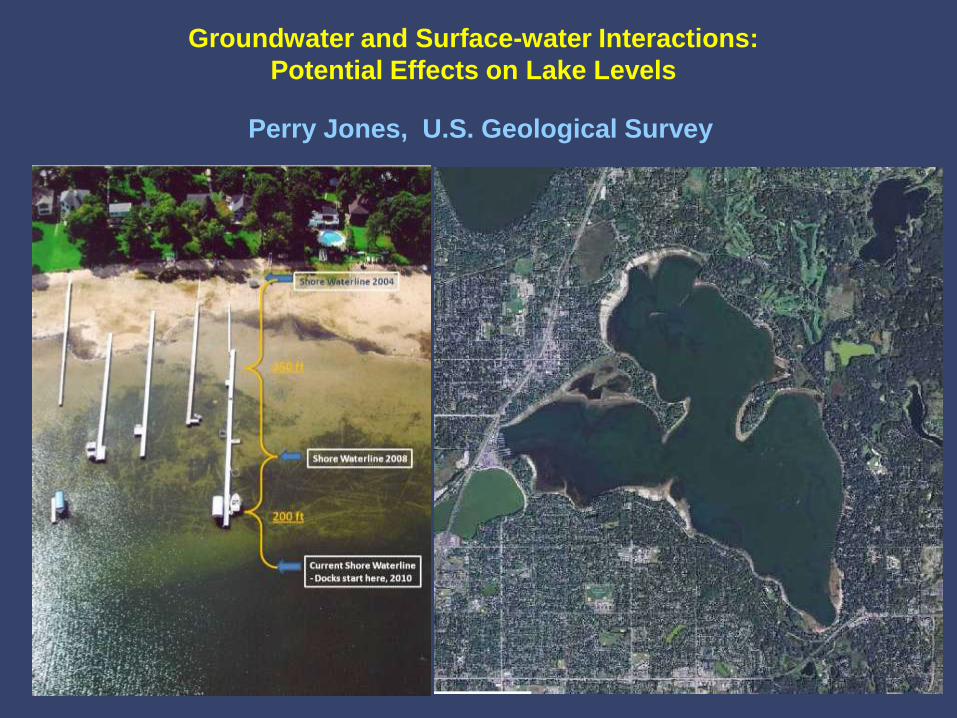
Groundwater and Surface-water Interactions:
Potential Effects on Lake Levels
Perry Jones, U.S. Geological Survey
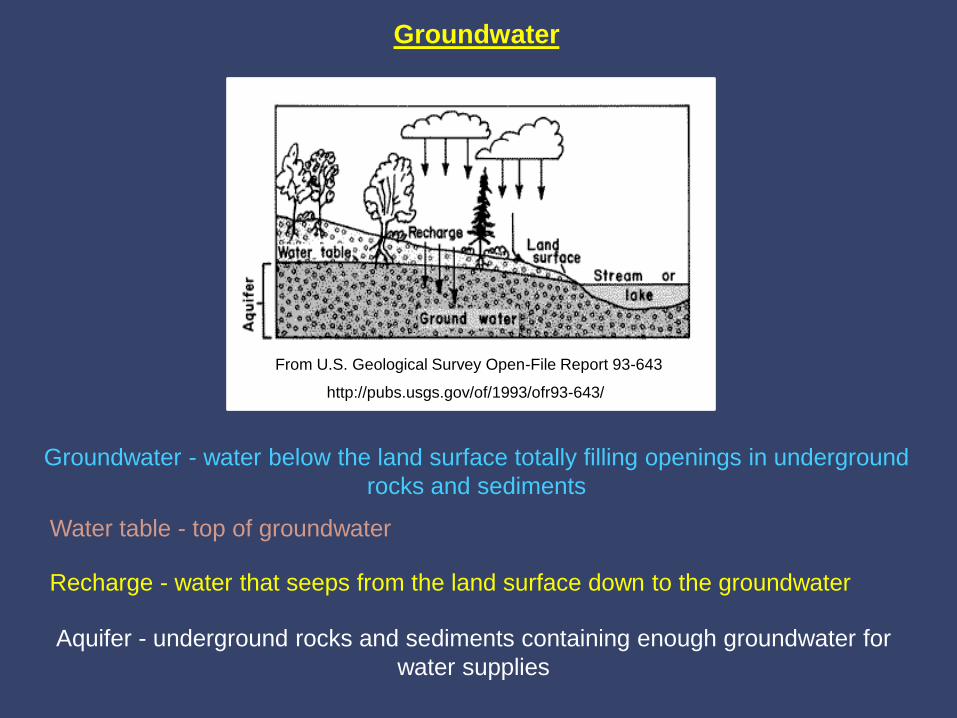
Groundwater
Groundwater - water below the land surface totally filling openings in underground
rocks and sediments
http://pubs.usgs.gov/of/1993/ofr93-643/
From U.S. Geological Survey Open-File Report 93-643
Recharge - water that seeps from the land surface down to the groundwater
Aquifer - underground rocks and sediments containing enough groundwater for
water supplies
Water table - top of groundwater
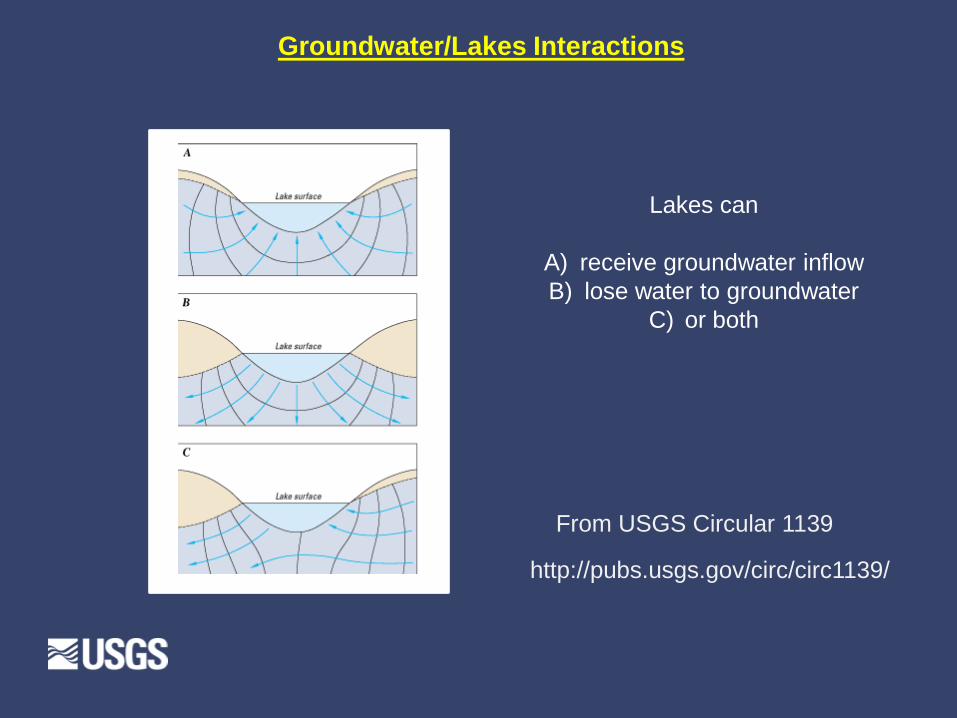
Groundwater/Lakes Interactions
Lakes can
A) receive groundwater inflow
B) lose water to groundwater
C) or both
http://pubs.usgs.gov/circ/circ1139/
From USGS Circular 1139
Factors Controlling Lake Levels
Lake Water Balance Components
Physical Characteristics of Lake
Watershed Area – Surface and Groundwater
Surface Water Connections – open vs. closed basin
Groundwater Connections
Size – Area and Volume
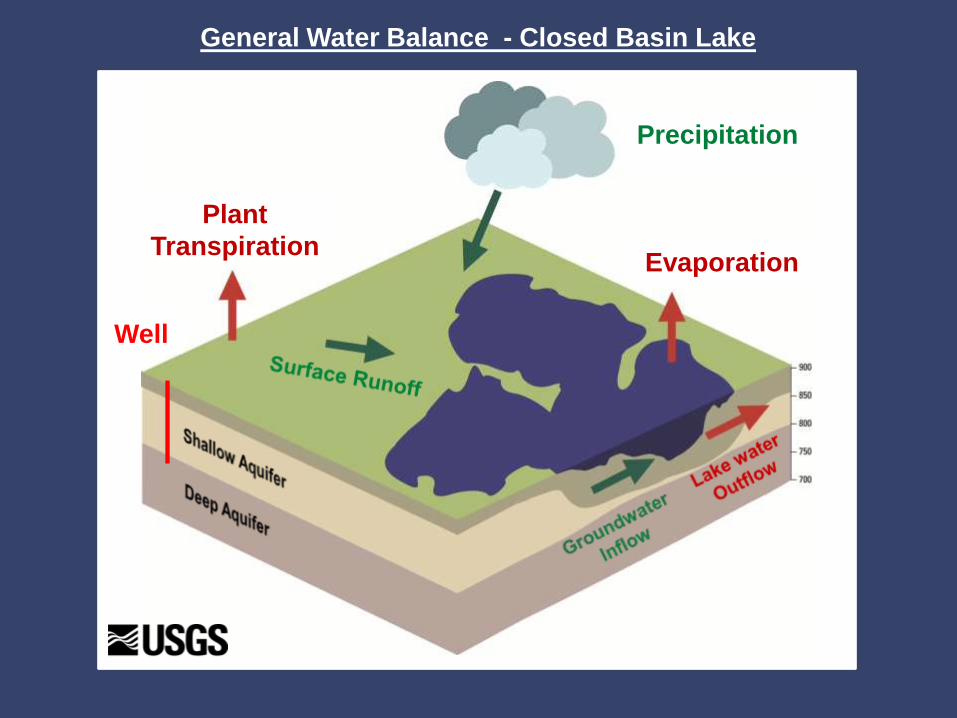
General Water Balance - Closed Basin Lake
Precipitation
Evaporation
Plant
Transpiration
Well
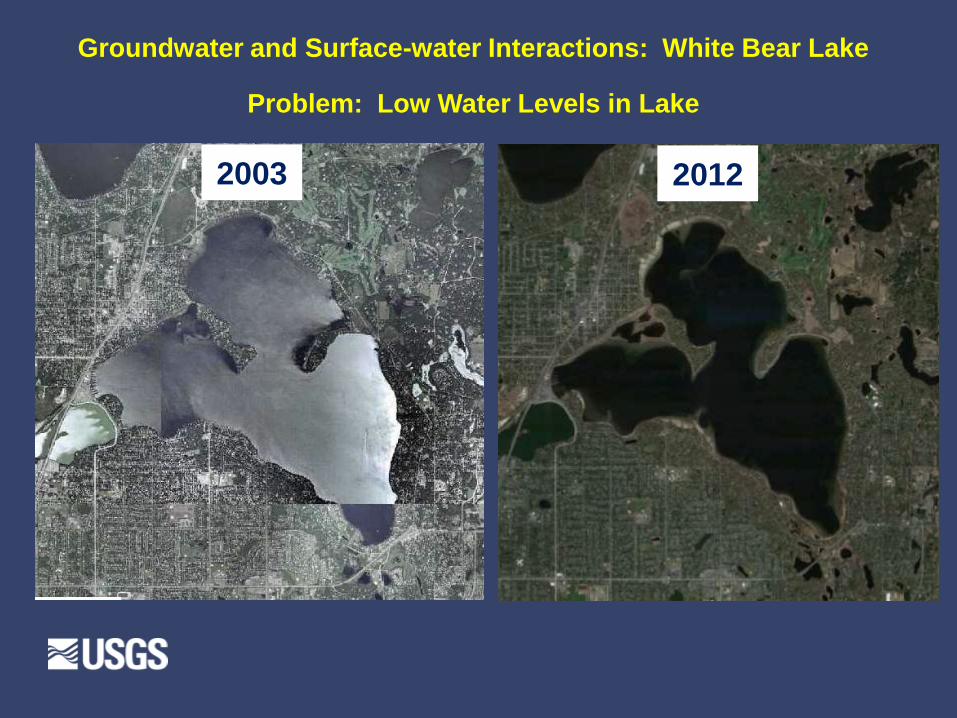
Problem: Low Water Levels in Lake
2012 2003
Groundwater and Surface-water Interactions: White Bear Lake
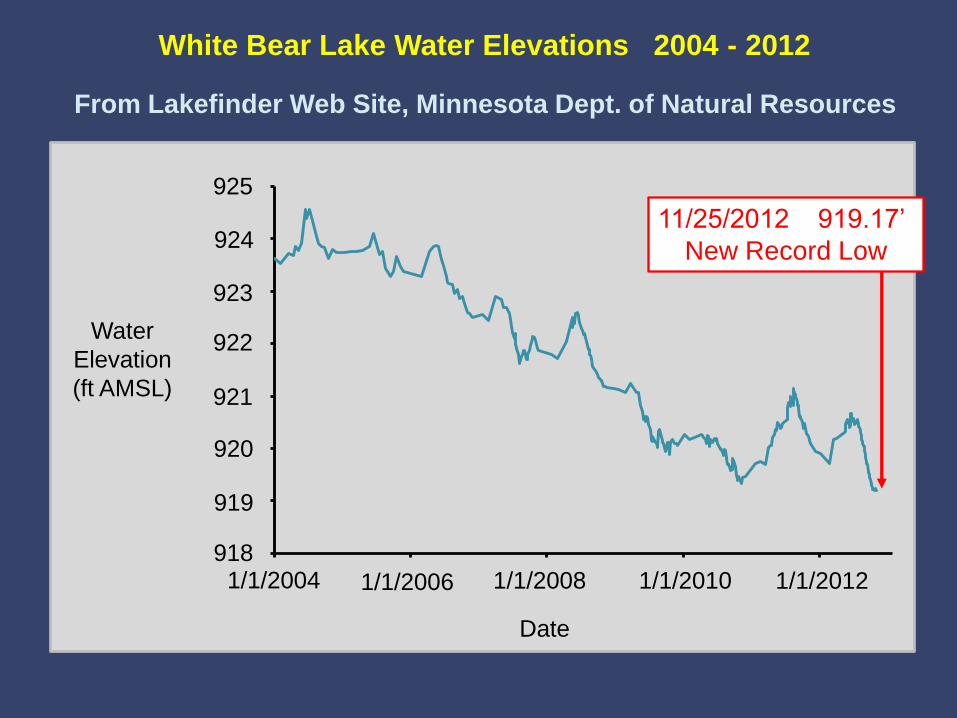
White Bear Lake Water Elevations 2004 - 2012
918
919
920
921
922
923
924
925
1/1/2004 12/31/2005 1/1/2008 1/1/2010 1/2/2012
Water
Elevation
(ft AMSL)
1/1/2004 2006 2008 2010 2012
925
Date
924
923
922
921
920
919
918
From Lakefinder Web Site, Minnesota Dept. of Natural Resources
11/25/2012 919.17’
New Record Low
1/1/2006 1/1/2008 1/1/2010 1/1/2012
Water
Elevation
(ft AMSL)
Annual
Precipitation
(in)
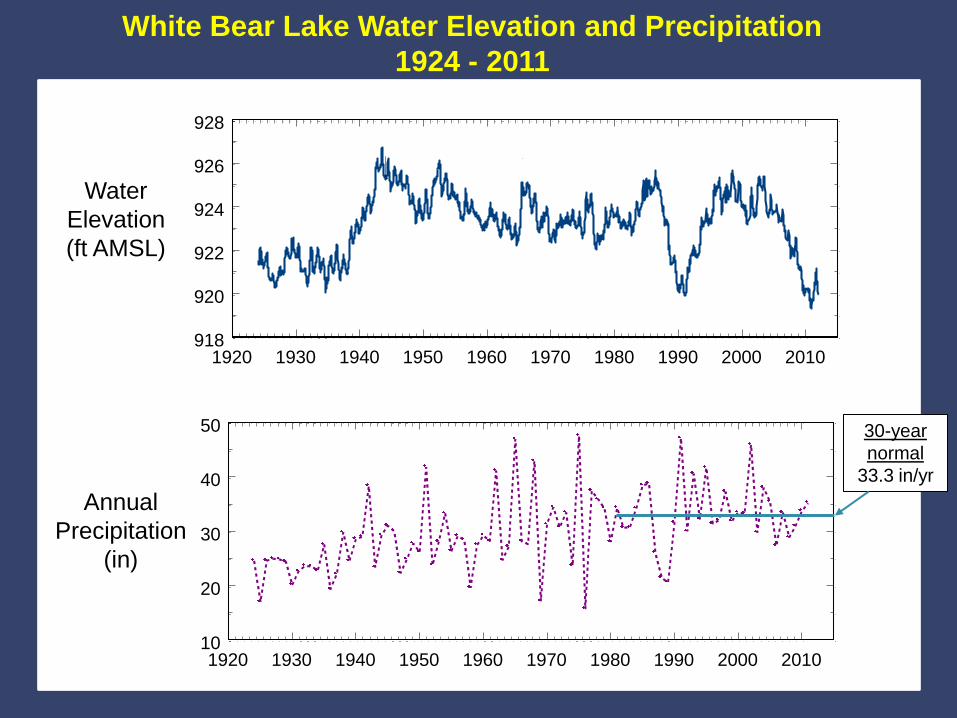
White Bear Lake Water Elevation and Precipitation
1924 - 2011
1920 1930 1940 1950 1960 1970 1980 1990 2000 2010918
920
922
924
926
928
1951-1980 avg =30.73 in/yr
1920 1930 1940 1950 1960 1970 1980 1990 2000 201010
20
30
40
50
Ordinary High Water Line
30-year
normal
33.3 in/yr
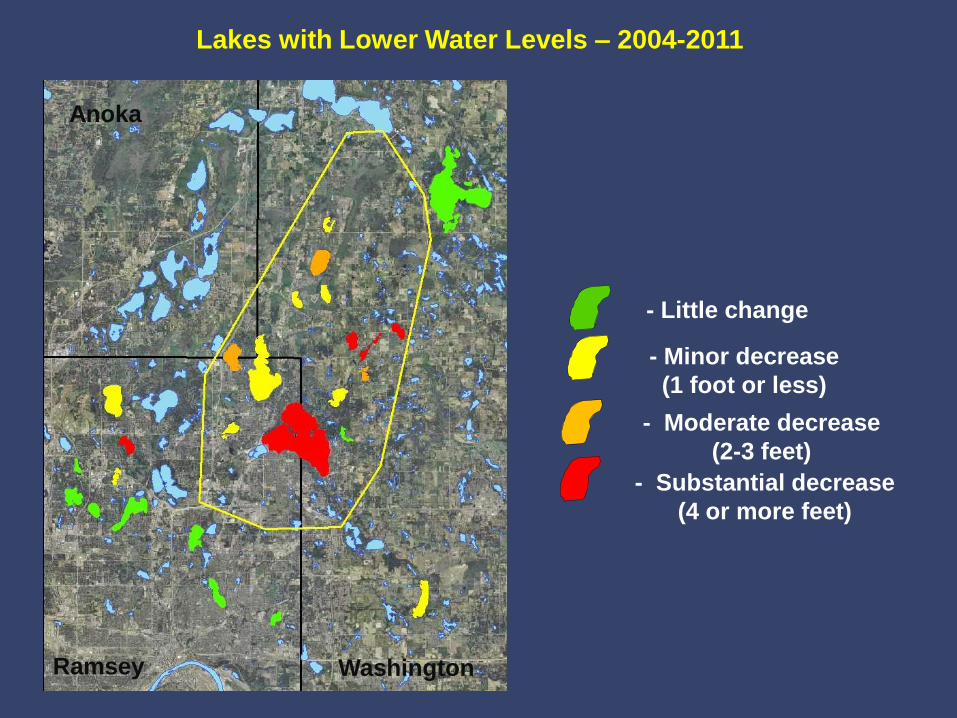
- Little change
- Minor decrease
(1 foot or less)
- Moderate decrease
(2-3 feet)
- Substantial decrease
(4 or more feet)
Lakes with Lower Water Levels – 2004-2011
Ramsey Washington
Anoka
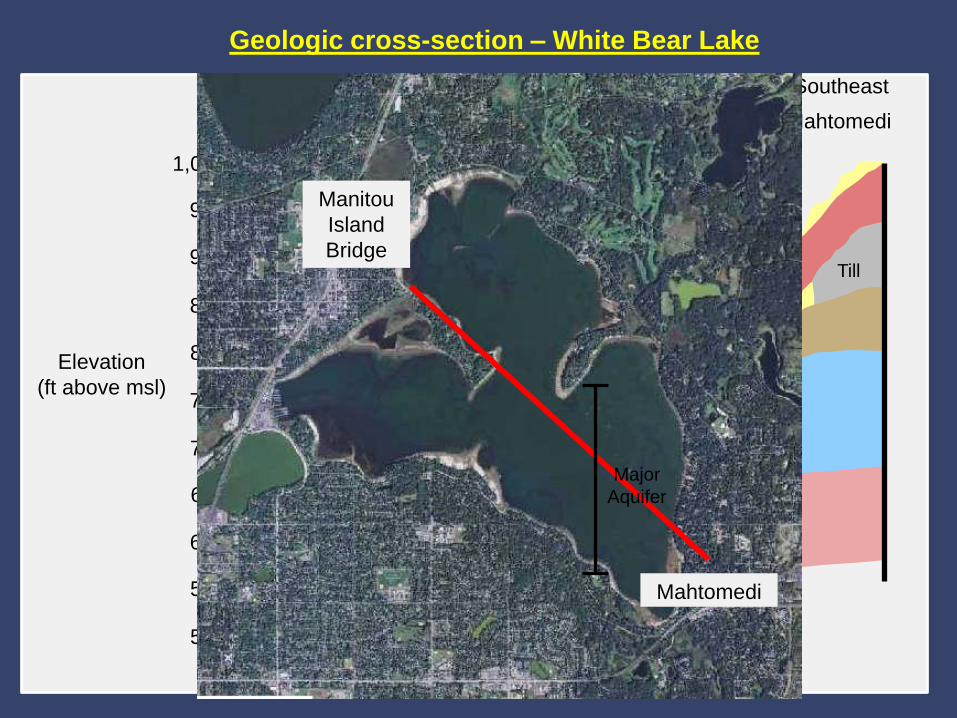
Geologic cross-section – White Bear Lake
Elevation
(ft above msl)
950
1,000
550
500
600
900
850
800
750
700
650
Manitou Island
Bridge
Mahtomedi
Prairie du Chien Group
St. Peter Sandstone
Glacial Till (Superior)
White Bear Lake
Glacial Till
(Undifferentiated)
Till
Jordan Sandstone
St. Lawrence Formation
Till
Southeast Northwest
Mahtomedi
Manitou
Island
Bridge
Major
Aquifer
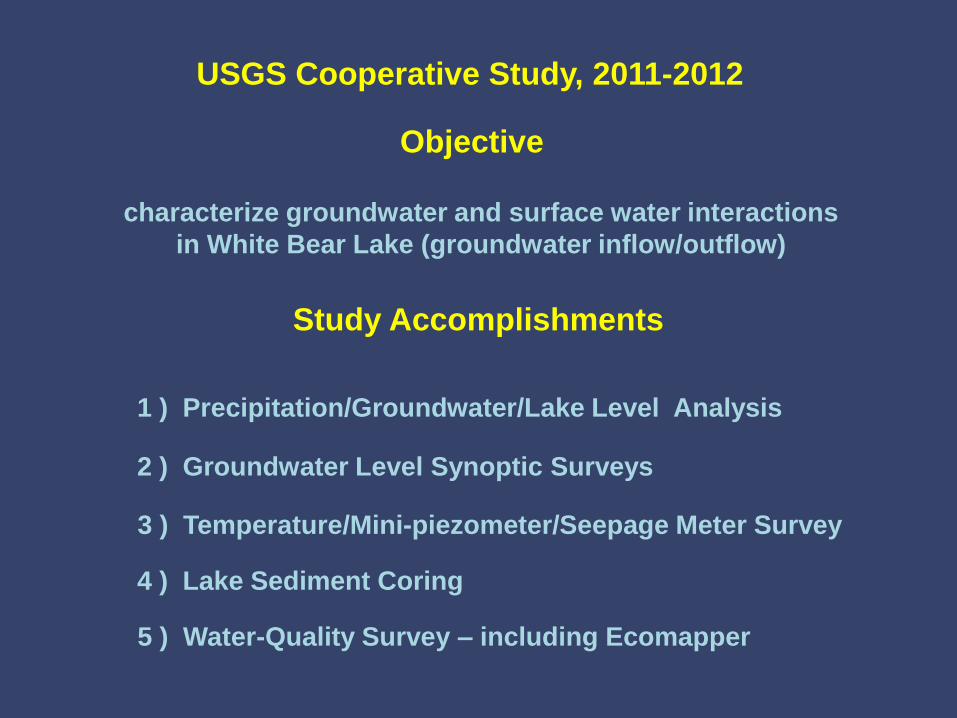
USGS Cooperative Study, 2011-2012
Objective
Study Accomplishments
characterize groundwater and surface water interactions
in White Bear Lake (groundwater inflow/outflow)
2 ) Groundwater Level Synoptic Surveys
3 ) Temperature/Mini-piezometer/Seepage Meter Survey
1 ) Precipitation/Groundwater/Lake Level Analysis
4 ) Lake Sediment Coring
5 ) Water-Quality Survey – including Ecomapper
Water
Elevation
(ft AMSL)
Annual
Precipitation
(in)
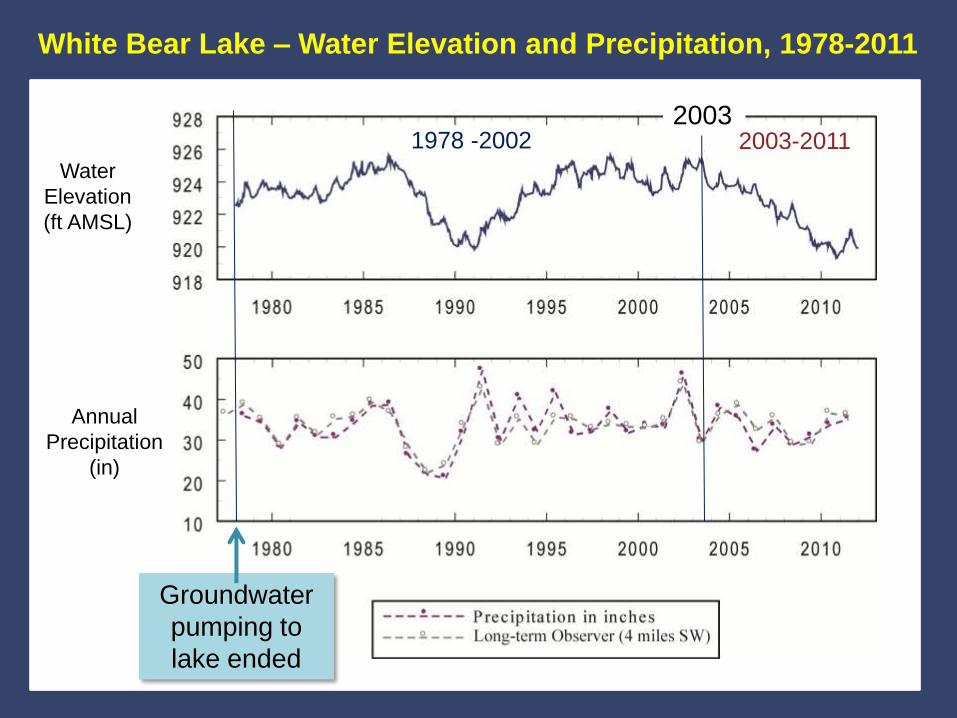
White Bear Lake – Water Elevation and Precipitation, 1978-2011
2003
Groundwater
pumping to
lake ended
1978 -2002 2003-2011
15 20 25 30 35 40 45 50
-2
-1
0
1
2 1978-2002
2003-2011
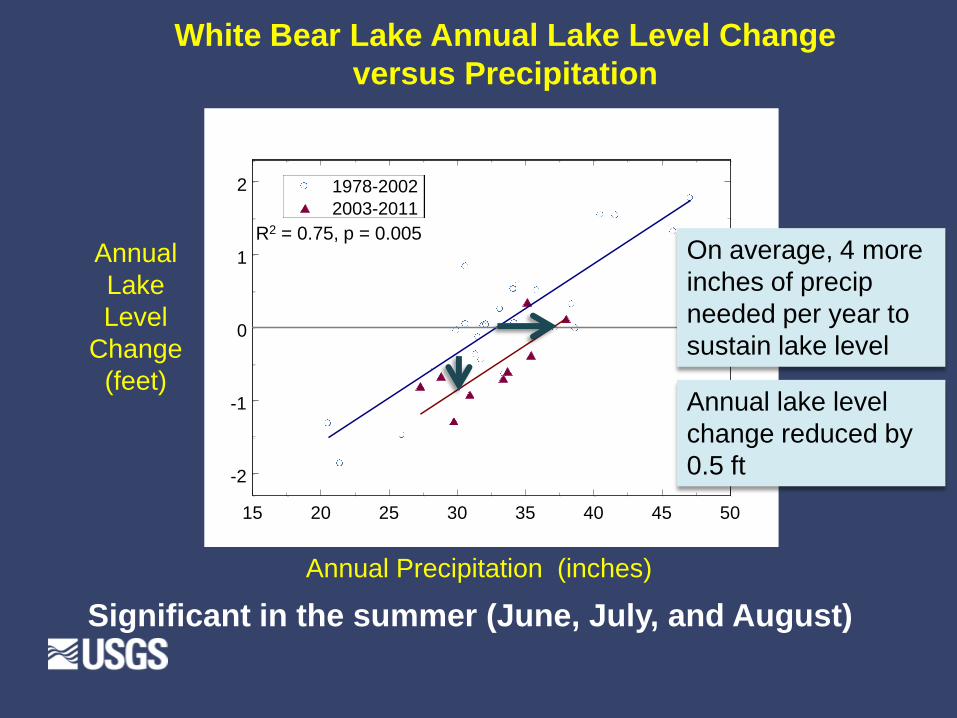
White Bear Lake Annual Lake Level Change
versus Precipitation
Annual lake level
change reduced by
0.5 ft
On average, 4 more
inches of precip
needed per year to
sustain lake level
Annual Precipitation (inches)
Annual
Lake
Level
Change
(feet)
Significant in the summer (June, July, and August)
R2 = 0.75, p = 0.005
0 1 20.5 Miles
!(!(
!( !(
!(
Washington
Ramsey
Anoka
0 1 20.5 Miles
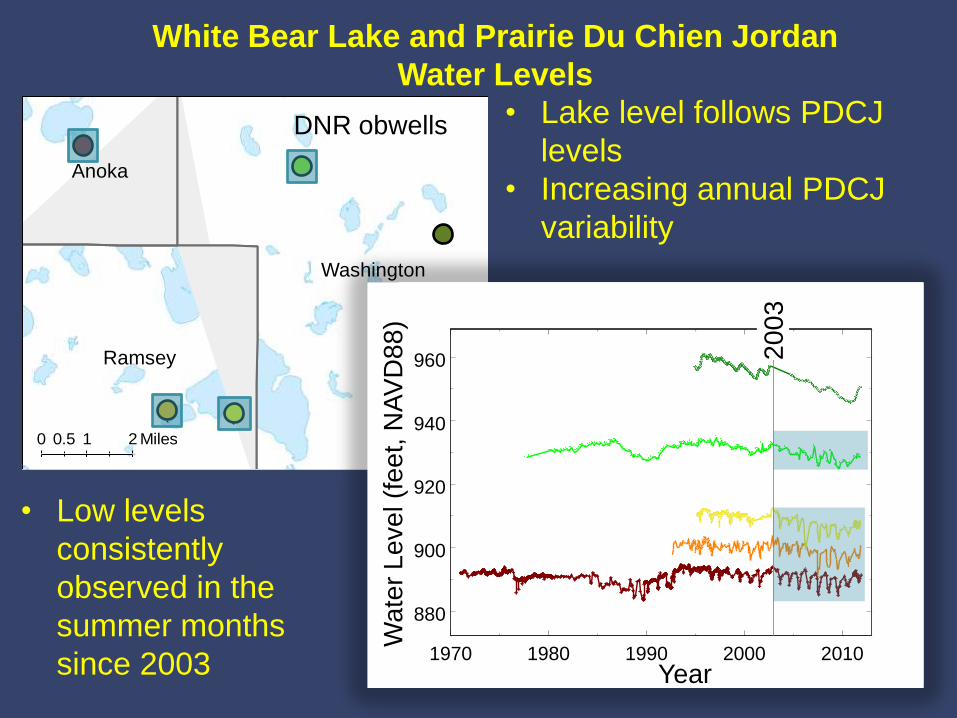
White Bear Lake and Prairie Du Chien Jordan
Water Levels
1970 1980 1990 2000 2010
880
900
920
940
960
Year
Wa
ter
Le
ve
l (f
ee
t, N
AV
D8
8)
• Lake level follows PDCJ
levels
• Increasing annual PDCJ
variability
20
03
DNR obwells
• Low levels
consistently
observed in the
summer months
since 2003
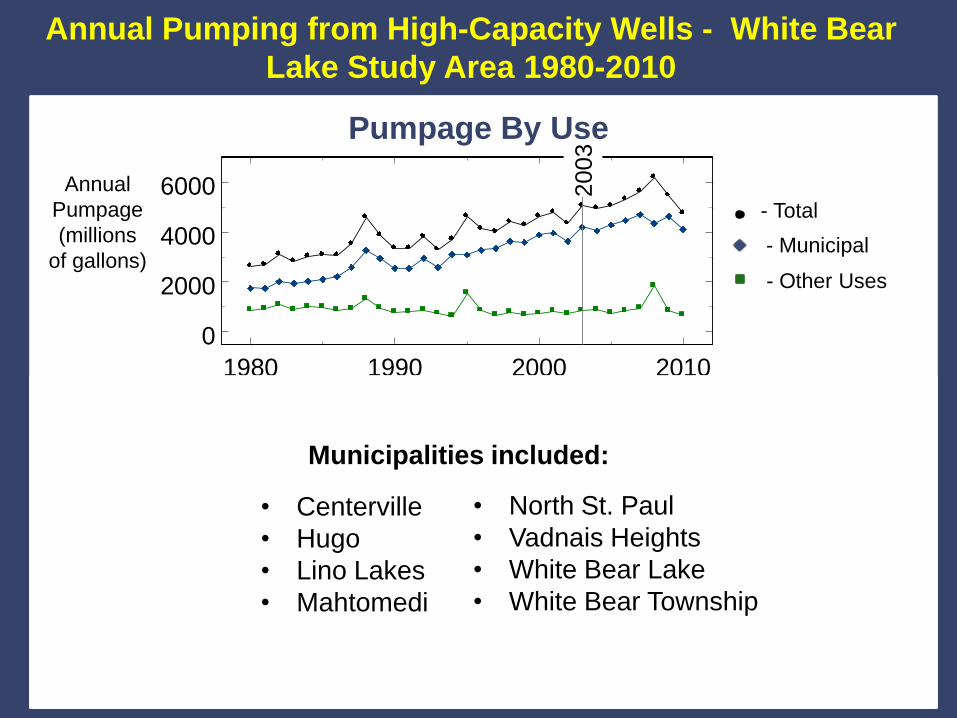
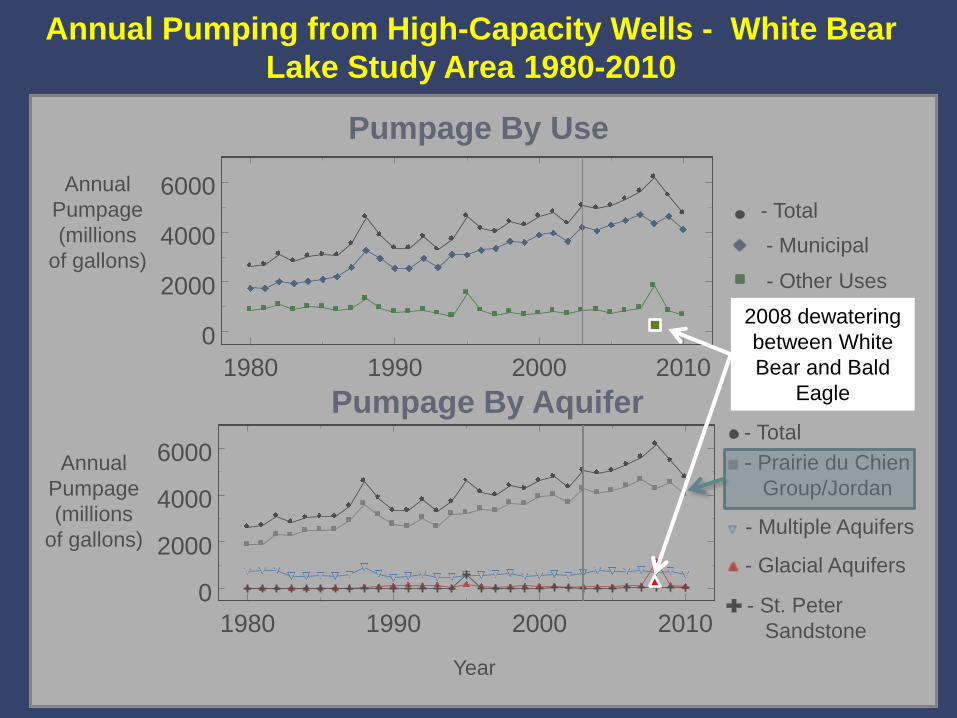
Annual Pumping from High-Capacity Wells - White Bear
Lake Study Area 1980-2010
Annual
Pumpage
(millions
of gallons) - Municipal
- Other Uses
1980 1990 2000 2010
0
2000
4000
6000
1980 1990 2000 2010
0
2000
4000
6000
Year
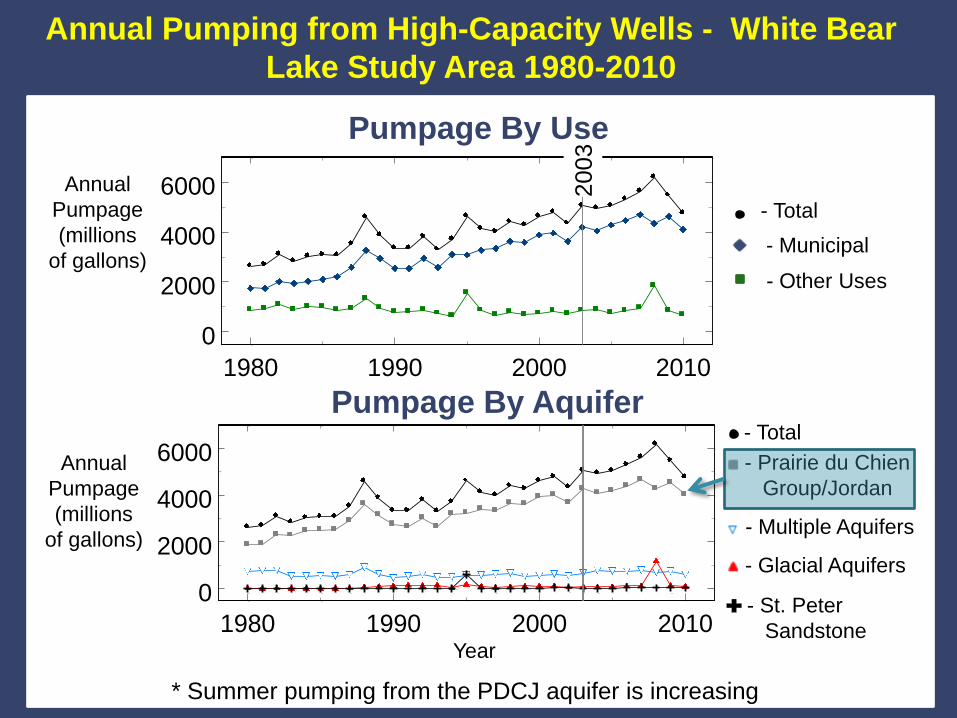
Pumpage By Use
Pumpage By Aquifer
Annual
Pumpage
(millions
of gallons)
- Total
- Total
- Prairie du Chien
Group/Jordan
- Multiple Aquifers
- Glacial Aquifers
- St. Peter
Sandstone
2003
• Centerville
• Hugo
• Lino Lakes
• Mahtomedi
• North St. Paul
• Vadnais Heights
• White Bear Lake
• White Bear Township
Municipalities included:
Annual Pumping from High-Capacity Wells - White Bear
Lake Study Area 1980-2010
Annual
Pumpage
(millions
of gallons) - Municipal
- Other Uses
1980 1990 2000 2010
0
2000
4000
6000
1980 1990 2000 2010
0
2000
4000
6000
Year
Pumpage By Use
Pumpage By Aquifer
Annual
Pumpage
(millions
of gallons)
- Total
- Total
- Prairie du Chien
Group/Jordan
- Multiple Aquifers
- Glacial Aquifers
- St. Peter
Sandstone
2003
* Summer pumping from the PDCJ aquifer is increasing
Observed Lake Level
2003 2004 2005 2006 2007 2008 2009 2010 2011 2012
918
920
922
924
926
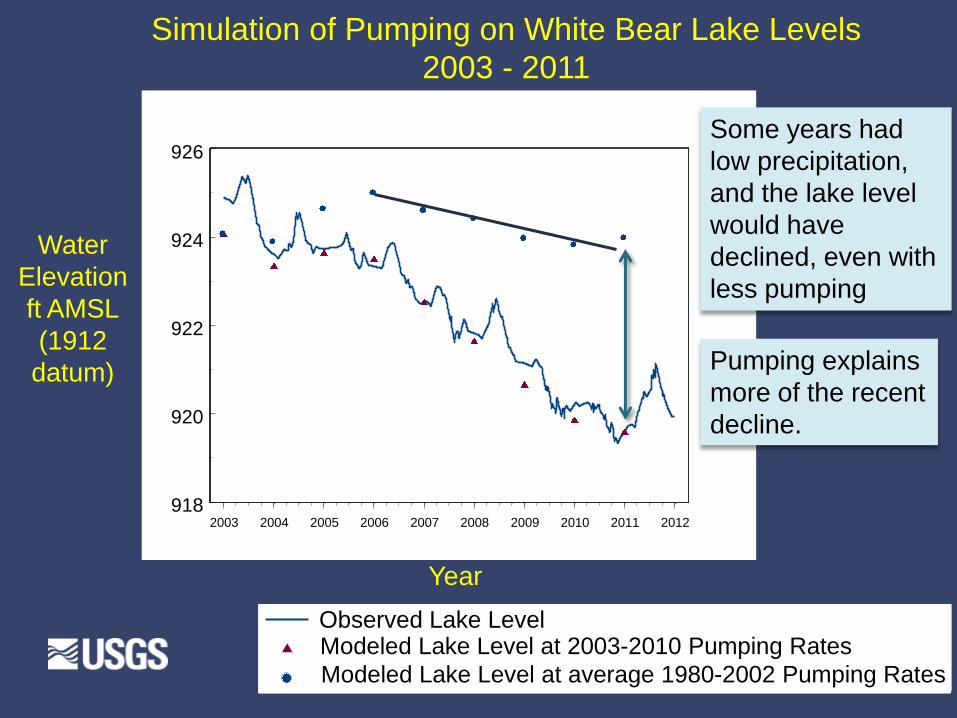
Simulation of Pumping on White Bear Lake Levels
2003 - 2011
Year
Water
Elevation
ft AMSL
(1912
datum)
2003 2004 2005 2006 2007 2008 2009 2010 2011 2012
918
920
922
924
926
2003 2004 2005 2006 2007 2008 2009 2010 2011 2012
918
920
922
924
926
Observed Lake Level
Predicted Values Actual 2003 - 2010 Pumping Conditions
Observed Lake Level
Predicted Values Actual 2003 - 2010 Pumping Conditions
Predicted Values at 1980-2002 Average Pumping Rates
Some years had
low precipitation,
and the lake level
would have
declined, even with
less pumping
Pumping explains
more of the recent
decline.
Observed Lake Level Modeled Lake Level at 2003-2010 Pumping Rates
Modeled Lake Level at average 1980-2002 Pumping Rates
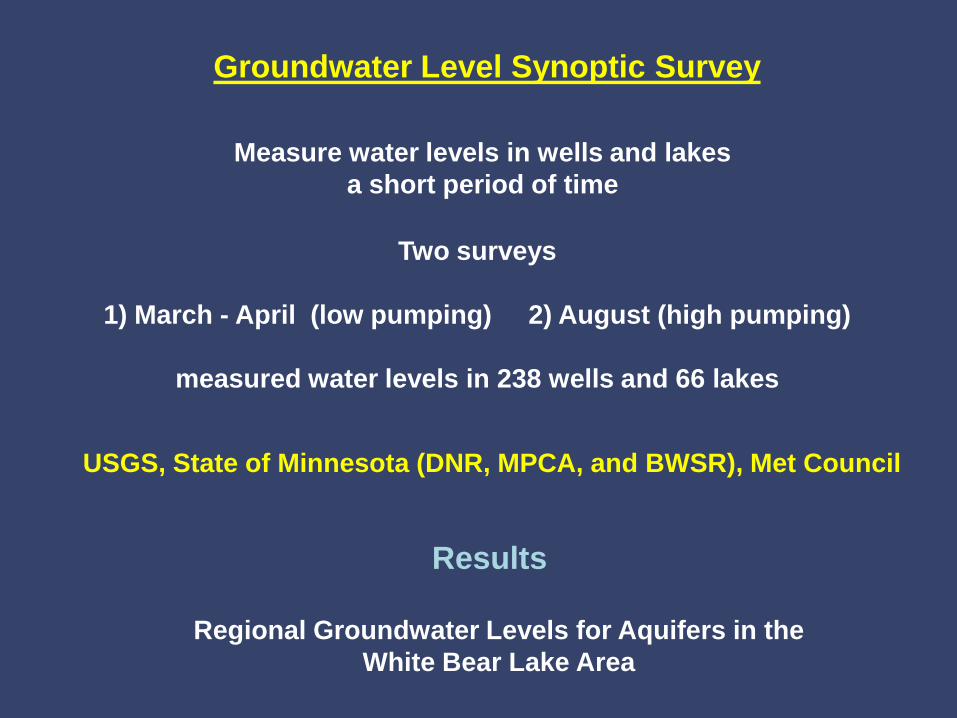
Groundwater Level Synoptic Survey
Measure water levels in wells and lakes
a short period of time
Results
Two surveys
1) March - April (low pumping) 2) August (high pumping)
measured water levels in 238 wells and 66 lakes
Regional Groundwater Levels for Aquifers in the
White Bear Lake Area
USGS, State of Minnesota (DNR, MPCA, and BWSR), Met Council
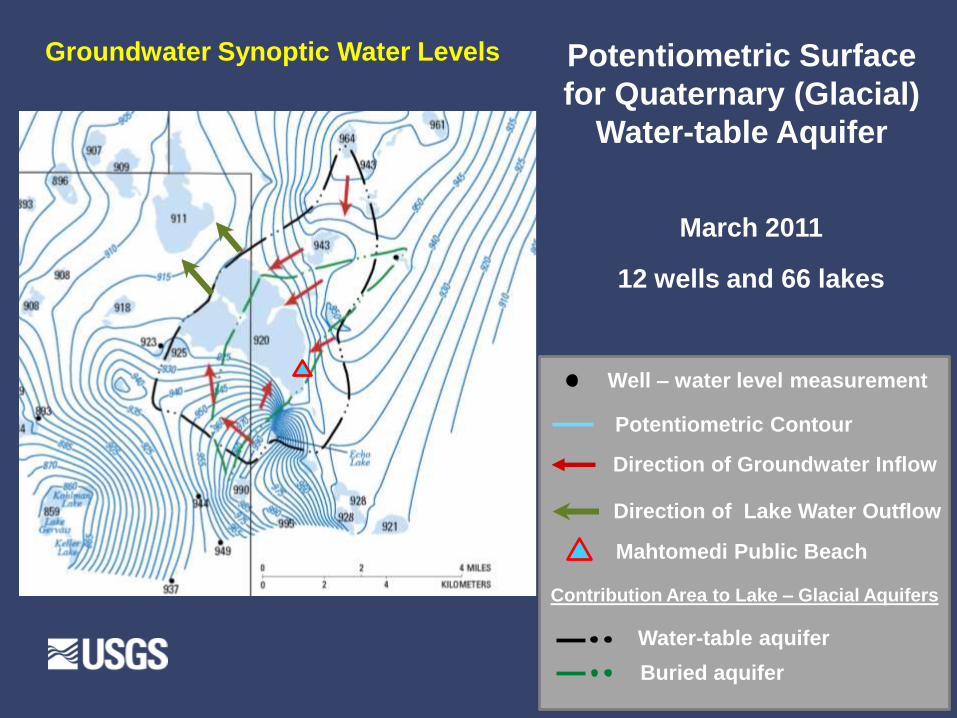
Potentiometric Surface
for Quaternary (Glacial)
Water-table Aquifer
March 2011
12 wells and 66 lakes
Contribution Area to Lake – Glacial Aquifers
Well – water level measurement
Direction of Groundwater Inflow
Direction of Lake Water Outflow
Potentiometric Contour
Water-table aquifer
Buried aquifer
Groundwater Synoptic Water Levels
Mahtomedi Public Beach
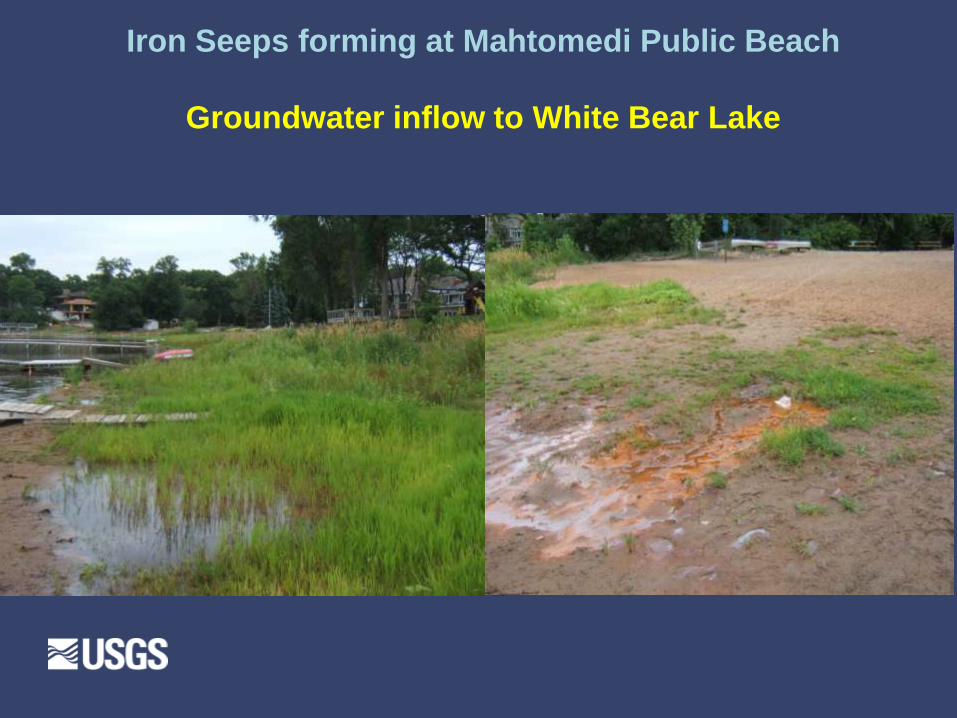
Iron Seeps forming at Mahtomedi Public Beach
Groundwater inflow to White Bear Lake
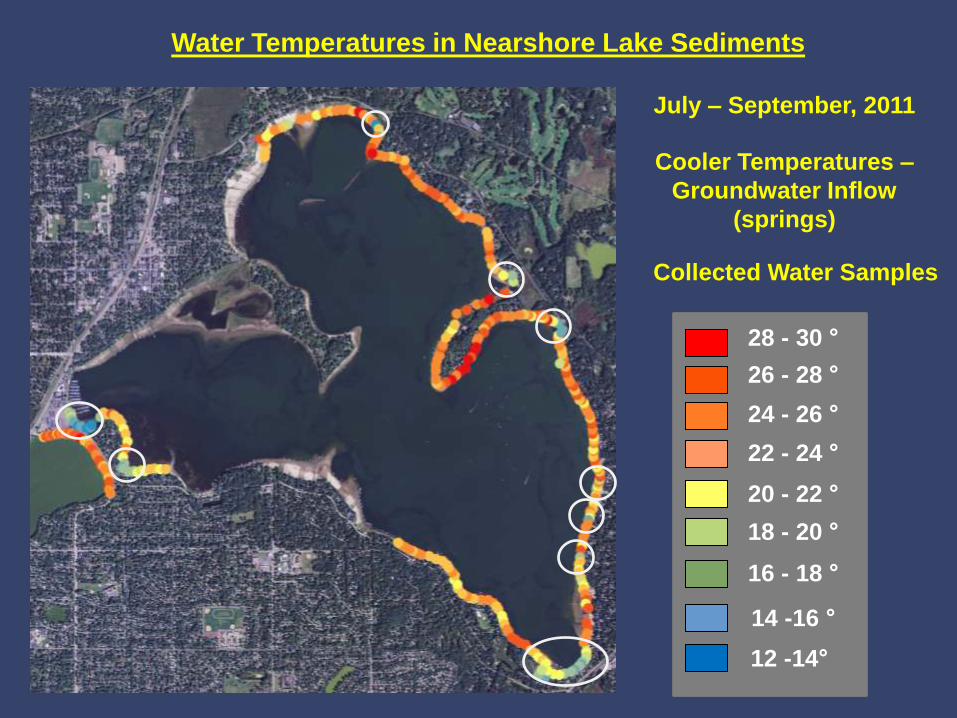
July – September, 2011
Water Temperatures in Nearshore Lake Sediments
16 - 18 °
14 -16 °
12 -14°
18 - 20 °
20 - 22 °
22 - 24 °
24 - 26 °
26 - 28 °
28 - 30 °
Cooler Temperatures –
Groundwater Inflow
(springs)
Collected Water Samples
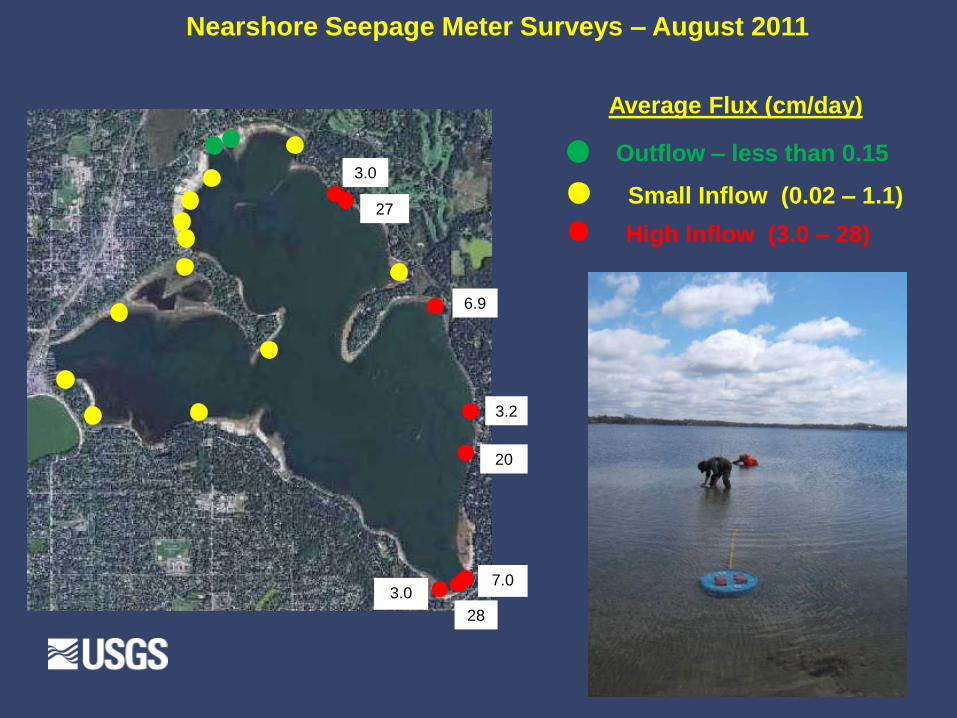
Nearshore Seepage Meter Surveys – August 2011
Average Flux (cm/day)
Outflow – less than 0.15
3.0
28
7.0
20
3.2
6.9
27
3.0
Small Inflow (0.02 – 1.1)
High Inflow (3.0 – 28)
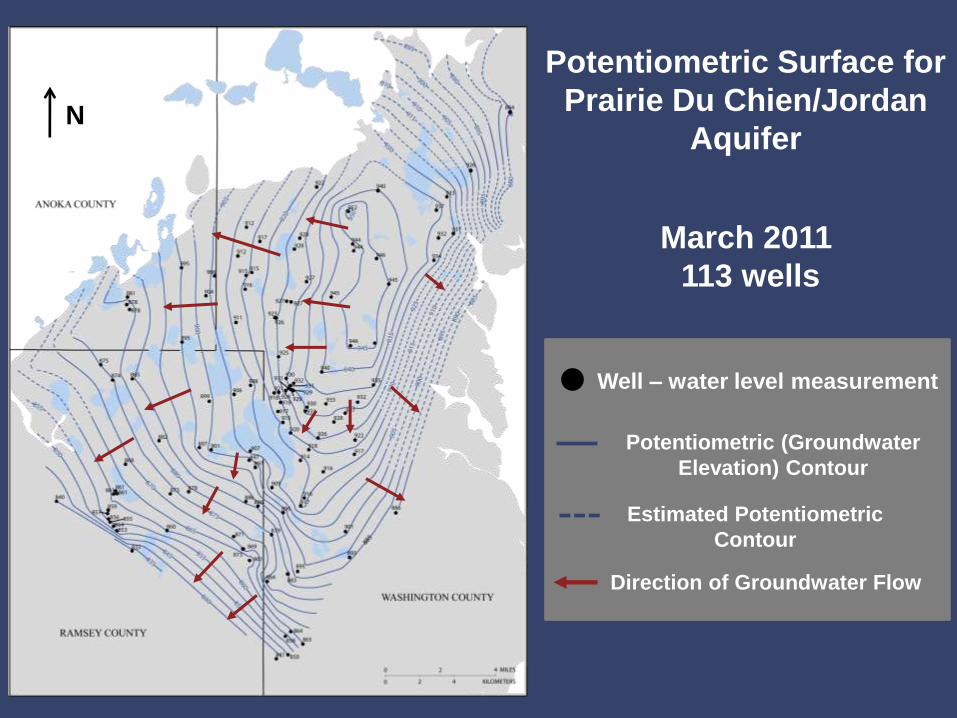
Potentiometric Surface for
Prairie Du Chien/Jordan
Aquifer
March 2011
113 wells
Well – water level measurement
Potentiometric (Groundwater
Elevation) Contour
Estimated Potentiometric
Contour
N
Direction of Groundwater Flow
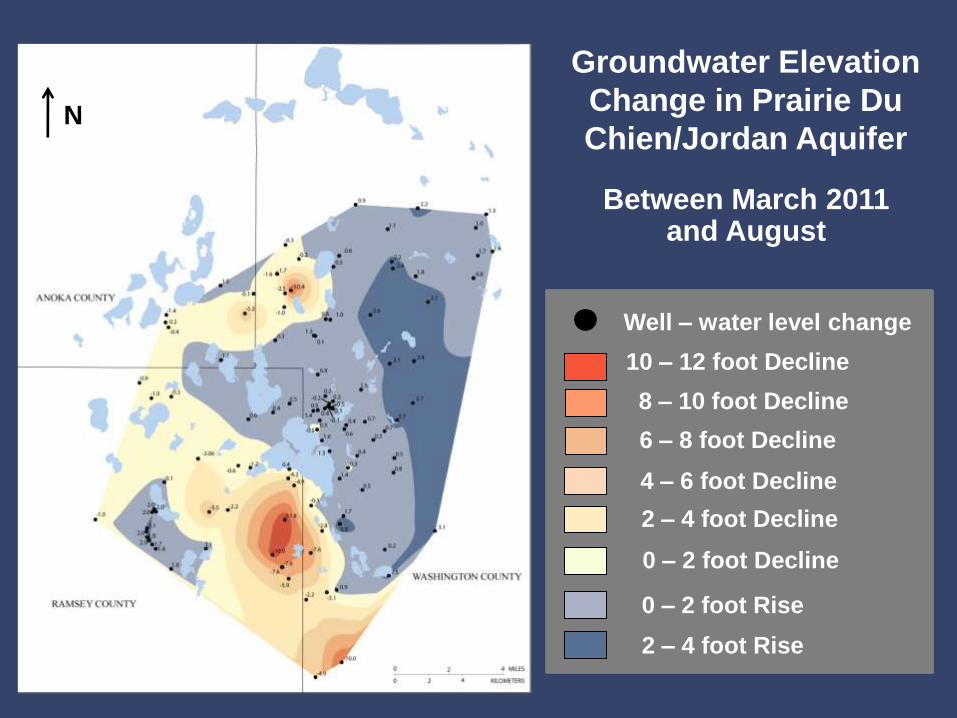
Groundwater Elevation
Change in Prairie Du
Chien/Jordan Aquifer
Between March 2011 and August
N
Well – water level change
0 – 2 foot Decline
0 – 2 foot Rise
2 – 4 foot Rise
2 – 4 foot Decline
4 – 6 foot Decline
6 – 8 foot Decline
8 – 10 foot Decline
10 – 12 foot Decline
Stable Isotopes – Lake Hydrology
Isotopes – “heavy” and “light” forms of the same chemical
element, i.e. hydrogen, oxygen
Hydrology
Use isotopic ratios to
identify sources and mixtures of waters
Compare
“Light/Heavy” Hydrogen ratio vs “Light/Heavy” Oxygen ratio
Snow, rain, lake water, and well water samples
What are stable isotopes?
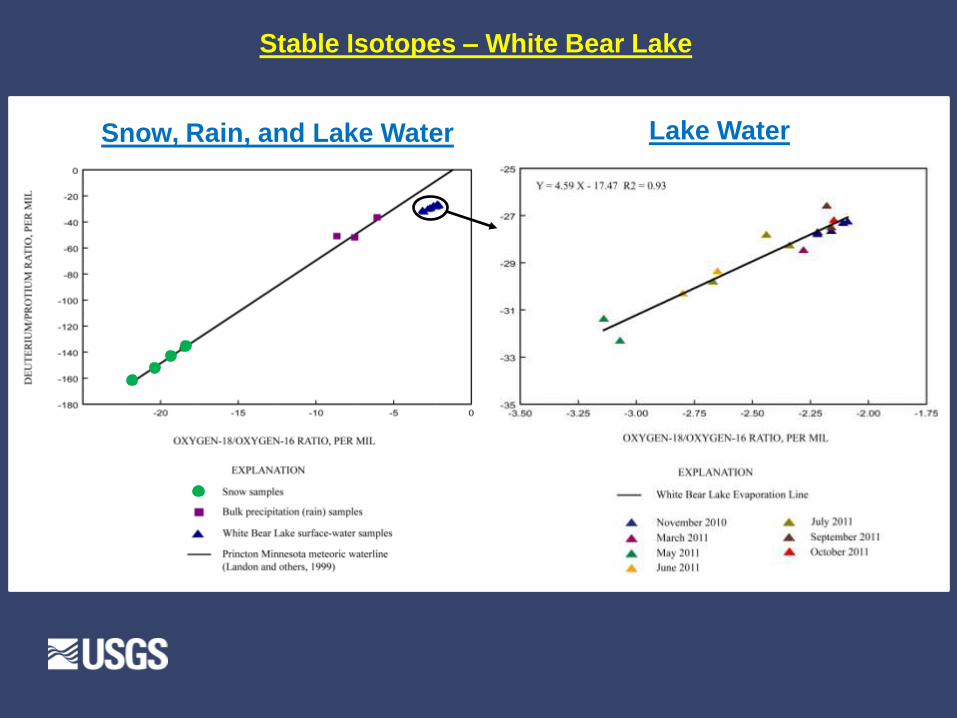
Stable Isotopes – White Bear Lake
Snow, Rain, and Lake Water Lake Water
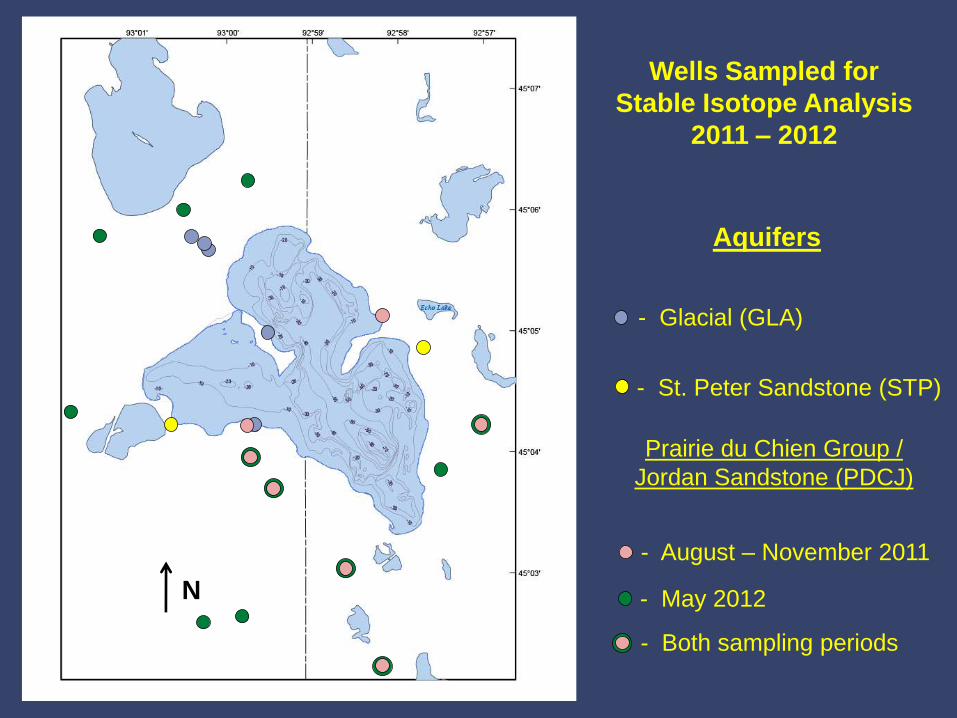
Wells Sampled for
Stable Isotope Analysis
2011 – 2012
Aquifers
- Glacial (GLA)
- St. Peter Sandstone (STP)
Prairie du Chien Group /
Jordan Sandstone (PDCJ)
N
- August – November 2011
- May 2012
- Both sampling periods
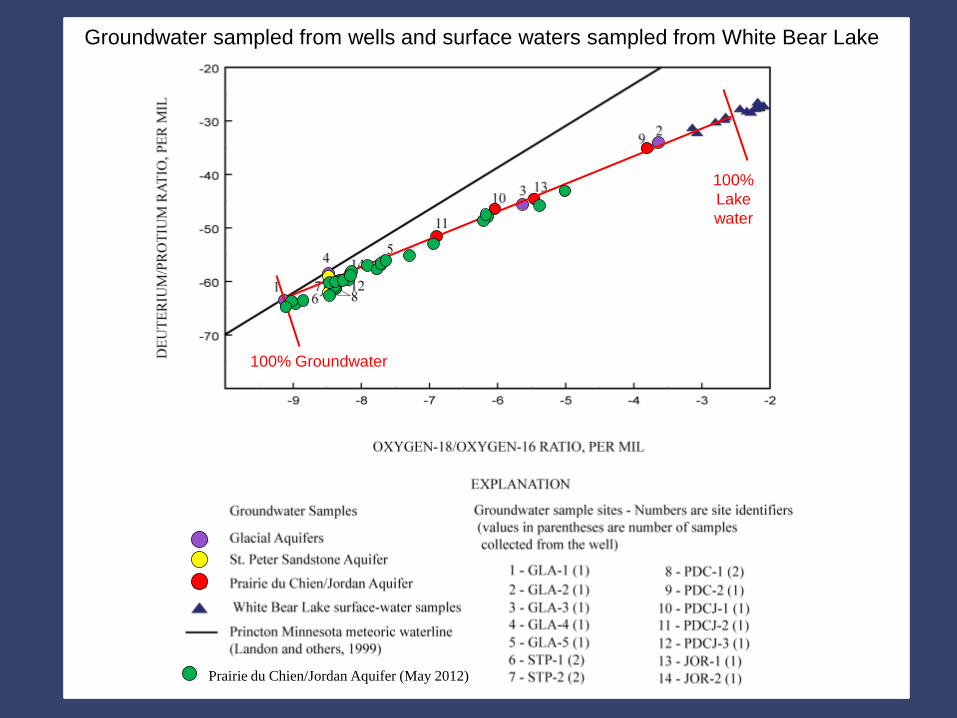
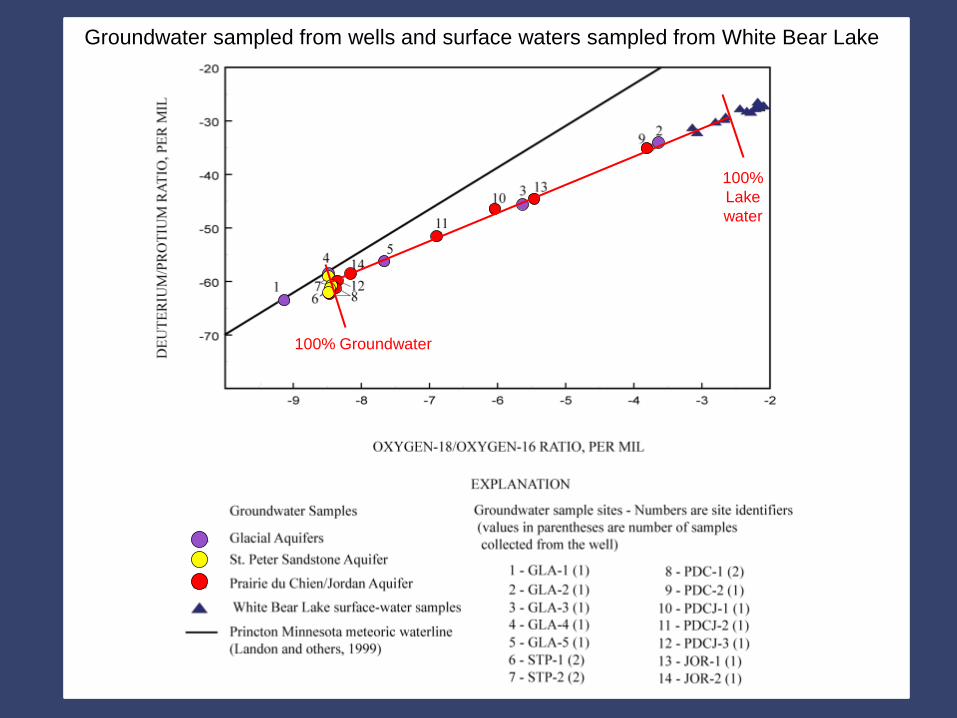
Groundwater sampled from wells and surface waters sampled from White Bear Lake
100% Groundwater
100%
Lake
water
Prairie du Chien/Jordan Aquifer (May 2012)
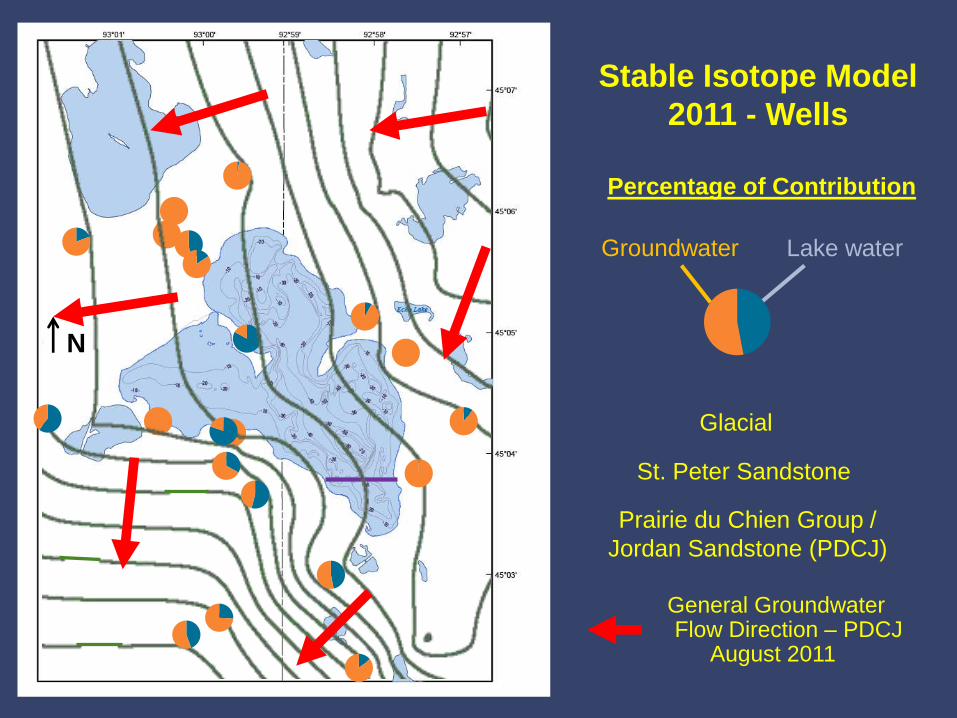
Stable Isotope Model
2011 - Wells
Percentage of Contribution
N
St. Peter Sandstone
Glacial
Groundwater Lake water
General Groundwater Flow Direction – PDCJ
August 2011
Prairie du Chien Group /
Jordan Sandstone (PDCJ)
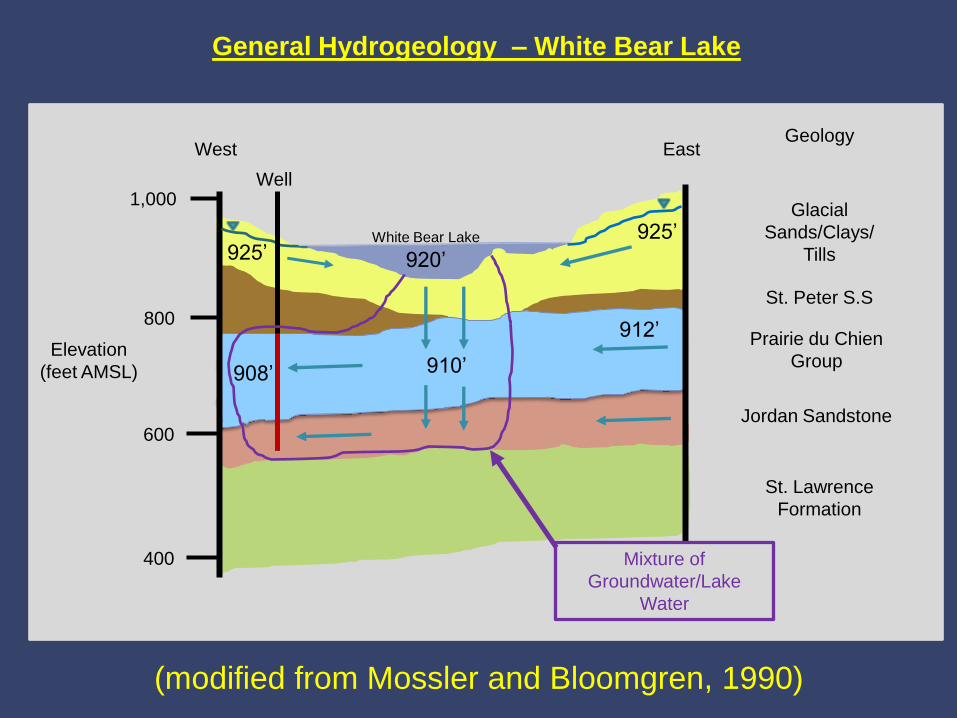
General Hydrogeology – White Bear Lake
1,000
1,000
800
600
400
Elevation
(feet AMSL)
Geology
White Bear Lake
Glacial
Sands/Clays/
Tills
St. Peter S.S
Prairie du Chien
Group
Jordan Sandstone
St. Lawrence
Formation
West East
Well
Mixture of
Groundwater/Lake
Water
(modified from Mossler and Bloomgren, 1990)
920’ 925’ 925’
912’
910’ 908’

Conclusions on White Bear Lake
Low lake levels can be explained by higher
regional pumping and lower precipitation
Groundwater flows into the lake from glacial
sediments
Lake water flows out and reaches wells in Prairie
du Chien/Jordan and glacial aquifers
Any Questions?
Extra Slides
33
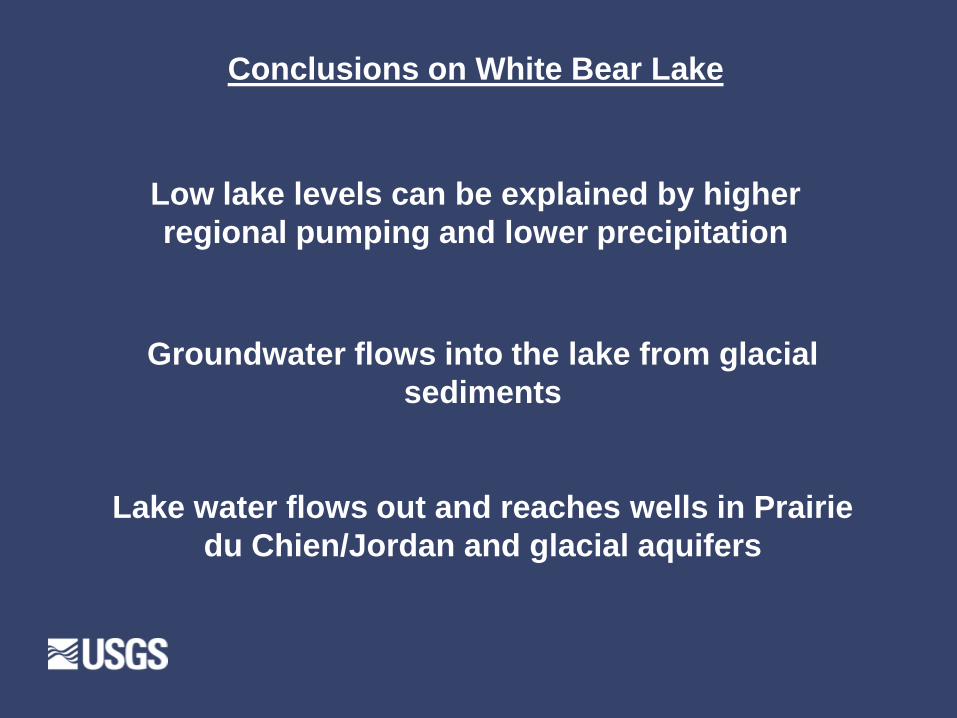
Conclusions on White Bear Lake
Low lake levels can be explained by higher
regional pumping and lower precipitation
Groundwater flows into the lake from glacial
sediments
Lake water flows out and reaches wells in Prairie
du Chien/Jordan and glacial aquifers
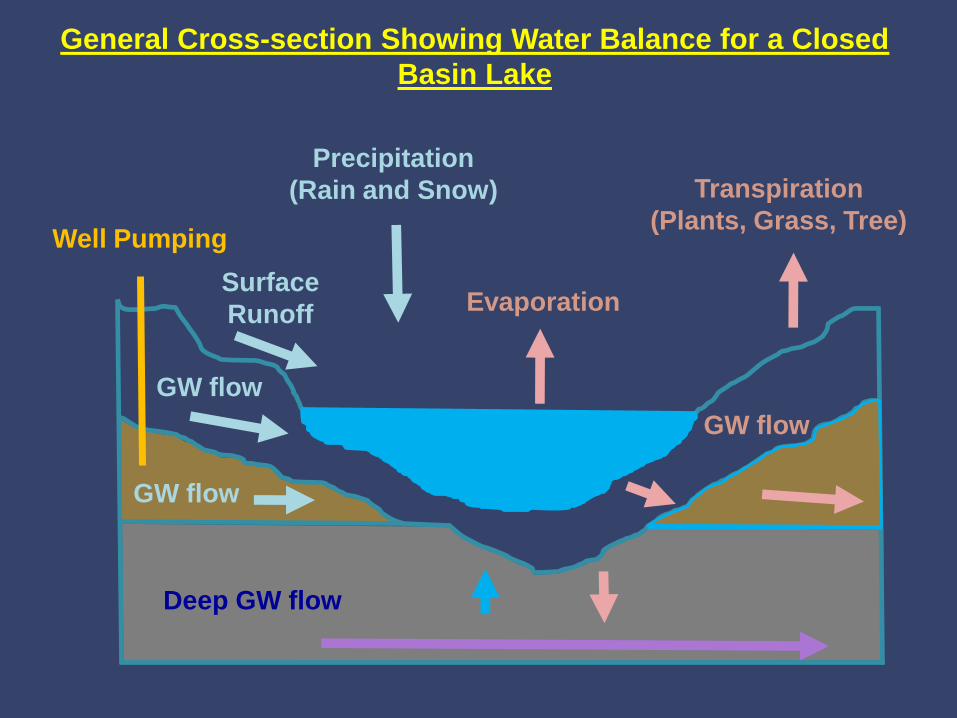
General Cross-section Showing Water Balance for a Closed
Basin Lake
Precipitation
(Rain and Snow)
GW flow
GW flow
Well Pumping
Deep GW flow
Evaporation
Transpiration
(Plants, Grass, Tree)
GW flow
Surface
Runoff
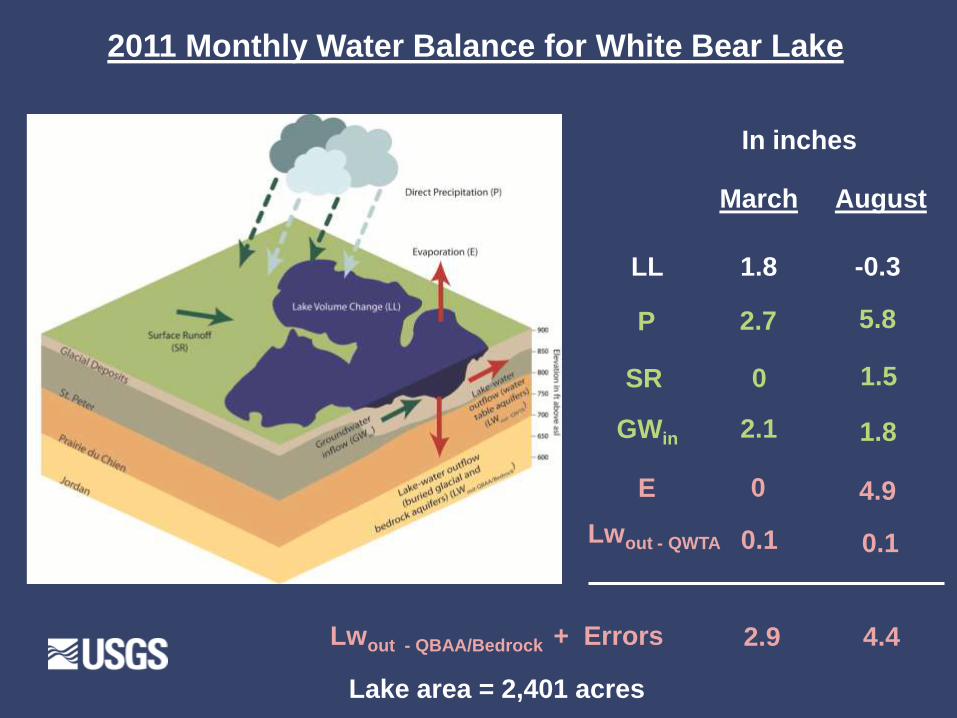
2011 Monthly Water Balance for White Bear Lake
March August
In inches
LL 1.8 -0.3
P 2.7 5.8
SR 0 1.5
GWin 2.1 1.8
E 0 4.9
Lwout - QWTA 0.1 0.1
Lwout - QBAA/Bedrock + Errors 2.9 4.4
Lake area = 2,401 acres
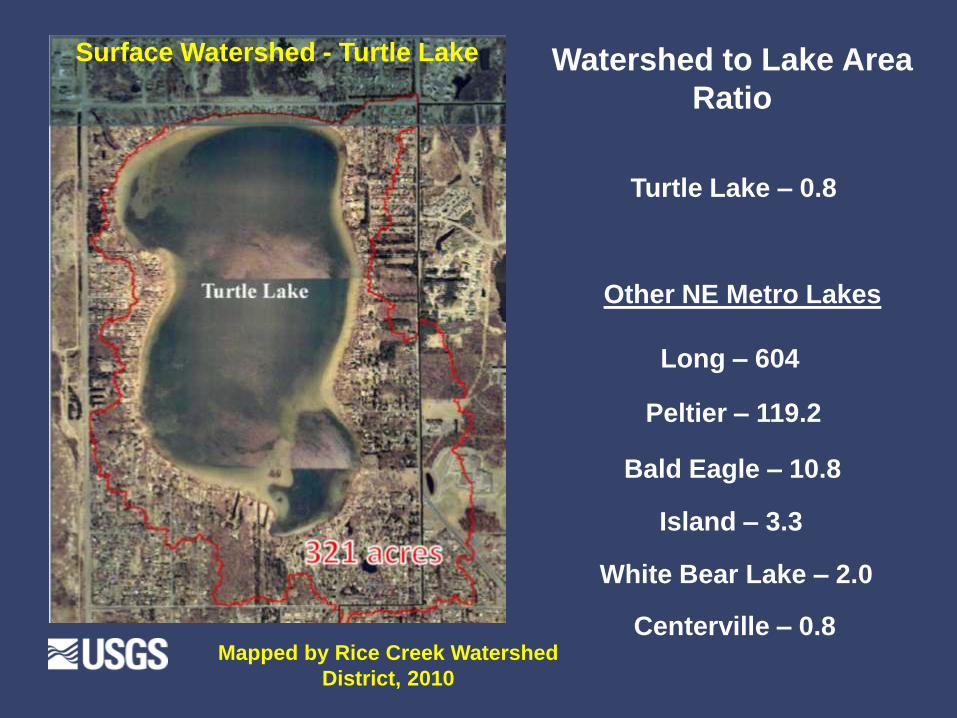
Mapped by Rice Creek Watershed
District, 2010
Turtle Lake – 0.8
Other NE Metro Lakes
Long – 604
Peltier – 119.2
Bald Eagle – 10.8
Island – 3.3
Centerville – 0.8
White Bear Lake – 2.0
Surface Watershed - Turtle Lake Watershed to Lake Area
Ratio
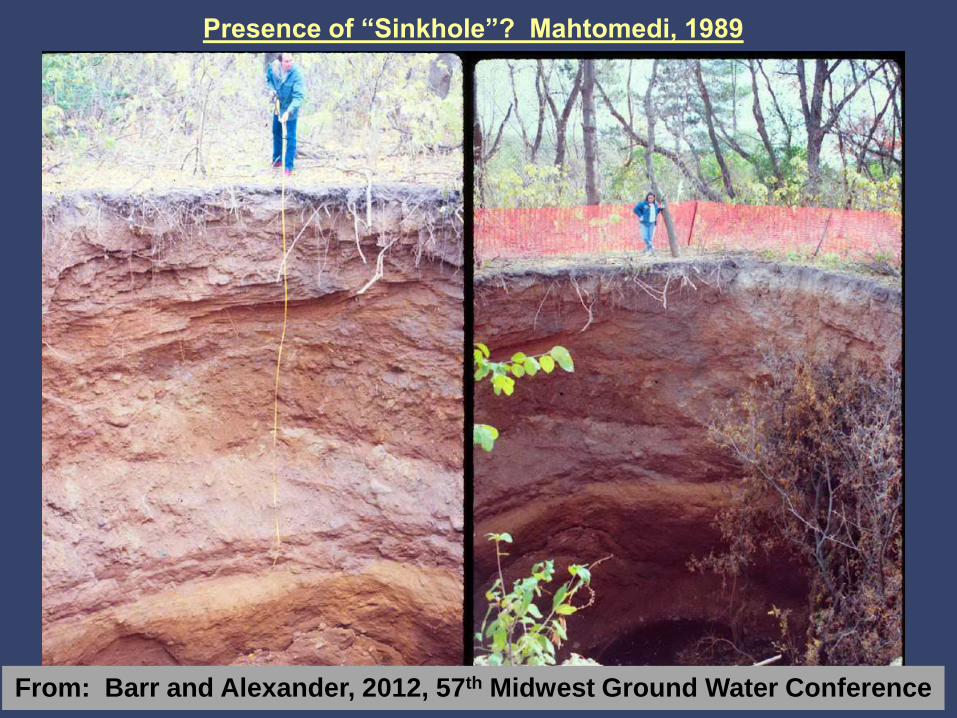
Presence of “Sinkhole”? Mahtomedi, 1989
From: Barr and Alexander, 2012, 57th Midwest Ground Water Conference
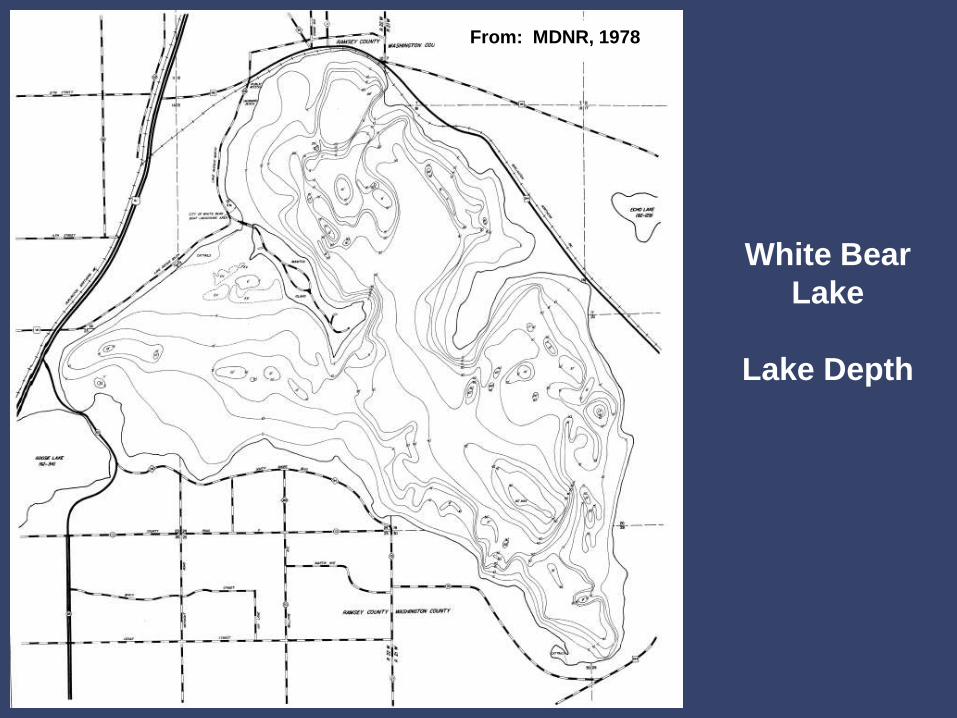
White Bear
Lake
Lake Depth
From: MDNR, 1978
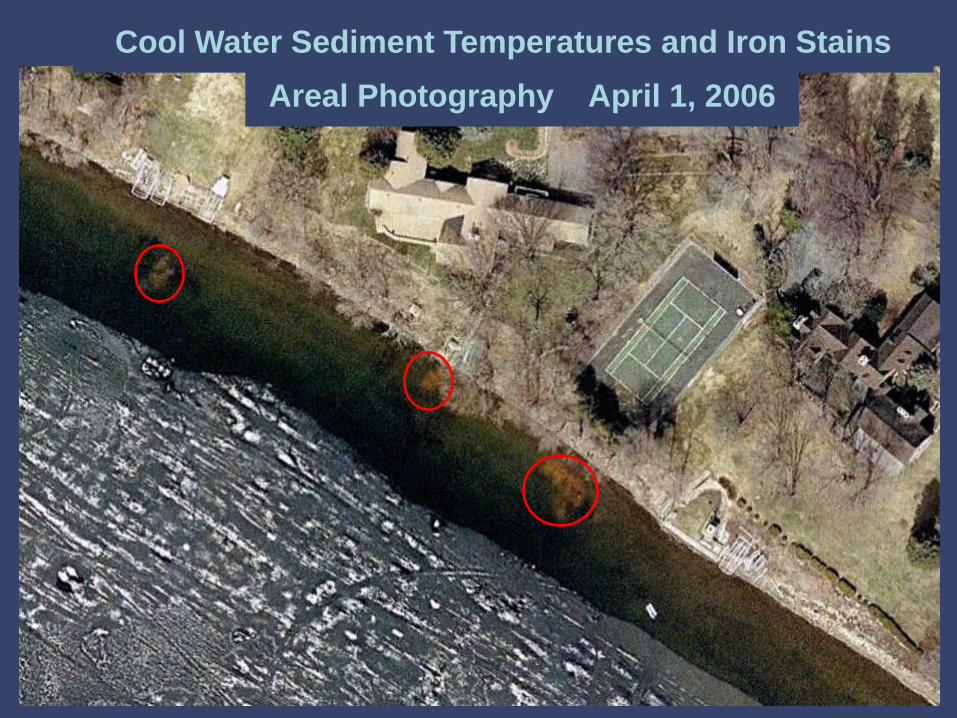
Areal Photography April 1, 2006
Cool Water Sediment Temperatures and Iron Stains
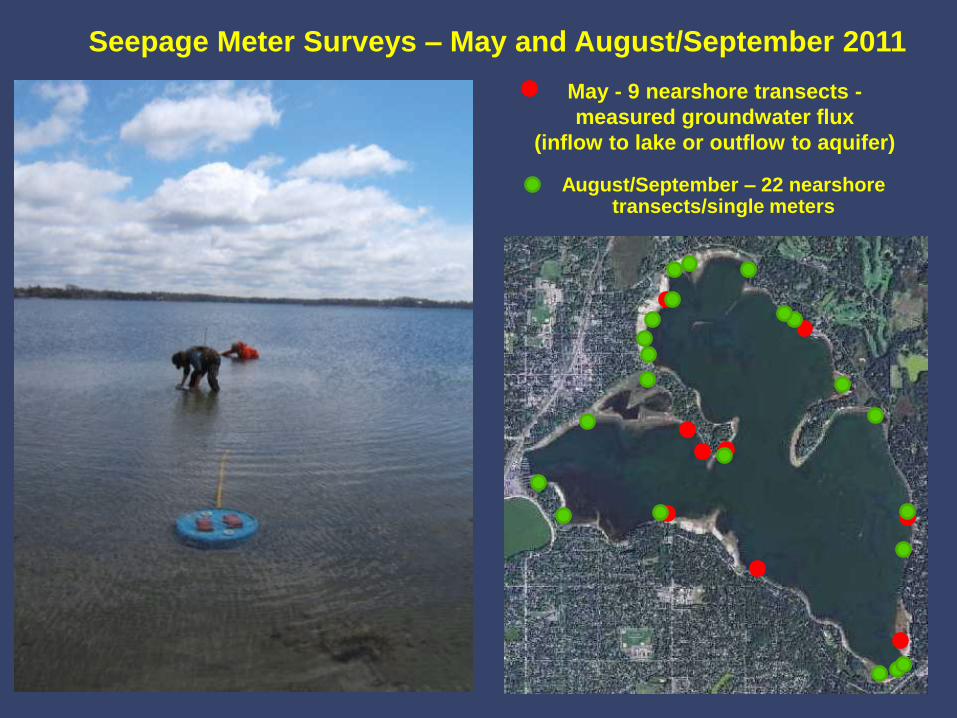
Seepage Meter Surveys – May and August/September 2011
May - 9 nearshore transects -
measured groundwater flux
(inflow to lake or outflow to aquifer)
August/September – 22 nearshore transects/single meters
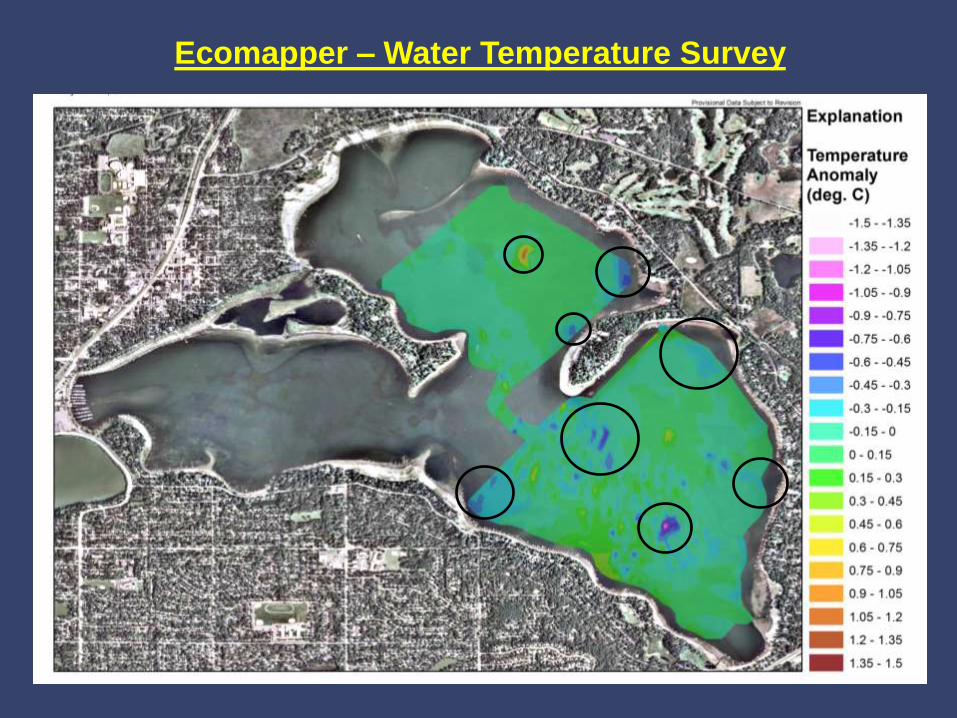
Ecomapper – Water Temperature Survey
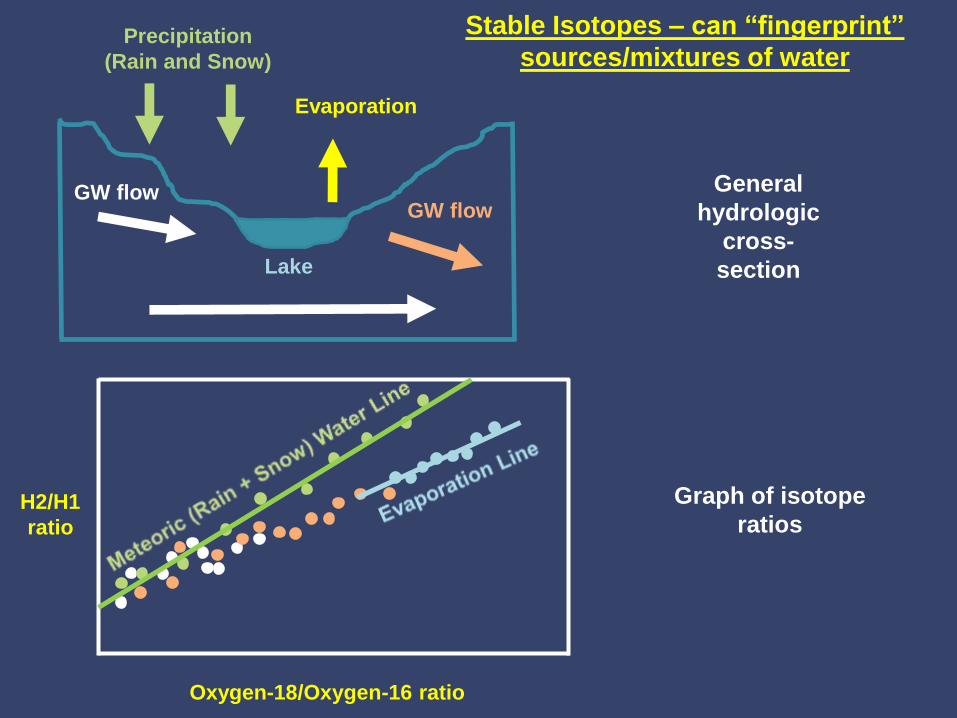
Stable Isotopes – can “fingerprint”
sources/mixtures of water
H2/H1
ratio
Oxygen-18/Oxygen-16 ratio
GW flow GW flow
Precipitation
(Rain and Snow)
Evaporation
Lake
Graph of isotope
ratios
General
hydrologic
cross-
section
Groundwater sampled from wells and surface waters sampled from White Bear Lake
100% Groundwater
100%
Lake
water
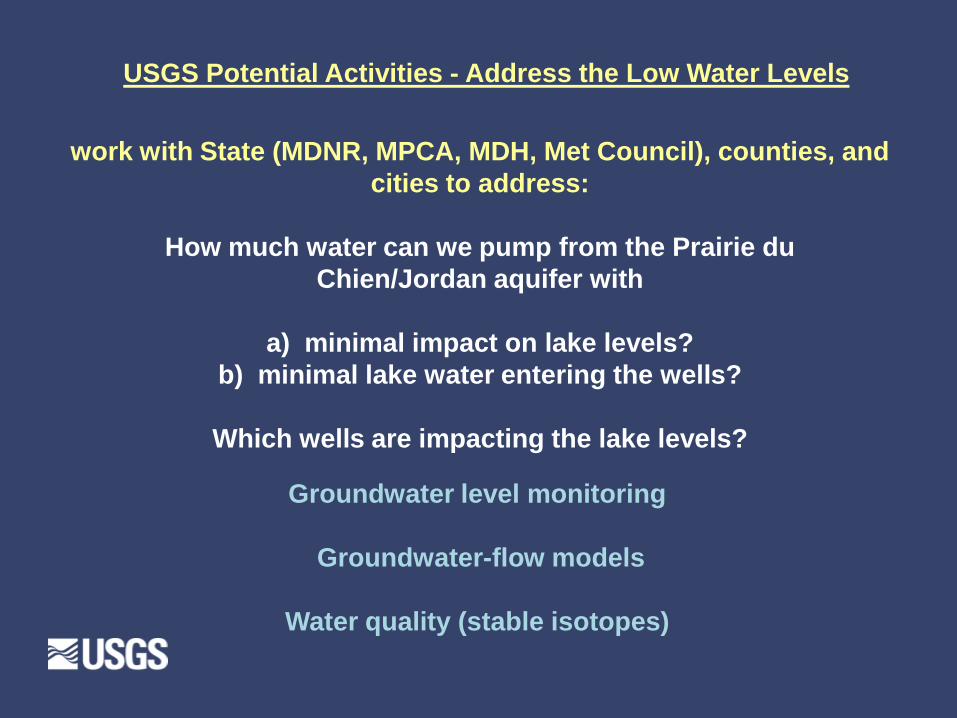
USGS Potential Activities - Address the Low Water Levels
work with State (MDNR, MPCA, MDH, Met Council), counties, and
cities to address:
How much water can we pump from the Prairie du
Chien/Jordan aquifer with
a) minimal impact on lake levels?
b) minimal lake water entering the wells?
Which wells are impacting the lake levels?
Groundwater level monitoring
Groundwater-flow models
Water quality (stable isotopes)
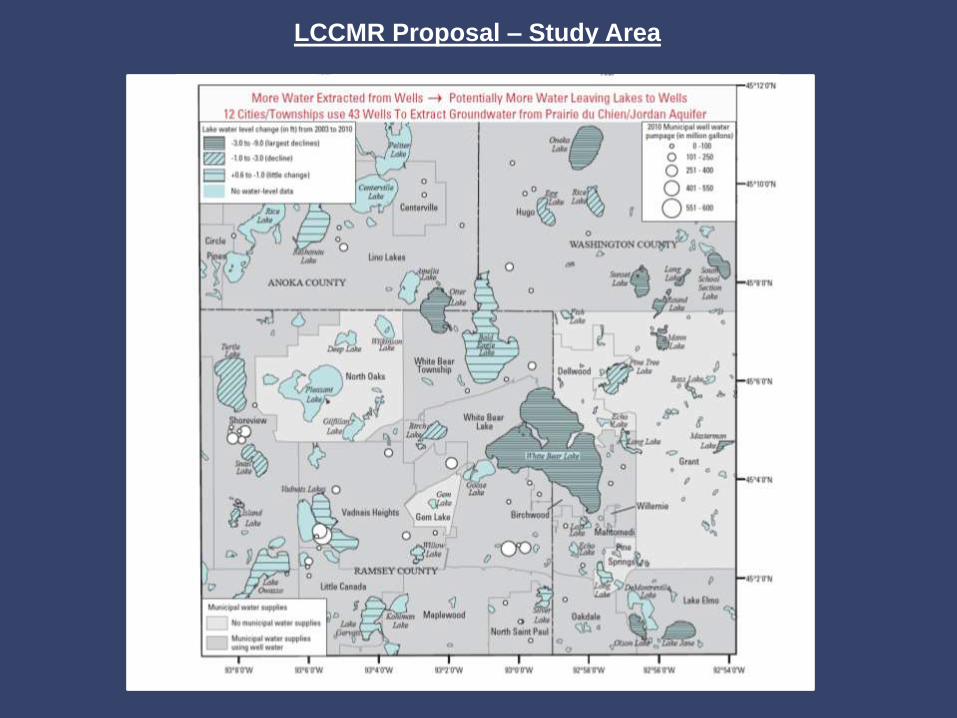
LCCMR Proposal – Study Area
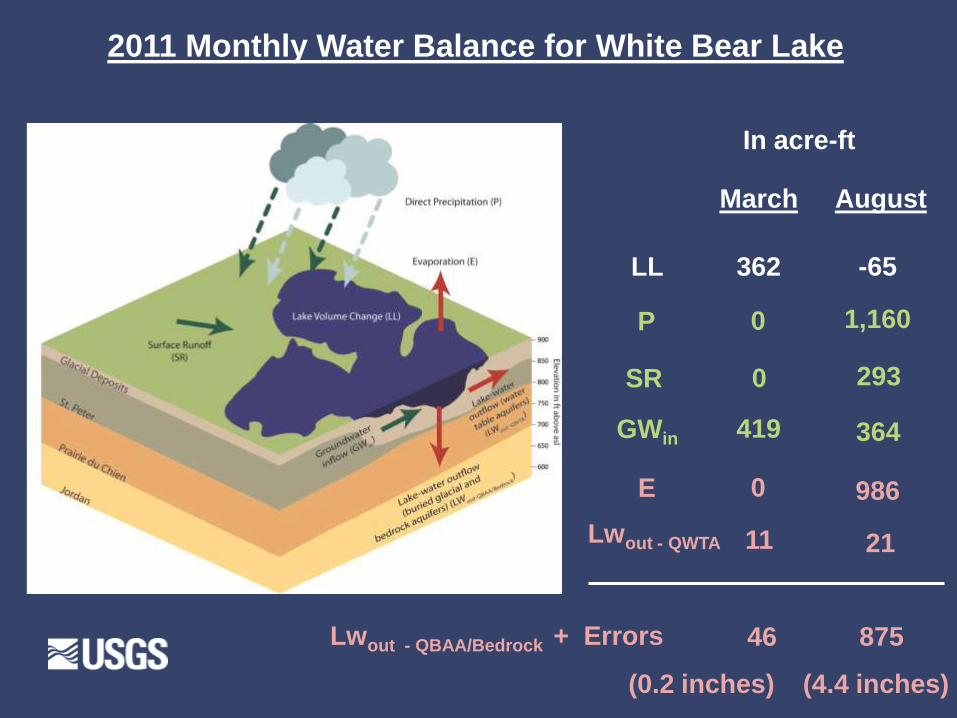
2011 Monthly Water Balance for White Bear Lake
March August
In acre-ft
LL 362 -65
P 0 1,160
SR 0 293
GWin 419 364
E 0 986
Lwout - QWTA 11 21
Lwout - QBAA/Bedrock + Errors 46 875
(0.2 inches) (4.4 inches)
From: MDNR, 1978
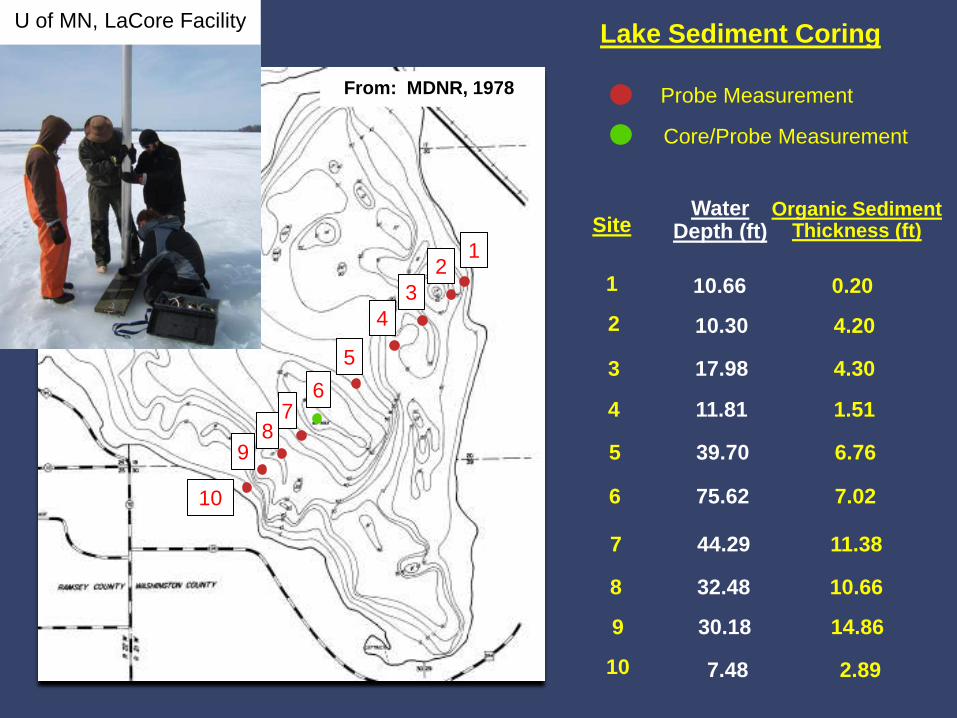
Lake Sediment Coring
From: MDNR, 1978 Probe Measurement
Core/Probe Measurement
Site Organic Sediment
Thickness (ft)
1
2
3
4
5
6
7
8
9
0.20
4.20
4.30
1.51
6.76
7.02
11.38
10.66
14.86
10 2.89
1 2
3
4
5
6 7
8 9
10
Water Depth (ft)
10.66
10.30
17.98
11.81
39.70
75.62
44.29
32.48
30.18
7.48
U of MN, LaCore Facility
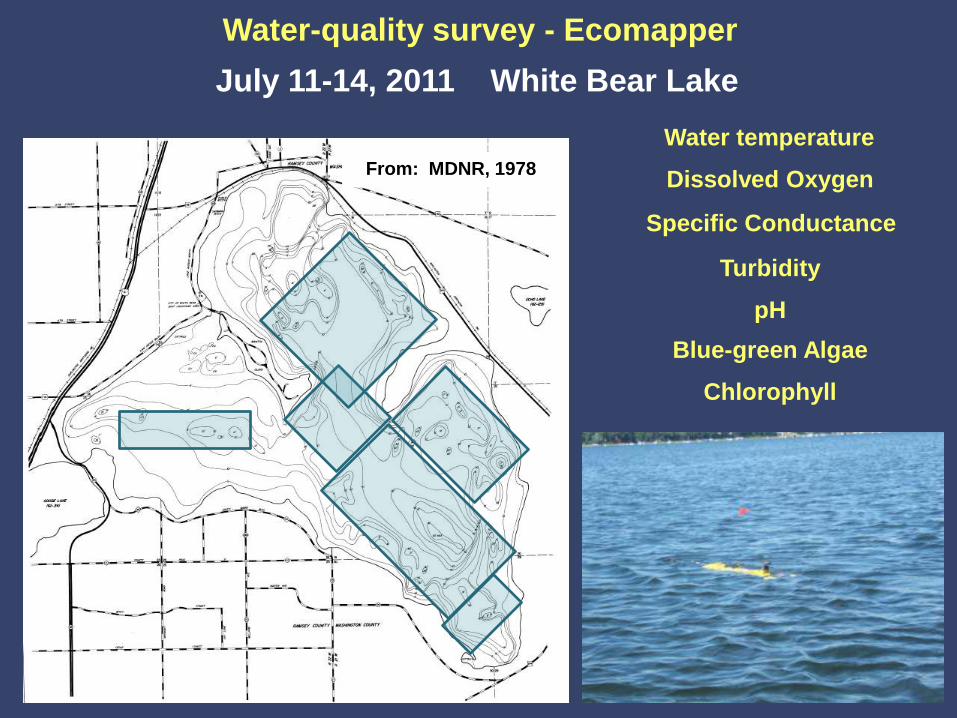
Water-quality survey - Ecomapper
Water temperature
July 11-14, 2011 White Bear Lake
Dissolved Oxygen
Specific Conductance
Chlorophyll
Turbidity
Blue-green Algae
pH
From: MDNR, 1978

50
Introduction
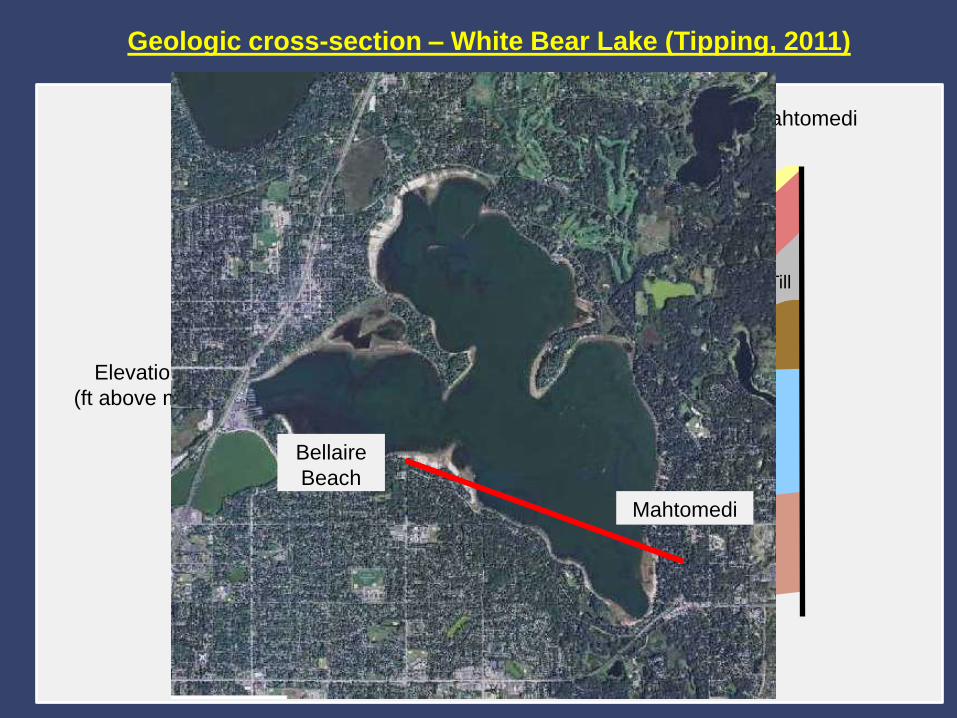
Geologic cross-section – White Bear Lake (Tipping, 2011)
950
1,000
550
500
600
900
850
800
750
700
650
Bellaire Beach Mahtomedi
Elevation
(ft above msl)
Prairie du Chien Group
St. Peter S.S
Glacial Till
(Superior)
White Bear
Lake
Glacial Till
Till
Jordan Sandstone
St. Lawrence Formation
Mahtomedi
Bellaire
Beach
52
Historical Lake-level/Precipitation/Groundwater
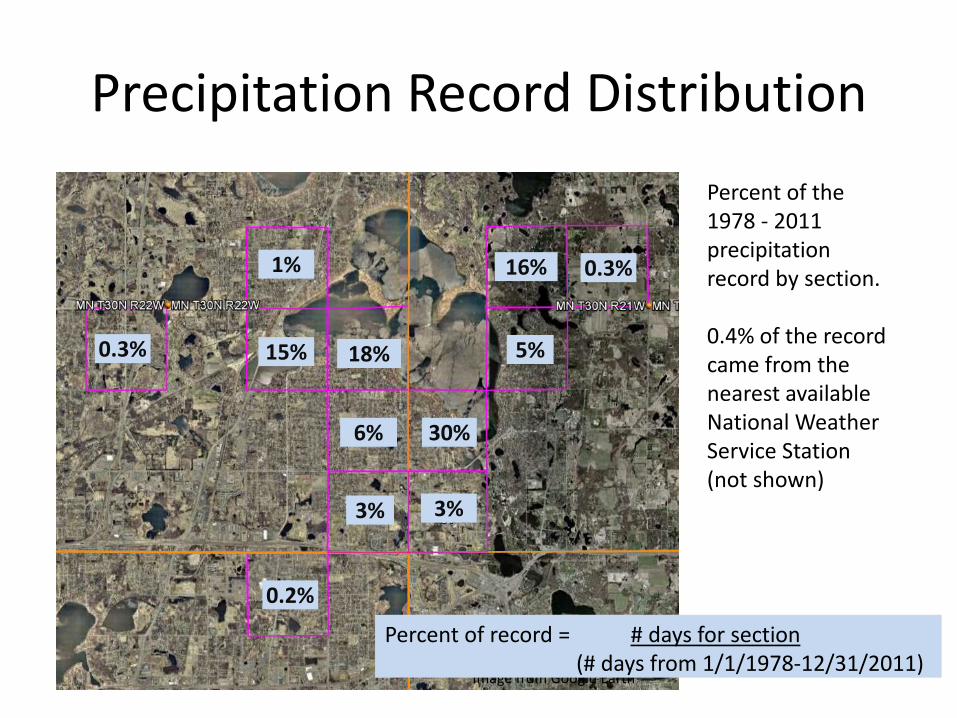
Precipitation Record Distribution
1%
Image from Google Earth
0.3%
16% 0.3%
15% 18%
6% 30%
5%
3% 3%
0.2%
Percent of the 1978 - 2011 precipitation record by section. 0.4% of the record came from the nearest available National Weather Service Station (not shown)
Percent of record = # days for section (# days from 1/1/1978-12/31/2011)
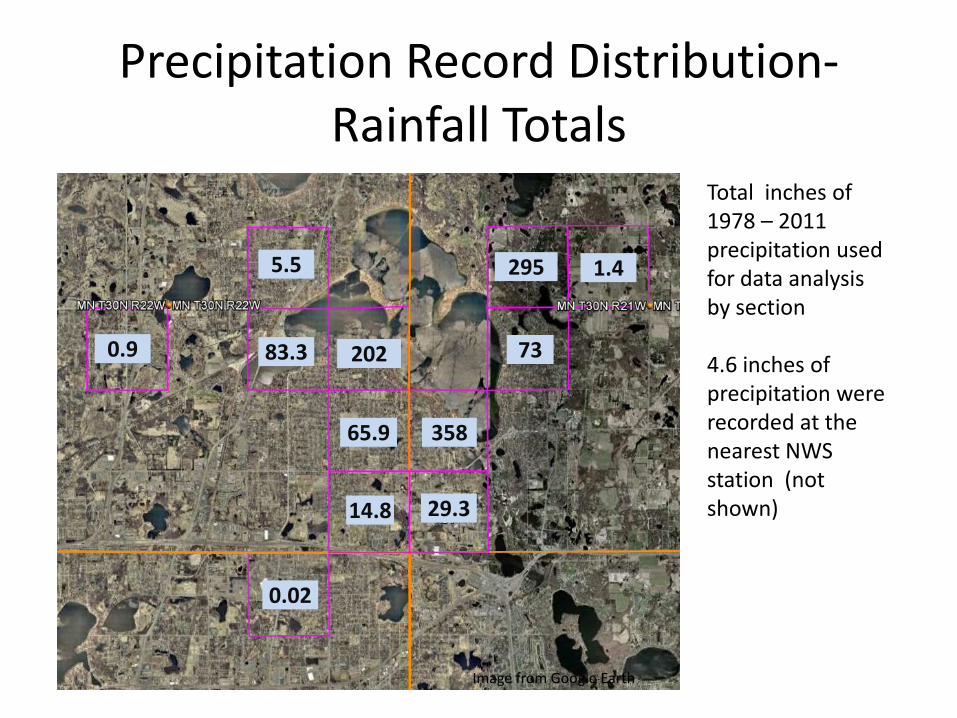
Precipitation Record Distribution-Rainfall Totals
5.5
Image from Google Earth
0.9
295 1.4
83.3 202
65.9 358
73
14.8 29.3
0.02
Total inches of 1978 – 2011 precipitation used for data analysis by section 4.6 inches of precipitation were recorded at the nearest NWS station (not shown)
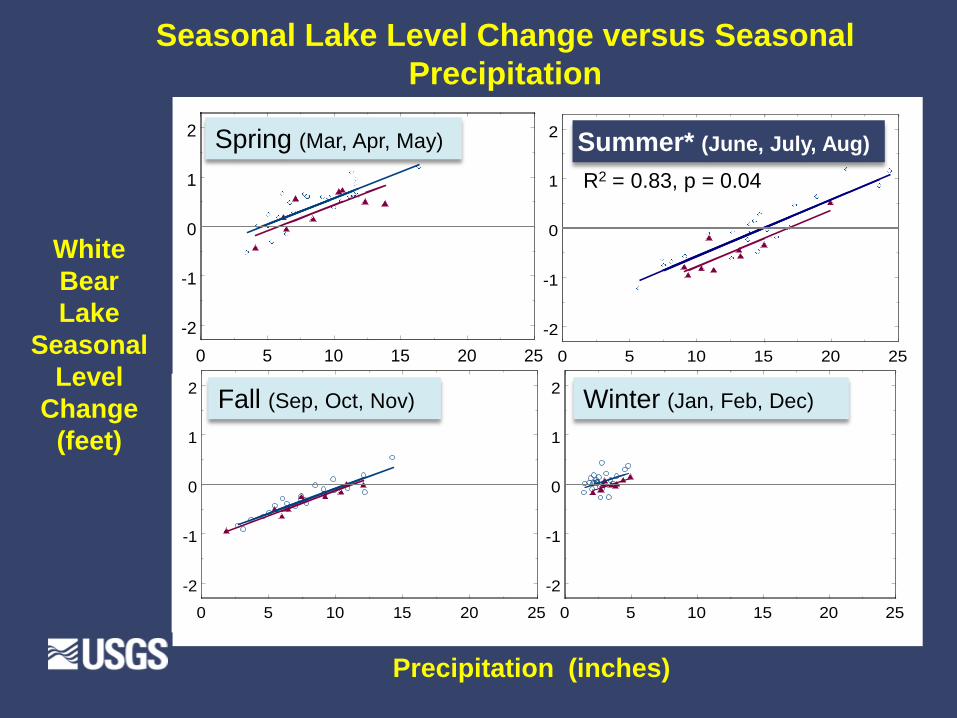
Seasonal Lake Level Change versus Seasonal
Precipitation
Precipitation (inches)
White
Bear
Lake
Seasonal
Level
Change
(feet)
0 5 10 15 20 25
-2
-1
0
1
2
0 5 10 15 20 25
-2
-1
0
1
2
0 5 10 15 20 25
-2
-1
0
1
2
0 5 10 15 20 25
-2
-1
0
1
2
0 5 10 15 20 25
-2
-1
0
1
2
0 5 10 15 20 25
-2
-1
0
1
2
0 5 10 15 20 25
-2
-1
0
1
2
Spring (Mar, Apr, May) Summer* (June, July, Aug)
Fall (Sep, Oct, Nov) Winter (Jan, Feb, Dec)
R2 = 0.83, p = 0.04
Annual Pumping from High-Capacity Wells - White Bear
Lake Study Area 1980-2010
Annual
Pumpage
(millions
of gallons) - Municipal
- Other Uses
1980 1990 2000 2010
0
2000
4000
6000
1980 1990 2000 2010
0
2000
4000
6000
Year
Pumpage By Use
Pumpage By Aquifer
Annual
Pumpage
(millions
of gallons)
- Total
- Total
- Prairie du Chien
Group/Jordan
- Multiple Aquifers
- Glacial Aquifers
- St. Peter
Sandstone
2008 dewatering
between White
Bear and Bald
Eagle
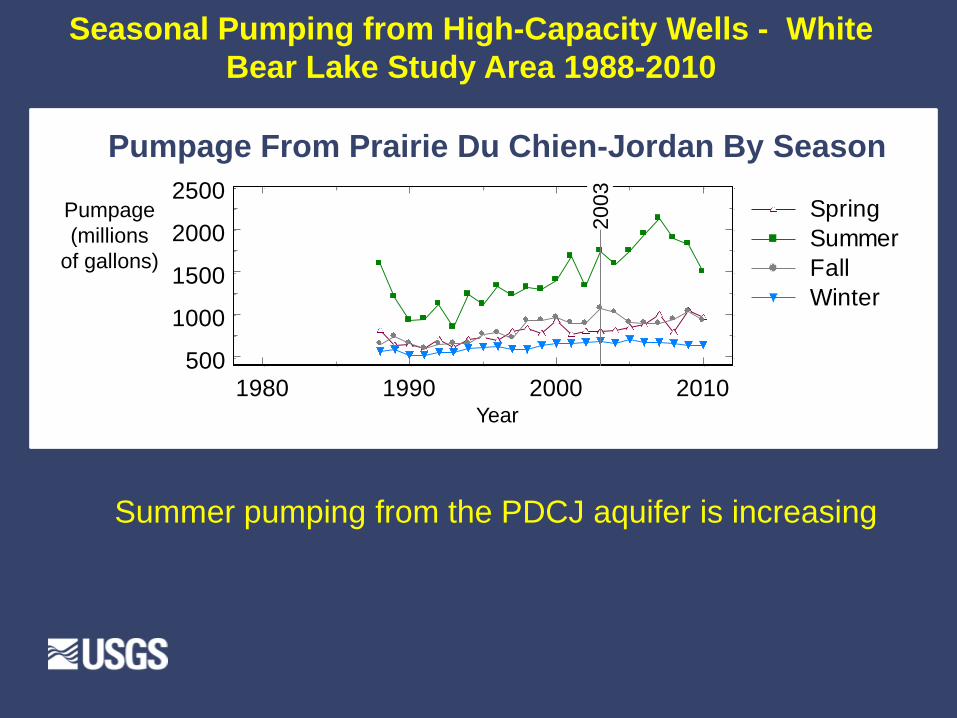
Seasonal Pumping from High-Capacity Wells - White
Bear Lake Study Area 1988-2010
Pumpage
(millions
of gallons)
Pumpage From Prairie Du Chien-Jordan By Season
1980 1990 2000 2010500
1000
1500
2000
2500Spring
Summer
Fall
Winter
Year
Summer pumping from the PDCJ aquifer is increasing
20
03
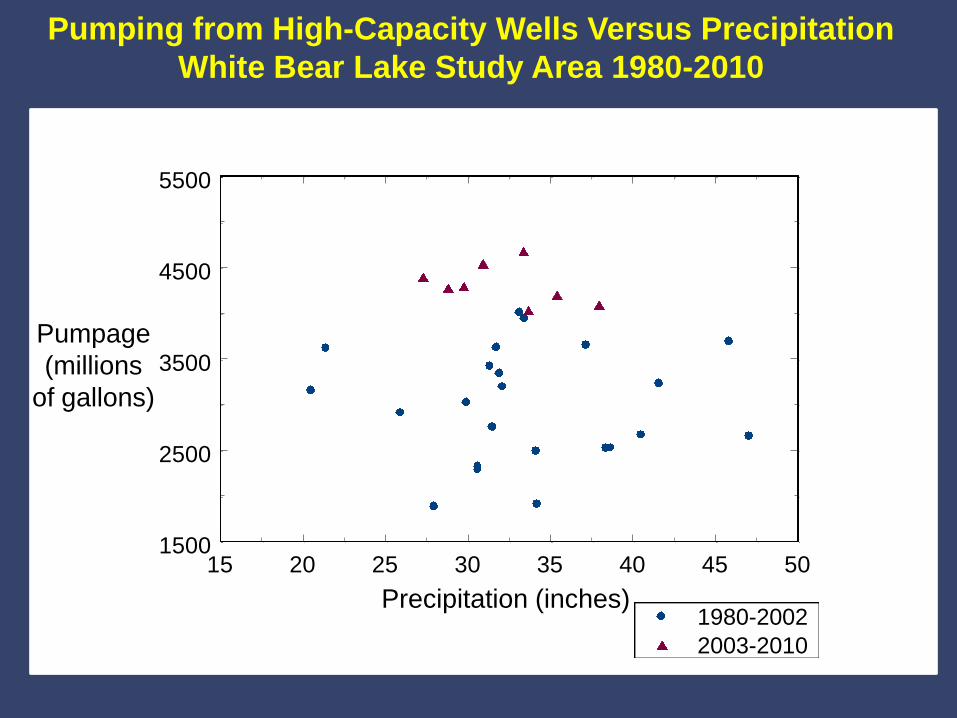
Pumping from High-Capacity Wells Versus Precipitation
White Bear Lake Study Area 1980-2010
15 20 25 30 35 40 45 501500
2500
3500
4500
5500
1980-2002
2003-2010
Pumpage
(millions
of gallons)
Precipitation (inches)
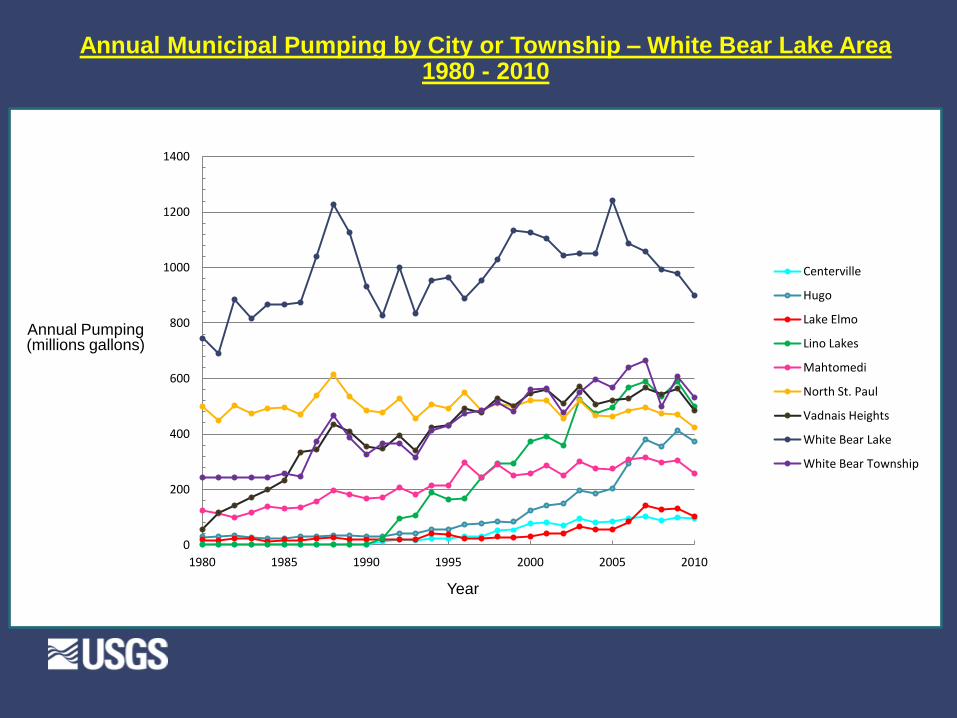
Annual Municipal Pumping by City or Township – White Bear Lake Area 1980 - 2010
Annual Pumping (millions gallons)
Year
0
200
400
600
800
1000
1200
1400
1980 1985 1990 1995 2000 2005 2010
Centerville
Hugo
Lake Elmo
Lino Lakes
Mahtomedi
North St. Paul
Vadnais Heights
White Bear Lake
White Bear Township
-25 -20 -15 -10 -5 0 5 10 15 20 25
-2
-1
0
1
2
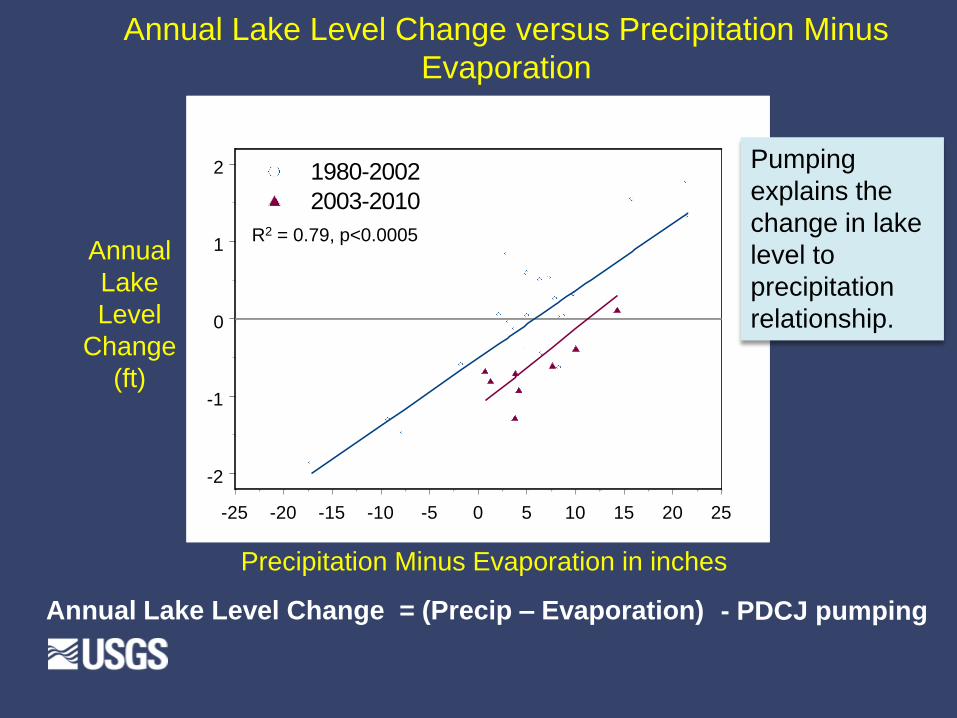
Annual Lake Level Change versus Precipitation Minus
Evaporation
Precipitation Minus Evaporation in inches
Annual
Lake
Level
Change
(ft)
-25 -20 -15 -10 -5 0 5 10 15 20 25
-2
-1
0
1
2
Annual Lake Level Change = (Precip – Evaporation)
R2 = 0.79, p<0.0005
Pumping
explains the
change in lake
level to
precipitation
relationship.
- PDCJ pumping
1980-2002
2003-2010
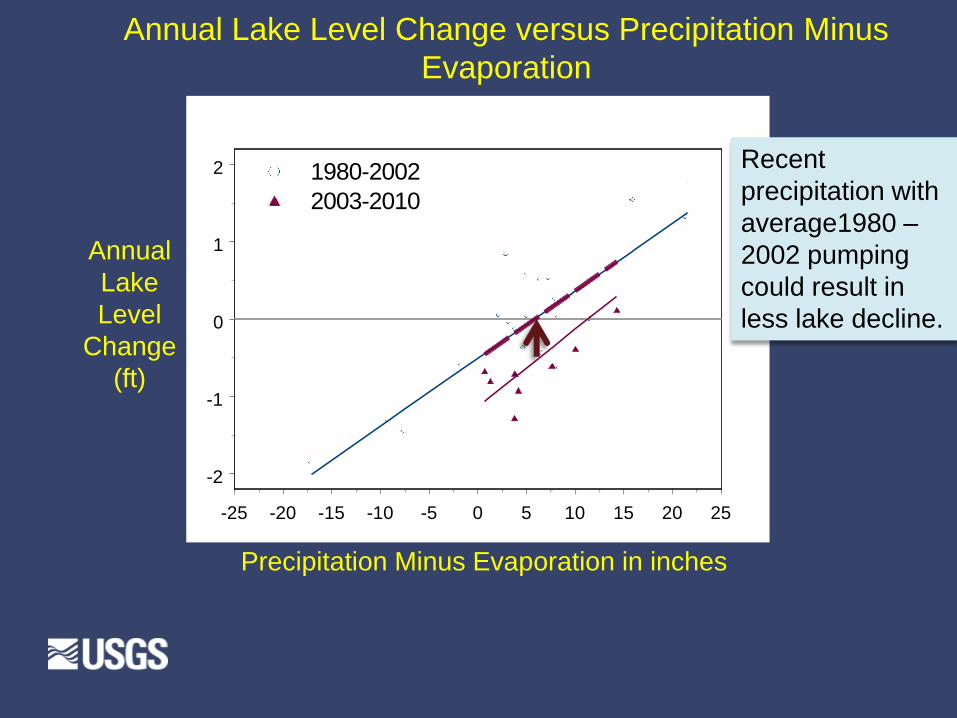
Annual Lake Level Change versus Precipitation Minus
Evaporation
-25 -20 -15 -10 -5 0 5 10 15 20 25
-2
-1
0
1
2 1980-2002
2003-2010
Precipitation Minus Evaporation in inches
Annual
Lake
Level
Change
(ft)
Recent
precipitation with
average1980 –
2002 pumping
could result in
less lake decline.
62
Groundwater Synoptic
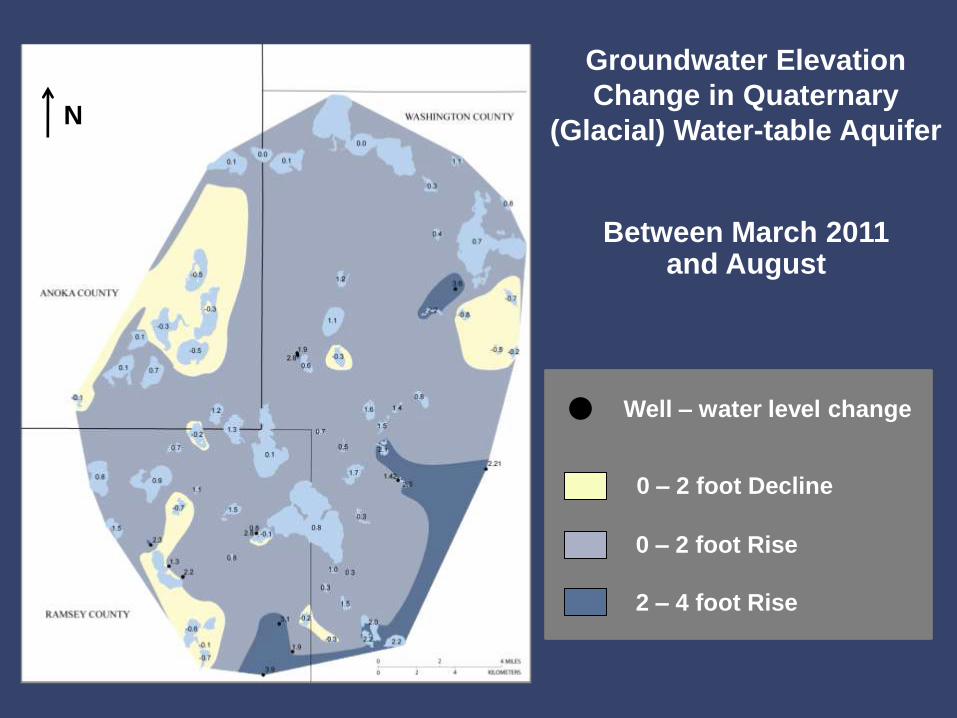
Groundwater Elevation
Change in Quaternary
(Glacial) Water-table Aquifer
Between March 2011 and August
N
Well – water level change
0 – 2 foot Decline
0 – 2 foot Rise
2 – 4 foot Rise

64
Seepage Measurements
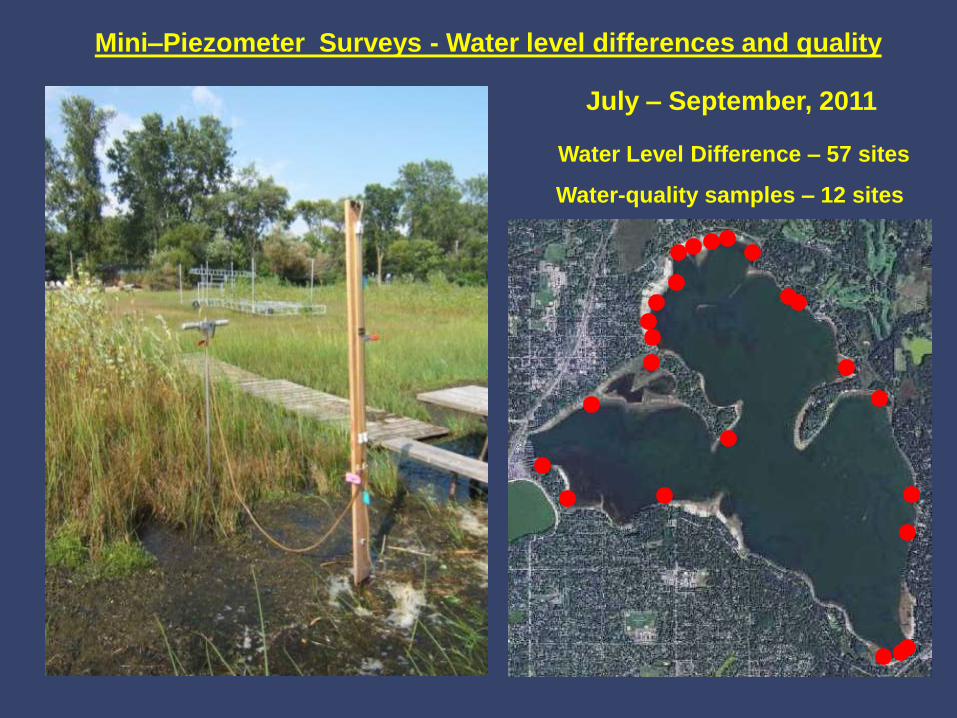
July – September, 2011
Mini–Piezometer Surveys - Water level differences and quality
Water Level Difference – 57 sites
Water-quality samples – 12 sites
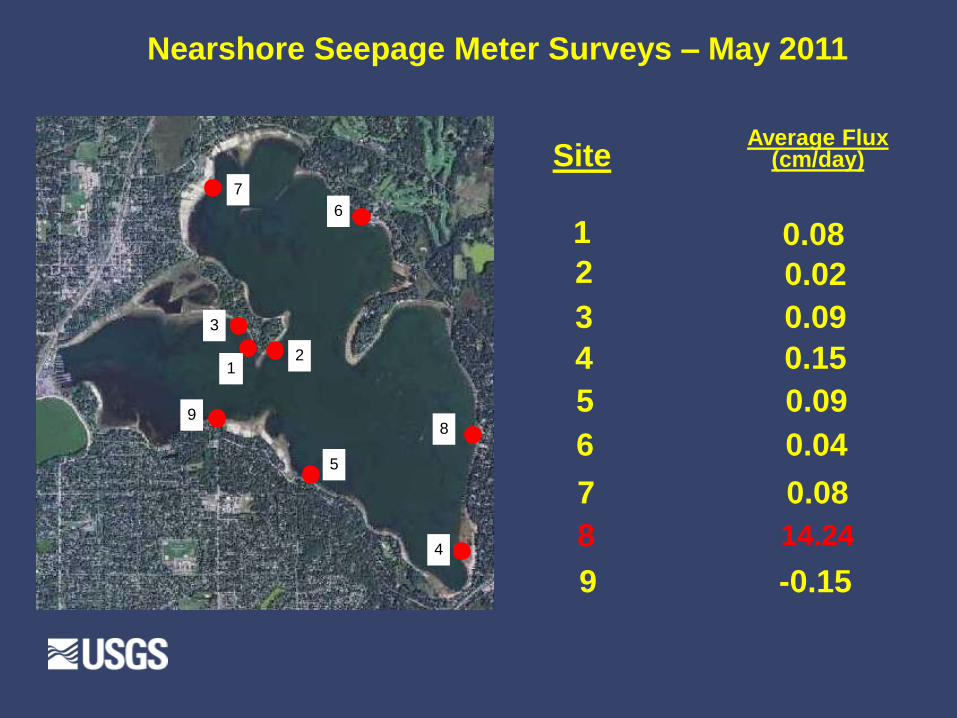
Nearshore Seepage Meter Surveys – May 2011
1 2
3
4
5
6
7
8 9
Site Average Flux
(cm/day)
1
2
3
4
5
6
7
8
9
0.08
0.02
0.09
0.15
0.09
0.04
0.08
14.24
-0.15
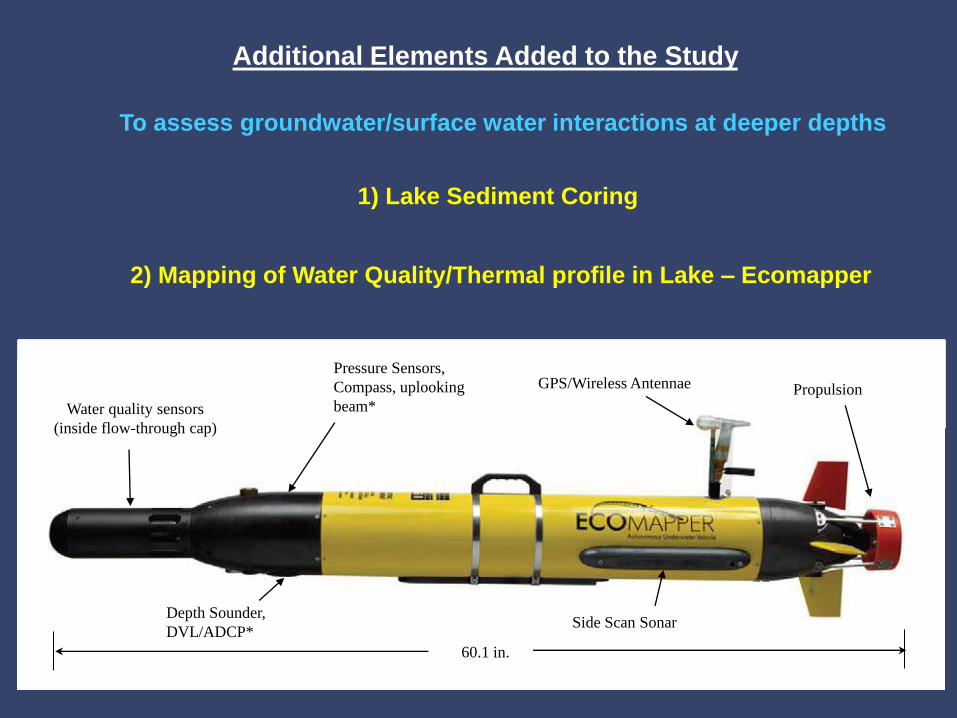
Additional Elements Added to the Study
2) Mapping of Water Quality/Thermal profile in Lake – Ecomapper
Water quality sensors
(inside flow-through cap)
Side Scan Sonar
GPS/Wireless Antennae
Depth Sounder,
DVL/ADCP*
Pressure Sensors,
Compass, uplooking
beam* Propulsion
60.1 in.
1) Lake Sediment Coring
To assess groundwater/surface water interactions at deeper depths
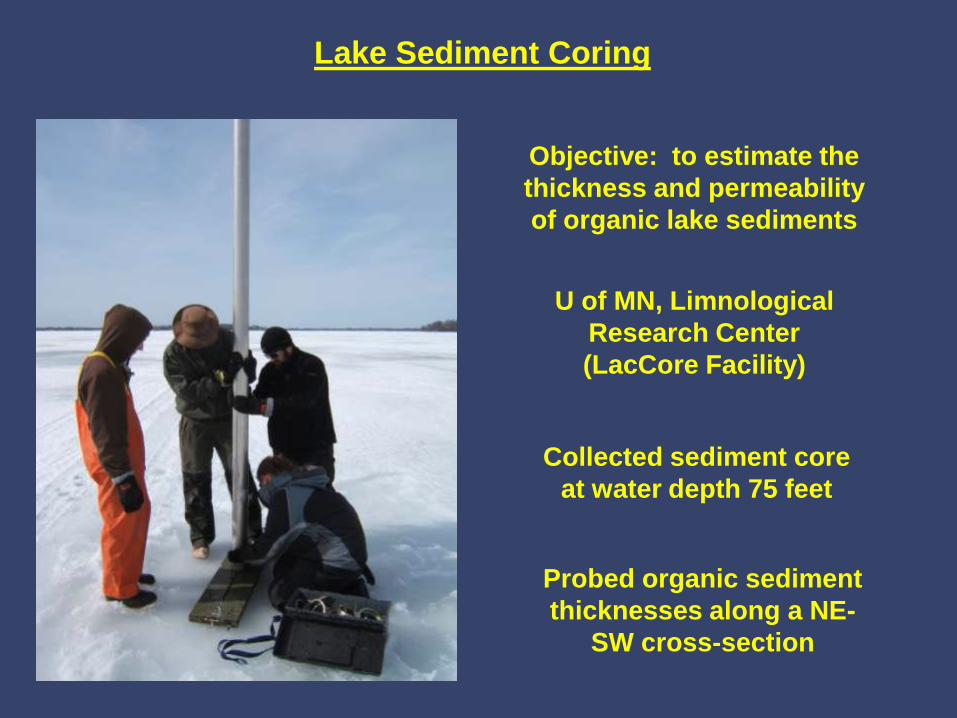
Lake Sediment Coring
U of MN, Limnological
Research Center
(LacCore Facility)
Objective: to estimate the
thickness and permeability
of organic lake sediments
Collected sediment core
at water depth 75 feet
Probed organic sediment
thicknesses along a NE-
SW cross-section
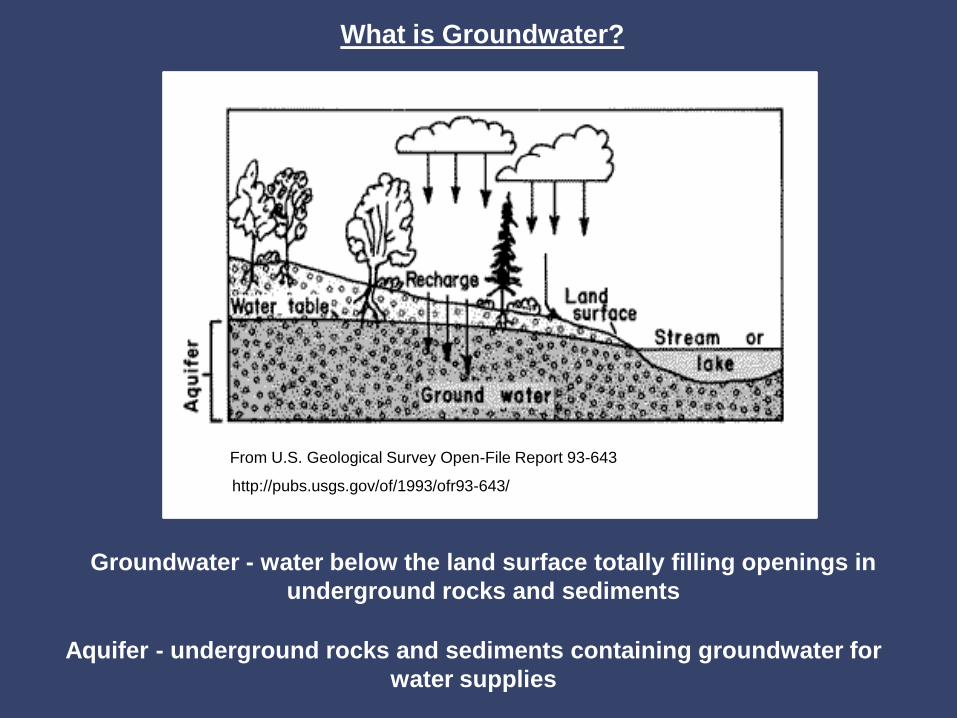
What is Groundwater?
Groundwater - water below the land surface totally filling openings in
underground rocks and sediments
http://pubs.usgs.gov/of/1993/ofr93-643/
From U.S. Geological Survey Open-File Report 93-643
Aquifer - underground rocks and sediments containing groundwater for
water supplies
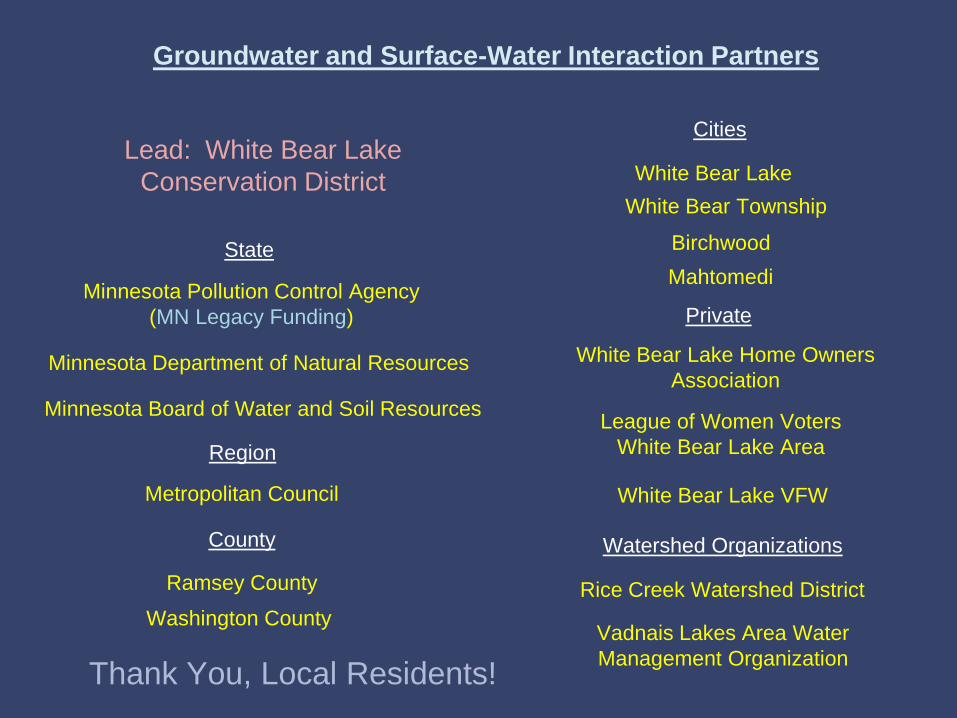
Groundwater and Surface-Water Interaction Partners
Lead: White Bear Lake
Conservation District
State
Minnesota Pollution Control Agency
(MN Legacy Funding)
County
Minnesota Department of Natural Resources
Minnesota Board of Water and Soil Resources
Metropolitan Council
Ramsey County
Washington County
Region
Cities
White Bear Lake
White Bear Township
Birchwood
Mahtomedi
Private
White Bear Lake Home Owners
Association
White Bear Lake VFW
Watershed Organizations
Rice Creek Watershed District
Vadnais Lakes Area Water
Management Organization
League of Women Voters
White Bear Lake Area
Thank You, Local Residents!
Recommended

![MSL-RELEVANT GEOLOGIC FIELD TRIP TO NORTHERN ONTARIO ... · group [4]. Other relevant discussions mediated by this trip included provenance analysis, potassium-enrich-ment during](https://img.pdfslide.us/doc/110x75/5f64aae649423b2311646d42/msl-relevant-geologic-field-trip-to-northern-ontario-group-4-other-relevant.jpg)