2
J00326 Community Satisfaction Survey 2015 – City of Greater Bendigo
Background and objectives Survey methodology and sampling Further information Key findings & recommendations Summary of findings Detailed findings
• Key core measure: Overall performance• Key core measure: Customer service• Key core measure: Council direction indicators• Positives and areas for improvement• Communications• Individual service areas• Detailed demographics
Appendix A: Detailed survey tabulations Appendix B: Further project information
3
J00326 Community Satisfaction Survey 2015 – City of Greater Bendigo
Welcome to the report of results and recommendations for the 2015 State-wide Local Government Community Satisfaction Survey for the City of Greater Bendigo.
Each year Local Government Victoria (LGV) coordinates and auspices this State-wide Local Government Community Satisfaction Survey throughout Victorian local government areas. This coordinated approach allows for far more cost effective surveying than would be possible if councils commissioned surveys individually.
Participation in the State-wide Local Government Community Satisfaction Survey is optional and participating councils have a range of choices as to the content of the questionnaire and the sample size to be surveyed, depending on their individual strategic, financial and other considerations.
The main objectives of the survey are to assess the performance of the City of Greater Bendigo across a range of measures and to seek insight into ways to provide improved or more effective service delivery. The survey also provides councils with a means to fulfil some of their statutory reporting requirements as well as acting as a feedback mechanism to LGV.
4
J00326 Community Satisfaction Survey 2015 – City of Greater Bendigo
This survey was conducted by Computer Assisted Telephone Interviewing (CATI) as a representative random probability survey of residents aged 18+ years in the City of Greater Bendigo.
Survey sample matched to the demographic profile of the City of Greater Bendigo as determined by the most recent ABS population estimates was purchased from an accredited supplier of publicly available phone records, including up to 10% mobile phone numbers to cater to the diversity of residents within the City of Greater Bendigo, particularly younger people.
A total of n=400 completed interviews were achieved in the City of Greater Bendigo. Survey fieldwork was conducted in the period of 1st February – 30th March, 2015.
The 2015 results are compared with previous years, as detailed below: • 2014, n=400 completed interviews, conducted in the period of 31st January – 11th March.• 2013, n=400 completed interviews, conducted in the period of 1st February – 24th March.• 2012, n=400 completed interviews, conducted in the period of 18th May – 30th June.
Minimum quotas of gender within age groups were applied during the fieldwork phase. Post-survey weighting was then conducted to ensure accurate representation of the age and gender profile of the City of Greater Bendigo.
Any variation of +/-1% between individual results and net scores in this report or the detailed survey tabulations is due to rounding. In reporting, ‘—’ denotes not mentioned and ‘0%’ denotes mentioned by less than 1% of respondents. ‘Net’ scores refer to two or more response categories being combined into one category for simplicity of reporting.
5
J00326 Community Satisfaction Survey 2015 – City of Greater Bendigo
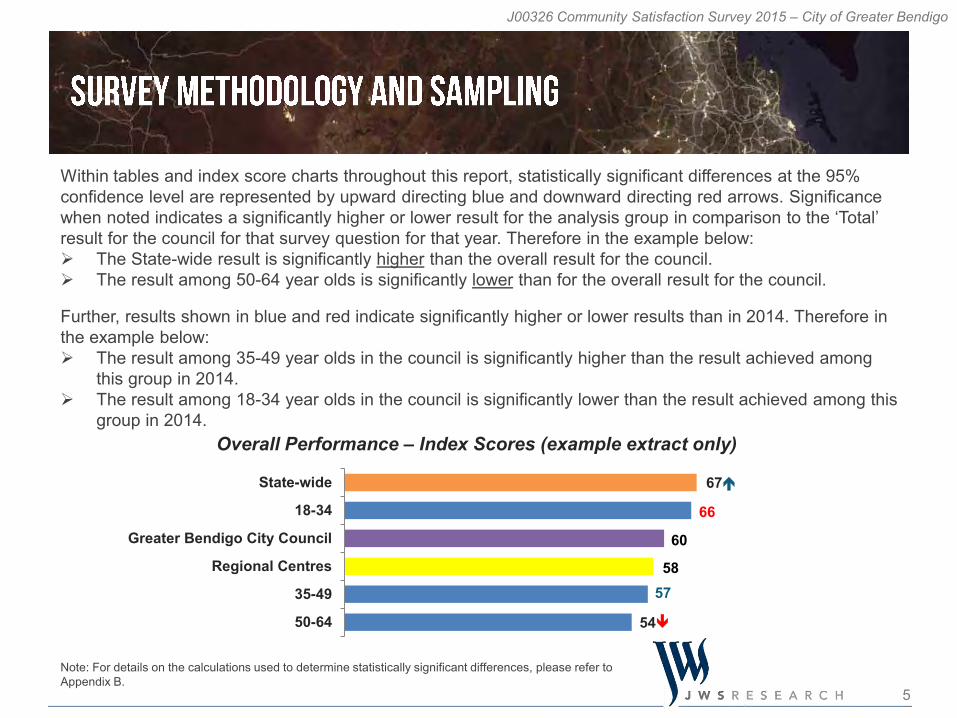
Within tables and index score charts throughout this report, statistically significant differences at the 95% confidence level are represented by upward directing blue and downward directing red arrows. Significance when noted indicates a significantly higher or lower result for the analysis group in comparison to the ‘Total’ result for the council for that survey question for that year. Therefore in the example below: The State-wide result is significantly higher than the overall result for the council. The result among 50-64 year olds is significantly lower than for the overall result for the council.
Further, results shown in blue and red indicate significantly higher or lower results than in 2014. Therefore in the example below: The result among 35-49 year olds in the council is significantly higher than the result achieved among
this group in 2014. The result among 18-34 year olds in the council is significantly lower than the result achieved among this
group in 2014.
54
5758
60
67
66
50-64
35-49
Regional Centres
Greater Bendigo City Council
18-34
State-wide
Overall Performance – Index Scores (example extract only)
Note: For details on the calculations used to determine statistically significant differences, please refer to Appendix B.
6
J00326 Community Satisfaction Survey 2015 – City of Greater Bendigo
Further InformationFurther information about the report and explanations about the State-wide Local Government Community Satisfaction Survey can be found in Appendix B, including: Background and objectives Margins of error Analysis and reporting Glossary of terms
ContactsFor further queries about the conduct and reporting of the 2015 State-wide Local Government Community Satisfaction Survey, please contact JWS Research on (03) 8685 8555.
8
J00326 Community Satisfaction Survey 2015 – City of Greater Bendigo
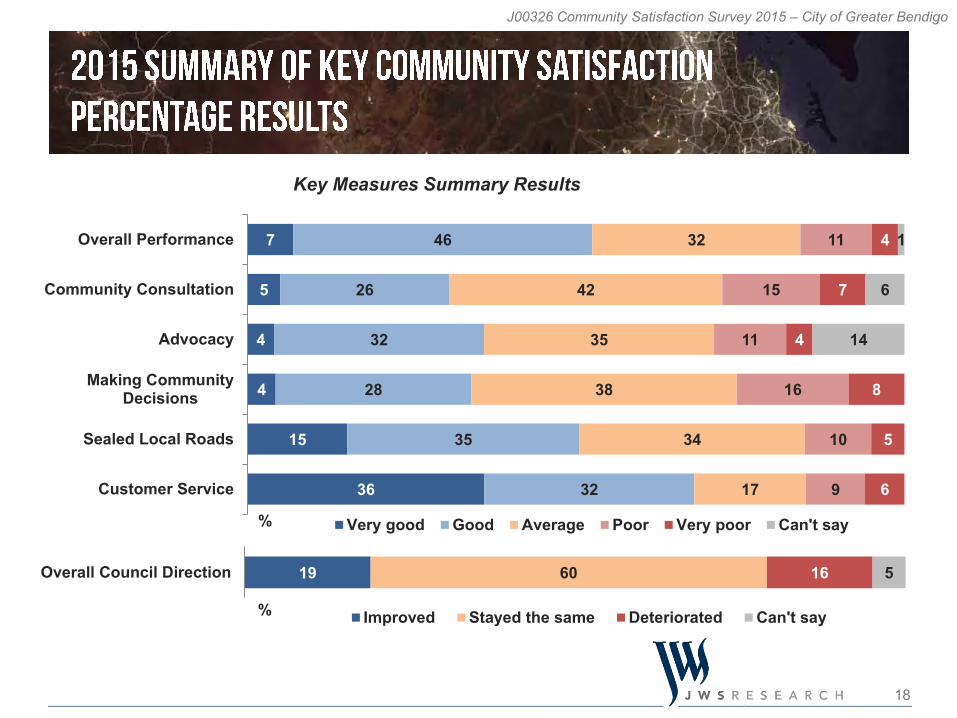
The core results for the City of Greater Bendigo are all lower than the 2014 results and on many issues, the results represent a significant decline in performance.
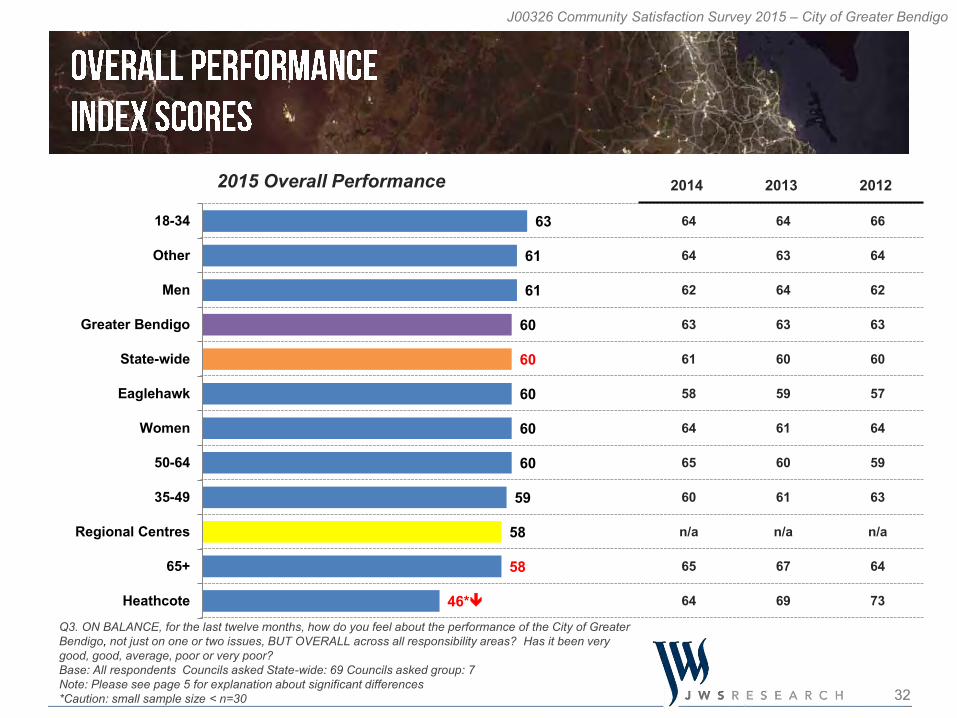
Following three years of identical measures of overall performance, the 2015 rating for the City of Greater Bendigo has now dropped by three points to an index score of 60. While this result is a decline on previous years, it is not a significant decline and it is is on par with the State-wide result and is two points higher than the Regional group average. The most notable shift in favour is from Seniors (residents aged 65 years and over),
whose rating of overall performance is the lowest in four years and has declined from an index score of 65 in 2014 down to 58 in 2015.
Throughout the report, the region of Heathcote is often flagged as the region providing the lowest approval of Council activity. While this region is certainly more critical than others within the Council jurisdiction, it should be noted that just 10 households from the Heathcote area were included in the total sample. While that region has been analysed as a separate region, as requested by Council, readers are requested to treat those results with caution given such a small base.
9
J00326 Community Satisfaction Survey 2015 – City of Greater Bendigo
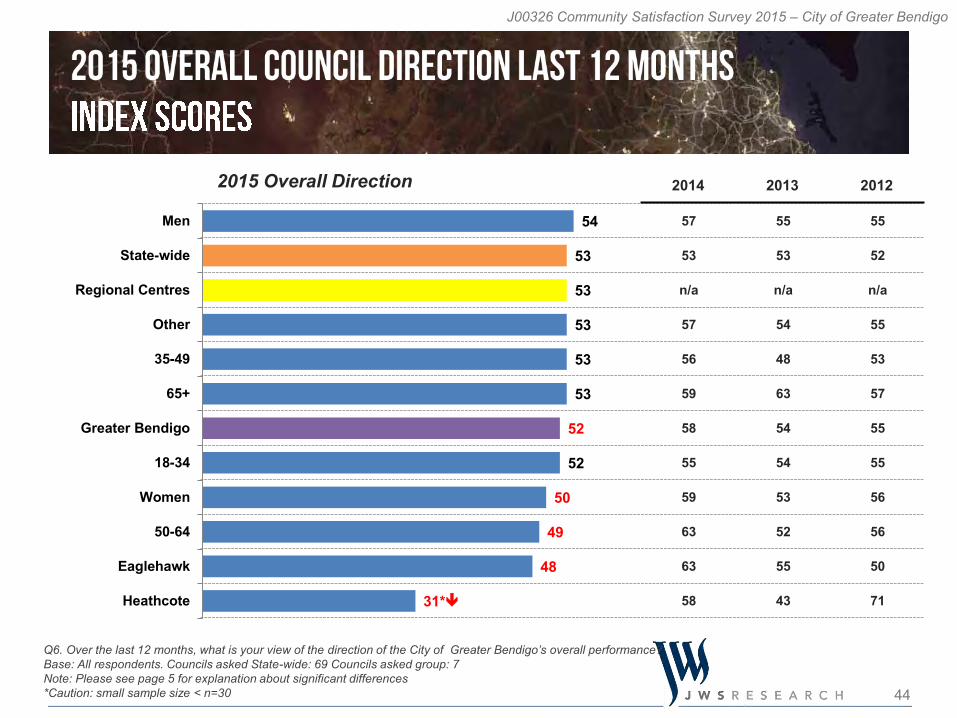
There is growing concern amongst residents about the overall direction that Council is taking. Rating of the overall direction of the City of Greater Bendigo (index score of 52) has dropped by six points in 2015 and is now at the lowest point in four years. The consequence of this shift is that the City of Greater Bendigo now sits slightly below both the State-wide and Regional group average whereas in 2014, the Council was five points ahead of the State average. The significantly weaker result for ‘overall direction’ is driven heavily by concerns
amongst women generally, residents aged 50-64 years and residents of Eaglehawk and Heathcote in particular.
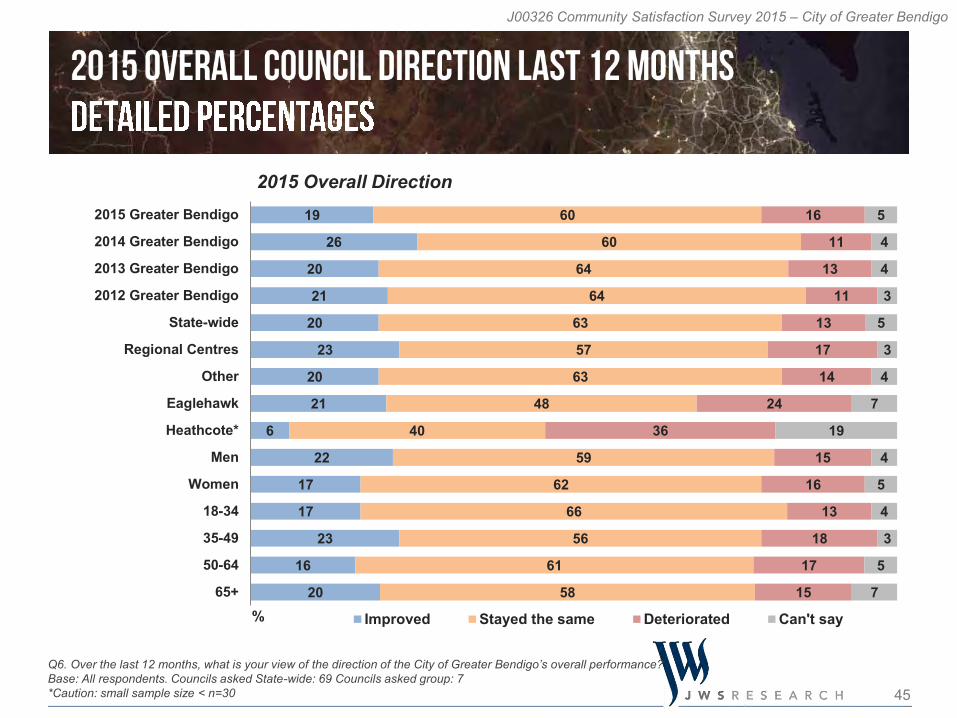
While 26% of residents in 2014 believed that Council direction had improved in the previous 12 months, that figure has dropped to just 19% in 2015.
10
J00326 Community Satisfaction Survey 2015 – City of Greater Bendigo
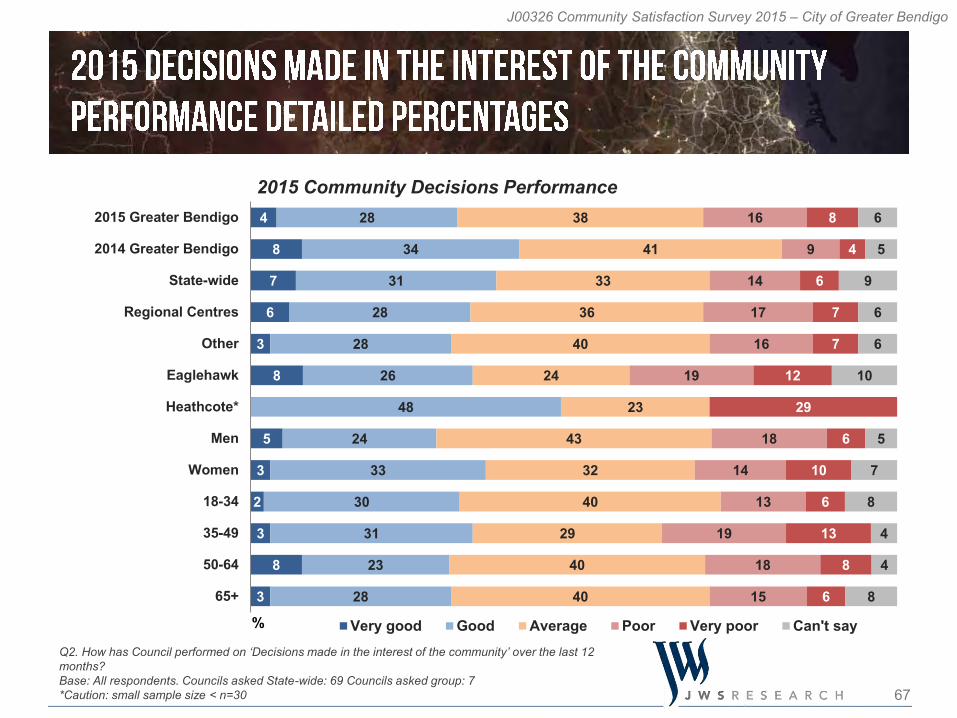
Making community decisions (in the interests of the community) is of particular concern for residents of the City of Greater Bendigo in 2015. The index score of 51 is significantly lower (a drop of eight points) than the 2014 score and it is also now significantly lower (by four points) compared with the State-wide average. Significant declines on performance on this issue were recorded across all demographic
groups. The differential between importance and performance ratings generally indicates areas in
need of improvement. This is particularly the case for ‘making decisions in the interest of the community’ (the 2nd most important service area in 2015), There is a gap of 30 points on this priority area, a spike of 11 points on the 2014 result and suggests consideration is required by Council on the issues underpinning this result.
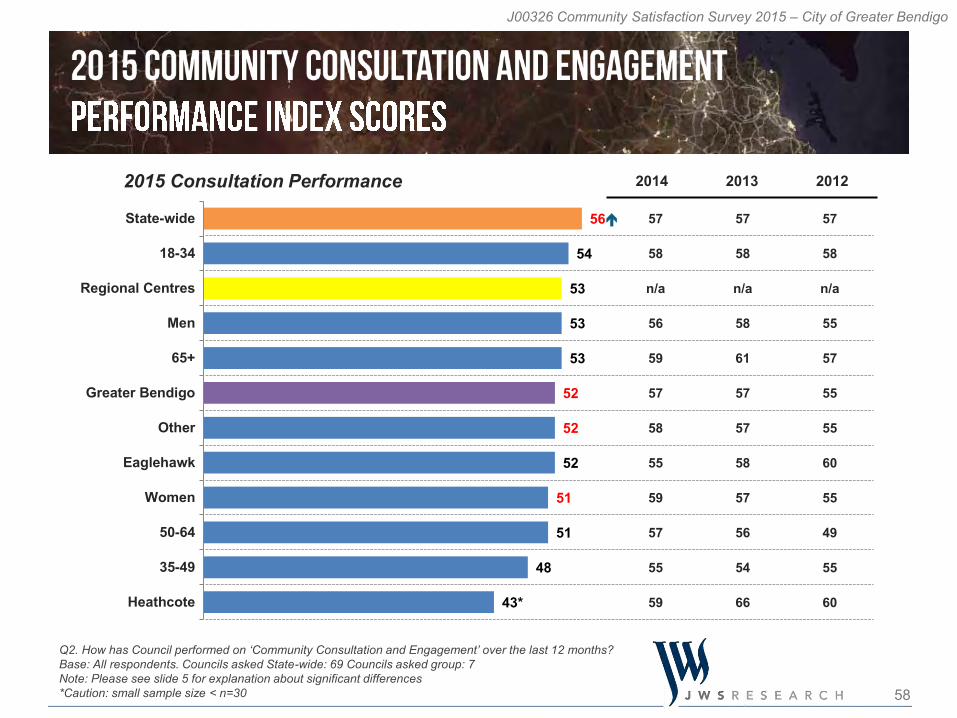
Council performance on community consultation has also deteriorated in 2015. The index score of 52 is significantly lower compared with 2014 (down five points) which makes the performance rating for the City of Greater Bendigo significantly lower than the State-wide average.Women are more critical than ever before of Council performance on the core issues of
‘Community Consultation and Engagement’ with their index score on the issue dropping significantly from 59 in 2014 to 51 in 2015.
11
J00326 Community Satisfaction Survey 2015 – City of Greater Bendigo
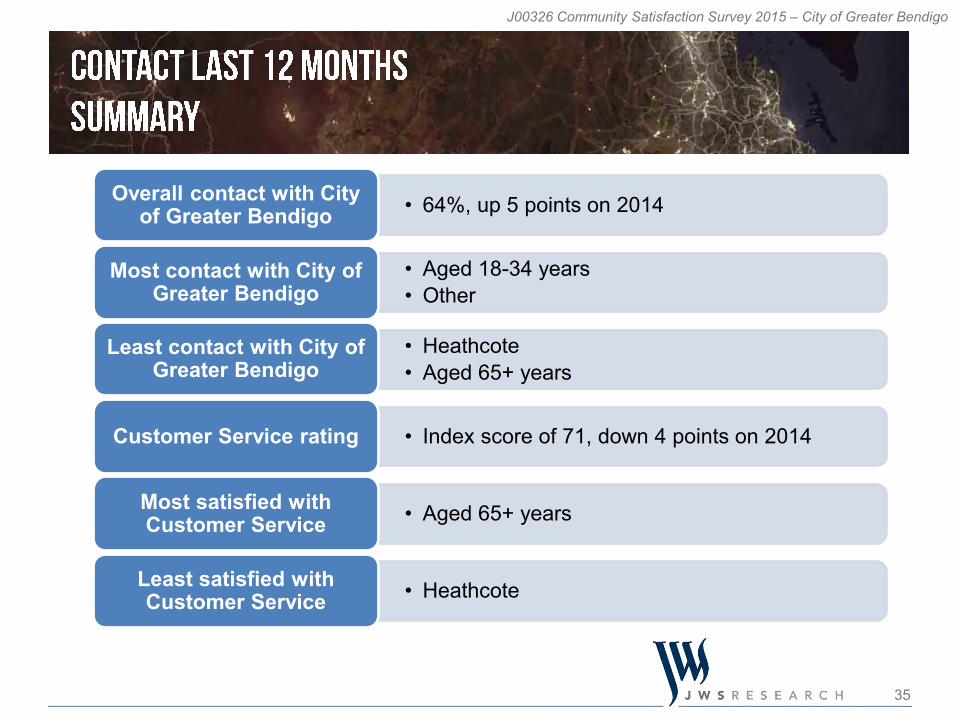
Of the core performance measures, the customer service rating is the highest (index score of 71), but that measure has also dropped four points since 2014. Whereas the City of Greater Bendigo previously exceeded the State-wide average for customer service by several points, Council is now equal with the Regional group average and just one point ahead of the State-wide average for customer service.
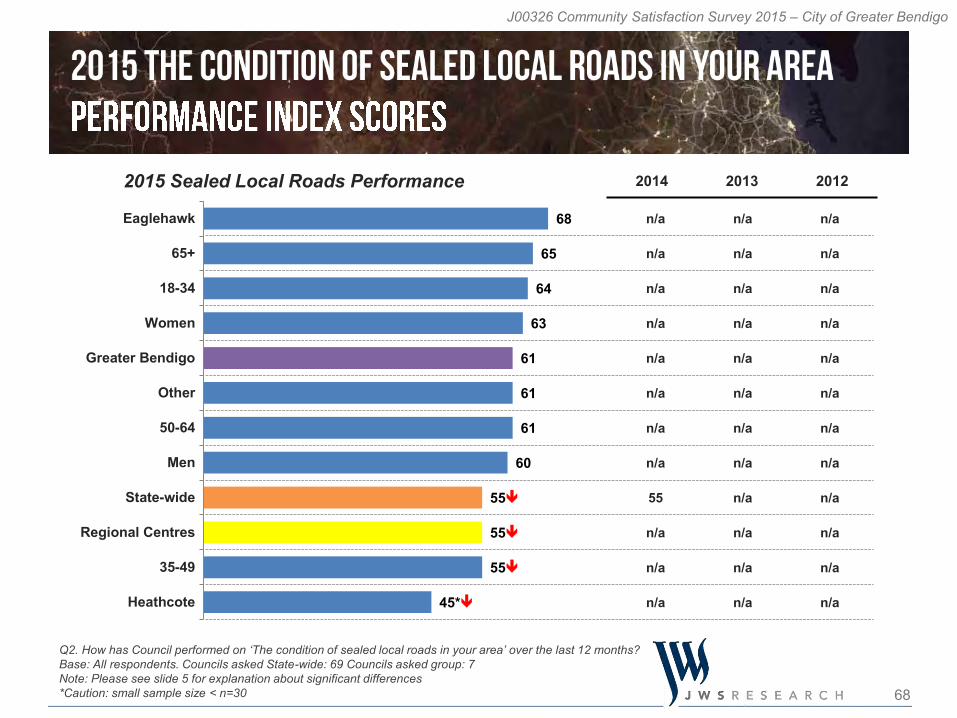
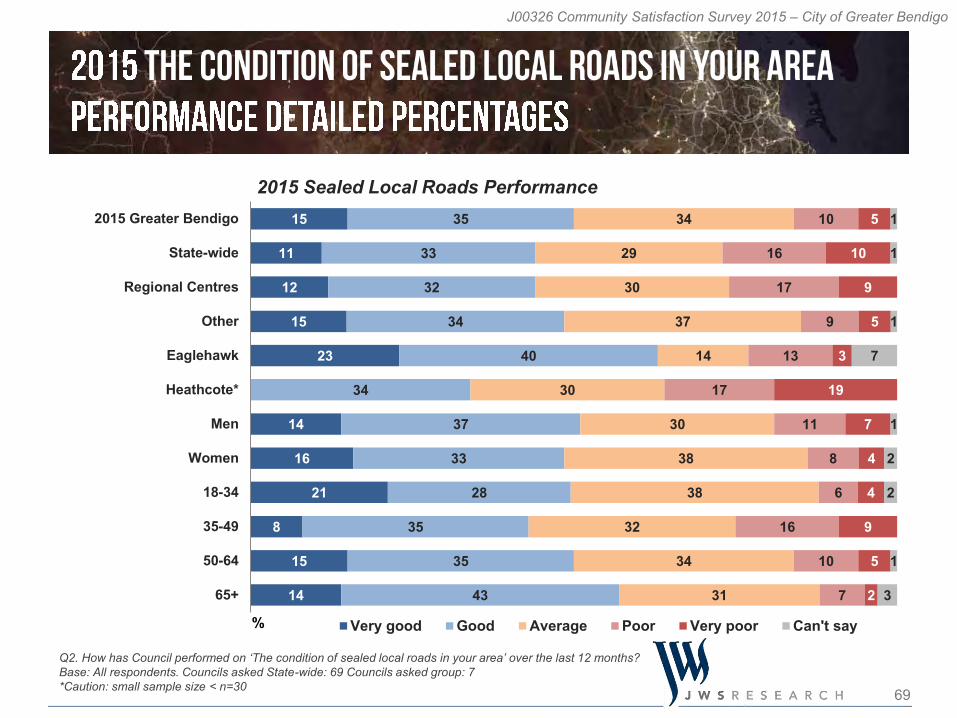
Beyond overall performance, residents were again asked to rate Council performance on 22 individual service areas. Sealed local roads was an individual service area asked for the first time of all Councils in
2015. While there is no result from 2014 to compare it with, it is pleasing to see that the City of Greater Bendigo (index score of 61) has well exceeded the State and Regional averages on this issue by six points.
Art centres and libraries once again rated highest with an index score of 82. Another traditionally strong performing area for the City of Greater Bendigo is the
appearance of public areas. While this rates highly again in 2015 (index score of 74), this result is three points lower than 2014.
12
J00326 Community Satisfaction Survey 2015 – City of Greater Bendigo
Many other individual service areas did not fare so well in 2015 and in fact experienced significant declines compared with the performance indexes of 2014. The most significant declines in performance were in making decisions in the interest of
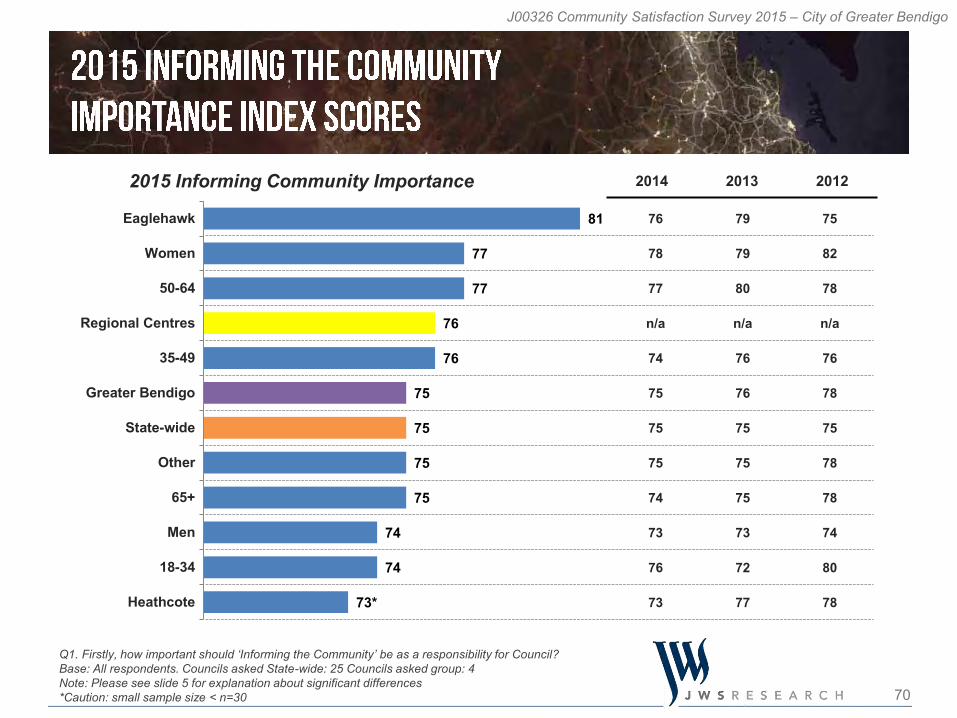
the community (down eight points), community consultation and engagement (down five points), informing the community (down five points), community and culture (down five points) and tourism development (down six points).
The declines in performance on these specific areas appear to be quite widespread across the community and are not isolated to any one demographic segment.
Communication channels continue to evolve. While the proportion of residents making contact with Council over the previous 12 months is up five points (to 64%), the proportion of contact by email is significantly lower (10% in 2015, down from 18% in 2014). A newsletter sent by mail remains the preferred method of contact.

13
J00326 Community Satisfaction Survey 2015 – City of Greater Bendigo
An approach we recommend is to further mine the survey data to better understand the profile of these over and under-performing demographic groups. This can be achieved via additional consultation and data interrogation, or self-mining the SPSS data provided or via the dashboard portal available to the council.
Please note that the category descriptions for the coded open ended responses are generic summaries only. We recommend further analysis of the detailed cross tabulations and the actual verbatim responses, with a view to the responses of the key gender and age groups, especially any target groups identified.
A complimentary personal briefing by senior JWS Research representatives is also available to assist in providing both explanation and interpretation of the results. Please contact JWS Research on 03 8685 8555.
14
J00326 Community Satisfaction Survey 2015 – City of Greater Bendigo
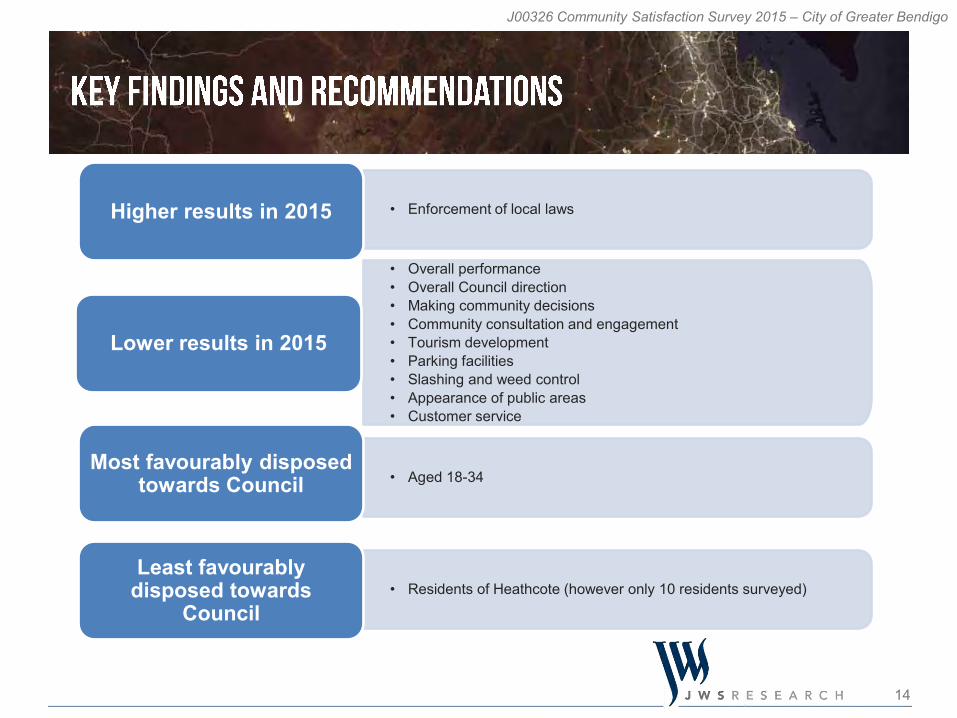
• Enforcement of local lawsHigher results in 2015
• Overall performance• Overall Council direction• Making community decisions• Community consultation and engagement• Tourism development• Parking facilities• Slashing and weed control• Appearance of public areas• Customer service
Lower results in 2015
• Aged 18-34Most favourably disposed
towards Council
• Residents of Heathcote (however only 10 residents surveyed)Least favourably
disposed towards Council
16
J00326 Community Satisfaction Survey 2015 – City of Greater Bendigo
Performance Measures Greater Bendigo
2012
Greater Bendigo
2013
Greater Bendigo
2014
Greater Bendigo
2015
Regional Centres
2015
State-wide2015
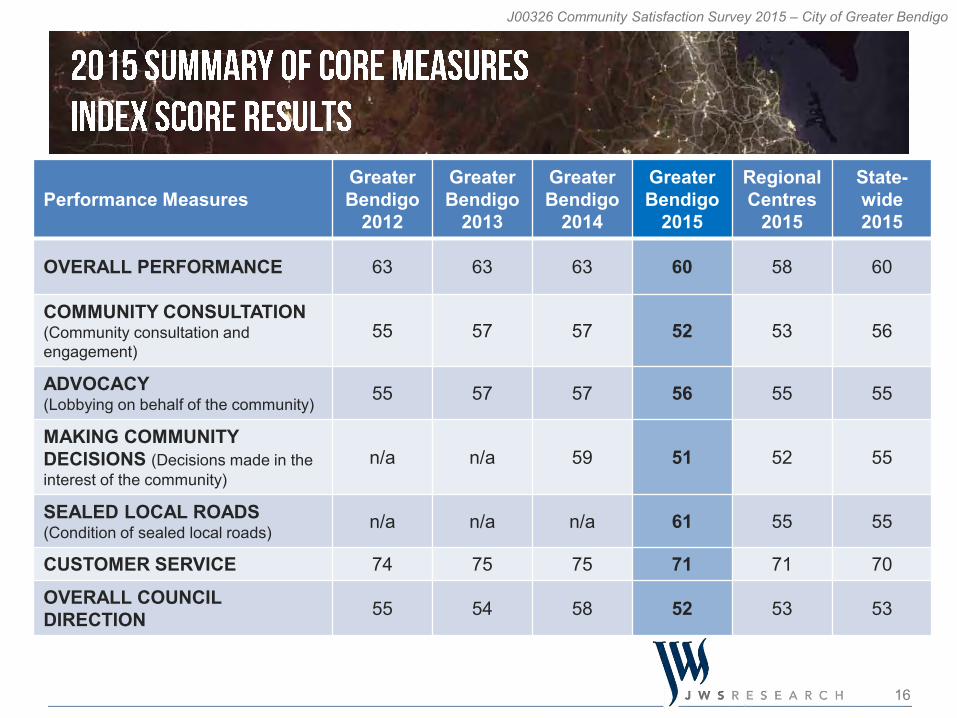
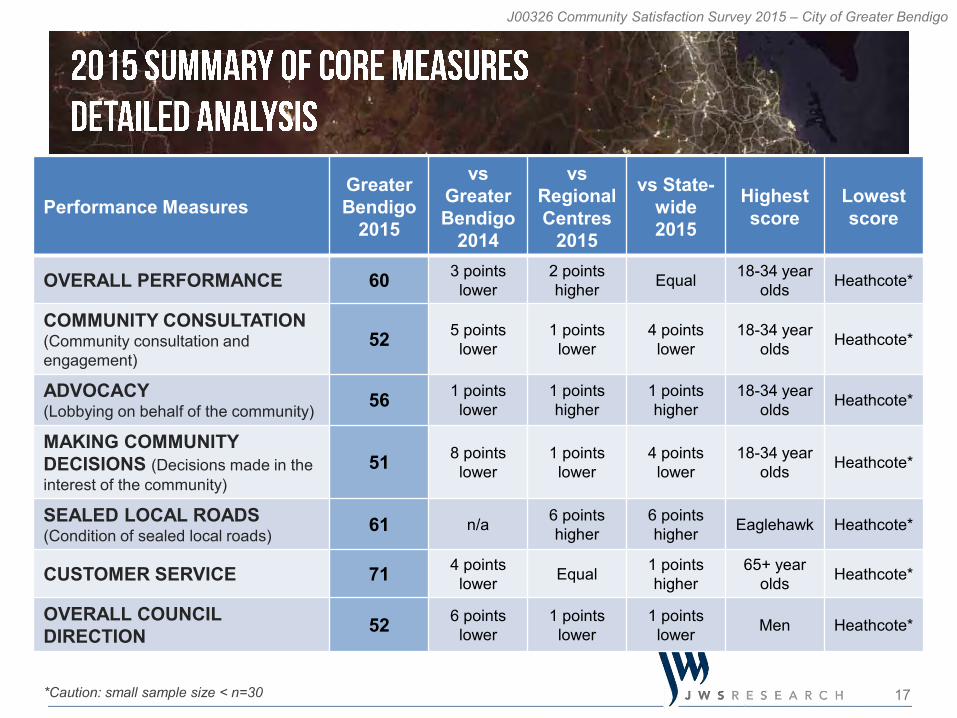
OVERALL PERFORMANCE 63 63 63 60 58 60
COMMUNITY CONSULTATION(Community consultation and engagement)
55 57 57 52 53 56
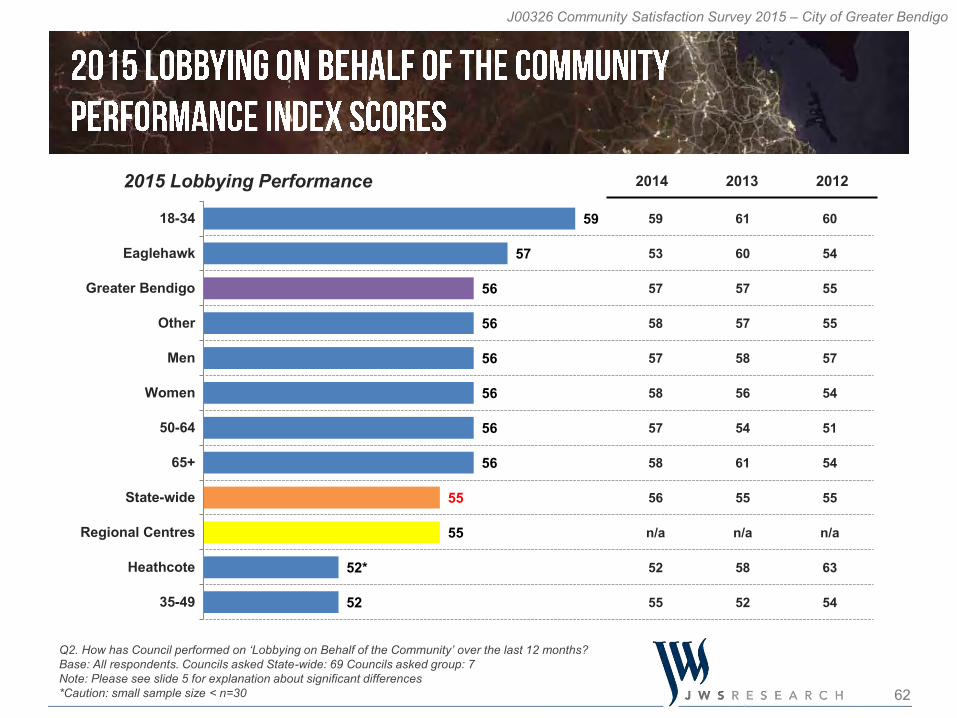
ADVOCACY(Lobbying on behalf of the community) 55 57 57 56 55 55
MAKING COMMUNITYDECISIONS (Decisions made in the interest of the community)
n/a n/a 59 51 52 55
SEALED LOCAL ROADS (Condition of sealed local roads) n/a n/a n/a 61 55 55
CUSTOMER SERVICE 74 75 75 71 71 70
OVERALL COUNCIL DIRECTION 55 54 58 52 53 53
17
J00326 Community Satisfaction Survey 2015 – City of Greater Bendigo
Performance Measures Greater Bendigo
2015
vs Greater Bendigo
2014
vsRegional Centres
2015
vs State-wide2015
Highest score
Lowest score
OVERALL PERFORMANCE 60 3 points lower
2 points higher Equal 18-34 year
olds Heathcote*
COMMUNITY CONSULTATION(Community consultation and engagement)
52 5 points lower
1 points lower
4 points lower
18-34 year olds Heathcote*
ADVOCACY(Lobbying on behalf of the community) 56 1 points
lower1 points higher
1 points higher
18-34 year olds Heathcote*
MAKING COMMUNITYDECISIONS (Decisions made in the interest of the community)
51 8 points lower
1 points lower
4 points lower
18-34 year olds Heathcote*
SEALED LOCAL ROADS (Condition of sealed local roads) 61 n/a 6 points
higher6 points higher Eaglehawk Heathcote*
CUSTOMER SERVICE 71 4 points lower Equal 1 points
higher65+ year
olds Heathcote*
OVERALL COUNCIL DIRECTION 52 6 points
lower1 points
lower1 points
lower Men Heathcote*
*Caution: small sample size < n=30
18
J00326 Community Satisfaction Survey 2015 – City of Greater Bendigo
7
5
4
4
15
36
46
26
32
28
35
32
32
42
35
38
34
17
11
15
11
16
10
9
4
7
4
8
5
6
1
6
14
Overall Performance
Community Consultation
Advocacy
Making CommunityDecisions
Sealed Local Roads
Customer Service
% Very good Good Average Poor Very poor Can't say
Key Measures Summary Results
19 60 16 5Overall Council Direction
% Improved Stayed the same Deteriorated Can't say
19
J00326 Community Satisfaction Survey 2015 – City of Greater Bendigo
Sign
ifica
ntly
hig
her t
han
Stat
e-w
ide
aver
age
Significantly lower than State-w
ide average
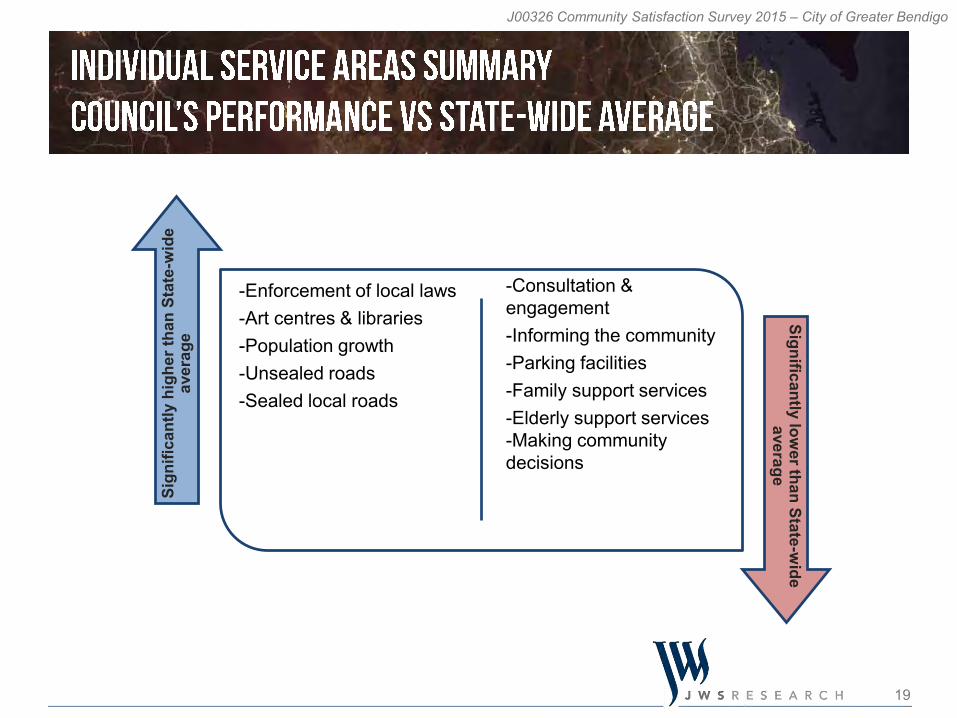
-Enforcement of local laws-Art centres & libraries-Population growth -Unsealed roads-Sealed local roads
-Consultation & engagement -Informing the community -Parking facilities -Family support services -Elderly support services -Making community decisions
20
J00326 Community Satisfaction Survey 2015 – City of Greater Bendigo
Sign
ifica
ntly
hig
her t
han
grou
p av
erag
e Significantly lower than group
average
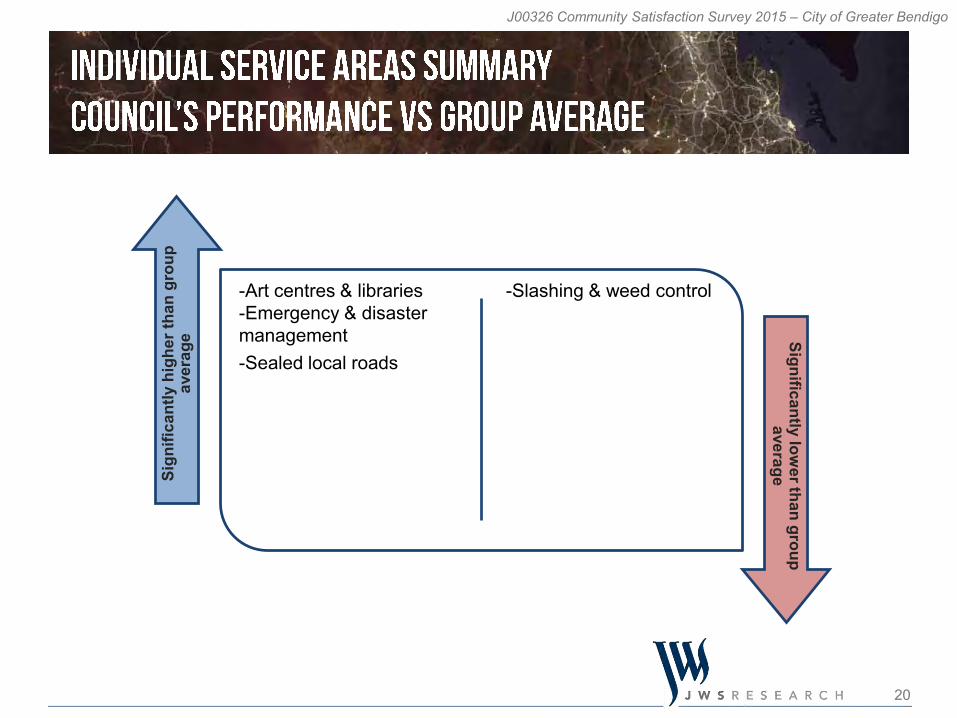
-Art centres & libraries-Emergency & disaster management-Sealed local roads
-Slashing & weed control
21
J00326 Community Satisfaction Survey 2015 – City of Greater Bendigo
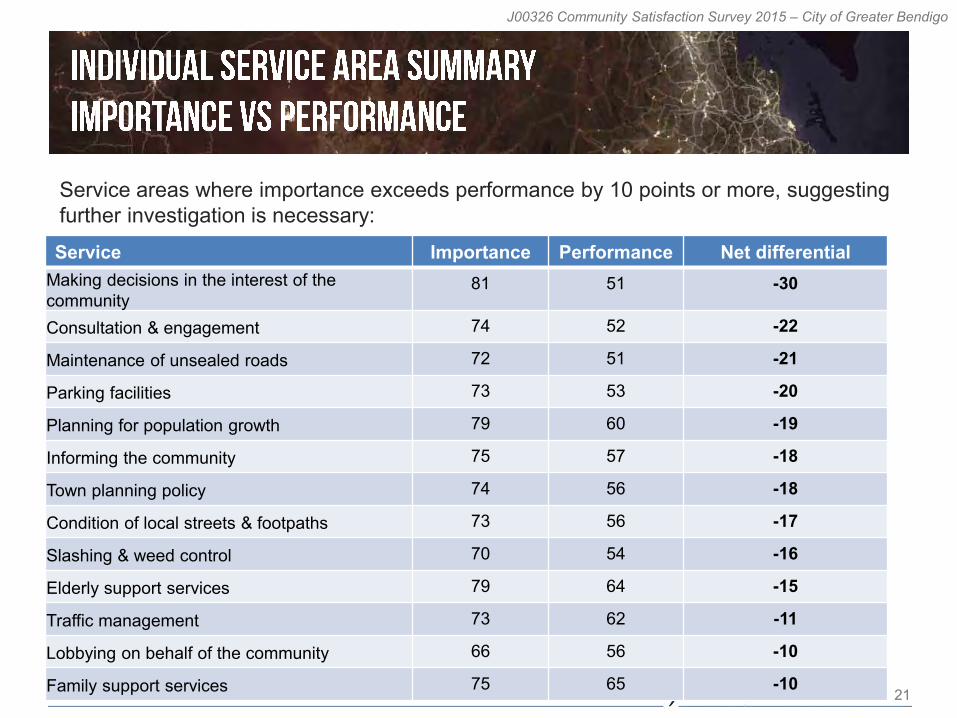
Service areas where importance exceeds performance by 10 points or more, suggesting further investigation is necessary:Service Importance Performance Net differential
Making decisions in the interest of the community
81 51 -30
Consultation & engagement 74 52 -22
Maintenance of unsealed roads 72 51 -21
Parking facilities 73 53 -20
Planning for population growth 79 60 -19
Informing the community 75 57 -18
Town planning policy 74 56 -18
Condition of local streets & footpaths 73 56 -17
Slashing & weed control 70 54 -16
Elderly support services 79 64 -15
Traffic management 73 62 -11
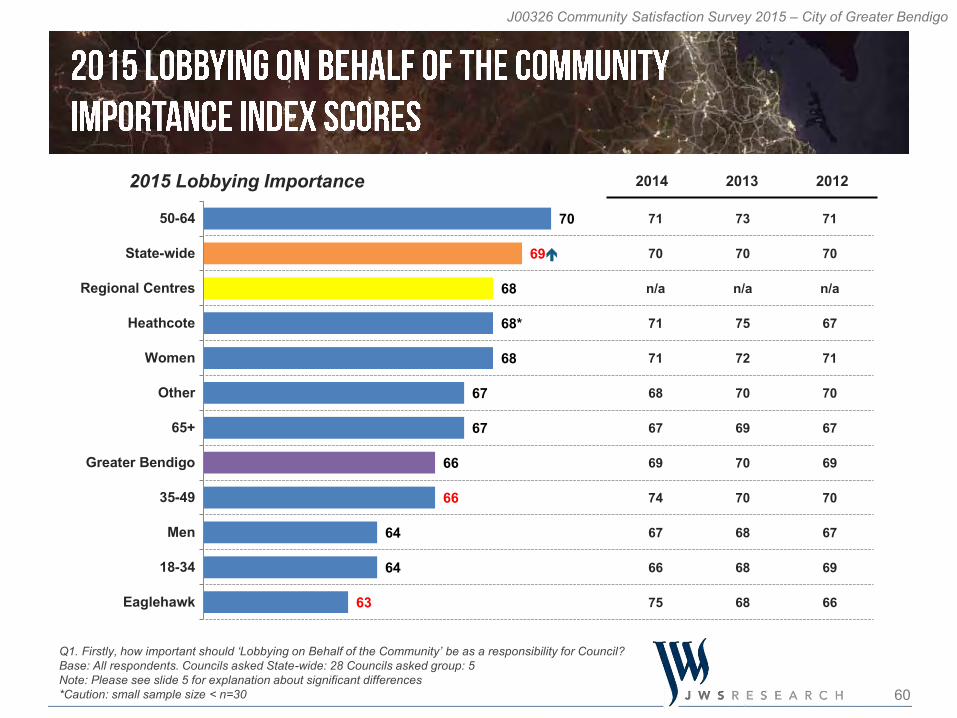
Lobbying on behalf of the community 66 56 -10
Family support services 75 65 -10
22
J00326 Community Satisfaction Survey 2015 – City of Greater Bendigo
Base: All respondents Councils asked State-wide: 55Note: Please see page 5 for explanation of significant differences
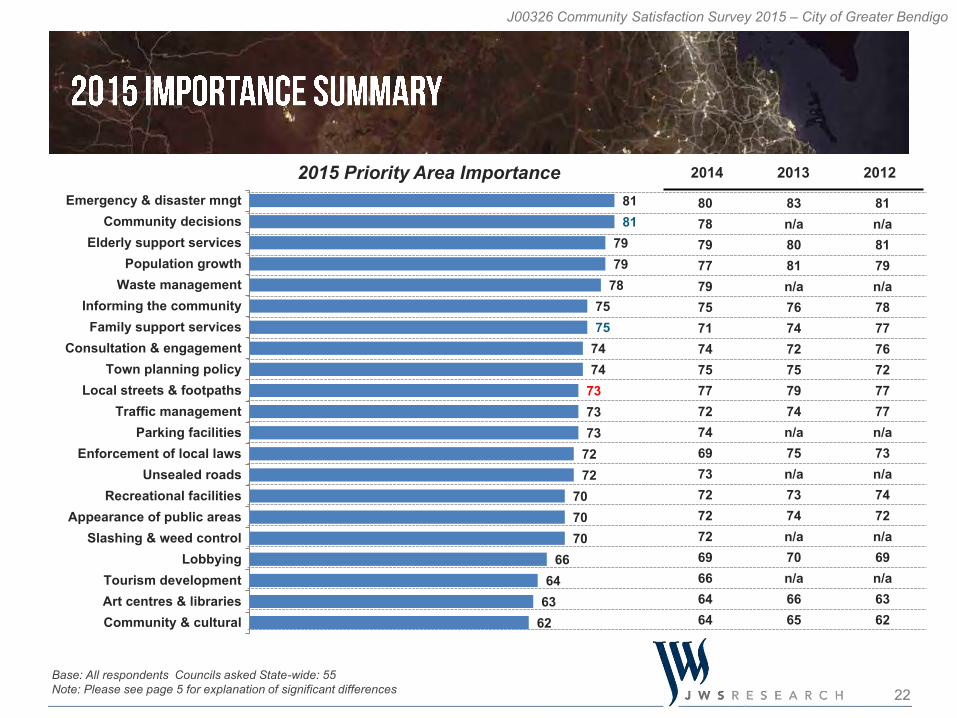
807879777975717475777274697372727269666464
83n/a8081n/a767472757974n/a75n/a7374n/a70n/a6665
81n/a8179n/a787776727777n/a73n/a7472n/a69n/a6362
2014 2013 20122015 Priority Area Importance8181
7979
787575
7474
737373
7272
707070
6664
6362
Emergency & disaster mngtCommunity decisions
Elderly support servicesPopulation growth
Waste managementInforming the communityFamily support services
Consultation & engagementTown planning policy
Local streets & footpathsTraffic management
Parking facilitiesEnforcement of local laws
Unsealed roadsRecreational facilities
Appearance of public areasSlashing & weed control
LobbyingTourism developmentArt centres & librariesCommunity & cultural
23
J00326 Community Satisfaction Survey 2015 – City of Greater Bendigo
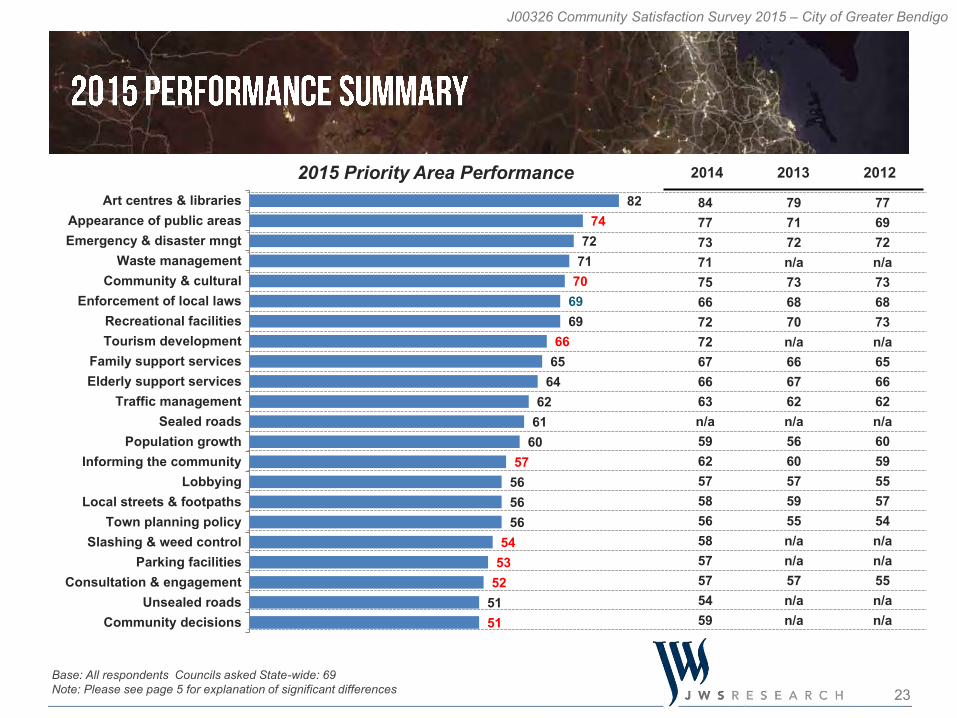
8477737175667272676663n/a59625758565857575459
797172n/a736870n/a666762n/a5660575955n/an/a57n/an/a
776972n/a736873n/a656662n/a6059555754n/an/a55n/an/a
2014 2013 2012
8274
7271
706969
6665
6462
6160
57565656
5453
525151
Art centres & librariesAppearance of public areasEmergency & disaster mngt
Waste managementCommunity & cultural
Enforcement of local lawsRecreational facilitiesTourism development
Family support servicesElderly support services
Traffic managementSealed roads
Population growthInforming the community
LobbyingLocal streets & footpaths
Town planning policySlashing & weed control
Parking facilitiesConsultation & engagement
Unsealed roadsCommunity decisions
Base: All respondents Councils asked State-wide: 69Note: Please see page 5 for explanation of significant differences
2015 Priority Area Performance
24
J00326 Community Satisfaction Survey 2015 – City of Greater Bendigo
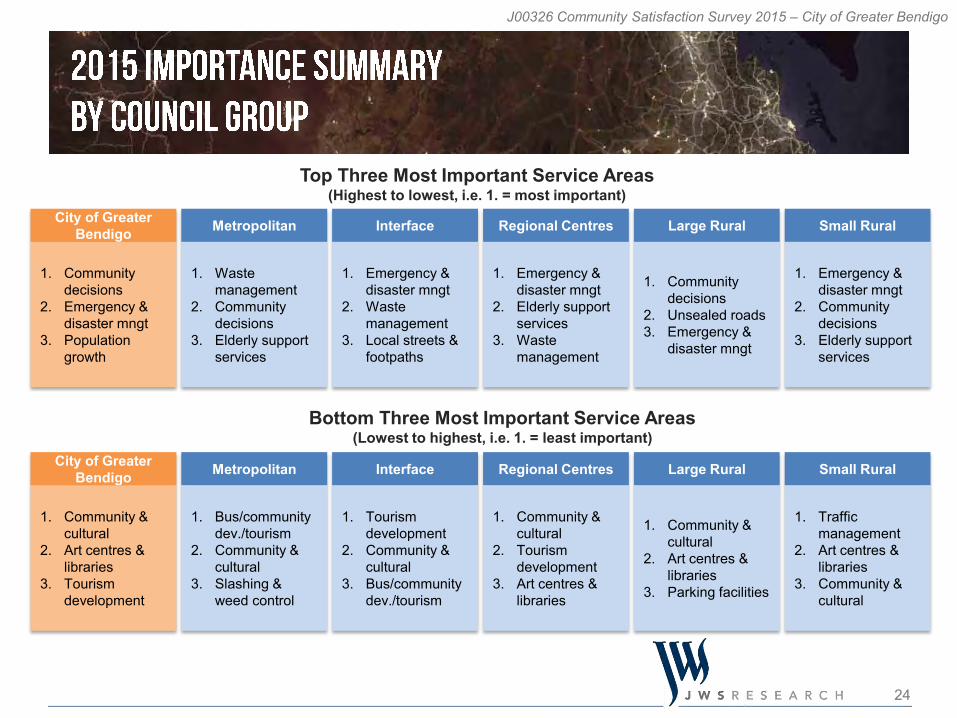
Top Three Most Important Service Areas(Highest to lowest, i.e. 1. = most important)
City of Greater Bendigo
1. Community decisions
2. Emergency & disaster mngt
3. Population growth
Metropolitan
1. Waste management
2. Community decisions
3. Elderly support services
Interface
1. Emergency & disaster mngt
2. Waste management
3. Local streets & footpaths
Regional Centres
1. Emergency & disaster mngt
2. Elderly support services
3. Waste management
Large Rural
1. Community decisions
2. Unsealed roads3. Emergency &
disaster mngt
Small Rural
1. Emergency & disaster mngt
2. Community decisions
3. Elderly support services
Bottom Three Most Important Service Areas (Lowest to highest, i.e. 1. = least important)
City of Greater Bendigo
1. Community & cultural
2. Art centres & libraries
3. Tourism development
Metropolitan
1. Bus/community dev./tourism
2. Community & cultural
3. Slashing & weed control
Interface
1. Tourism development
2. Community & cultural
3. Bus/community dev./tourism
Regional Centres
1. Community & cultural
2. Tourism development
3. Art centres & libraries
Large Rural
1. Community & cultural
2. Art centres & libraries
3. Parking facilities
Small Rural
1. Traffic management
2. Art centres & libraries
3. Community & cultural

25
J00326 Community Satisfaction Survey 2015 – City of Greater Bendigo
Top Three Most Performance Service Areas(Highest to lowest, i.e. 1. = highest performance)
Bottom Three Most Performance Service Areas (Lowest to highest, i.e. 1. = lowest performance)
City of Greater Bendigo
1. Art centres & libraries
2. Appearance of public areas
3. Emergency & disaster mngt
Metropolitan
1. Waste management
2. Art centres & libraries
3. Recreational facilities
Interface
1. Waste management
2. Art centres & libraries
3. Emergency & disaster mngt
Regional Centres
1. Art centres & libraries
2. Appearance of public areas
3. Waste management
Large Rural
1. Art centres & libraries
2. Emergency & disaster mngt
3. Appearance of public areas
Small Rural
1. Appearance of public areas
2. Elderly support services
3. Waste management
City of Greater Bendigo
1. Community decisions
2. Unsealed roads3. Consultation &
engagement
Metropolitan
1. Planning permits
2. Population growth
3. Town planning policy
Interface
1. Unsealed roads2. Planning
permits 3. Slashing &
weed control
Regional Centres
1. Unsealed roads2. Community
decisions3. Parking facilities
Large Rural
1. Unsealed roads2. Sealed roads 3. Population
growth
Small Rural
1. Unsealed roads2. Slashing &
weed control 3. Sealed roads
26
J00326 Community Satisfaction Survey 2015 – City of Greater Bendigo
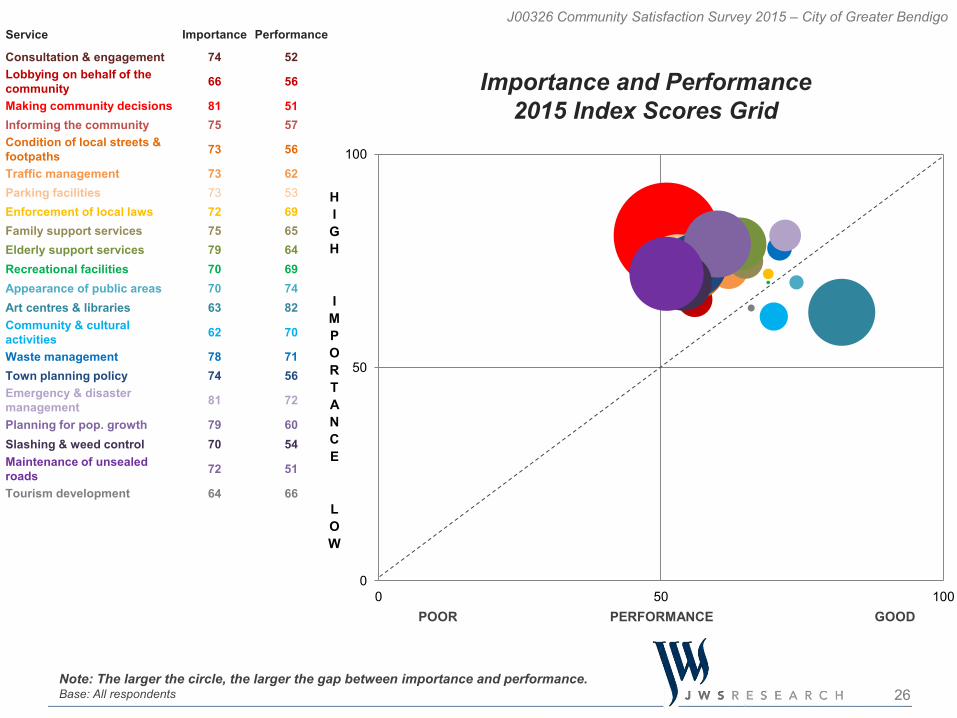
Importance and Performance2015 Index Scores Grid
Note: The larger the circle, the larger the gap between importance and performance.Base: All respondents
Service Importance Performance
Consultation & engagement 74 52Lobbying on behalf of thecommunity 66 56
Making community decisions 81 51Informing the community 75 57Condition of local streets & footpaths 73 56
Traffic management 73 62Parking facilities 73 53Enforcement of local laws 72 69Family support services 75 65Elderly support services 79 64Recreational facilities 70 69Appearance of public areas 70 74Art centres & libraries 63 82Community & cultural activities 62 70
Waste management 78 71Town planning policy 74 56Emergency & disastermanagement 81 72
Planning for pop. growth 79 60Slashing & weed control 70 54Maintenance of unsealed roads 72 51
Tourism development 64 66
0
50
100
0 50 100
HIGH
IMPORTANCE
LOW
POOR PERFORMANCE GOOD
27
J00326 Community Satisfaction Survey 2015 – City of Greater Bendigo
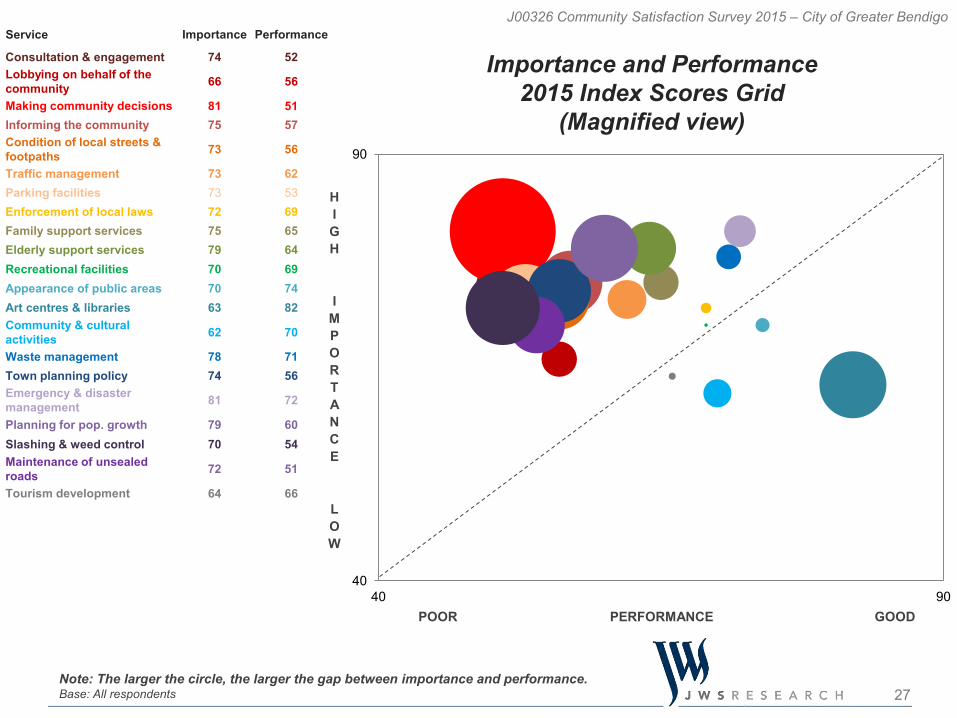
Importance and Performance2015 Index Scores Grid
(Magnified view)
Note: The larger the circle, the larger the gap between importance and performance.Base: All respondents
40
90
40 90
HIGH
IMPORTANCE
LOW
POOR PERFORMANCE GOOD
Service Importance Performance
Consultation & engagement 74 52Lobbying on behalf of thecommunity 66 56
Making community decisions 81 51Informing the community 75 57Condition of local streets & footpaths 73 56
Traffic management 73 62Parking facilities 73 53Enforcement of local laws 72 69Family support services 75 65Elderly support services 79 64Recreational facilities 70 69Appearance of public areas 70 74Art centres & libraries 63 82Community & cultural activities 62 70
Waste management 78 71Town planning policy 74 56Emergency & disastermanagement 81 72
Planning for pop. growth 79 60Slashing & weed control 70 54Maintenance of unsealed roads 72 51
Tourism development 64 66
28
J00326 Community Satisfaction Survey 2015 – City of Greater Bendigo
BES
T TH
ING
SAR
EAS FOR
IMPR
OVEM
ENT
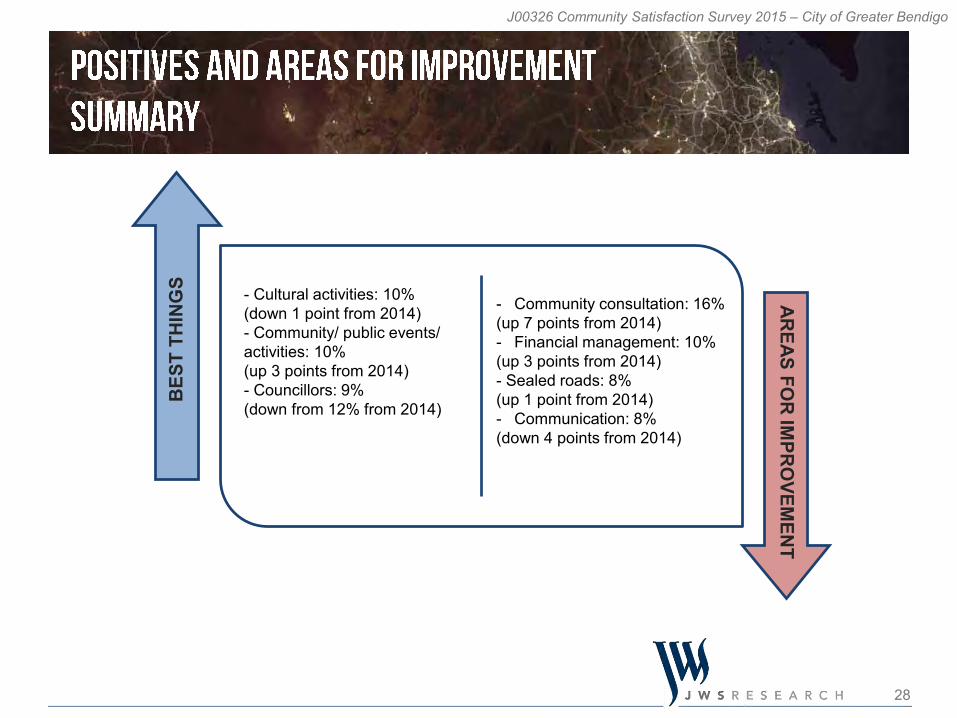
- Cultural activities: 10%(down 1 point from 2014)- Community/ public events/ activities: 10%(up 3 points from 2014)- Councillors: 9%(down from 12% from 2014)
- Community consultation: 16%(up 7 points from 2014)- Financial management: 10%(up 3 points from 2014)- Sealed roads: 8%(up 1 point from 2014)- Communication: 8%(down 4 points from 2014)
29
J00326 Community Satisfaction Survey 2015 – City of Greater Bendigo
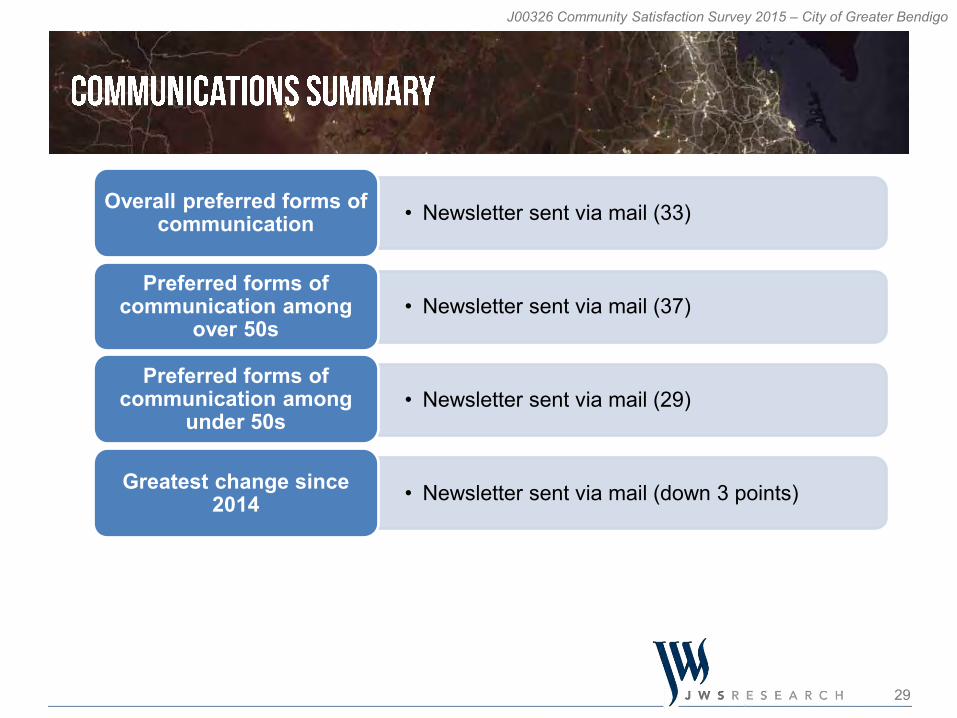
• Newsletter sent via mail (33)Overall preferred forms of communication
• Newsletter sent via mail (37)Preferred forms of
communication among over 50s
• Newsletter sent via mail (29)Preferred forms of
communication among under 50s
• Newsletter sent via mail (down 3 points) Greatest change since 2014

32
J00326 Community Satisfaction Survey 2015 – City of Greater Bendigo
2015 Overall Performance
Q3. ON BALANCE, for the last twelve months, how do you feel about the performance of the City of Greater Bendigo, not just on one or two issues, BUT OVERALL across all responsibility areas? Has it been very good, good, average, poor or very poor? Base: All respondents Councils asked State-wide: 69 Councils asked group: 7Note: Please see page 5 for explanation about significant differences*Caution: small sample size < n=30
64
64
62
63
61
58
64
65
60
n/a
65
64
64
63
64
63
60
59
61
60
61
n/a
67
69
66
64
62
63
60
57
64
59
63
n/a
64
73
2014 2013 2012
63
61
61
60
60
60
60
60
59
58
58
46*
18-34
Other
Men
Greater Bendigo
State-wide
Eaglehawk
Women
50-64
35-49
Regional Centres
65+
Heathcote
33
J00326 Community Satisfaction Survey 2015 – City of Greater Bendigo
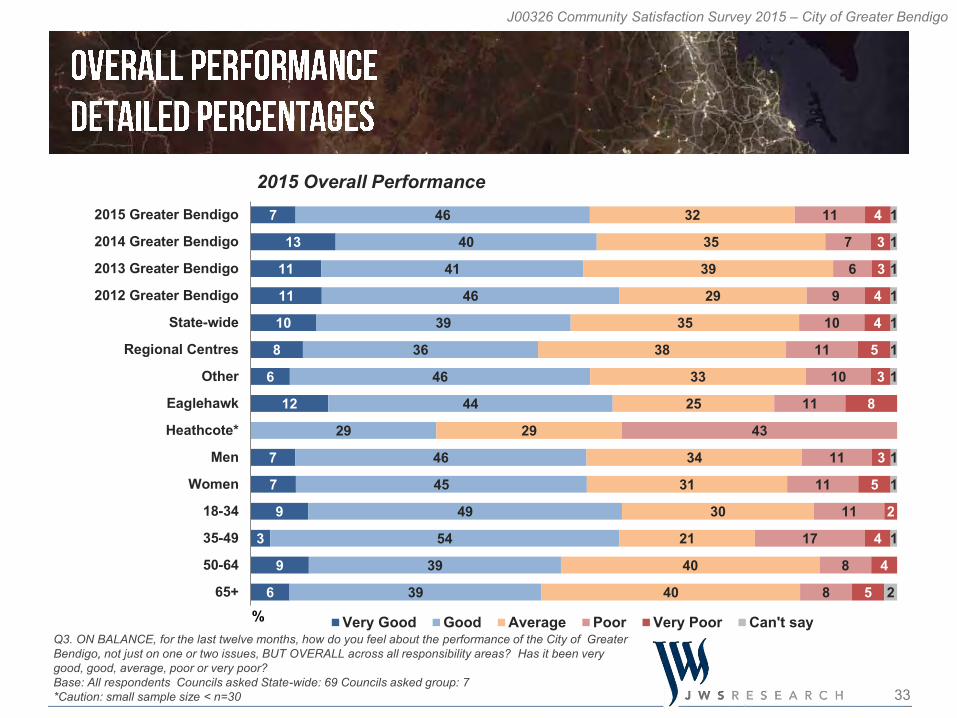
Q3. ON BALANCE, for the last twelve months, how do you feel about the performance of the City of Greater Bendigo, not just on one or two issues, BUT OVERALL across all responsibility areas? Has it been very good, good, average, poor or very poor? Base: All respondents Councils asked State-wide: 69 Councils asked group: 7*Caution: small sample size < n=30
7
13
11
11
10
8
6
12
7
7
9
3
9
6
46
40
41
46
39
36
46
44
29
46
45
49
54
39
39
32
35
39
29
35
38
33
25
29
34
31
30
21
40
40
11
7
6
9
10
11
10
11
43
11
11
11
17
8
8
4
3
3
4
4
5
3
8
3
5
2
4
4
5
1
1
1
1
1
1
1
1
1
1
2
2015 Greater Bendigo
2014 Greater Bendigo
2013 Greater Bendigo
2012 Greater Bendigo
State-wide
Regional Centres
Other
Eaglehawk
Heathcote*
Men
Women
18-34
35-49
50-64
65+% Very Good Good Average Poor Very Poor Can't say
2015 Overall Performance
35
J00326 Community Satisfaction Survey 2015 – City of Greater Bendigo
• 64%, up 5 points on 2014 Overall contact with City of Greater Bendigo
• Aged 18-34 years• Other
Most contact with City of Greater Bendigo
• Heathcote• Aged 65+ years
Least contact with City of Greater Bendigo
• Index score of 71, down 4 points on 2014 Customer Service rating
• Aged 65+ years Most satisfied with Customer Service
• Heathcote Least satisfied with Customer Service
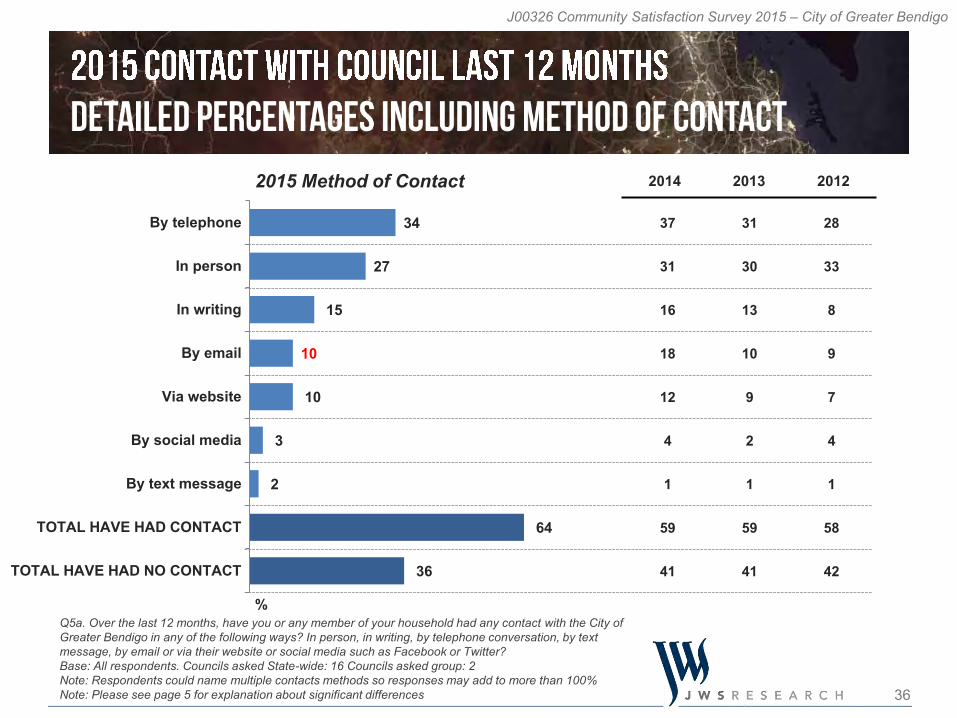
36
J00326 Community Satisfaction Survey 2015 – City of Greater Bendigo
37
31
16
18
12
4
1
59
41
31
30
13
10
9
2
1
59
41
28
33
8
9
7
4
1
58
42
34
27
15
10
10
3
2
64
36
By telephone
In person
In writing
By email
Via website
By social media
By text message
TOTAL HAVE HAD CONTACT
TOTAL HAVE HAD NO CONTACT
Q5a. Over the last 12 months, have you or any member of your household had any contact with the City of Greater Bendigo in any of the following ways? In person, in writing, by telephone conversation, by text message, by email or via their website or social media such as Facebook or Twitter?Base: All respondents. Councils asked State-wide: 16 Councils asked group: 2Note: Respondents could name multiple contacts methods so responses may add to more than 100%Note: Please see page 5 for explanation about significant differences
2014 2013 20122015 Method of Contact
%
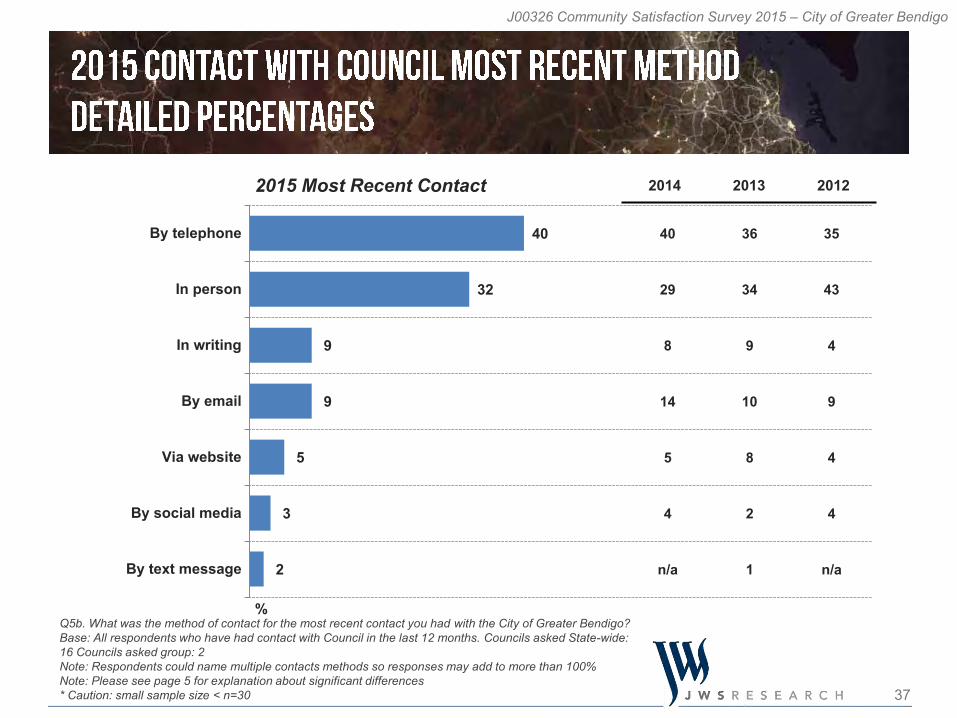
37
J00326 Community Satisfaction Survey 2015 – City of Greater Bendigo
40
29
8
14
5
4
n/a
36
34
9
10
8
2
1
35
43
4
9
4
4
n/a
40
32
9
9
5
3
2
By telephone
In person
In writing
By email
Via website
By social media
By text message
Q5b. What was the method of contact for the most recent contact you had with the City of Greater Bendigo?Base: All respondents who have had contact with Council in the last 12 months. Councils asked State-wide: 16 Councils asked group: 2Note: Respondents could name multiple contacts methods so responses may add to more than 100%Note: Please see page 5 for explanation about significant differences* Caution: small sample size < n=30
2014 2013 20122015 Most Recent Contact
%
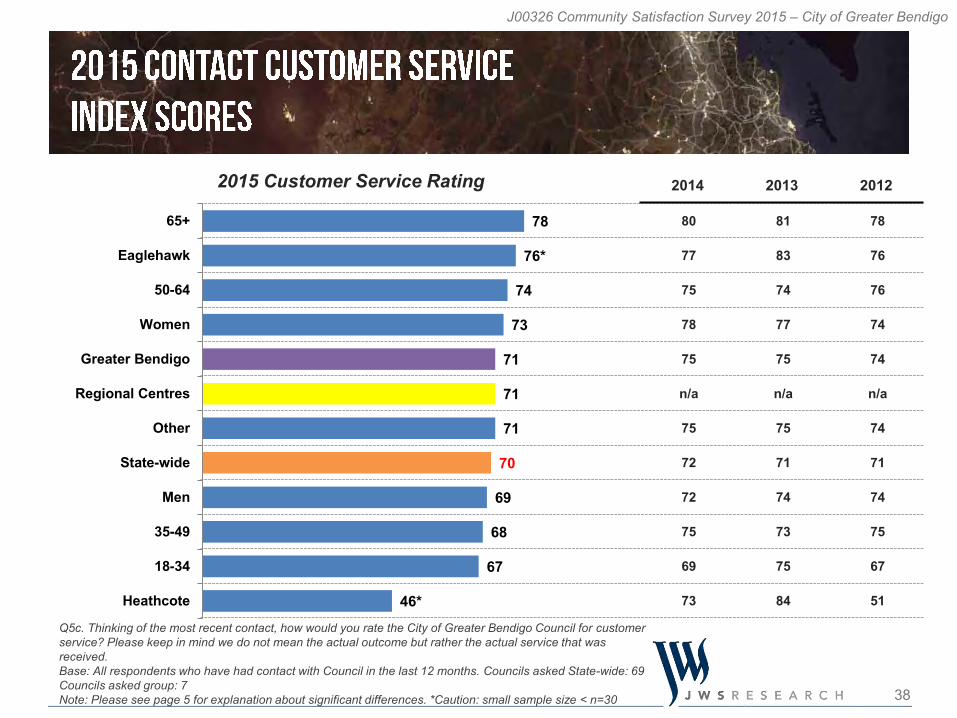
38
J00326 Community Satisfaction Survey 2015 – City of Greater Bendigo
80
77
75
78
75
n/a
75
72
72
75
69
73
81
83
74
77
75
n/a
75
71
74
73
75
84
78
76
76
74
74
n/a
74
71
74
75
67
51
78
76*
74
73
71
71
71
70
69
68
67
46*
65+
Eaglehawk
50-64
Women
Greater Bendigo
Regional Centres
Other
State-wide
Men
35-49
18-34
Heathcote
Q5c. Thinking of the most recent contact, how would you rate the City of Greater Bendigo Council for customer service? Please keep in mind we do not mean the actual outcome but rather the actual service that was received. Base: All respondents who have had contact with Council in the last 12 months. Councils asked State-wide: 69Councils asked group: 7Note: Please see page 5 for explanation about significant differences. *Caution: small sample size < n=30
2015 Customer Service Rating 2014 2013 2012
39
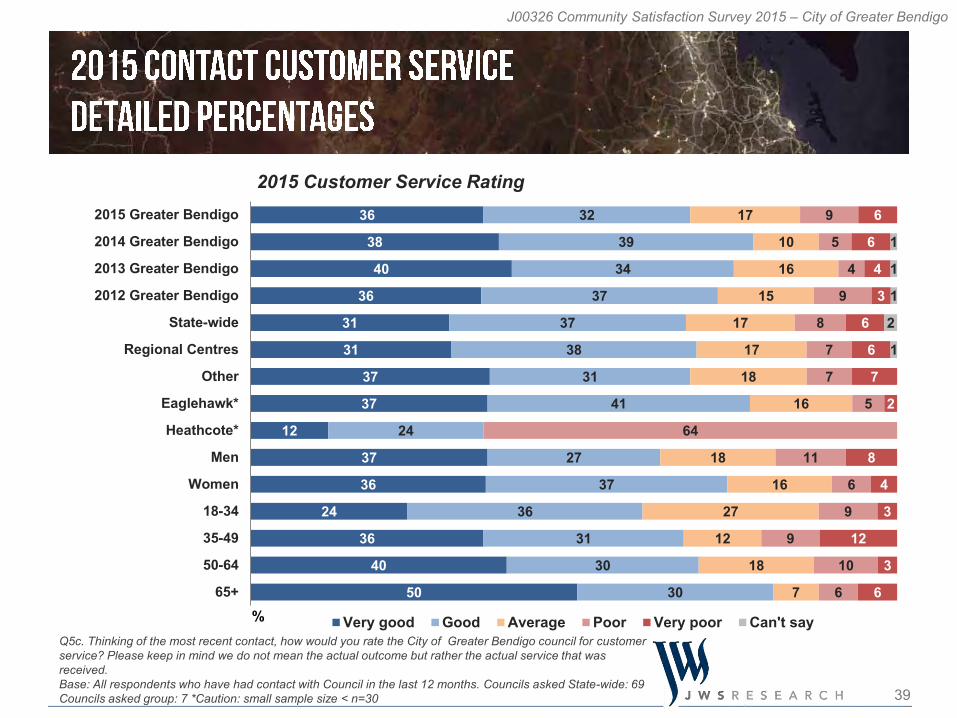
J00326 Community Satisfaction Survey 2015 – City of Greater Bendigo
36
38
40
36
31
31
37
37
12
37
36
24
36
40
50
32
39
34
37
37
38
31
41
24
27
37
36
31
30
30
17
10
16
15
17
17
18
16
18
16
27
12
18
7
9
5
4
9
8
7
7
5
64
11
6
9
9
10
6
6
6
4
3
6
6
7
2
8
4
3
12
3
6
1
1
1
2
1
2015 Greater Bendigo
2014 Greater Bendigo
2013 Greater Bendigo
2012 Greater Bendigo
State-wide
Regional Centres
Other
Eaglehawk*
Heathcote*
Men
Women
18-34
35-49
50-64
65+% Very good Good Average Poor Very poor Can't say
Q5c. Thinking of the most recent contact, how would you rate the City of Greater Bendigo council for customer service? Please keep in mind we do not mean the actual outcome but rather the actual service that was received. Base: All respondents who have had contact with Council in the last 12 months. Councils asked State-wide: 69Councils asked group: 7 *Caution: small sample size < n=30
2015 Customer Service Rating
40
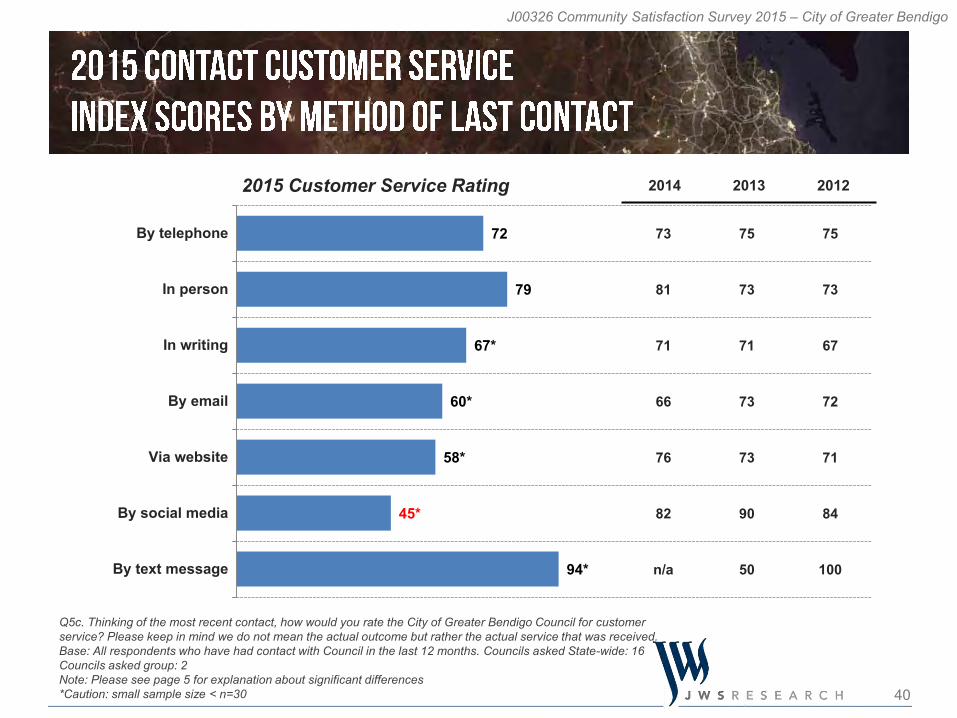
J00326 Community Satisfaction Survey 2015 – City of Greater Bendigo
73
81
71
66
76
82
n/a
75
73
71
73
73
90
50
75
73
67
72
71
84
100
72
79
67*
60*
58*
45*
94*
By telephone
In person
In writing
By email
Via website
By social media
By text message
Q5c. Thinking of the most recent contact, how would you rate the City of Greater Bendigo Council for customer service? Please keep in mind we do not mean the actual outcome but rather the actual service that was received. Base: All respondents who have had contact with Council in the last 12 months. Councils asked State-wide: 16Councils asked group: 2Note: Please see page 5 for explanation about significant differences*Caution: small sample size < n=30
2014 2013 20122015 Customer Service Rating
41
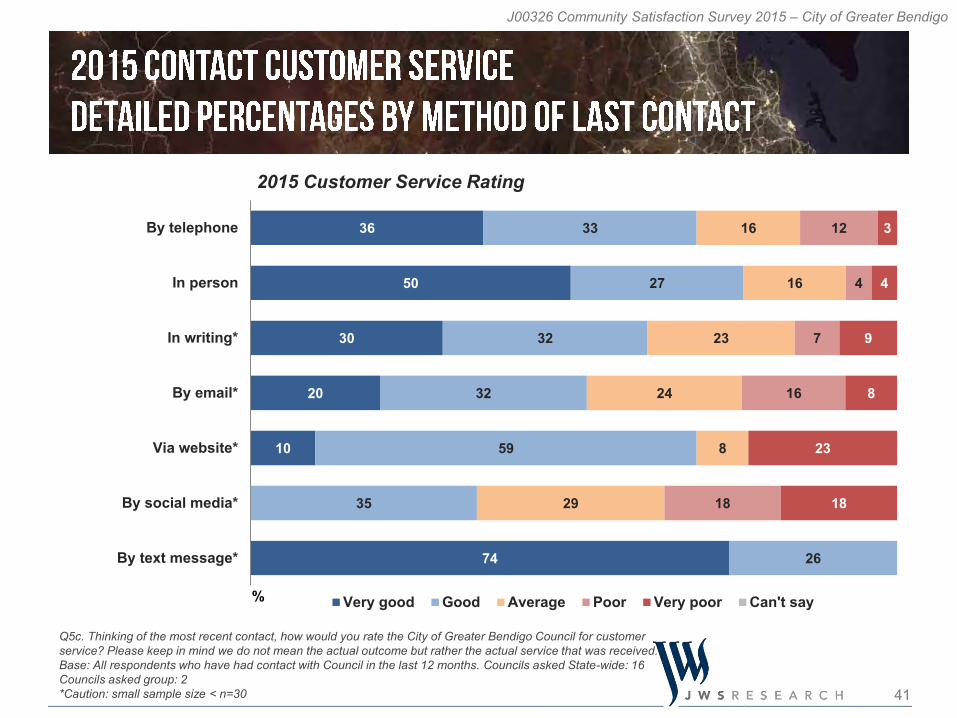
J00326 Community Satisfaction Survey 2015 – City of Greater Bendigo
36
50
30
20
10
74
33
27
32
32
59
35
26
16
16
23
24
8
29
12
4
7
16
18
3
4
9
8
23
18
By telephone
In person
In writing*
By email*
Via website*
By social media*
By text message*
% Very good Good Average Poor Very poor Can't say
Q5c. Thinking of the most recent contact, how would you rate the City of Greater Bendigo Council for customer service? Please keep in mind we do not mean the actual outcome but rather the actual service that was received. Base: All respondents who have had contact with Council in the last 12 months. Councils asked State-wide: 16Councils asked group: 2*Caution: small sample size < n=30
2015 Customer Service Rating
43
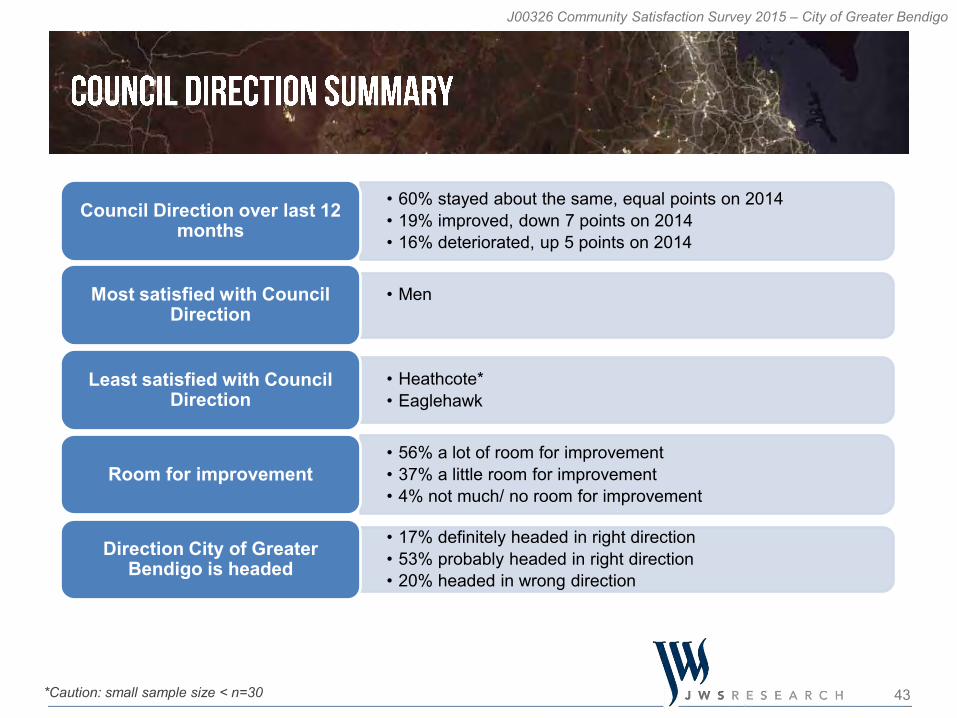
J00326 Community Satisfaction Survey 2015 – City of Greater Bendigo
• 60% stayed about the same, equal points on 2014• 19% improved, down 7 points on 2014• 16% deteriorated, up 5 points on 2014
Council Direction over last 12 months
• MenMost satisfied with Council Direction
• Heathcote*• Eaglehawk
Least satisfied with Council Direction
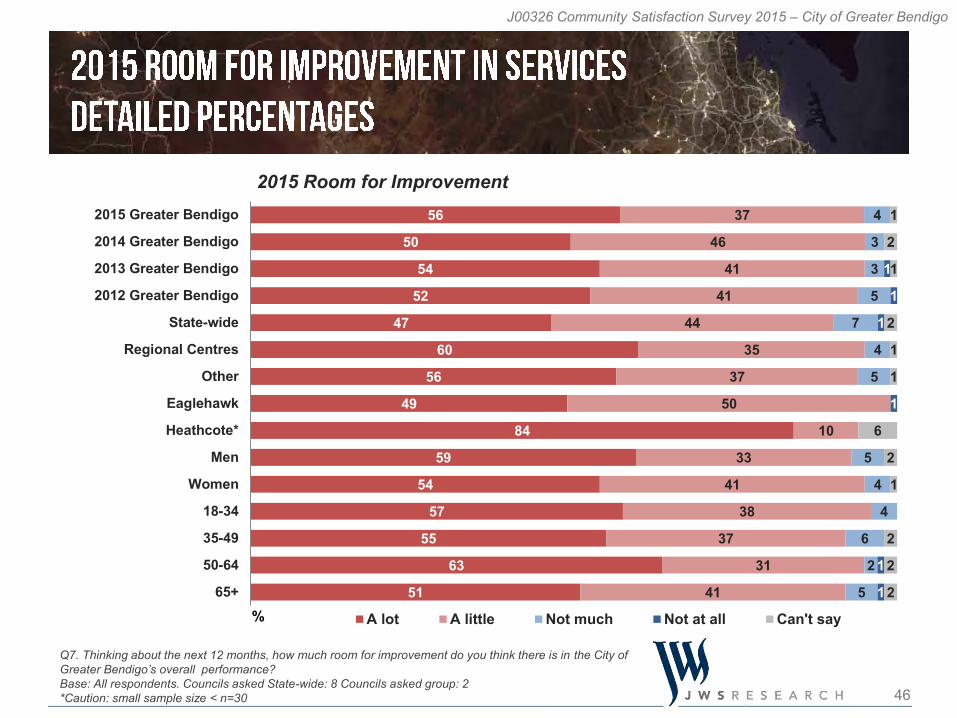
• 56% a lot of room for improvement• 37% a little room for improvement• 4% not much/ no room for improvement
Room for improvement
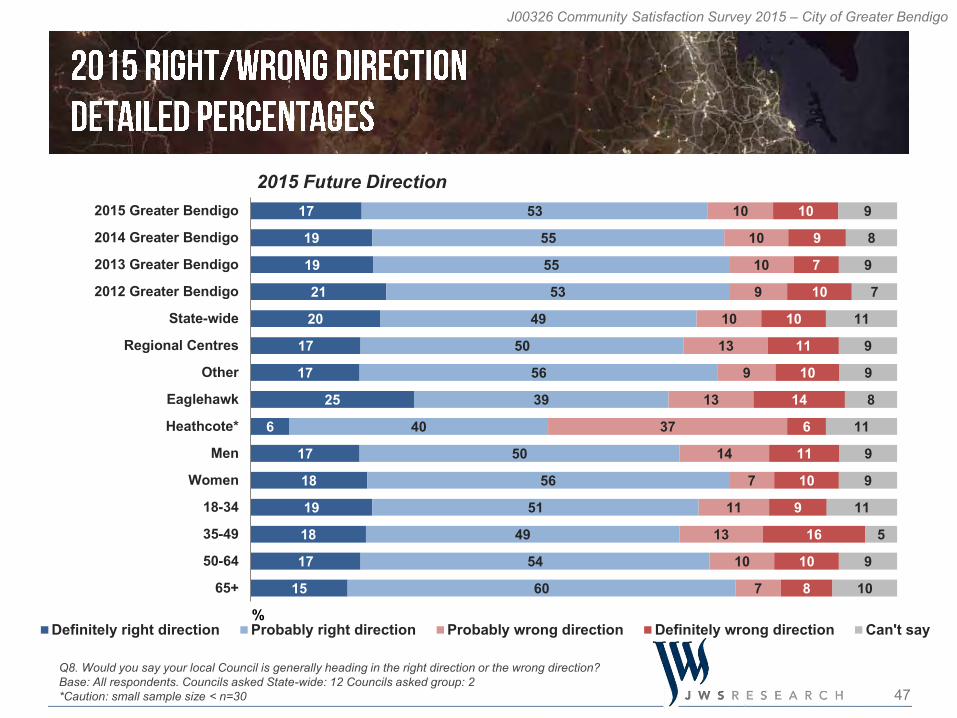
• 17% definitely headed in right direction• 53% probably headed in right direction• 20% headed in wrong direction
Direction City of Greater Bendigo is headed
*Caution: small sample size < n=30
44
J00326 Community Satisfaction Survey 2015 – City of Greater Bendigo
57
53
n/a
57
56
59
58
55
59
63
63
58
55
53
n/a
54
48
63
54
54
53
52
55
43
55
52
n/a
55
53
57
55
55
56
56
50
71
54
53
53
53
53
53
52
52
50
49
48
31*
Men
State-wide
Regional Centres
Other
35-49
65+
Greater Bendigo
18-34
Women
50-64
Eaglehawk
Heathcote
Q6. Over the last 12 months, what is your view of the direction of the City of Greater Bendigo’s overall performance? Base: All respondents. Councils asked State-wide: 69 Councils asked group: 7Note: Please see page 5 for explanation about significant differences*Caution: small sample size < n=30
2015 Overall Direction 2014 2013 2012
45
J00326 Community Satisfaction Survey 2015 – City of Greater Bendigo
19
26
20
21
20
23
20
21
6
22
17
17
23
16
20
60
60
64
64
63
57
63
48
40
59
62
66
56
61
58
16
11
13
11
13
17
14
24
36
15
16
13
18
17
15
5
4
4
3
5
3
4
7
19
4
5
4
3
5
7
2015 Greater Bendigo
2014 Greater Bendigo
2013 Greater Bendigo
2012 Greater Bendigo
State-wide
Regional Centres
Other
Eaglehawk
Heathcote*
Men
Women
18-34
35-49
50-64
65+% Improved Stayed the same Deteriorated Can't say
Q6. Over the last 12 months, what is your view of the direction of the City of Greater Bendigo’s overall performance? Base: All respondents. Councils asked State-wide: 69 Councils asked group: 7*Caution: small sample size < n=30
2015 Overall Direction
46
J00326 Community Satisfaction Survey 2015 – City of Greater Bendigo
56
50
54
52
47
60
56
49
84
59
54
57
55
63
51
37
46
41
41
44
35
37
50
10
33
41
38
37
31
41
4
3
3
5
7
4
5
5
4
4
6
2
5
1
1
1
1
1
1
1
2
1
2
1
1
6
2
1
2
2
2
2015 Greater Bendigo
2014 Greater Bendigo
2013 Greater Bendigo
2012 Greater Bendigo
State-wide
Regional Centres
Other
Eaglehawk
Heathcote*
Men
Women
18-34
35-49
50-64
65+% A lot A little Not much Not at all Can't say
Q7. Thinking about the next 12 months, how much room for improvement do you think there is in the City of Greater Bendigo’s overall performance?Base: All respondents. Councils asked State-wide: 8 Councils asked group: 2*Caution: small sample size < n=30
2015 Room for Improvement
47
J00326 Community Satisfaction Survey 2015 – City of Greater Bendigo
17
19
19
21
20
17
17
25
6
17
18
19
18
17
15
53
55
55
53
49
50
56
39
40
50
56
51
49
54
60
10
10
10
9
10
13
9
13
37
14
7
11
13
10
7
10
9
7
10
10
11
10
14
6
11
10
9
16
10
8
9
8
9
7
11
9
9
8
11
9
9
11
5
9
10
2015 Greater Bendigo
2014 Greater Bendigo
2013 Greater Bendigo
2012 Greater Bendigo
State-wide
Regional Centres
Other
Eaglehawk
Heathcote*
Men
Women
18-34
35-49
50-64
65+
%Definitely right direction Probably right direction Probably wrong direction Definitely wrong direction Can't say
Q8. Would you say your local Council is generally heading in the right direction or the wrong direction?Base: All respondents. Councils asked State-wide: 12 Councils asked group: 2*Caution: small sample size < n=30
2015 Future Direction
48
J00326 Community Satisfaction Survey 2015 – City of Greater Bendigo
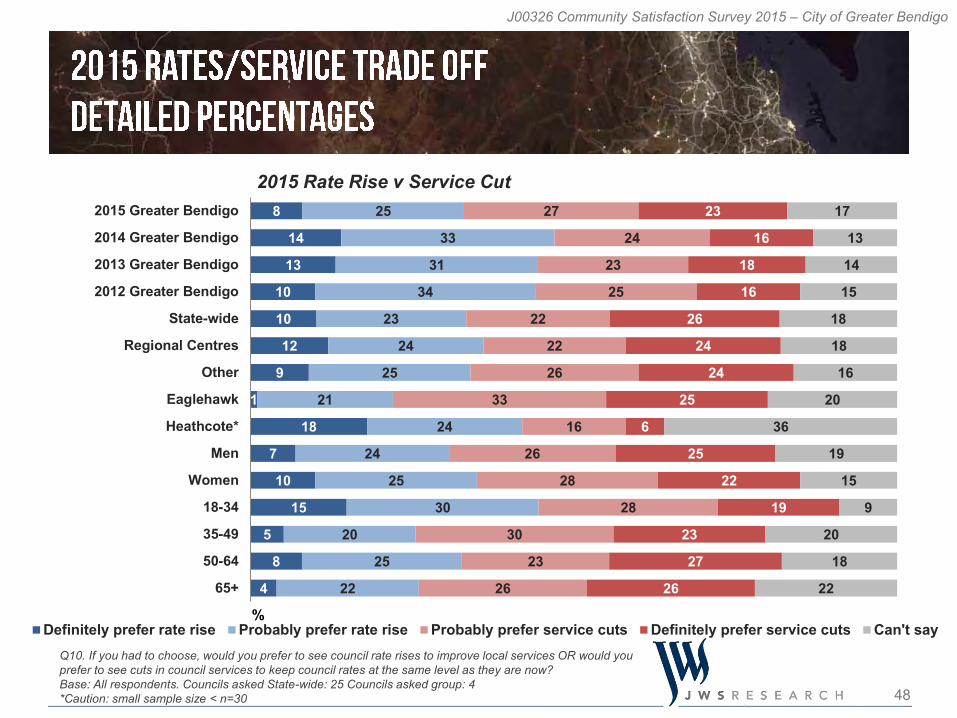
8
14
13
10
10
12
9
1
18
7
10
15
5
8
4
25
33
31
34
23
24
25
21
24
24
25
30
20
25
22
27
24
23
25
22
22
26
33
16
26
28
28
30
23
26
23
16
18
16
26
24
24
25
6
25
22
19
23
27
26
17
13
14
15
18
18
16
20
36
19
15
9
20
18
22
2015 Greater Bendigo
2014 Greater Bendigo
2013 Greater Bendigo
2012 Greater Bendigo
State-wide
Regional Centres
Other
Eaglehawk
Heathcote*
Men
Women
18-34
35-49
50-64
65+
%Definitely prefer rate rise Probably prefer rate rise Probably prefer service cuts Definitely prefer service cuts Can't say
Q10. If you had to choose, would you prefer to see council rate rises to improve local services OR would you prefer to see cuts in council services to keep council rates at the same level as they are now?Base: All respondents. Councils asked State-wide: 25 Councils asked group: 4*Caution: small sample size < n=30
2015 Rate Rise v Service Cut
50
J00326 Community Satisfaction Survey 2015 – City of Greater Bendigo
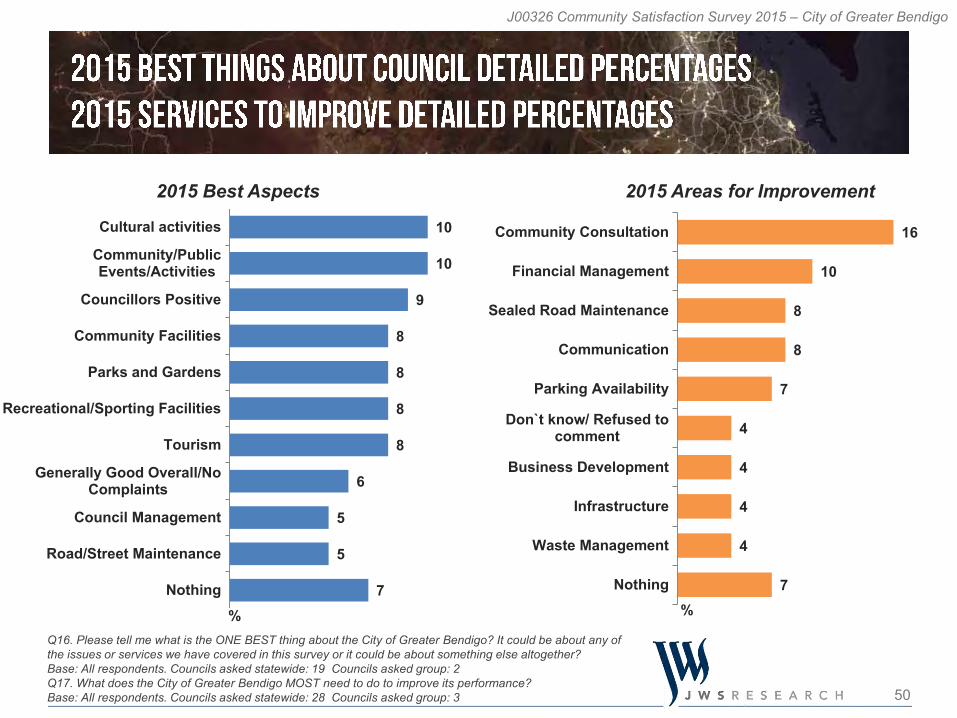
16
10
8
8
7
4
4
4
4
7
Community Consultation
Financial Management
Sealed Road Maintenance
Communication
Parking Availability
Don`t know/ Refused tocomment
Business Development
Infrastructure
Waste Management
Nothing
10
10
9
8
8
8
8
6
5
5
7
Cultural activities
Community/PublicEvents/Activities
Councillors Positive
Community Facilities
Parks and Gardens
Recreational/Sporting Facilities
Tourism
Generally Good Overall/NoComplaints
Council Management
Road/Street Maintenance
Nothing
Q16. Please tell me what is the ONE BEST thing about the City of Greater Bendigo? It could be about any of the issues or services we have covered in this survey or it could be about something else altogether? Base: All respondents. Councils asked statewide: 19 Councils asked group: 2 Q17. What does the City of Greater Bendigo MOST need to do to improve its performance? Base: All respondents. Councils asked statewide: 28 Councils asked group: 3
2015 Best Aspects 2015 Areas for Improvement
% %

52
J00326 Community Satisfaction Survey 2015 – City of Greater Bendigo
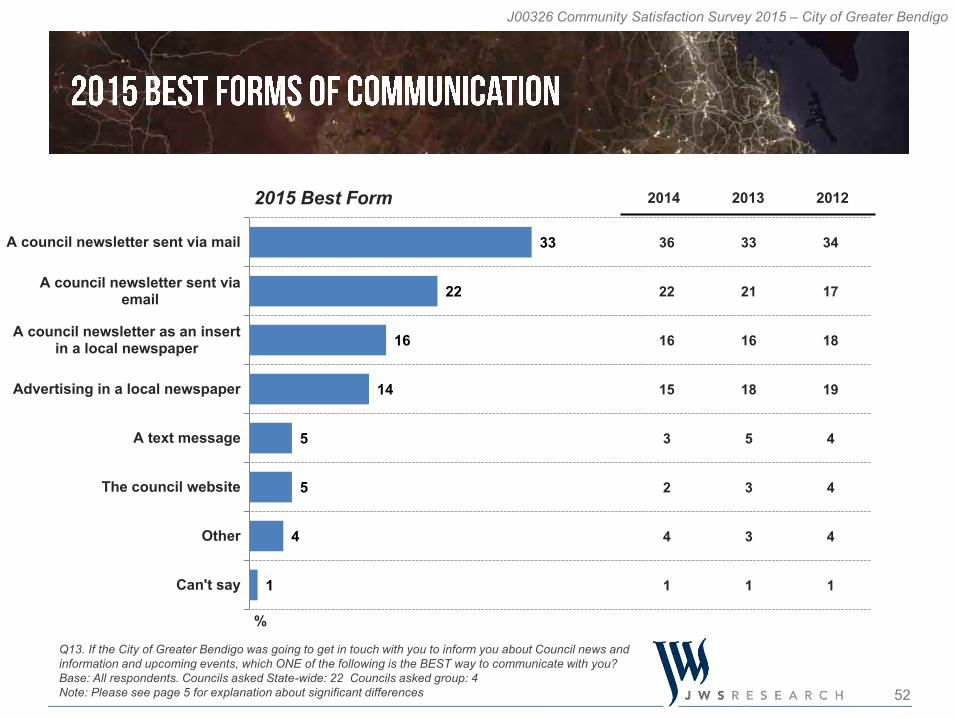
Q13. If the City of Greater Bendigo was going to get in touch with you to inform you about Council news and information and upcoming events, which ONE of the following is the BEST way to communicate with you?Base: All respondents. Councils asked State-wide: 22 Councils asked group: 4Note: Please see page 5 for explanation about significant differences
36
22
16
15
3
2
4
1
33
21
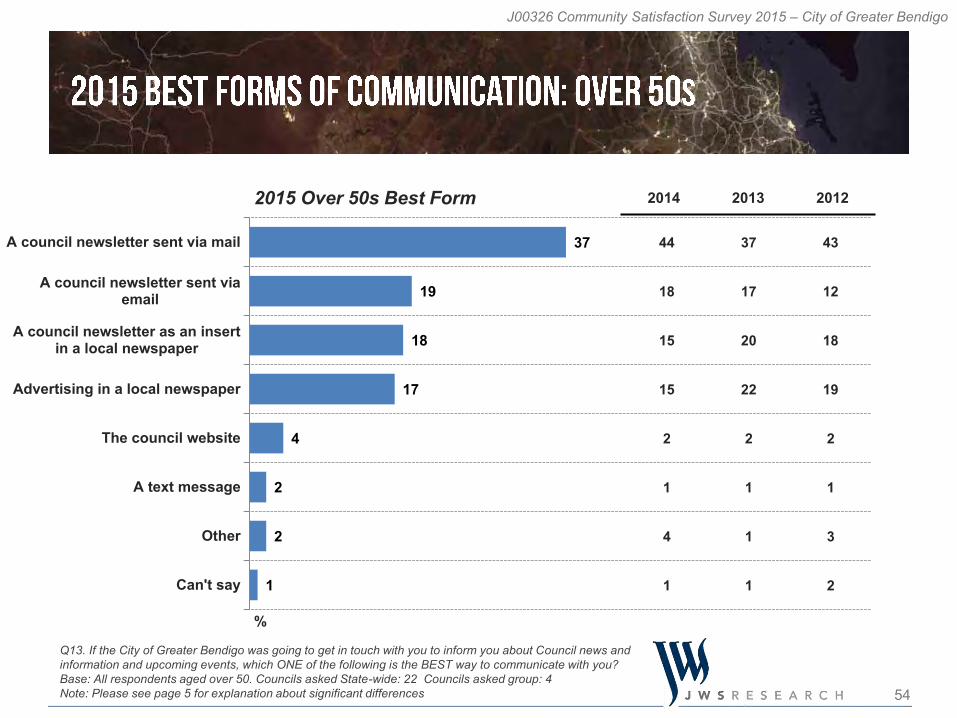
16
18
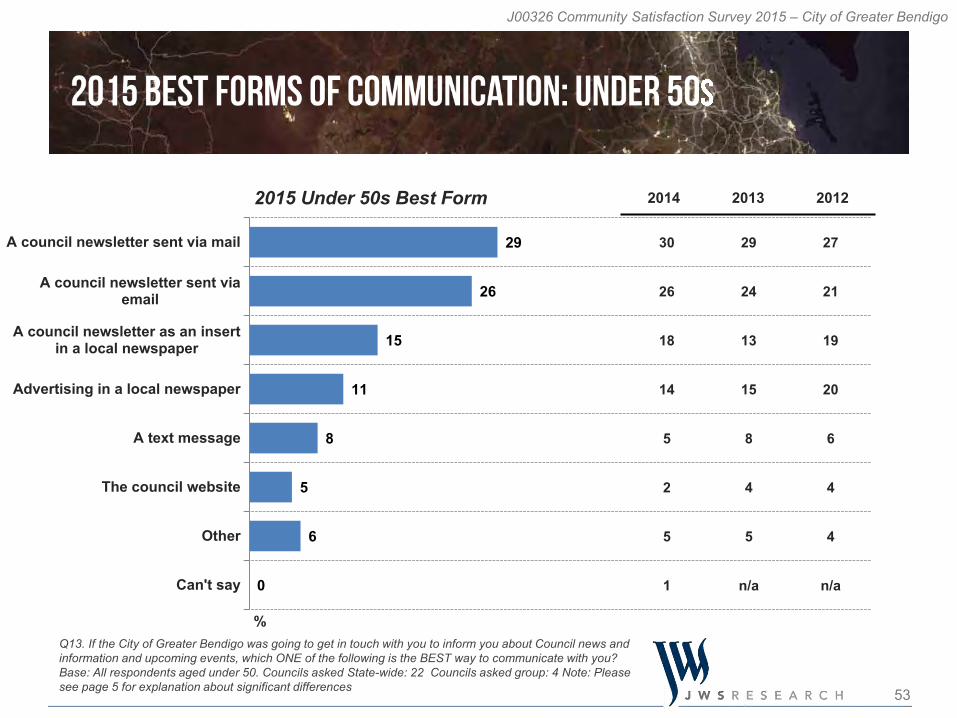
5
3
3
1
34
17
18
19
4
4
4
1
2014 2013 20122015 Best Form
33
22
16
14
5
5
4
1
A council newsletter sent via mail
A council newsletter sent viaemail
A council newsletter as an insertin a local newspaper
Advertising in a local newspaper
A text message
The council website
Other
Can't say
%
53
J00326 Community Satisfaction Survey 2015 – City of Greater Bendigo
Q13. If the City of Greater Bendigo was going to get in touch with you to inform you about Council news and information and upcoming events, which ONE of the following is the BEST way to communicate with you?Base: All respondents aged under 50. Councils asked State-wide: 22 Councils asked group: 4 Note: Please see page 5 for explanation about significant differences
30
26
18
14
5
2
5
1
29
24
13
15
8
4
5
n/a
27
21
19
20
6
4
4
n/a
2014 2013 20122015 Under 50s Best Form
29
26
15
11
8
5
6
0
A council newsletter sent via mail
A council newsletter sent viaemail
A council newsletter as an insertin a local newspaper
Advertising in a local newspaper
A text message
The council website
Other
Can't say
%
54
J00326 Community Satisfaction Survey 2015 – City of Greater Bendigo
Q13. If the City of Greater Bendigo was going to get in touch with you to inform you about Council news and information and upcoming events, which ONE of the following is the BEST way to communicate with you?Base: All respondents aged over 50. Councils asked State-wide: 22 Councils asked group: 4 Note: Please see page 5 for explanation about significant differences
44
18
15
15
2
1
4
1
37
17
20
22
2
1
1
1
43
12
18
19
2
1
3
2
2014 2013 20122015 Over 50s Best Form
37
19
18
17
4
2
2
1
A council newsletter sent via mail
A council newsletter sent viaemail
A council newsletter as an insertin a local newspaper
Advertising in a local newspaper
The council website
A text message
Other
Can't say
%

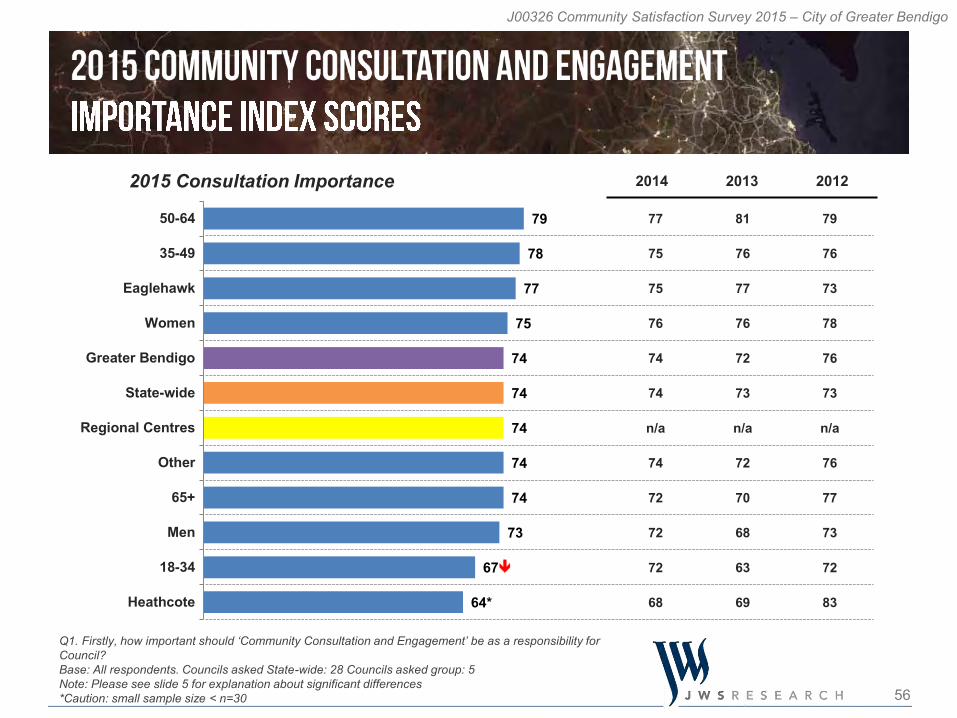
56
J00326 Community Satisfaction Survey 2015 – City of Greater Bendigo
77
75
75
76
74
74
n/a
74
72
72
72
68
81
76
77
76
72
73
n/a
72
70
68
63
69
79
76
73
78
76
73
n/a
76
77
73
72
83
79
78
77
75
74
74
74
74
74
73
67
64*
50-64
35-49
Eaglehawk
Women
Greater Bendigo
State-wide
Regional Centres
Other
65+
Men
18-34
Heathcote
Q1. Firstly, how important should ‘Community Consultation and Engagement’ be as a responsibility for Council?Base: All respondents. Councils asked State-wide: 28 Councils asked group: 5 Note: Please see slide 5 for explanation about significant differences*Caution: small sample size < n=30
2014 2013 20122015 Consultation Importance
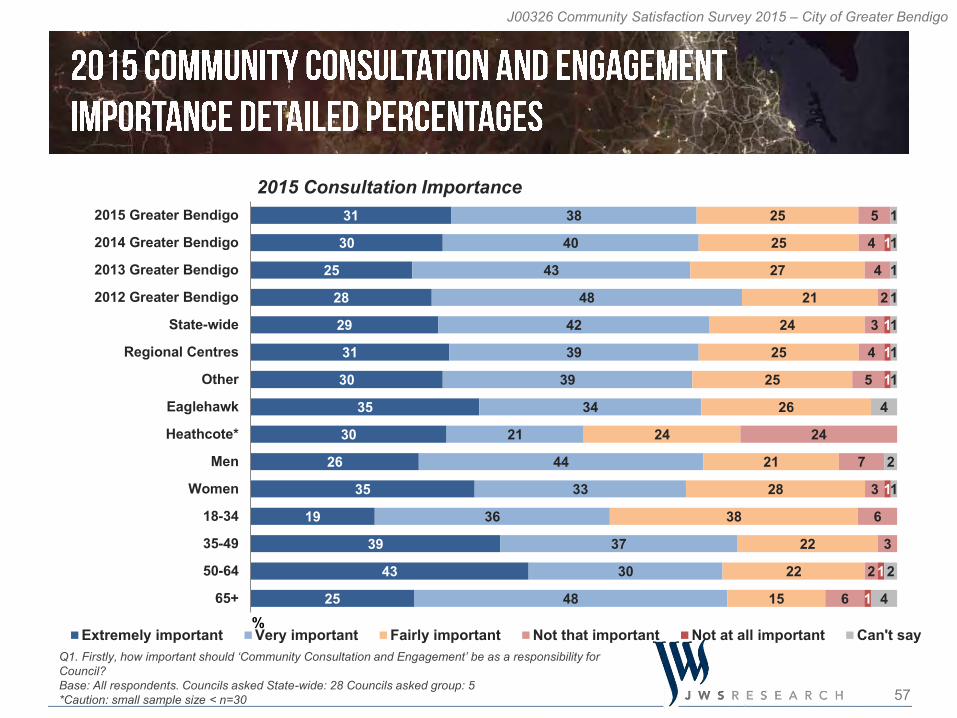
57
J00326 Community Satisfaction Survey 2015 – City of Greater Bendigo
31
30
25
28
29
31
30
35
30
26
35
19
39
43
25
38
40
43
48
42
39
39
34
21
44
33
36
37
30
48
25
25
27
21
24
25
25
26
24
21
28
38
22
22
15
5
4
4
2
3
4
5
24
7
3
6
3
2
6
1
1
1
1
1
1
1
1
1
1
1
1
1
1
4
2
1
2
4
2015 Greater Bendigo
2014 Greater Bendigo
2013 Greater Bendigo
2012 Greater Bendigo
State-wide
Regional Centres
Other
Eaglehawk
Heathcote*
Men
Women
18-34
35-49
50-64
65+%
Extremely important Very important Fairly important Not that important Not at all important Can't sayQ1. Firstly, how important should ‘Community Consultation and Engagement’ be as a responsibility for Council?Base: All respondents. Councils asked State-wide: 28 Councils asked group: 5*Caution: small sample size < n=30
2015 Consultation Importance
58
J00326 Community Satisfaction Survey 2015 – City of Greater Bendigo
57
58
n/a
56
59
57
58
55
59
57
55
59
57
58
n/a
58
61
57
57
58
57
56
54
66
57
58
n/a
55
57
55
55
60
55
49
55
60
56
54
53
53
53
52
52
52
51
51
48
43*
State-wide
18-34
Regional Centres
Men
65+
Greater Bendigo
Other
Eaglehawk
Women
50-64
35-49
Heathcote
Q2. How has Council performed on ‘Community Consultation and Engagement’ over the last 12 months?Base: All respondents. Councils asked State-wide: 69 Councils asked group: 7 Note: Please see slide 5 for explanation about significant differences*Caution: small sample size < n=30
2015 Consultation Performance 2014 2013 2012
59
J00326 Community Satisfaction Survey 2015 – City of Greater Bendigo
5
7
9
8
7
6
4
9
5
5
4
4
4
6
26
33
30
27
31
28
27
16
27
24
27
28
28
23
24
42
38
38
40
32
36
42
43
36
50
34
45
37
47
39
15
12
11
16
14
16
15
14
19
13
17
13
17
12
18
7
4
5
4
6
6
6
7
18
5
9
4
13
7
4
6
6
8
5
9
8
5
12
3
9
6
1
6
9
2015 Greater Bendigo
2014 Greater Bendigo
2013 Greater Bendigo
2012 Greater Bendigo
State-wide
Regional Centres
Other
Eaglehawk
Heathcote*
Men
Women
18-34
35-49
50-64
65+% Very good Good Average Poor Very poor Can't say
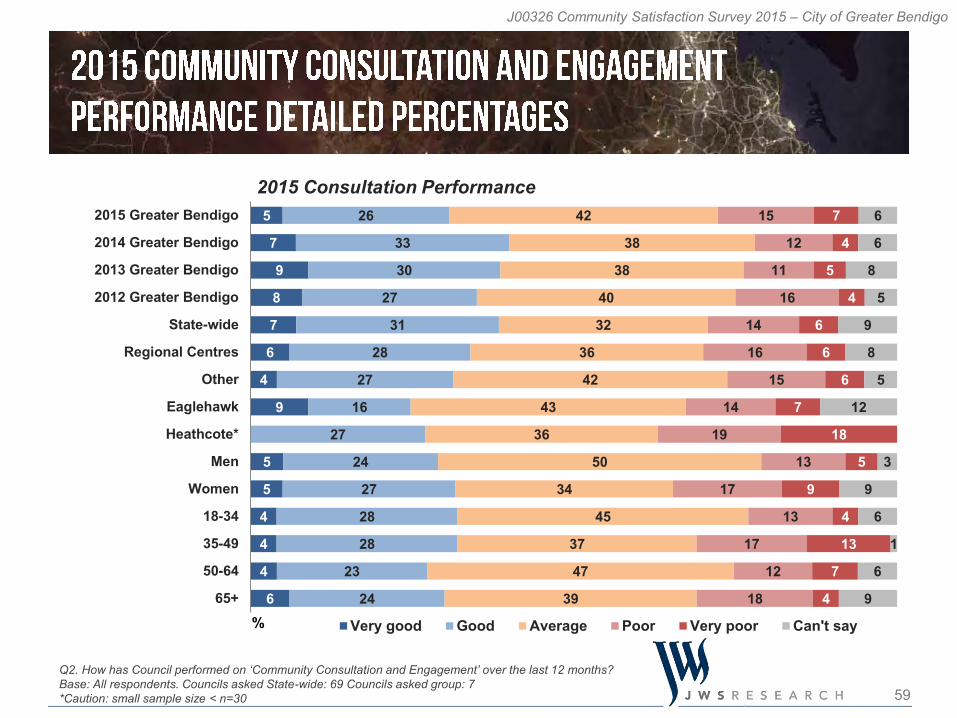
Q2. How has Council performed on ‘Community Consultation and Engagement’ over the last 12 months?Base: All respondents. Councils asked State-wide: 69 Councils asked group: 7*Caution: small sample size < n=30
2015 Consultation Performance
60
J00326 Community Satisfaction Survey 2015 – City of Greater Bendigo
71
70
n/a
71
71
68
67
69
74
67
66
75
73
70
n/a
75
72
70
69
70
70
68
68
68
71
70
n/a
67
71
70
67
69
70
67
69
66
70
69
68
68*
68
67
67
66
66
64
64
63
50-64
State-wide
Regional Centres
Heathcote
Women
Other
65+
Greater Bendigo
35-49
Men
18-34
Eaglehawk
Q1. Firstly, how important should ‘Lobbying on Behalf of the Community’ be as a responsibility for Council?Base: All respondents. Councils asked State-wide: 28 Councils asked group: 5 Note: Please see slide 5 for explanation about significant differences*Caution: small sample size < n=30
2014 2013 20122015 Lobbying Importance

61
J00326 Community Satisfaction Survey 2015 – City of Greater Bendigo
18
23
22
20
23
22
18
15
30
16
21
19
18
20
16
39
39
41
42
39
39
40
34
41
41
37
28
44
45
42
30
30
31
28
28
29
31
36
29
32
43
23
27
26
9
6
4
6
6
6
8
13
29
11
7
11
13
5
7
1
1
1
1
2
2
1
2
1
2
1
3
2
1
2
2
2
2
2
3
1
3
2
6
2015 Greater Bendigo
2014 Greater Bendigo
2013 Greater Bendigo
2012 Greater Bendigo
State-wide
Regional Centres
Other
Eaglehawk
Heathcote*
Men
Women
18-34
35-49
50-64
65+%
Extremely important Very important Fairly important Not that important Not at all important Can't say
Q1. Firstly, how important should ‘Lobbying on Behalf of the Community’ be as a responsibility for Council?Base: All respondents. Councils asked State-wide: 28 Councils asked group: 5*Caution: small sample size < n=30
2015 Lobbying Importance
62
J00326 Community Satisfaction Survey 2015 – City of Greater Bendigo
59
53
57
58
57
58
57
58
56
n/a
52
55
61
60
57
57
58
56
54
61
55
n/a
58
52
60
54
55
55
57
54
51
54
55
n/a
63
54
59
57
56
56
56
56
56
56
55
55
52*
52
18-34
Eaglehawk
Greater Bendigo
Other
Men
Women
50-64
65+
State-wide
Regional Centres
Heathcote
35-49
Q2. How has Council performed on ‘Lobbying on Behalf of the Community’ over the last 12 months?Base: All respondents. Councils asked State-wide: 69 Councils asked group: 7 Note: Please see slide 5 for explanation about significant differences*Caution: small sample size < n=30
2015 Lobbying Performance 2014 2013 2012
63
J00326 Community Satisfaction Survey 2015 – City of Greater Bendigo
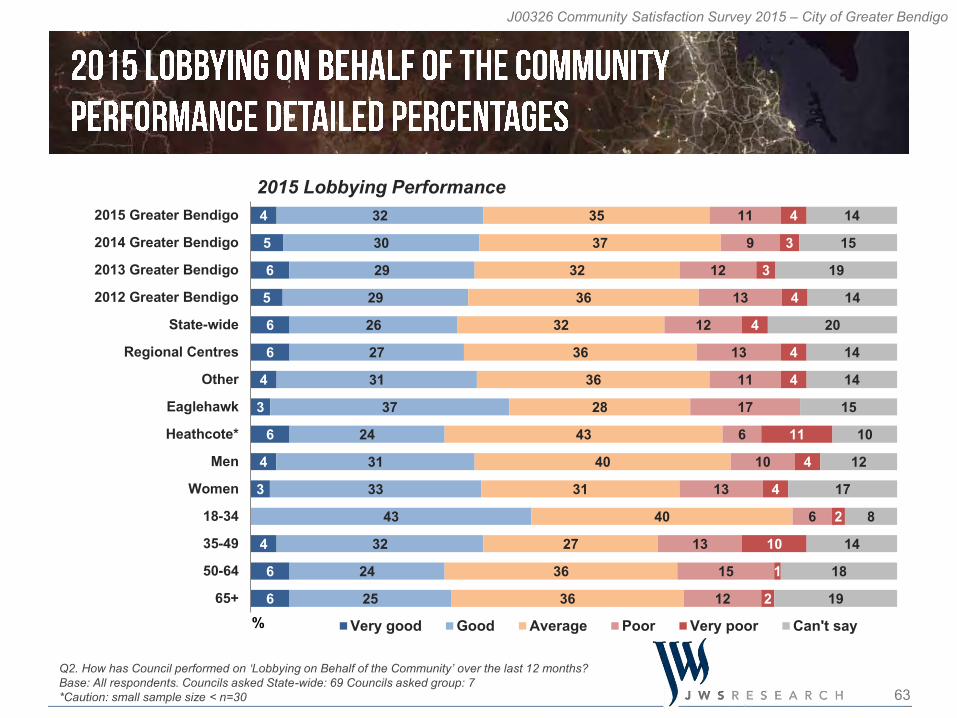
4
5
6
5
6
6
4
3
6
4
3
4
6
6
32
30
29
29
26
27
31
37
24
31
33
43
32
24
25
35
37
32
36
32
36
36
28
43
40
31
40
27
36
36
11
9
12
13
12
13
11
17
6
10
13
6
13
15
12
4
3
3
4
4
4
4
11
4
4
2
10
1
2
14
15
19
14
20
14
14
15
10
12
17
8
14
18
19
2015 Greater Bendigo
2014 Greater Bendigo
2013 Greater Bendigo
2012 Greater Bendigo
State-wide
Regional Centres
Other
Eaglehawk
Heathcote*
Men
Women
18-34
35-49
50-64
65+% Very good Good Average Poor Very poor Can't say
Q2. How has Council performed on ‘Lobbying on Behalf of the Community’ over the last 12 months?Base: All respondents. Councils asked State-wide: 69 Councils asked group: 7*Caution: small sample size < n=30
2015 Lobbying Performance
64
J00326 Community Satisfaction Survey 2015 – City of Greater Bendigo
80
82
79
80
78
79
n/a
74
77
74
76
74
n/a
n/a
n/a
n/a
n/a
n/a
n/a
n/a
n/a
n/a
n/a
n/a
n/a
n/a
n/a
n/a
n/a
n/a
n/a
n/a
n/a
n/a
n/a
n/a
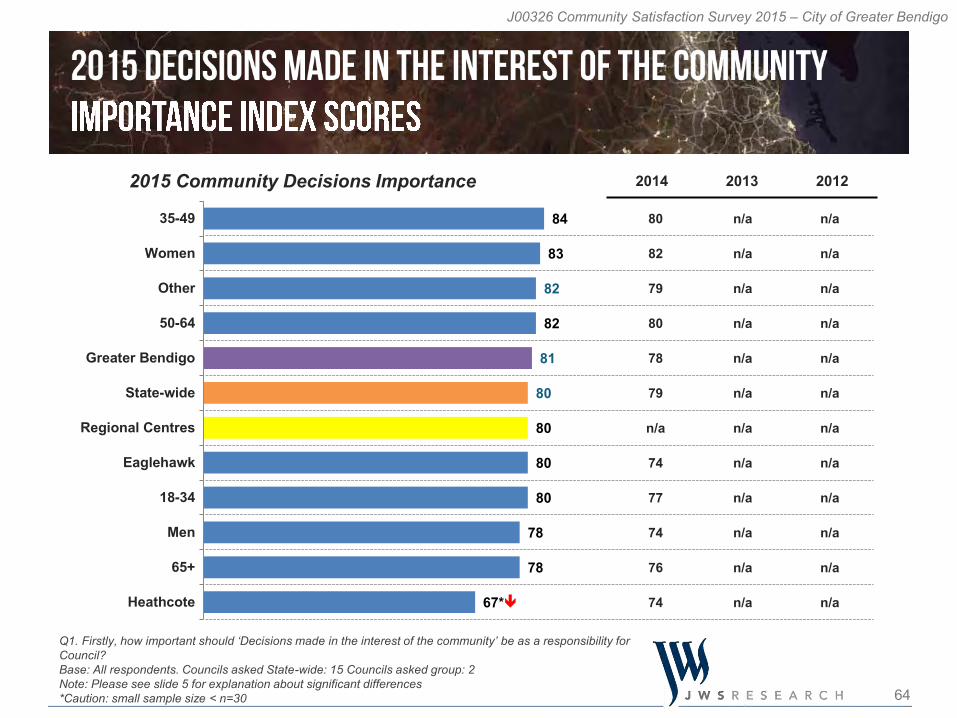
84
83
82
82
81
80
80
80
80
78
78
67*
35-49
Women
Other
50-64
Greater Bendigo
State-wide
Regional Centres
Eaglehawk
18-34
Men
65+
Heathcote
Q1. Firstly, how important should ‘Decisions made in the interest of the community’ be as a responsibility for Council?Base: All respondents. Councils asked State-wide: 15 Councils asked group: 2 Note: Please see slide 5 for explanation about significant differences*Caution: small sample size < n=30
2014 2013 20122015 Community Decisions Importance
65
J00326 Community Satisfaction Survey 2015 – City of Greater Bendigo
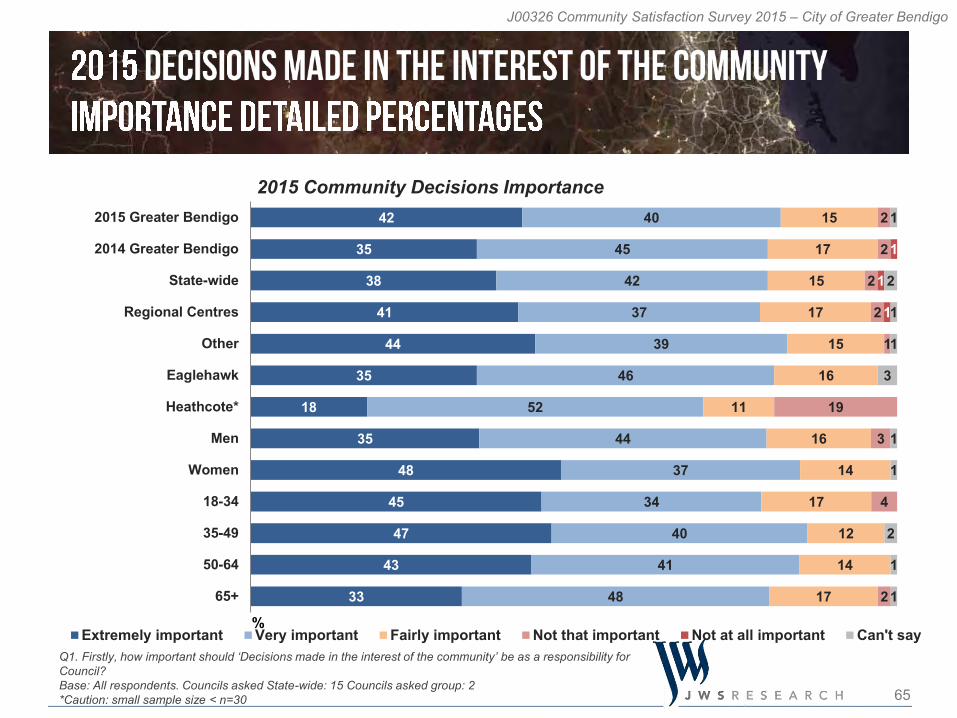
42
35
38
41
44
35
18
35
48
45
47
43
33
40
45
42
37
39
46
52
44
37
34
40
41
48
15
17
15
17
15
16
11
16
14
17
12
14
17
2
2
2
2
1
19
3
4
2
1
1
1
1
2
1
1
3
1
1
2
1
1
2015 Greater Bendigo
2014 Greater Bendigo
State-wide
Regional Centres
Other
Eaglehawk
Heathcote*
Men
Women
18-34
35-49
50-64
65+
%Extremely important Very important Fairly important Not that important Not at all important Can't say
Q1. Firstly, how important should ‘Decisions made in the interest of the community’ be as a responsibility for Council?Base: All respondents. Councils asked State-wide: 15 Councils asked group: 2*Caution: small sample size < n=30
2015 Community Decisions Importance
66
J00326 Community Satisfaction Survey 2015 – City of Greater Bendigo
57
n/a
63
57
59
59
58
60
58
62
58
56
n/a
n/a
n/a
n/a
n/a
n/a
n/a
n/a
n/a
n/a
n/a
n/a
n/a
n/a
n/a
n/a
n/a
n/a
n/a
n/a
n/a
n/a
n/a
n/a
55
52
52
52
51
51
51
51
51
50
48*
48
State-wide
Regional Centres
18-34
65+
Greater Bendigo
Other
Men
Women
50-64
Eaglehawk
Heathcote
35-49
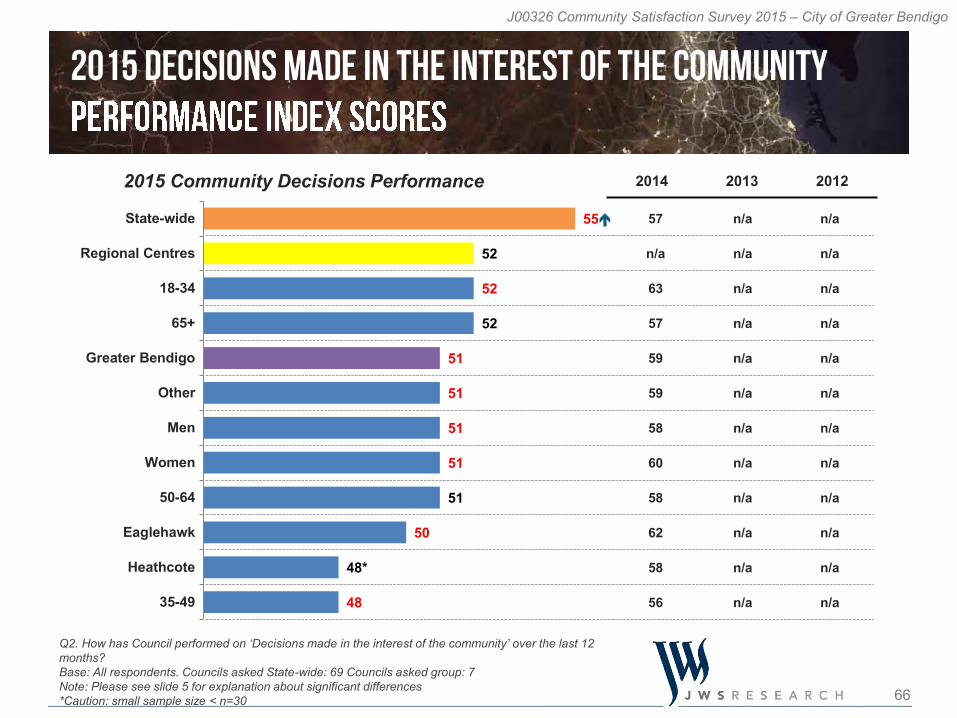
Q2. How has Council performed on ‘Decisions made in the interest of the community’ over the last 12 months?Base: All respondents. Councils asked State-wide: 69 Councils asked group: 7 Note: Please see slide 5 for explanation about significant differences*Caution: small sample size < n=30
2015 Community Decisions Performance 2014 2013 2012
67
J00326 Community Satisfaction Survey 2015 – City of Greater Bendigo
4
8
7
6
3
8
5
3
2
3
8
3
28
34
31
28
28
26
48
24
33
30
31
23
28
38
41
33
36
40
24
23
43
32
40
29
40
40
16
9
14
17
16
19
18
14
13
19
18
15
8
4
6
7
7
12
29
6
10
6
13
8
6
6
5
9
6
6
10
5
7
8
4
4
8
2015 Greater Bendigo
2014 Greater Bendigo
State-wide
Regional Centres
Other
Eaglehawk
Heathcote*
Men
Women
18-34
35-49
50-64
65+
% Very good Good Average Poor Very poor Can't sayQ2. How has Council performed on ‘Decisions made in the interest of the community’ over the last 12 months?Base: All respondents. Councils asked State-wide: 69 Councils asked group: 7*Caution: small sample size < n=30
2015 Community Decisions Performance
68
J00326 Community Satisfaction Survey 2015 – City of Greater Bendigo
n/a
n/a
n/a
n/a
n/a
n/a
n/a
n/a
55
n/a
n/a
n/a
n/a
n/a
n/a
n/a
n/a
n/a
n/a
n/a
n/a
n/a
n/a
n/a
n/a
n/a
n/a
n/a
n/a
n/a
n/a
n/a
n/a
n/a
n/a
n/a
68
65
64
63
61
61
61
60
55
55
55
45*
Eaglehawk
65+
18-34
Women
Greater Bendigo
Other
50-64
Men
State-wide
Regional Centres
35-49
Heathcote
Q2. How has Council performed on ‘The condition of sealed local roads in your area’ over the last 12 months?Base: All respondents. Councils asked State-wide: 69 Councils asked group: 7 Note: Please see slide 5 for explanation about significant differences*Caution: small sample size < n=30
2015 Sealed Local Roads Performance 2014 2013 2012
69
J00326 Community Satisfaction Survey 2015 – City of Greater Bendigo
15
11
12
15
23
14
16
21
8
15
14
35
33
32
34
40
34
37
33
28
35
35
43
34
29
30
37
14
30
30
38
38
32
34
31
10
16
17
9
13
17
11
8
6
16
10
7
5
10
9
5
3
19
7
4
4
9
5
2
1
1
1
7
1
2
2
1
3
2015 Greater Bendigo
State-wide
Regional Centres
Other
Eaglehawk
Heathcote*
Men
Women
18-34
35-49
50-64
65+
% Very good Good Average Poor Very poor Can't say
Q2. How has Council performed on ‘The condition of sealed local roads in your area’ over the last 12 months?Base: All respondents. Councils asked State-wide: 69 Councils asked group: 7*Caution: small sample size < n=30
2015 Sealed Local Roads Performance
70
J00326 Community Satisfaction Survey 2015 – City of Greater Bendigo
76
78
77
n/a
74
75
75
75
74
73
76
73
79
79
80
n/a
76
76
75
75
75
73
72
77
75
82
78
n/a
76
78
75
78
78
74
80
78
81
77
77
76
76
75
75
75
75
74
74
73*
Eaglehawk
Women
50-64
Regional Centres
35-49
Greater Bendigo
State-wide
Other
65+
Men
18-34
Heathcote
Q1. Firstly, how important should ‘Informing the Community’ be as a responsibility for Council?Base: All respondents. Councils asked State-wide: 25 Councils asked group: 4 Note: Please see slide 5 for explanation about significant differences*Caution: small sample size < n=30
2014 2013 20122015 Informing Community Importance
71
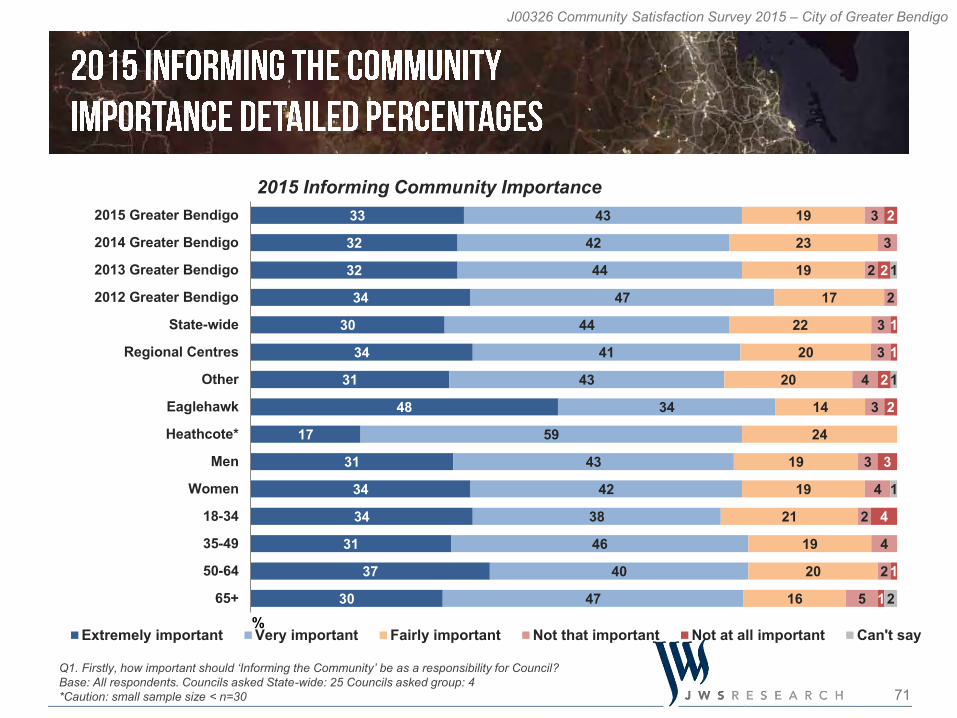
J00326 Community Satisfaction Survey 2015 – City of Greater Bendigo
33
32
32
34
30
34
31
48
17
31
34
34
31
37
30
43
42
44
47
44
41
43
34
59
43
42
38
46
40
47
19
23
19
17
22
20
20
14
24
19
19
21
19
20
16
3
3
2
2
3
3
4
3
3
4
2
4
2
5
2
2
1
1
2
2
3
4
1
1
1
1
1
2
2015 Greater Bendigo
2014 Greater Bendigo
2013 Greater Bendigo
2012 Greater Bendigo
State-wide
Regional Centres
Other
Eaglehawk
Heathcote*
Men
Women
18-34
35-49
50-64
65+%
Extremely important Very important Fairly important Not that important Not at all important Can't say
Q1. Firstly, how important should ‘Informing the Community’ be as a responsibility for Council?Base: All respondents. Councils asked State-wide: 25 Councils asked group: 4*Caution: small sample size < n=30
2015 Informing Community Importance
72
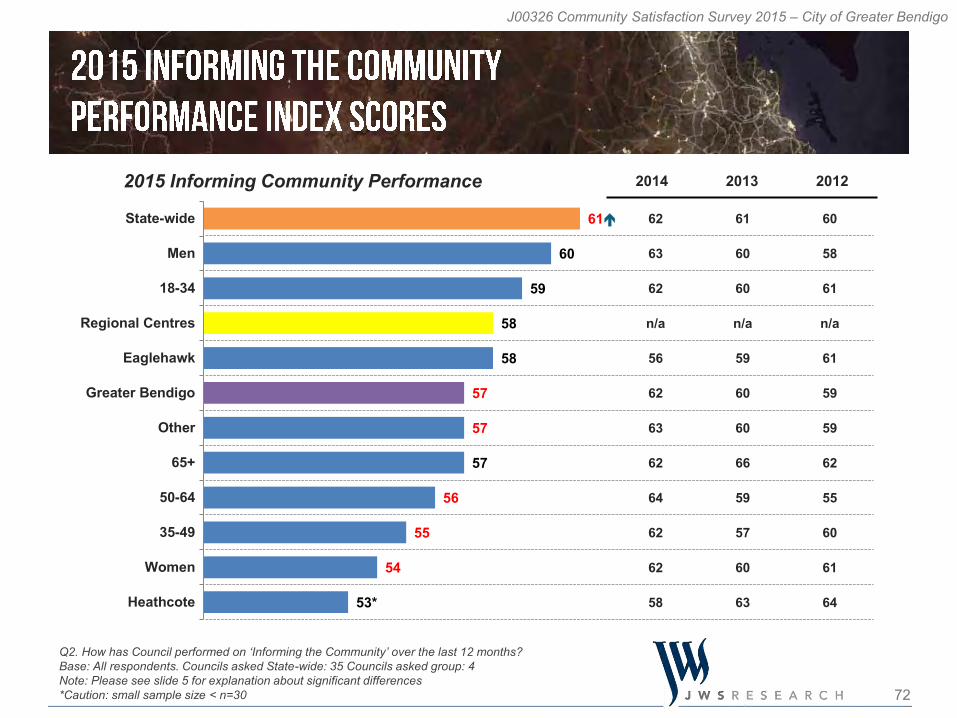
J00326 Community Satisfaction Survey 2015 – City of Greater Bendigo
62
63
62
n/a
56
62
63
62
64
62
62
58
61
60
60
n/a
59
60
60
66
59
57
60
63
60
58
61
n/a
61
59
59
62
55
60
61
64
61
60
59
58
58
57
57
57
56
55
54
53*
State-wide
Men
18-34
Regional Centres
Eaglehawk
Greater Bendigo
Other
65+
50-64
35-49
Women
Heathcote
Q2. How has Council performed on ‘Informing the Community’ over the last 12 months?Base: All respondents. Councils asked State-wide: 35 Councils asked group: 4 Note: Please see slide 5 for explanation about significant differences*Caution: small sample size < n=30
2015 Informing Community Performance 2014 2013 2012
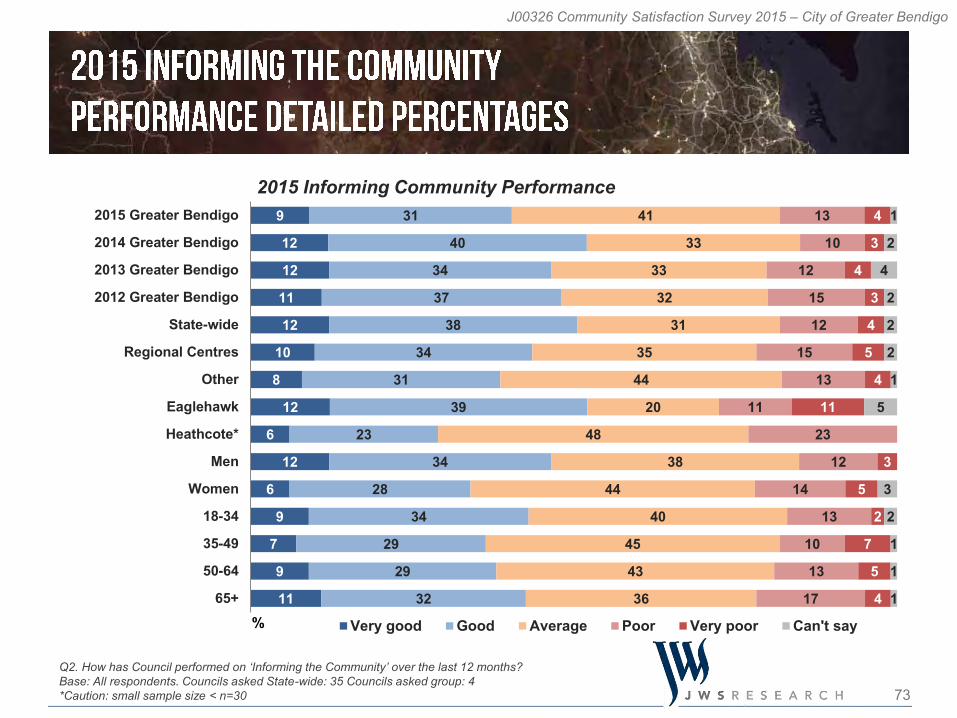
73
J00326 Community Satisfaction Survey 2015 – City of Greater Bendigo
9
12
12
11
12
10
8
12
6
12
6
9
7
9
11
31
40
34
37
38
34
31
39
23
34
28
34
29
29
32
41
33
33
32
31
35
44
20
48
38
44
40
45
43
36
13
10
12
15
12
15
13
11
23
12
14
13
10
13
17
4
3
4
3
4
5
4
11
3
5
2
7
5
4
1
2
4
2
2
2
1
5
3
2
1
1
1
2015 Greater Bendigo
2014 Greater Bendigo
2013 Greater Bendigo
2012 Greater Bendigo
State-wide
Regional Centres
Other
Eaglehawk
Heathcote*
Men
Women
18-34
35-49
50-64
65+% Very good Good Average Poor Very poor Can't say
Q2. How has Council performed on ‘Informing the Community’ over the last 12 months?Base: All respondents. Councils asked State-wide: 35 Councils asked group: 4*Caution: small sample size < n=30
2015 Informing Community Performance
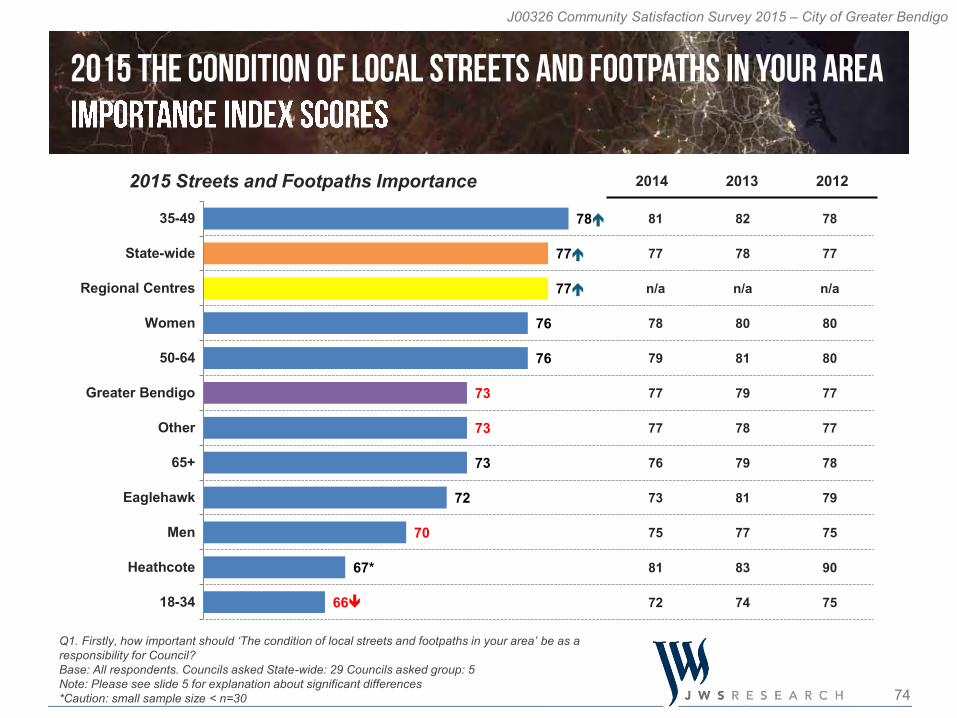
74
J00326 Community Satisfaction Survey 2015 – City of Greater Bendigo
81
77
n/a
78
79
77
77
76
73
75
81
72
82
78
n/a
80
81
79
78
79
81
77
83
74
78
77
n/a
80
80
77
77
78
79
75
90
75
78
77
77
76
76
73
73
73
72
70
67*
66
35-49
State-wide
Regional Centres
Women
50-64
Greater Bendigo
Other
65+
Eaglehawk
Men
Heathcote
18-34
Q1. Firstly, how important should ‘The condition of local streets and footpaths in your area’ be as a responsibility for Council?Base: All respondents. Councils asked State-wide: 29 Councils asked group: 5 Note: Please see slide 5 for explanation about significant differences*Caution: small sample size < n=30
2014 2013 20122015 Streets and Footpaths Importance
75
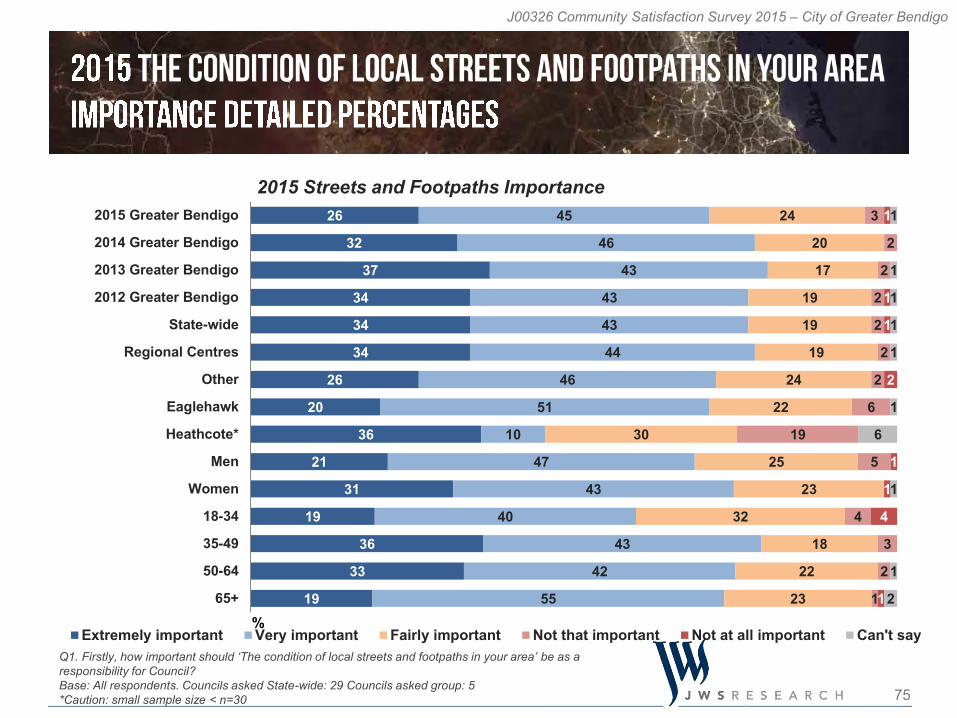
J00326 Community Satisfaction Survey 2015 – City of Greater Bendigo
26
32
37
34
34
34
26
20
36
21
31
19
36
33
19
45
46
43
43
43
44
46
51
10
47
43
40
43
42
55
24
20
17
19
19
19
24
22
30
25
23
32
18
22
23
3
2
2
2
2
2
2
6
19
5
4
3
2
1
1
1
1
2
1
1
4
1
1
1
1
1
1
1
6
1
1
2
2015 Greater Bendigo
2014 Greater Bendigo
2013 Greater Bendigo
2012 Greater Bendigo
State-wide
Regional Centres
Other
Eaglehawk
Heathcote*
Men
Women
18-34
35-49
50-64
65+%
Extremely important Very important Fairly important Not that important Not at all important Can't sayQ1. Firstly, how important should ‘The condition of local streets and footpaths in your area’ be as a responsibility for Council?Base: All respondents. Councils asked State-wide: 29 Councils asked group: 5*Caution: small sample size < n=30
2015 Streets and Footpaths Importance
76
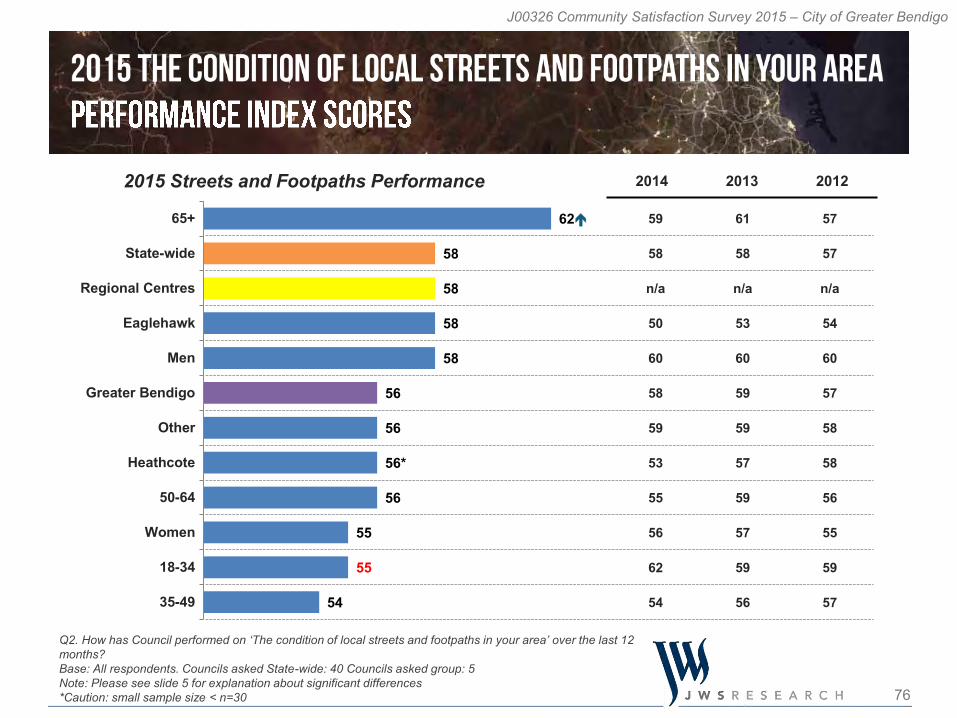
J00326 Community Satisfaction Survey 2015 – City of Greater Bendigo
59
58
n/a
50
60
58
59
53
55
56
62
54
61
58
n/a
53
60
59
59
57
59
57
59
56
57
57
n/a
54
60
57
58
58
56
55
59
57
62
58
58
58
58
56
56
56*
56
55
55
54
65+
State-wide
Regional Centres
Eaglehawk
Men
Greater Bendigo
Other
Heathcote
50-64
Women
18-34
35-49
Q2. How has Council performed on ‘The condition of local streets and footpaths in your area’ over the last 12 months?Base: All respondents. Councils asked State-wide: 40 Councils asked group: 5 Note: Please see slide 5 for explanation about significant differences*Caution: small sample size < n=30
2015 Streets and Footpaths Performance 2014 2013 2012
77
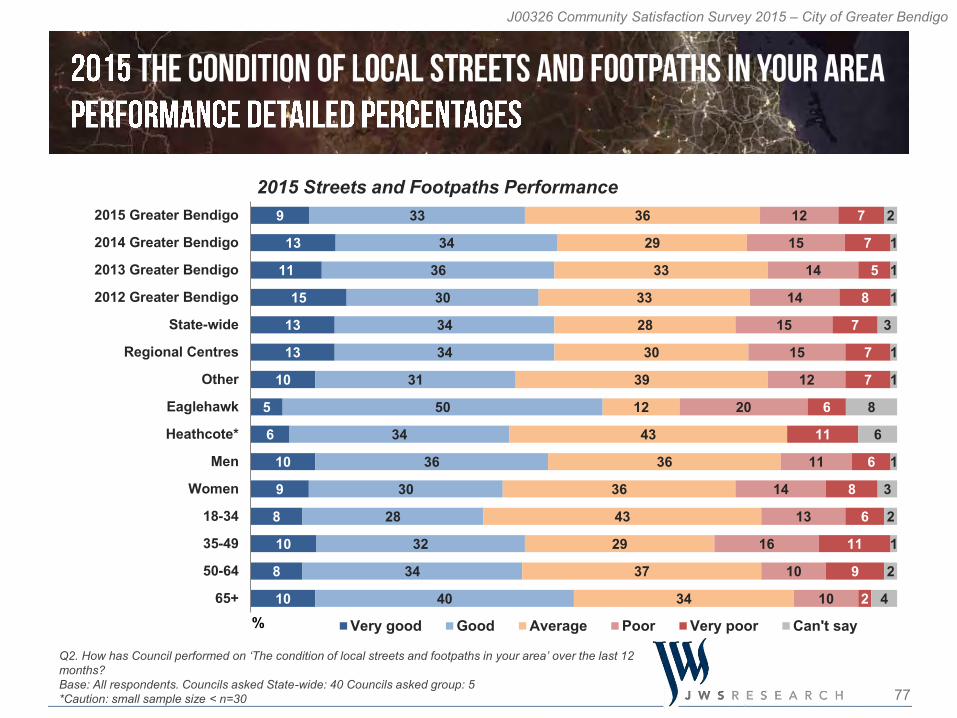
J00326 Community Satisfaction Survey 2015 – City of Greater Bendigo
9
13
11
15
13
13
10
5
6
10
9
8
10
8
10
33
34
36
30
34
34
31
50
34
36
30
28
32
34
40
36
29
33
33
28
30
39
12
43
36
36
43
29
37
34
12
15
14
14
15
15
12
20
11
14
13
16
10
10
7
7
5
8
7
7
7
6
11
6
8
6
11
9
2
2
1
1
1
3
1
1
8
6
1
3
2
1
2
4
2015 Greater Bendigo
2014 Greater Bendigo
2013 Greater Bendigo
2012 Greater Bendigo
State-wide
Regional Centres
Other
Eaglehawk
Heathcote*
Men
Women
18-34
35-49
50-64
65+% Very good Good Average Poor Very poor Can't say
Q2. How has Council performed on ‘The condition of local streets and footpaths in your area’ over the last 12 months?Base: All respondents. Councils asked State-wide: 40 Councils asked group: 5*Caution: small sample size < n=30
2015 Streets and Footpaths Performance
78
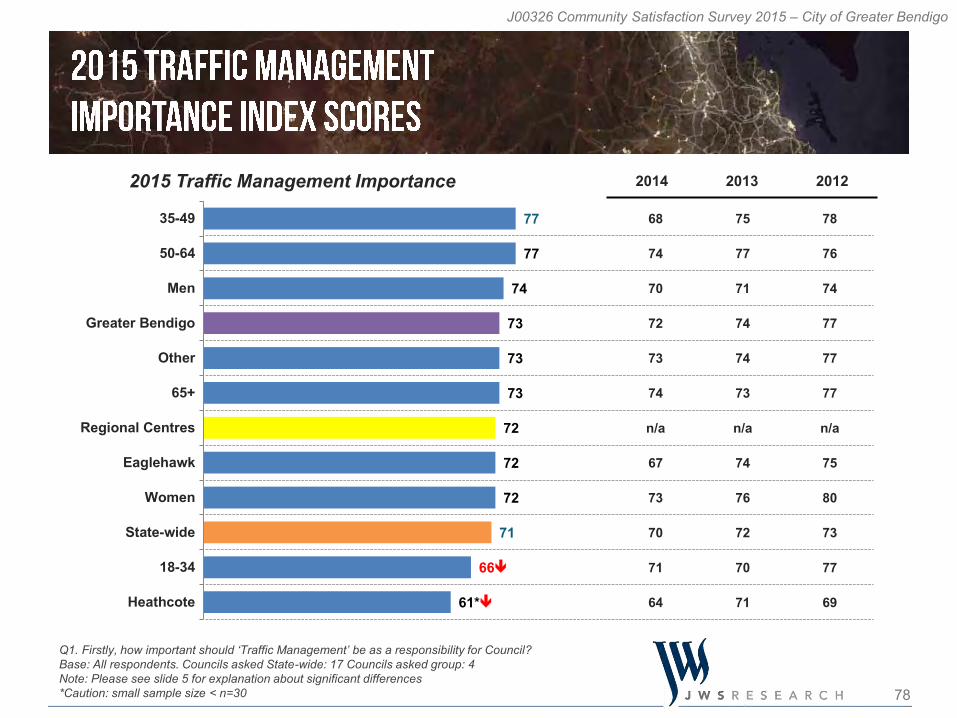
J00326 Community Satisfaction Survey 2015 – City of Greater Bendigo
68
74
70
72
73
74
n/a
67
73
70
71
64
75
77
71
74
74
73
n/a
74
76
72
70
71
78
76
74
77
77
77
n/a
75
80
73
77
69
77
77
74
73
73
73
72
72
72
71
66
61*
35-49
50-64
Men
Greater Bendigo
Other
65+
Regional Centres
Eaglehawk
Women
State-wide
18-34
Heathcote
Q1. Firstly, how important should ‘Traffic Management’ be as a responsibility for Council?Base: All respondents. Councils asked State-wide: 17 Councils asked group: 4 Note: Please see slide 5 for explanation about significant differences*Caution: small sample size < n=30
2014 2013 20122015 Traffic Management Importance
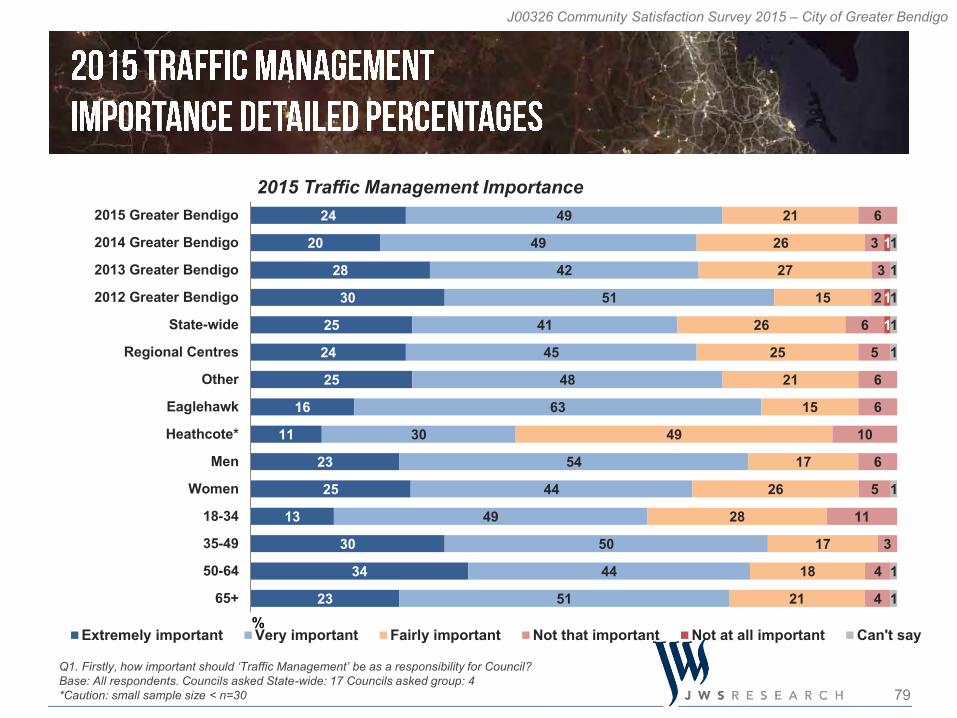
79
J00326 Community Satisfaction Survey 2015 – City of Greater Bendigo
24
20
28
30
25
24
25
16
11
23
25
13
30
34
23
49
49
42
51
41
45
48
63
30
54
44
49
50
44
51
21
26
27
15
26
25
21
15
49
17
26
28
17
18
21
6
3
3
2
6
5
6
6
10
6
5
11
3
4
4
1
1
1
1
1
1
1
1
1
1
1
2015 Greater Bendigo
2014 Greater Bendigo
2013 Greater Bendigo
2012 Greater Bendigo
State-wide
Regional Centres
Other
Eaglehawk
Heathcote*
Men
Women
18-34
35-49
50-64
65+%
Extremely important Very important Fairly important Not that important Not at all important Can't say
Q1. Firstly, how important should ‘Traffic Management’ be as a responsibility for Council?Base: All respondents. Councils asked State-wide: 17 Councils asked group: 4*Caution: small sample size < n=30
2015 Traffic Management Importance
80
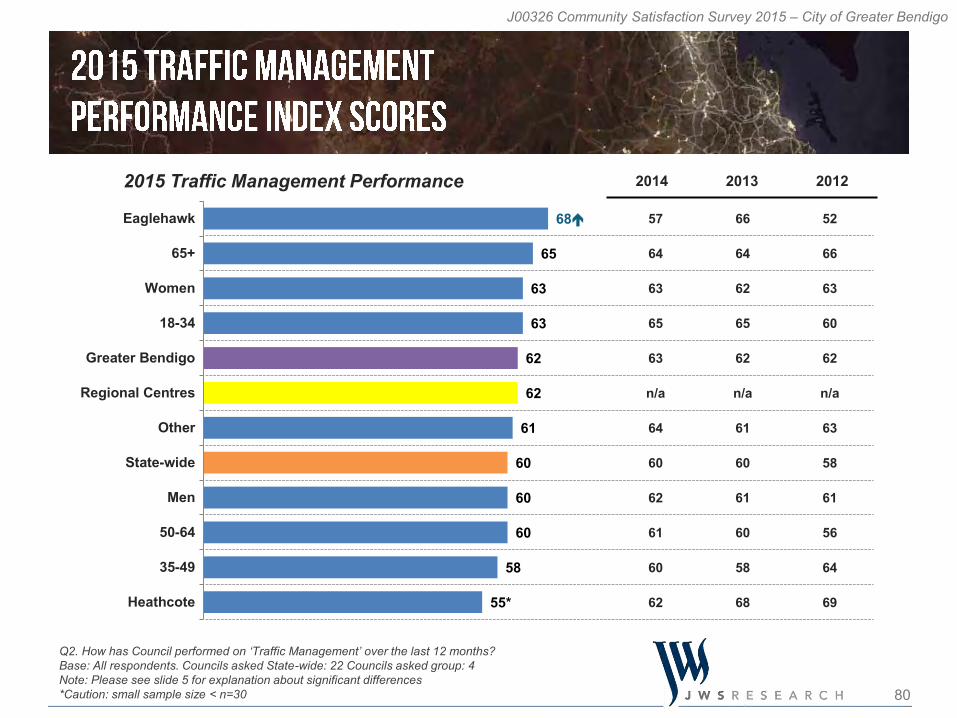
J00326 Community Satisfaction Survey 2015 – City of Greater Bendigo
57
64
63
65
63
n/a
64
60
62
61
60
62
66
64
62
65
62
n/a
61
60
61
60
58
68
52
66
63
60
62
n/a
63
58
61
56
64
69
68
65
63
63
62
62
61
60
60
60
58
55*
Eaglehawk
65+
Women
18-34
Greater Bendigo
Regional Centres
Other
State-wide
Men
50-64
35-49
Heathcote
Q2. How has Council performed on ‘Traffic Management’ over the last 12 months?Base: All respondents. Councils asked State-wide: 22 Councils asked group: 4 Note: Please see slide 5 for explanation about significant differences*Caution: small sample size < n=30
2015 Traffic Management Performance 2014 2013 2012

81
J00326 Community Satisfaction Survey 2015 – City of Greater Bendigo
10
13
11
12
10
11
10
15
6
12
8
13
10
7
10
38
39
37
41
40
40
38
45
30
32
44
38
30
43
42
39
32
38
29
31
34
39
35
48
42
36
40
42
36
36
8
12
9
11
12
10
9
3
8
8
4
15
8
5
3
2
2
4
5
3
3
11
5
1
4
2
5
1
2
2
4
2
3
2
2
3
4
1
3
1
1
6
2015 Greater Bendigo
2014 Greater Bendigo
2013 Greater Bendigo
2012 Greater Bendigo
State-wide
Regional Centres
Other
Eaglehawk
Heathcote*
Men
Women
18-34
35-49
50-64
65+% Very good Good Average Poor Very poor Can't say
Q2. How has Council performed on ‘Traffic Management’ over the last 12 months?Base: All respondents. Councils asked State-wide: 22 Councils asked group: 4*Caution: small sample size < n=30
2015 Traffic Management Performance
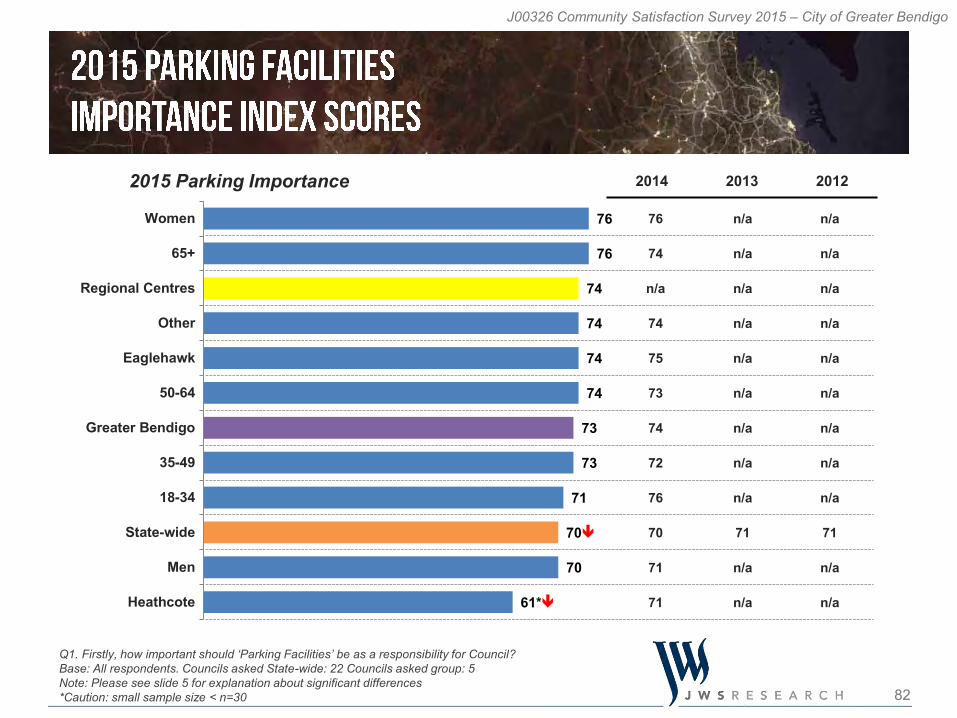
82
J00326 Community Satisfaction Survey 2015 – City of Greater Bendigo
76
74
n/a
74
75
73
74
72
76
70
71
71
n/a
n/a
n/a
n/a
n/a
n/a
n/a
n/a
n/a
71
n/a
n/a
n/a
n/a
n/a
n/a
n/a
n/a
n/a
n/a
n/a
71
n/a
n/a
76
76
74
74
74
74
73
73
71
70
70
61*
Women
65+
Regional Centres
Other
Eaglehawk
50-64
Greater Bendigo
35-49
18-34
State-wide
Men
Heathcote
Q1. Firstly, how important should ‘Parking Facilities’ be as a responsibility for Council?Base: All respondents. Councils asked State-wide: 22 Councils asked group: 5 Note: Please see slide 5 for explanation about significant differences*Caution: small sample size < n=30
2014 2013 20122015 Parking Importance
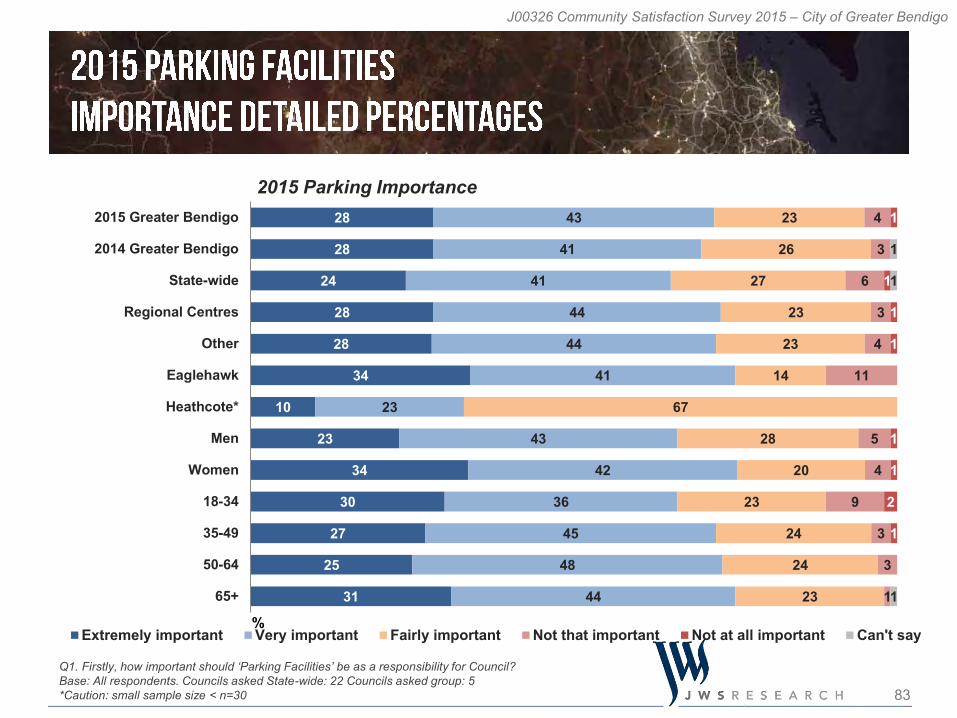
83
J00326 Community Satisfaction Survey 2015 – City of Greater Bendigo
28
28
24
28
28
34
10
23
34
30
27
25
31
43
41
41
44
44
41
23
43
42
36
45
48
44
23
26
27
23
23
14
67
28
20
23
24
24
23
4
3
6
3
4
11
5
4
9
3
3
1
1
1
1
1
1
1
2
1
1
1
1
2015 Greater Bendigo
2014 Greater Bendigo
State-wide
Regional Centres
Other
Eaglehawk
Heathcote*
Men
Women
18-34
35-49
50-64
65+
%Extremely important Very important Fairly important Not that important Not at all important Can't say
Q1. Firstly, how important should ‘Parking Facilities’ be as a responsibility for Council?Base: All respondents. Councils asked State-wide: 22 Councils asked group: 5*Caution: small sample size < n=30
2015 Parking Importance
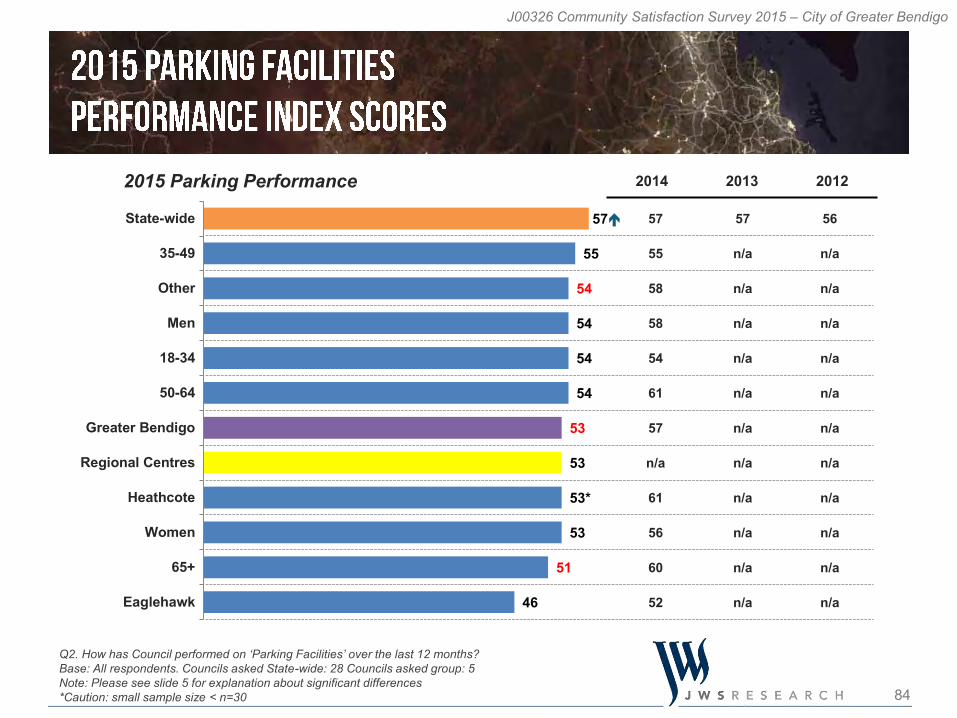
84
J00326 Community Satisfaction Survey 2015 – City of Greater Bendigo
57
55
58
58
54
61
57
n/a
61
56
60
52
57
n/a
n/a
n/a
n/a
n/a
n/a
n/a
n/a
n/a
n/a
n/a
56
n/a
n/a
n/a
n/a
n/a
n/a
n/a
n/a
n/a
n/a
n/a
57
55
54
54
54
54
53
53
53*
53
51
46
State-wide
35-49
Other
Men
18-34
50-64
Greater Bendigo
Regional Centres
Heathcote
Women
65+
Eaglehawk
Q2. How has Council performed on ‘Parking Facilities’ over the last 12 months?Base: All respondents. Councils asked State-wide: 28 Councils asked group: 5 Note: Please see slide 5 for explanation about significant differences*Caution: small sample size < n=30
2015 Parking Performance 2014 2013 2012
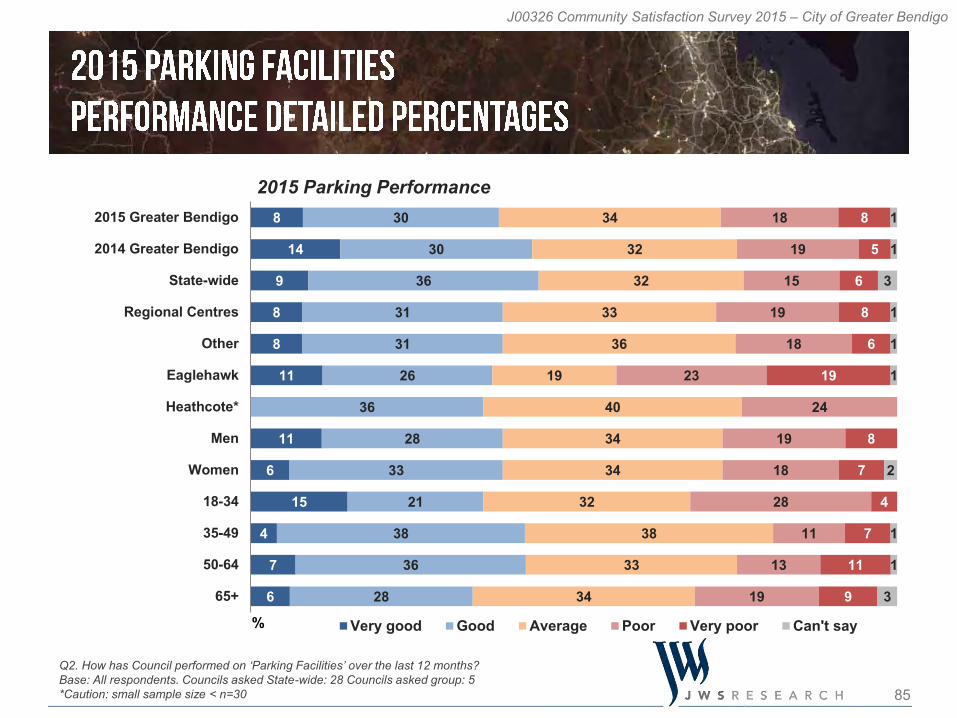
85
J00326 Community Satisfaction Survey 2015 – City of Greater Bendigo
8
14
9
8
8
11
11
6
15
4
7
6
30
30
36
31
31
26
36
28
33
21
38
36
28
34
32
32
33
36
19
40
34
34
32
38
33
34
18
19
15
19
18
23
24
19
18
28
11
13
19
8
5
6
8
6
19
8
7
4
7
11
9
1
1
3
1
1
1
2
1
1
3
2015 Greater Bendigo
2014 Greater Bendigo
State-wide
Regional Centres
Other
Eaglehawk
Heathcote*
Men
Women
18-34
35-49
50-64
65+
% Very good Good Average Poor Very poor Can't say
Q2. How has Council performed on ‘Parking Facilities’ over the last 12 months?Base: All respondents. Councils asked State-wide: 28 Councils asked group: 5*Caution: small sample size < n=30
2015 Parking Performance
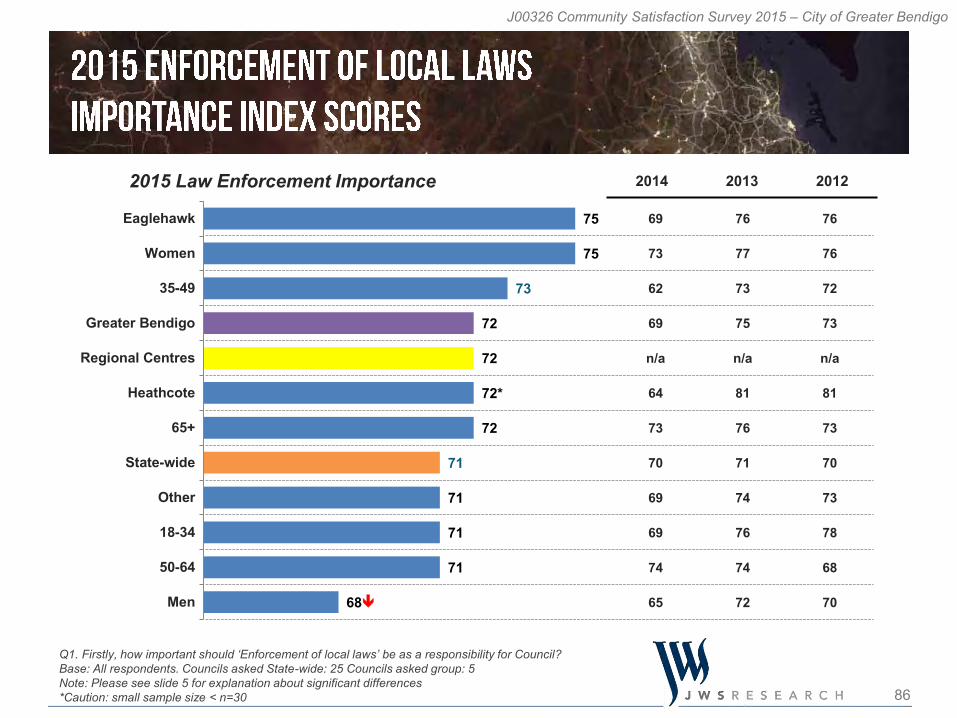
86
J00326 Community Satisfaction Survey 2015 – City of Greater Bendigo
69
73
62
69
n/a
64
73
70
69
69
74
65
76
77
73
75
n/a
81
76
71
74
76
74
72
76
76
72
73
n/a
81
73
70
73
78
68
70
75
75
73
72
72
72*
72
71
71
71
71
68
Eaglehawk
Women
35-49
Greater Bendigo
Regional Centres
Heathcote
65+
State-wide
Other
18-34
50-64
Men
Q1. Firstly, how important should ‘Enforcement of local laws’ be as a responsibility for Council?Base: All respondents. Councils asked State-wide: 25 Councils asked group: 5 Note: Please see slide 5 for explanation about significant differences*Caution: small sample size < n=30
2014 2013 20122015 Law Enforcement Importance
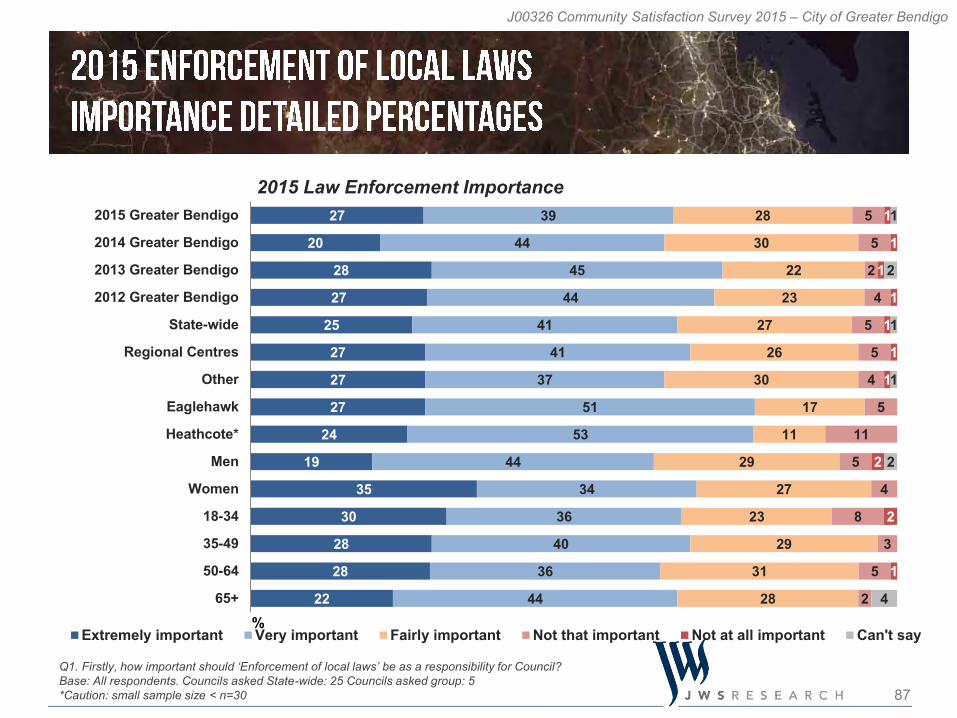
87
J00326 Community Satisfaction Survey 2015 – City of Greater Bendigo
27
20
28
27
25
27
27
27
24
19
35
30
28
28
22
39
44
45
44
41
41
37
51
53
44
34
36
40
36
44
28
30
22
23
27
26
30
17
11
29
27
23
29
31
28
5
5
2
4
5
5
4
5
11
5
4
8
3
5
2
1
1
1
1
1
1
1
2
2
1
1
2
1
1
2
4
2015 Greater Bendigo
2014 Greater Bendigo
2013 Greater Bendigo
2012 Greater Bendigo
State-wide
Regional Centres
Other
Eaglehawk
Heathcote*
Men
Women
18-34
35-49
50-64
65+%
Extremely important Very important Fairly important Not that important Not at all important Can't say
Q1. Firstly, how important should ‘Enforcement of local laws’ be as a responsibility for Council?Base: All respondents. Councils asked State-wide: 25 Councils asked group: 5*Caution: small sample size < n=30
2015 Law Enforcement Importance
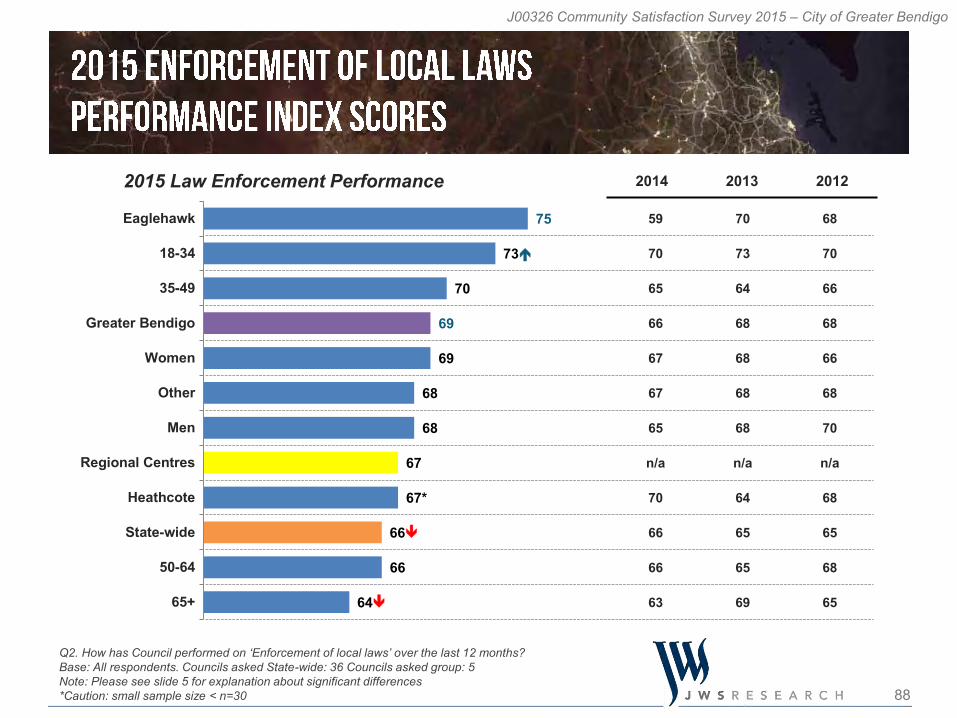
88
J00326 Community Satisfaction Survey 2015 – City of Greater Bendigo
59
70
65
66
67
67
65
n/a
70
66
66
63
70
73
64
68
68
68
68
n/a
64
65
65
69
68
70
66
68
66
68
70
n/a
68
65
68
65
75
73
70
69
69
68
68
67
67*
66
66
64
Eaglehawk
18-34
35-49
Greater Bendigo
Women
Other
Men
Regional Centres
Heathcote
State-wide
50-64
65+
Q2. How has Council performed on ‘Enforcement of local laws’ over the last 12 months?Base: All respondents. Councils asked State-wide: 36 Councils asked group: 5 Note: Please see slide 5 for explanation about significant differences*Caution: small sample size < n=30
2015 Law Enforcement Performance 2014 2013 2012
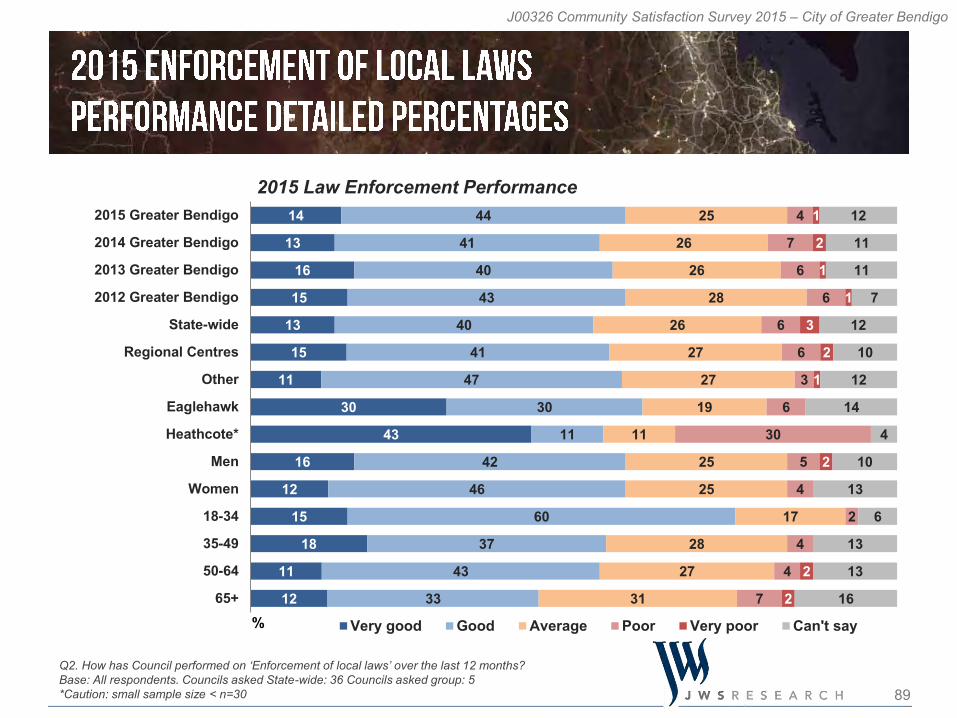
89
J00326 Community Satisfaction Survey 2015 – City of Greater Bendigo
14
13
16
15
13
15
11
30
43
16
12
15
18
11
12
44
41
40
43
40
41
47
30
11
42
46
60
37
43
33
25
26
26
28
26
27
27
19
11
25
25
17
28
27
31
4
7
6
6
6
6
3
6
30
5
4
2
4
4
7
1
2
1
1
3
2
1
2
2
2
12
11
11
7
12
10
12
14
4
10
13
6
13
13
16
2015 Greater Bendigo
2014 Greater Bendigo
2013 Greater Bendigo
2012 Greater Bendigo
State-wide
Regional Centres
Other
Eaglehawk
Heathcote*
Men
Women
18-34
35-49
50-64
65+% Very good Good Average Poor Very poor Can't say
Q2. How has Council performed on ‘Enforcement of local laws’ over the last 12 months?Base: All respondents. Councils asked State-wide: 36 Councils asked group: 5*Caution: small sample size < n=30
2015 Law Enforcement Performance
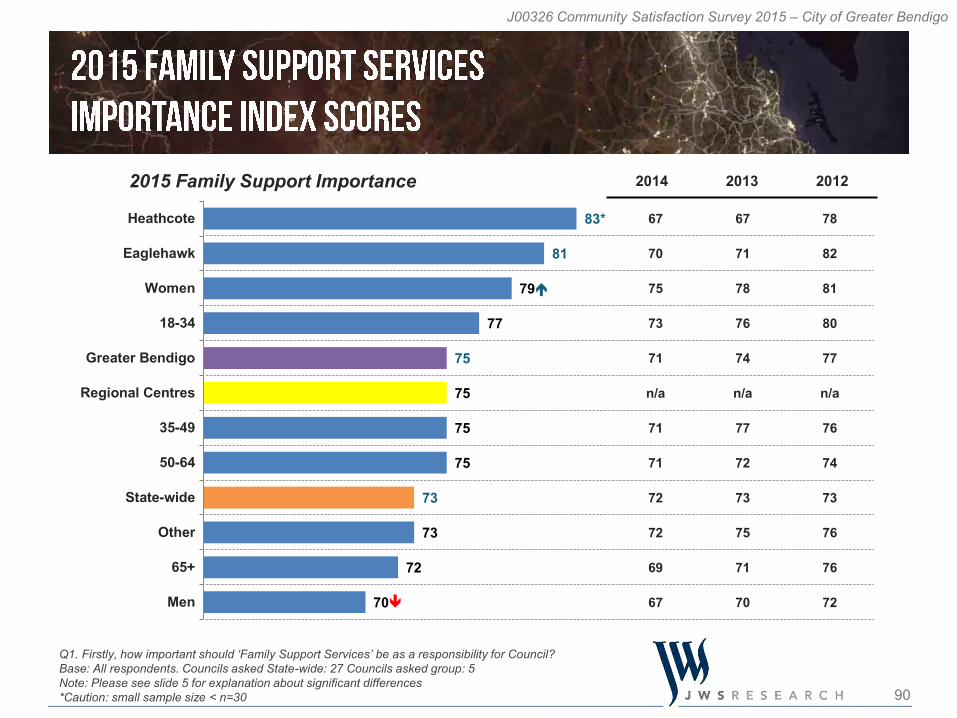
90
J00326 Community Satisfaction Survey 2015 – City of Greater Bendigo
67
70
75
73
71
n/a
71
71
72
72
69
67
67
71
78
76
74
n/a
77
72
73
75
71
70
78
82
81
80
77
n/a
76
74
73
76
76
72
83*
81
79
77
75
75
75
75
73
73
72
70
Heathcote
Eaglehawk
Women
18-34
Greater Bendigo
Regional Centres
35-49
50-64
State-wide
Other
65+
Men
Q1. Firstly, how important should ‘Family Support Services’ be as a responsibility for Council?Base: All respondents. Councils asked State-wide: 27 Councils asked group: 5 Note: Please see slide 5 for explanation about significant differences*Caution: small sample size < n=30
2014 2013 20122015 Family Support Importance
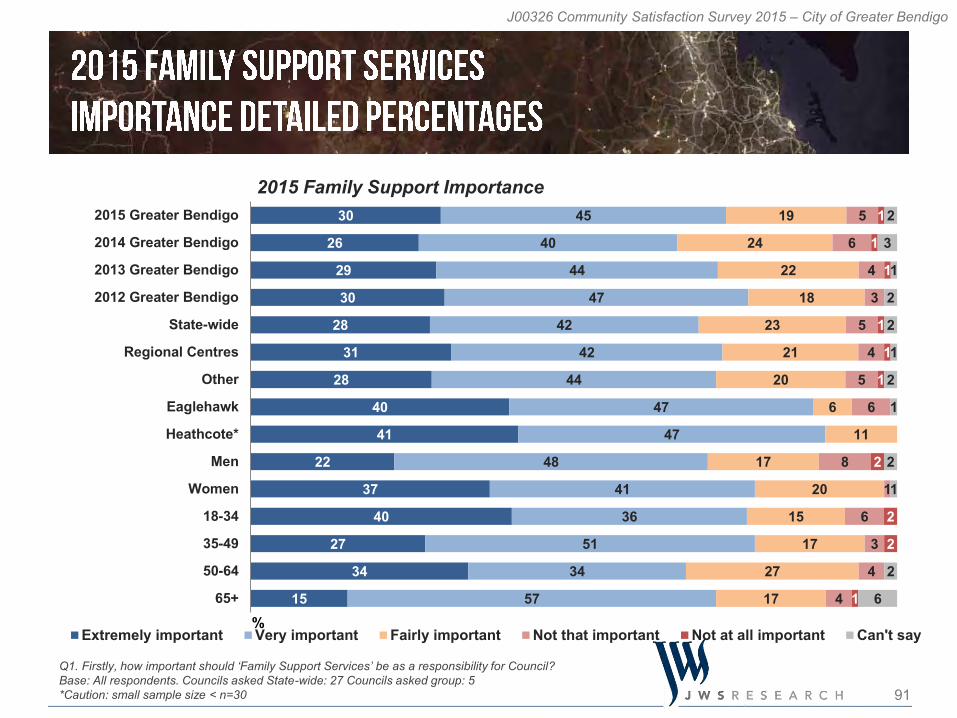
91
J00326 Community Satisfaction Survey 2015 – City of Greater Bendigo
30
26
29
30
28
31
28
40
41
22
37
40
27
34
15
45
40
44
47
42
42
44
47
47
48
41
36
51
34
57
19
24
22
18
23
21
20
6
11
17
20
15
17
27
17
5
6
4
3
5
4
5
6
8
1
6
3
4
4
1
1
1
1
1
1
2
2
2
1
2
3
1
2
2
1
2
1
2
1
2
6
2015 Greater Bendigo
2014 Greater Bendigo
2013 Greater Bendigo
2012 Greater Bendigo
State-wide
Regional Centres
Other
Eaglehawk
Heathcote*
Men
Women
18-34
35-49
50-64
65+%
Extremely important Very important Fairly important Not that important Not at all important Can't say
Q1. Firstly, how important should ‘Family Support Services’ be as a responsibility for Council?Base: All respondents. Councils asked State-wide: 27 Councils asked group: 5*Caution: small sample size < n=30
2015 Family Support Importance
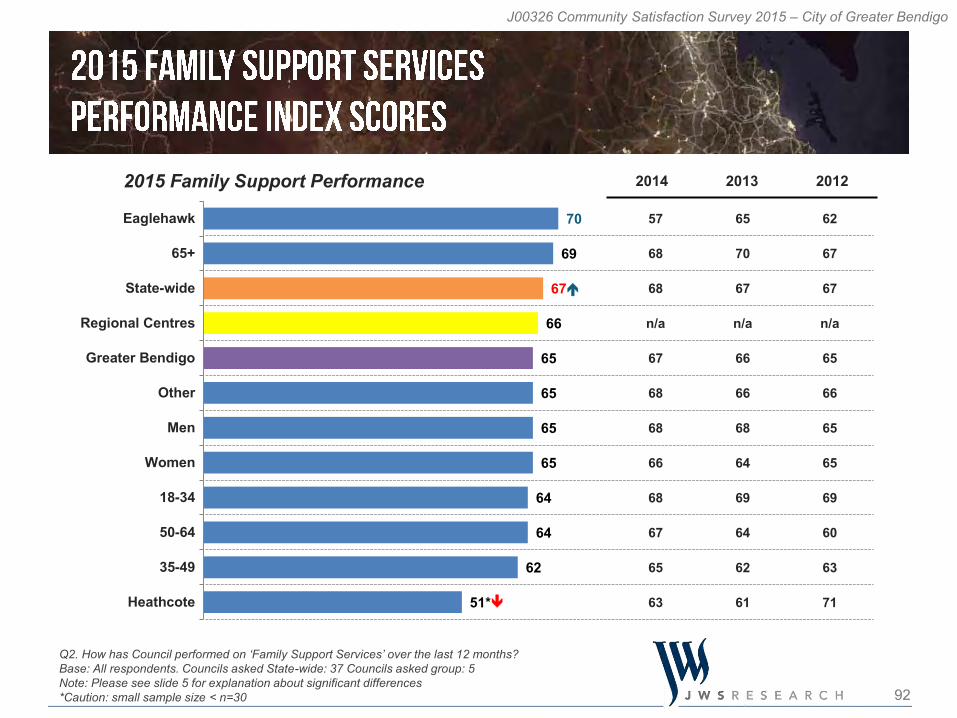
92
J00326 Community Satisfaction Survey 2015 – City of Greater Bendigo
57
68
68
n/a
67
68
68
66
68
67
65
63
65
70
67
n/a
66
66
68
64
69
64
62
61
62
67
67
n/a
65
66
65
65
69
60
63
71
70
69
67
66
65
65
65
65
64
64
62
51*
Eaglehawk
65+
State-wide
Regional Centres
Greater Bendigo
Other
Men
Women
18-34
50-64
35-49
Heathcote
Q2. How has Council performed on ‘Family Support Services’ over the last 12 months?Base: All respondents. Councils asked State-wide: 37 Councils asked group: 5 Note: Please see slide 5 for explanation about significant differences*Caution: small sample size < n=30
2015 Family Support Performance 2014 2013 2012
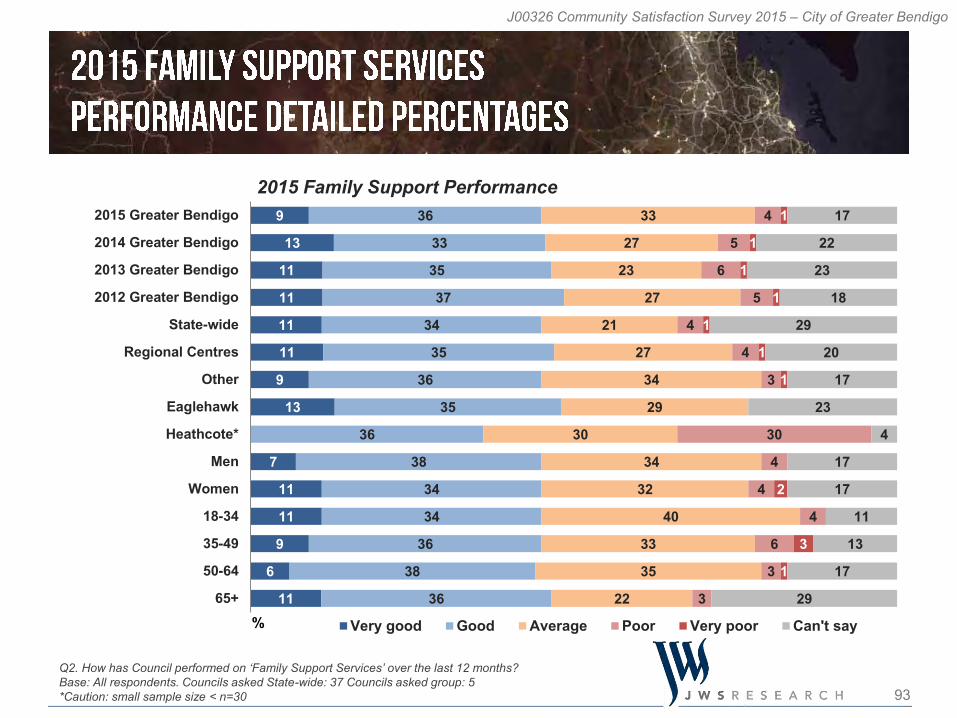
93
J00326 Community Satisfaction Survey 2015 – City of Greater Bendigo
9
13
11
11
11
11
9
13
7
11
11
9
6
11
36
33
35
37
34
35
36
35
36
38
34
34
36
38
36
33
27
23
27
21
27
34
29
30
34
32
40
33
35
22
4
5
6
5
4
4
3
30
4
4
4
6
3
3
1
1
1
1
1
1
1
2
3
1
17
22
23
18
29
20
17
23
4
17
17
11
13
17
29
2015 Greater Bendigo
2014 Greater Bendigo
2013 Greater Bendigo
2012 Greater Bendigo
State-wide
Regional Centres
Other
Eaglehawk
Heathcote*
Men
Women
18-34
35-49
50-64
65+% Very good Good Average Poor Very poor Can't say
Q2. How has Council performed on ‘Family Support Services’ over the last 12 months?Base: All respondents. Councils asked State-wide: 37 Councils asked group: 5*Caution: small sample size < n=30
2015 Family Support Performance
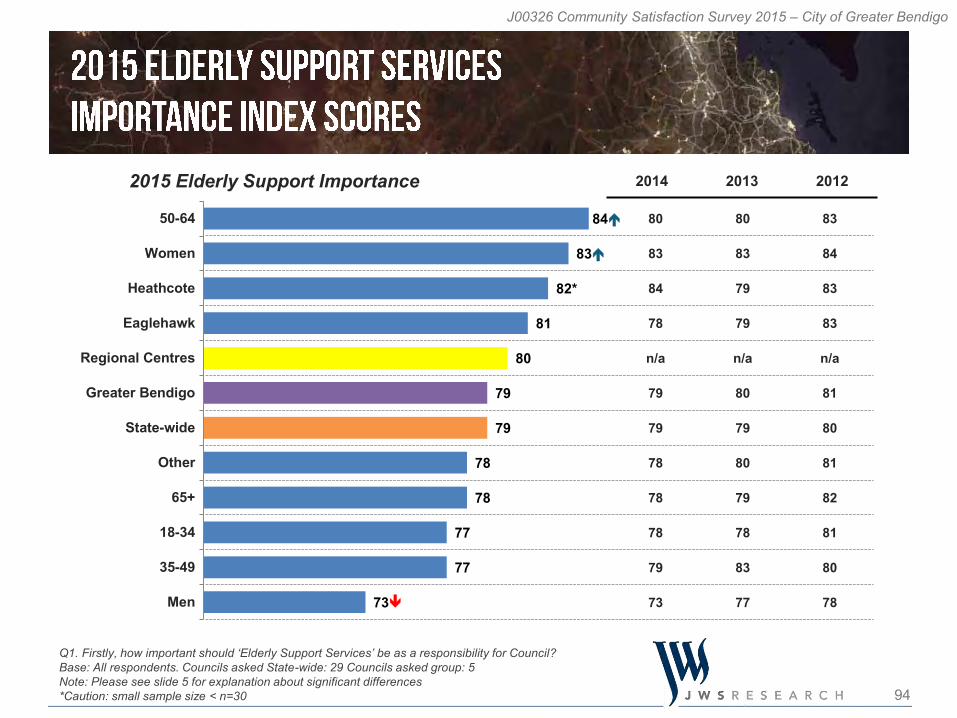
94
J00326 Community Satisfaction Survey 2015 – City of Greater Bendigo
80
83
84
78
n/a
79
79
78
78
78
79
73
80
83
79
79
n/a
80
79
80
79
78
83
77
83
84
83
83
n/a
81
80
81
82
81
80
78
84
83
82*
81
80
79
79
78
78
77
77
73
50-64
Women
Heathcote
Eaglehawk
Regional Centres
Greater Bendigo
State-wide
Other
65+
18-34
35-49
Men
Q1. Firstly, how important should ‘Elderly Support Services’ be as a responsibility for Council?Base: All respondents. Councils asked State-wide: 29 Councils asked group: 5 Note: Please see slide 5 for explanation about significant differences*Caution: small sample size < n=30
2014 2013 20122015 Elderly Support Importance
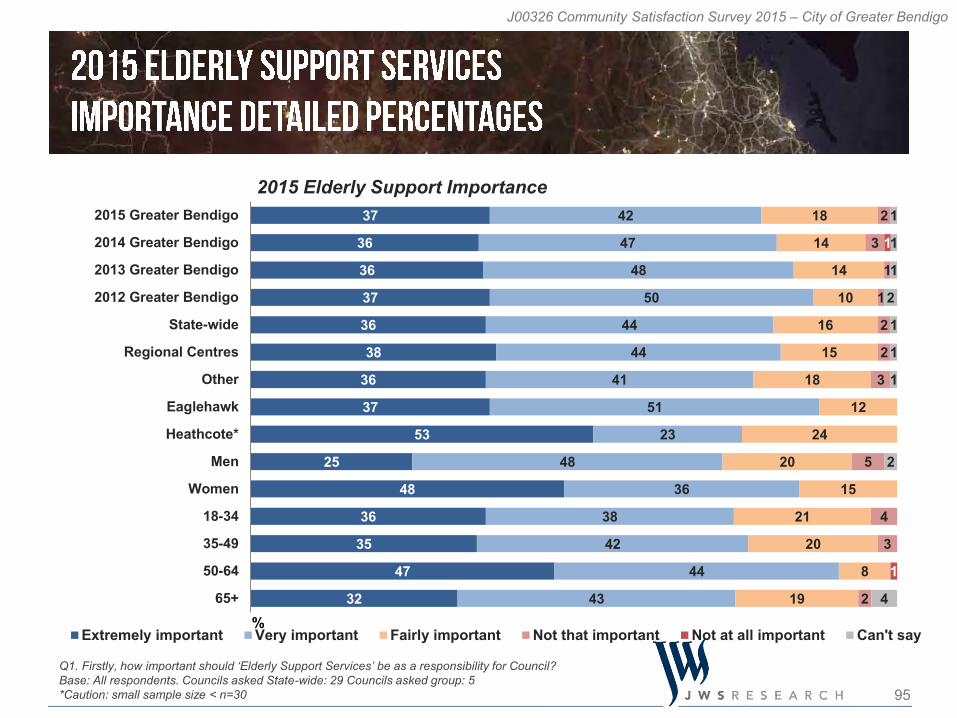
95
J00326 Community Satisfaction Survey 2015 – City of Greater Bendigo
37
36
36
37
36
38
36
37
53
25
48
36
35
47
32
42
47
48
50
44
44
41
51
23
48
36
38
42
44
43
18
14
14
10
16
15
18
12
24
20
15
21
20
8
19
2
3
1
1
2
2
3
5
4
3
2
1
1
1
1
1
2
1
1
1
2
4
2015 Greater Bendigo
2014 Greater Bendigo
2013 Greater Bendigo
2012 Greater Bendigo
State-wide
Regional Centres
Other
Eaglehawk
Heathcote*
Men
Women
18-34
35-49
50-64
65+%
Extremely important Very important Fairly important Not that important Not at all important Can't say
Q1. Firstly, how important should ‘Elderly Support Services’ be as a responsibility for Council?Base: All respondents. Councils asked State-wide: 29 Councils asked group: 5*Caution: small sample size < n=30
2015 Elderly Support Importance
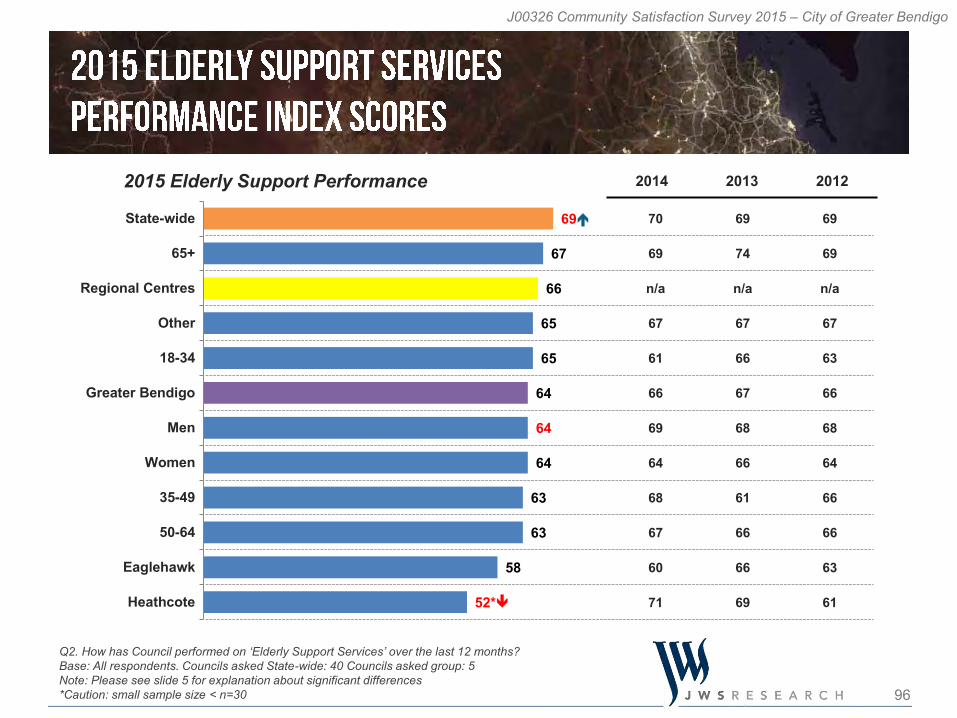
96
J00326 Community Satisfaction Survey 2015 – City of Greater Bendigo
70
69
n/a
67
61
66
69
64
68
67
60
71
69
74
n/a
67
66
67
68
66
61
66
66
69
69
69
n/a
67
63
66
68
64
66
66
63
61
69
67
66
65
65
64
64
64
63
63
58
52*
State-wide
65+
Regional Centres
Other
18-34
Greater Bendigo
Men
Women
35-49
50-64
Eaglehawk
Heathcote
Q2. How has Council performed on ‘Elderly Support Services’ over the last 12 months?Base: All respondents. Councils asked State-wide: 40 Councils asked group: 5 Note: Please see slide 5 for explanation about significant differences*Caution: small sample size < n=30
2015 Elderly Support Performance 2014 2013 2012
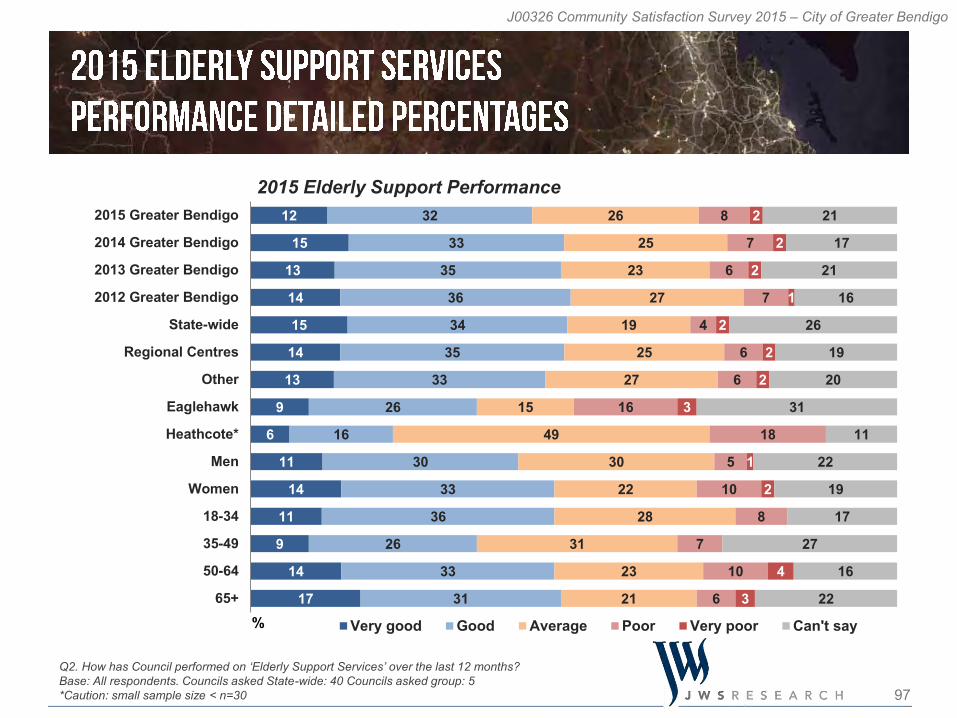
97
J00326 Community Satisfaction Survey 2015 – City of Greater Bendigo
12
15
13
14
15
14
13
9
6
11
14
11
9
14
17
32
33
35
36
34
35
33
26
16
30
33
36
26
33
31
26
25
23
27
19
25
27
15
49
30
22
28
31
23
21
8
7
6
7
4
6
6
16
18
5
10
8
7
10
6
2
2
2
1
2
2
2
3
1
2
4
3
21
17
21
16
26
19
20
31
11
22
19
17
27
16
22
2015 Greater Bendigo
2014 Greater Bendigo
2013 Greater Bendigo
2012 Greater Bendigo
State-wide
Regional Centres
Other
Eaglehawk
Heathcote*
Men
Women
18-34
35-49
50-64
65+% Very good Good Average Poor Very poor Can't say
Q2. How has Council performed on ‘Elderly Support Services’ over the last 12 months?Base: All respondents. Councils asked State-wide: 40 Councils asked group: 5*Caution: small sample size < n=30
2015 Elderly Support Performance
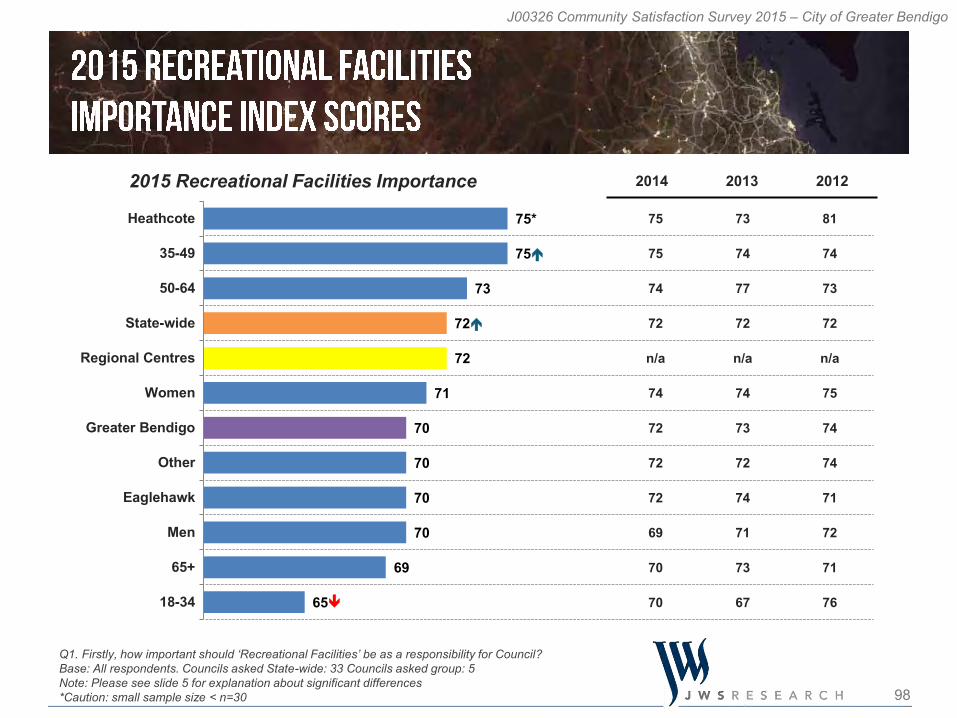
98
J00326 Community Satisfaction Survey 2015 – City of Greater Bendigo
75
75
74
72
n/a
74
72
72
72
69
70
70
73
74
77
72
n/a
74
73
72
74
71
73
67
81
74
73
72
n/a
75
74
74
71
72
71
76
75*
75
73
72
72
71
70
70
70
70
69
65
Heathcote
35-49
50-64
State-wide
Regional Centres
Women
Greater Bendigo
Other
Eaglehawk
Men
65+
18-34
Q1. Firstly, how important should ‘Recreational Facilities’ be as a responsibility for Council?Base: All respondents. Councils asked State-wide: 33 Councils asked group: 5 Note: Please see slide 5 for explanation about significant differences*Caution: small sample size < n=30
2014 2013 20122015 Recreational Facilities Importance

99
J00326 Community Satisfaction Survey 2015 – City of Greater Bendigo
20
20
24
23
23
24
19
25
42
20
21
21
23
24
13
46
51
46
52
46
43
48
38
16
47
45
30
58
45
54
28
24
27
22
26
28
28
25
43
27
29
38
16
30
27
5
3
2
2
3
4
4
11
5
4
11
3
1
3
1
1
1
1
1
1
1
1
1
3
2015 Greater Bendigo
2014 Greater Bendigo
2013 Greater Bendigo
2012 Greater Bendigo
State-wide
Regional Centres
Other
Eaglehawk
Heathcote*
Men
Women
18-34
35-49
50-64
65+%
Extremely important Very important Fairly important Not that important Not at all important Can't say
Q1. Firstly, how important should ‘Recreational Facilities’ be as a responsibility for Council?Base: All respondents. Councils asked State-wide: 33 Councils asked group: 5*Caution: small sample size < n=30
2015 Recreational Facilities Importance
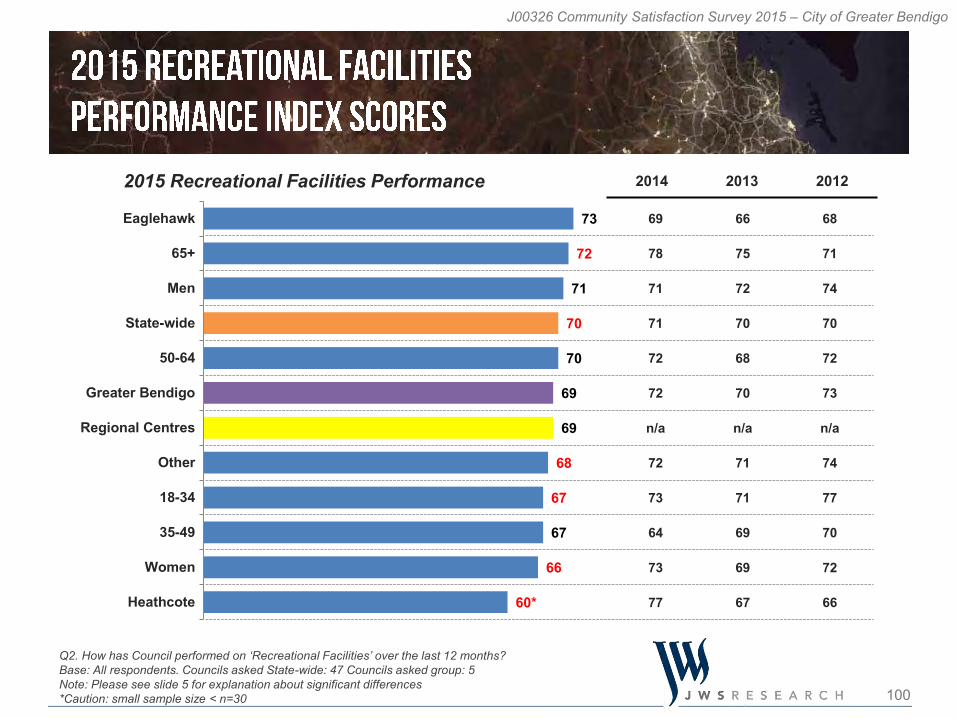
100
J00326 Community Satisfaction Survey 2015 – City of Greater Bendigo
69
78
71
71
72
72
n/a
72
73
64
73
77
66
75
72
70
68
70
n/a
71
71
69
69
67
68
71
74
70
72
73
n/a
74
77
70
72
66
73
72
71
70
70
69
69
68
67
67
66
60*
Eaglehawk
65+
Men
State-wide
50-64
Greater Bendigo
Regional Centres
Other
18-34
35-49
Women
Heathcote
Q2. How has Council performed on ‘Recreational Facilities’ over the last 12 months?Base: All respondents. Councils asked State-wide: 47 Councils asked group: 5 Note: Please see slide 5 for explanation about significant differences*Caution: small sample size < n=30
2015 Recreational Facilities Performance 2014 2013 2012
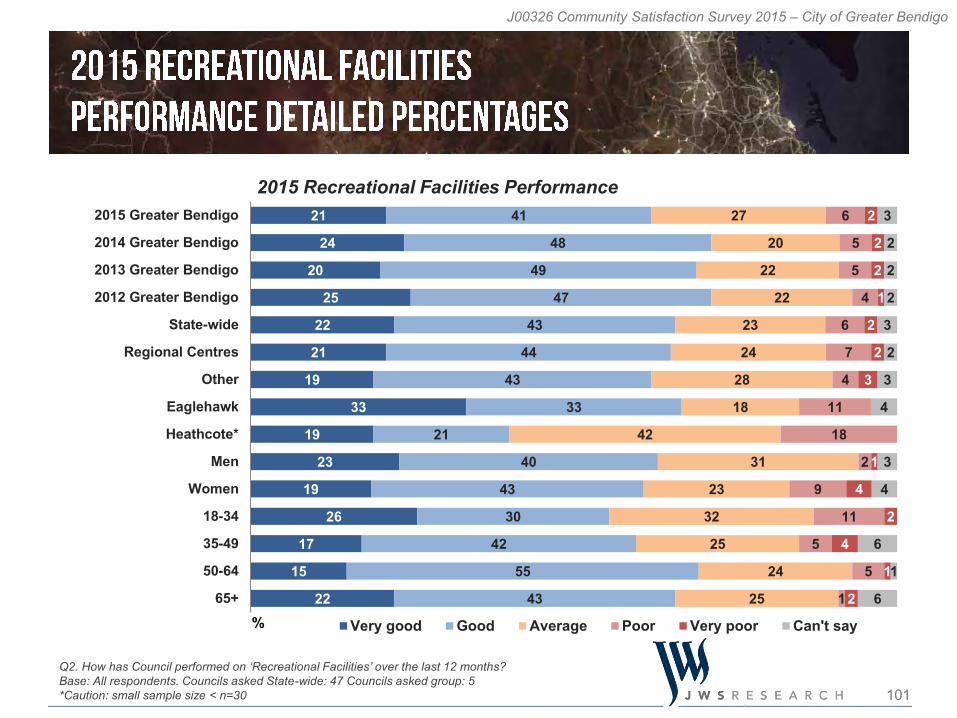
101
J00326 Community Satisfaction Survey 2015 – City of Greater Bendigo
21
24
20
25
22
21
19
33
19
23
19
26
17
15
22
41
48
49
47
43
44
43
33
21
40
43
30
42
55
43
27
20
22
22
23
24
28
18
42
31
23
32
25
24
25
6
5
5
4
6
7
4
11
18
2
9
11
5
5
1
2
2
2
1
2
2
3
1
4
2
4
1
2
3
2
2
2
3
2
3
4
3
4
6
1
6
2015 Greater Bendigo
2014 Greater Bendigo
2013 Greater Bendigo
2012 Greater Bendigo
State-wide
Regional Centres
Other
Eaglehawk
Heathcote*
Men
Women
18-34
35-49
50-64
65+% Very good Good Average Poor Very poor Can't say
Q2. How has Council performed on ‘Recreational Facilities’ over the last 12 months?Base: All respondents. Councils asked State-wide: 47 Councils asked group: 5*Caution: small sample size < n=30
2015 Recreational Facilities Performance
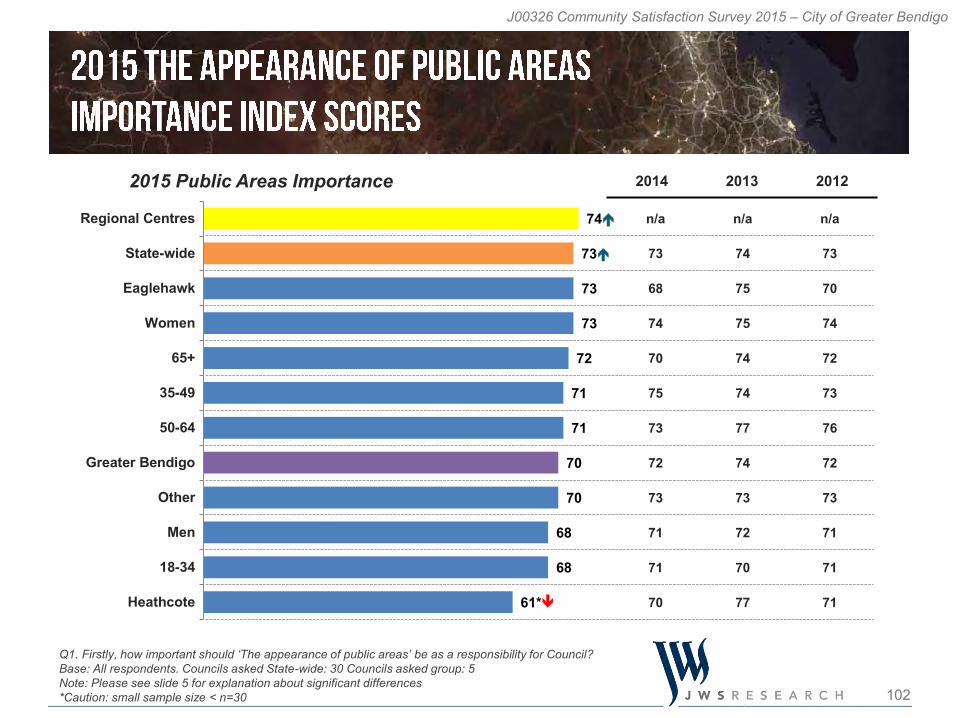
102
J00326 Community Satisfaction Survey 2015 – City of Greater Bendigo
n/a
73
68
74
70
75
73
72
73
71
71
70
n/a
74
75
75
74
74
77
74
73
72
70
77
n/a
73
70
74
72
73
76
72
73
71
71
71
74
73
73
73
72
71
71
70
70
68
68
61*
Regional Centres
State-wide
Eaglehawk
Women
65+
35-49
50-64
Greater Bendigo
Other
Men
18-34
Heathcote
Q1. Firstly, how important should ‘The appearance of public areas’ be as a responsibility for Council?Base: All respondents. Councils asked State-wide: 30 Councils asked group: 5 Note: Please see slide 5 for explanation about significant differences*Caution: small sample size < n=30
2014 2013 20122015 Public Areas Importance
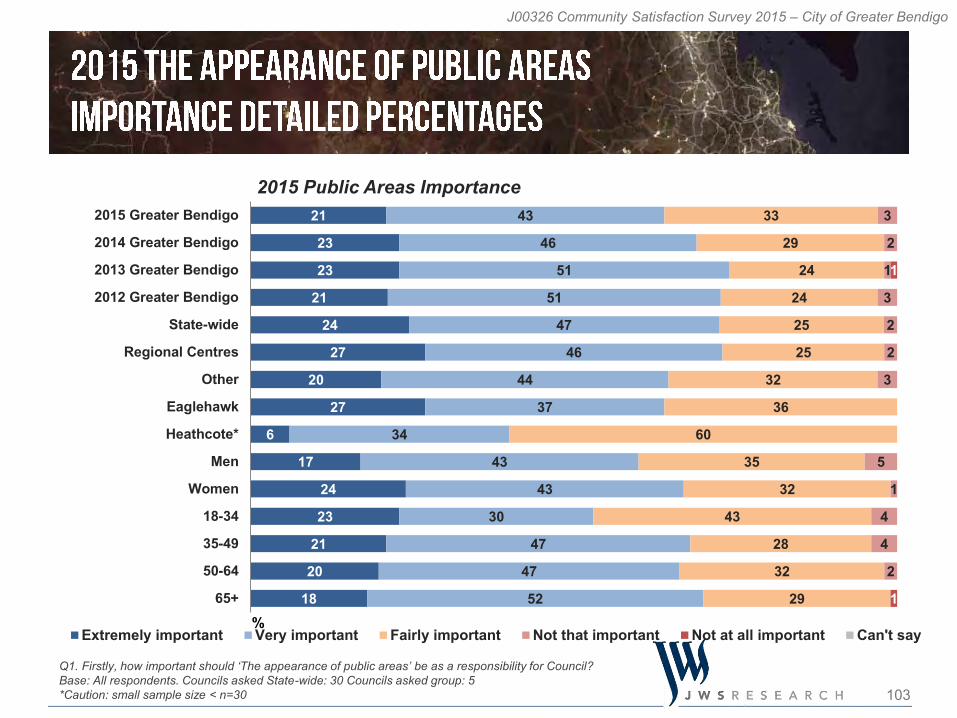
103
J00326 Community Satisfaction Survey 2015 – City of Greater Bendigo
21
23
23
21
24
27
20
27
6
17
24
23
21
20
18
43
46
51
51
47
46
44
37
34
43
43
30
47
47
52
33
29
24
24
25
25
32
36
60
35
32
43
28
32
29
3
2
1
3
2
2
3
5
1
4
4
2
1
1
2015 Greater Bendigo
2014 Greater Bendigo
2013 Greater Bendigo
2012 Greater Bendigo
State-wide
Regional Centres
Other
Eaglehawk
Heathcote*
Men
Women
18-34
35-49
50-64
65+%
Extremely important Very important Fairly important Not that important Not at all important Can't say
Q1. Firstly, how important should ‘The appearance of public areas’ be as a responsibility for Council?Base: All respondents. Councils asked State-wide: 30 Councils asked group: 5*Caution: small sample size < n=30
2015 Public Areas Importance
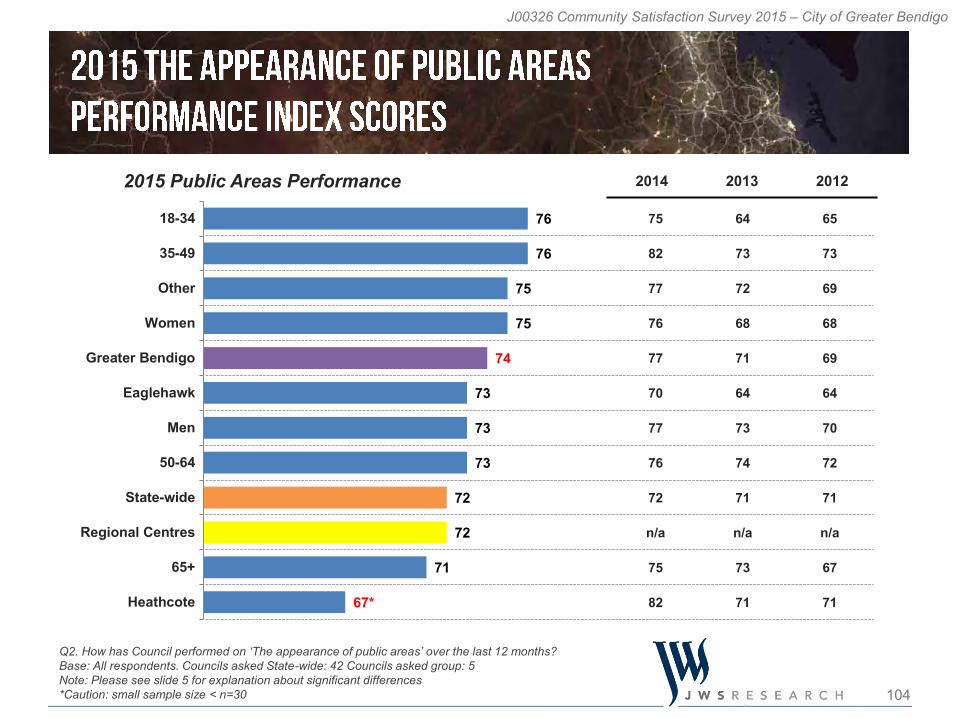
104
J00326 Community Satisfaction Survey 2015 – City of Greater Bendigo
75
82
77
76
77
70
77
76
72
n/a
75
82
64
73
72
68
71
64
73
74
71
n/a
73
71
65
73
69
68
69
64
70
72
71
n/a
67
71
76
76
75
75
74
73
73
73
72
72
71
67*
18-34
35-49
Other
Women
Greater Bendigo
Eaglehawk
Men
50-64
State-wide
Regional Centres
65+
Heathcote
Q2. How has Council performed on ‘The appearance of public areas’ over the last 12 months?Base: All respondents. Councils asked State-wide: 42 Councils asked group: 5 Note: Please see slide 5 for explanation about significant differences*Caution: small sample size < n=30
2015 Public Areas Performance 2014 2013 2012
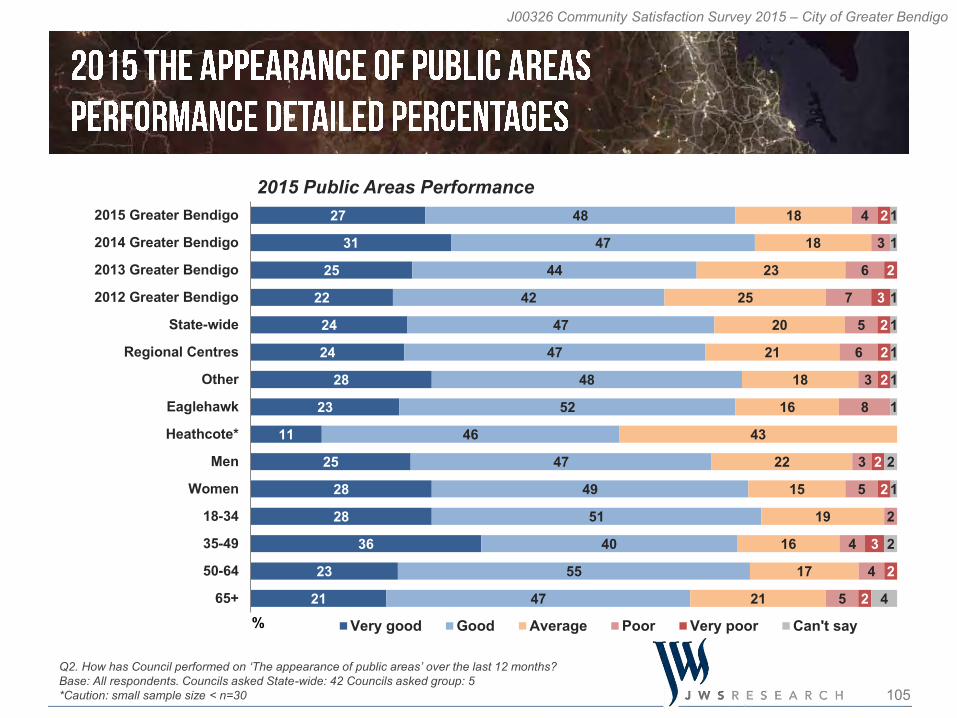
105
J00326 Community Satisfaction Survey 2015 – City of Greater Bendigo
27
31
25
22
24
24
28
23
11
25
28
28
36
23
21
48
47
44
42
47
47
48
52
46
47
49
51
40
55
47
18
18
23
25
20
21
18
16
43
22
15
19
16
17
21
4
3
6
7
5
6
3
8
3
5
2
4
4
5
2
2
3
2
2
2
2
2
3
2
2
1
1
1
1
1
1
1
2
1
2
4
2015 Greater Bendigo
2014 Greater Bendigo
2013 Greater Bendigo
2012 Greater Bendigo
State-wide
Regional Centres
Other
Eaglehawk
Heathcote*
Men
Women
18-34
35-49
50-64
65+% Very good Good Average Poor Very poor Can't say
Q2. How has Council performed on ‘The appearance of public areas’ over the last 12 months?Base: All respondents. Councils asked State-wide: 42 Councils asked group: 5*Caution: small sample size < n=30
2015 Public Areas Performance
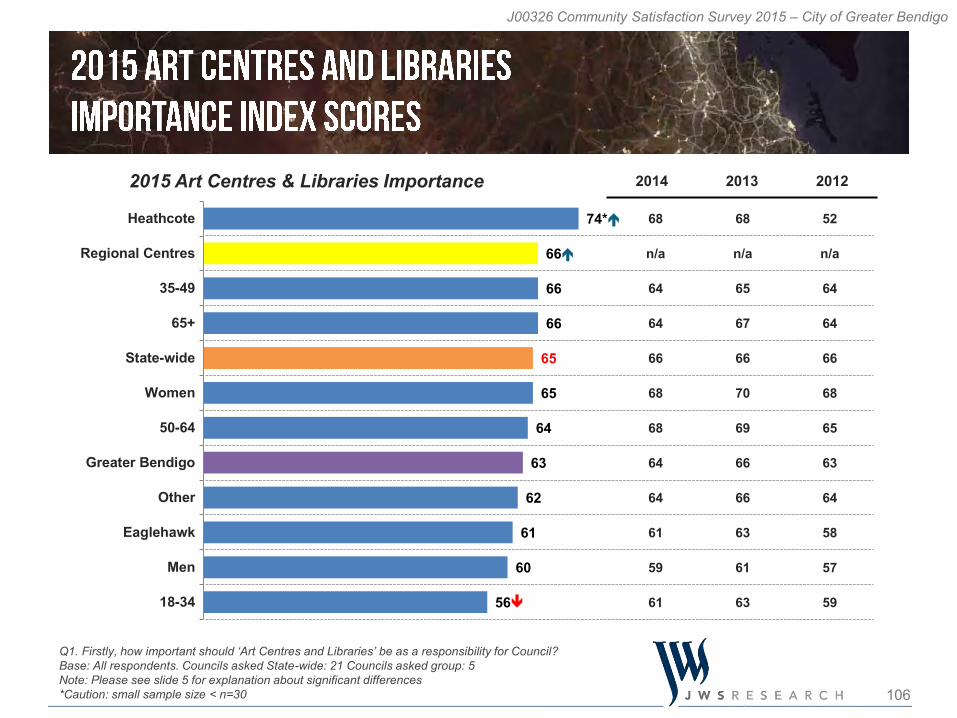
106
J00326 Community Satisfaction Survey 2015 – City of Greater Bendigo
68
n/a
64
64
66
68
68
64
64
61
59
61
68
n/a
65
67
66
70
69
66
66
63
61
63
52
n/a
64
64
66
68
65
63
64
58
57
59
74*
66
66
66
65
65
64
63
62
61
60
56
Heathcote
Regional Centres
35-49
65+
State-wide
Women
50-64
Greater Bendigo
Other
Eaglehawk
Men
18-34
Q1. Firstly, how important should ‘Art Centres and Libraries’ be as a responsibility for Council?Base: All respondents. Councils asked State-wide: 21 Councils asked group: 5 Note: Please see slide 5 for explanation about significant differences*Caution: small sample size < n=30
2014 2013 20122015 Art Centres & Libraries Importance
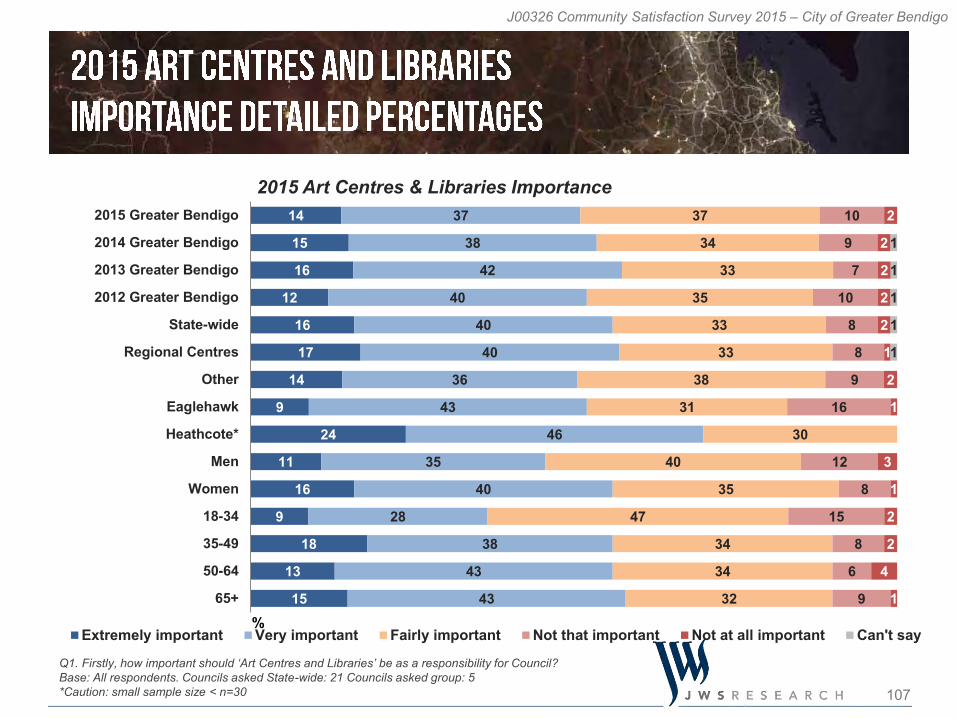
107
J00326 Community Satisfaction Survey 2015 – City of Greater Bendigo
14
15
16
12
16
17
14
9
24
11
16
9
18
13
15
37
38
42
40
40
40
36
43
46
35
40
28
38
43
43
37
34
33
35
33
33
38
31
30
40
35
47
34
34
32
10
9
7
10
8
8
9
16
12
8
15
8
6
9
2
2
2
2
2
1
2
1
3
1
2
2
4
1
1
1
1
1
1
2015 Greater Bendigo
2014 Greater Bendigo
2013 Greater Bendigo
2012 Greater Bendigo
State-wide
Regional Centres
Other
Eaglehawk
Heathcote*
Men
Women
18-34
35-49
50-64
65+%
Extremely important Very important Fairly important Not that important Not at all important Can't say
Q1. Firstly, how important should ‘Art Centres and Libraries’ be as a responsibility for Council?Base: All respondents. Councils asked State-wide: 21 Councils asked group: 5*Caution: small sample size < n=30
2015 Art Centres & Libraries Importance
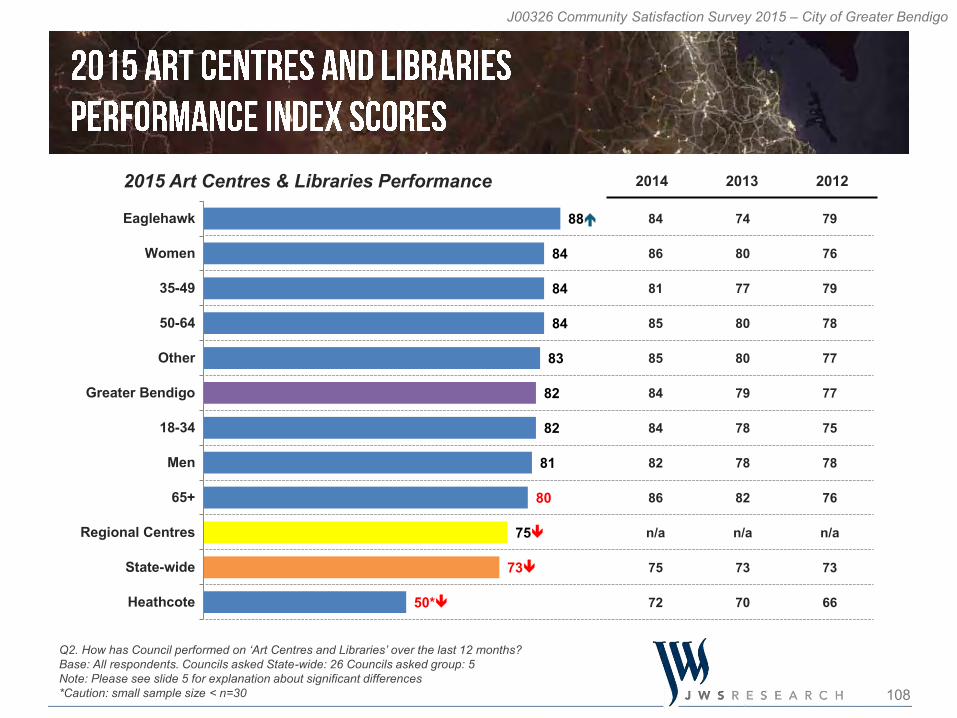
108
J00326 Community Satisfaction Survey 2015 – City of Greater Bendigo
84
86
81
85
85
84
84
82
86
n/a
75
72
74
80
77
80
80
79
78
78
82
n/a
73
70
79
76
79
78
77
77
75
78
76
n/a
73
66
88
84
84
84
83
82
82
81
80
75
73
50*
Eaglehawk
Women
35-49
50-64
Other
Greater Bendigo
18-34
Men
65+
Regional Centres
State-wide
Heathcote
Q2. How has Council performed on ‘Art Centres and Libraries’ over the last 12 months?Base: All respondents. Councils asked State-wide: 26 Councils asked group: 5 Note: Please see slide 5 for explanation about significant differences*Caution: small sample size < n=30
2015 Art Centres & Libraries Performance 2014 2013 2012
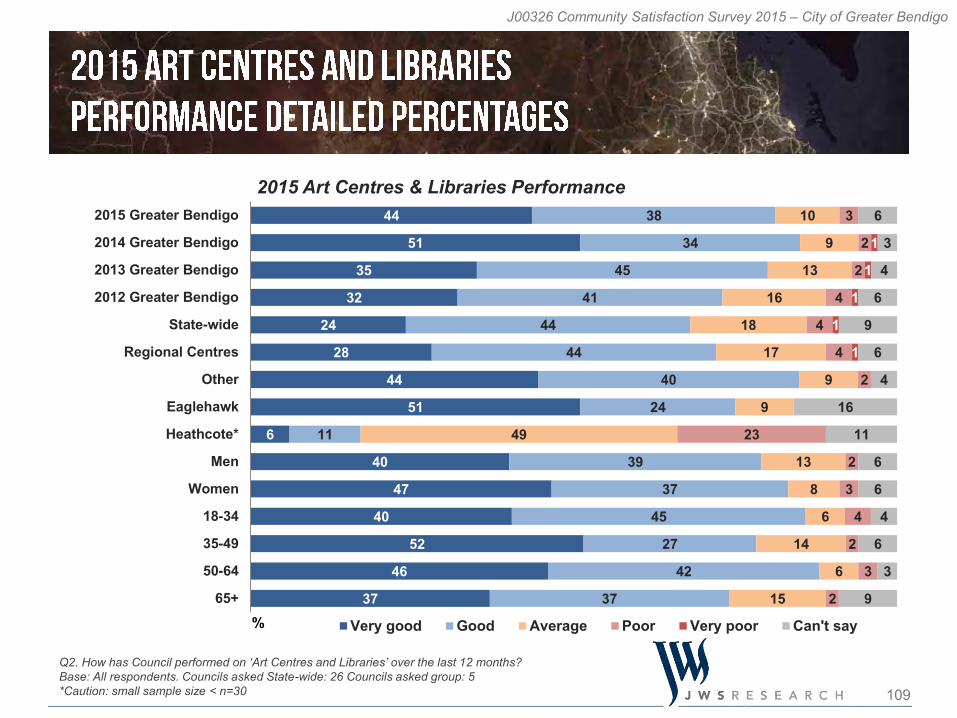
109
J00326 Community Satisfaction Survey 2015 – City of Greater Bendigo
44
51
35
32
24
28
44
51
6
40
47
40
52
46
37
38
34
45
41
44
44
40
24
11
39
37
45
27
42
37
10
9
13
16
18
17
9
9
49
13
8
6
14
6
15
3
2
2
4
4
4
2
23
2
3
4
2
3
2
1
1
1
1
1
6
3
4
6
9
6
4
16
11
6
6
4
6
3
9
2015 Greater Bendigo
2014 Greater Bendigo
2013 Greater Bendigo
2012 Greater Bendigo
State-wide
Regional Centres
Other
Eaglehawk
Heathcote*
Men
Women
18-34
35-49
50-64
65+% Very good Good Average Poor Very poor Can't say
Q2. How has Council performed on ‘Art Centres and Libraries’ over the last 12 months?Base: All respondents. Councils asked State-wide: 26 Councils asked group: 5*Caution: small sample size < n=30
2015 Art Centres & Libraries Performance
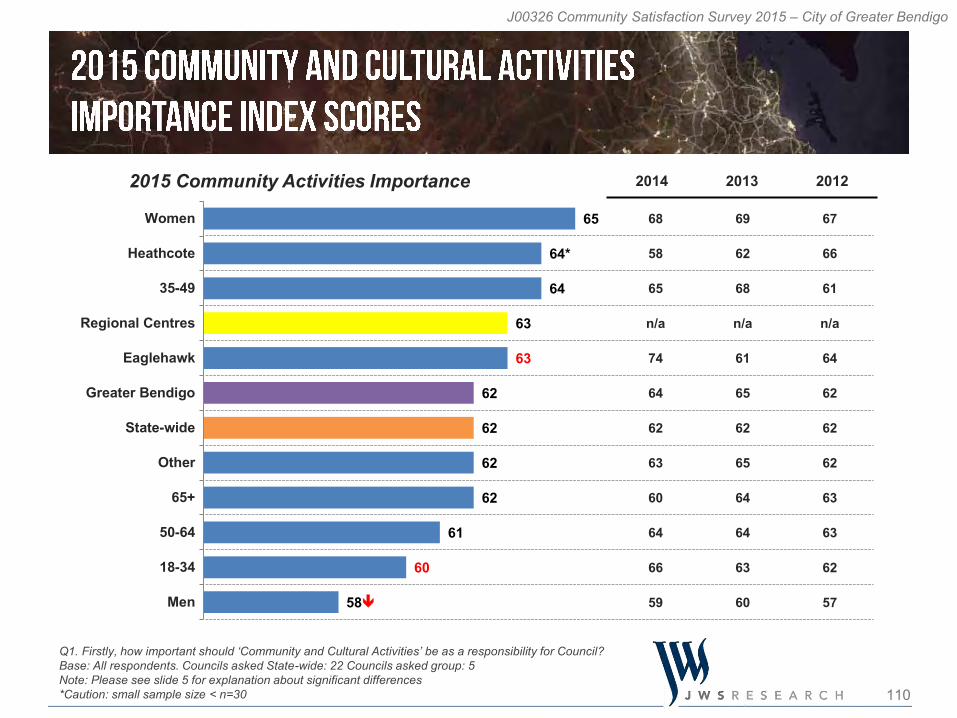
110
J00326 Community Satisfaction Survey 2015 – City of Greater Bendigo
68
58
65
n/a
74
64
62
63
60
64
66
59
69
62
68
n/a
61
65
62
65
64
64
63
60
67
66
61
n/a
64
62
62
62
63
63
62
57
65
64*
64
63
63
62
62
62
62
61
60
58
Women
Heathcote
35-49
Regional Centres
Eaglehawk
Greater Bendigo
State-wide
Other
65+
50-64
18-34
Men
Q1. Firstly, how important should ‘Community and Cultural Activities’ be as a responsibility for Council?Base: All respondents. Councils asked State-wide: 22 Councils asked group: 5 Note: Please see slide 5 for explanation about significant differences*Caution: small sample size < n=30
2014 2013 20122015 Community Activities Importance
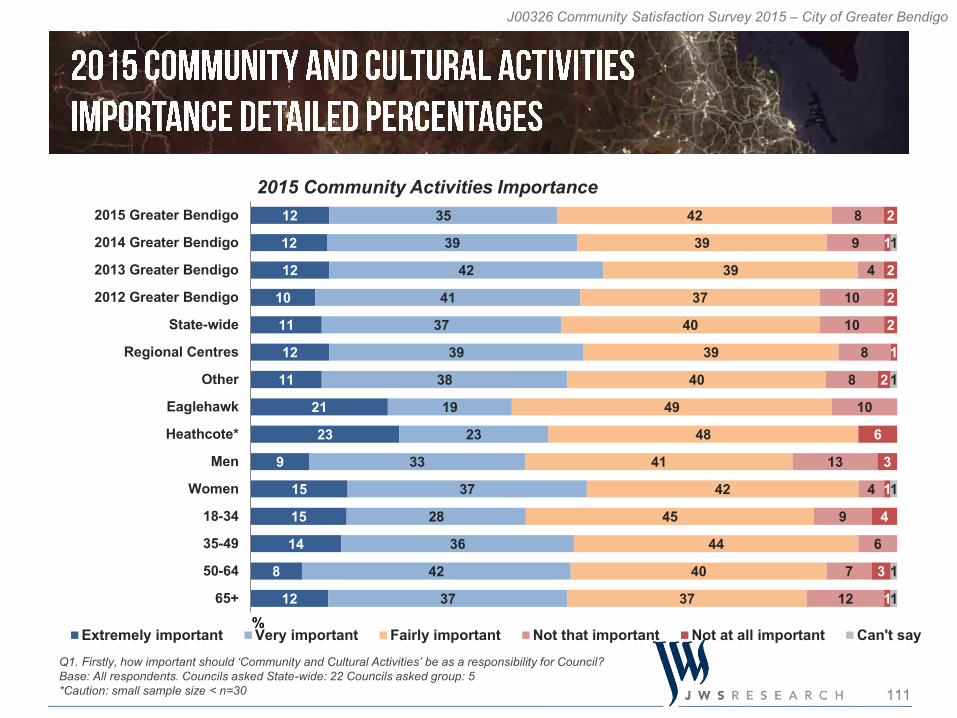
111
J00326 Community Satisfaction Survey 2015 – City of Greater Bendigo
12
12
12
10
11
12
11
21
23
9
15
15
14
8
12
35
39
42
41
37
39
38
19
23
33
37
28
36
42
37
42
39
39
37
40
39
40
49
48
41
42
45
44
40
37
8
9
4
10
10
8
8
10
13
4
9
6
7
12
2
1
2
2
2
1
2
6
3
1
4
3
1
1
1
1
1
1
2015 Greater Bendigo
2014 Greater Bendigo
2013 Greater Bendigo
2012 Greater Bendigo
State-wide
Regional Centres
Other
Eaglehawk
Heathcote*
Men
Women
18-34
35-49
50-64
65+%
Extremely important Very important Fairly important Not that important Not at all important Can't sayQ1. Firstly, how important should ‘Community and Cultural Activities’ be as a responsibility for Council?Base: All respondents. Councils asked State-wide: 22 Councils asked group: 5*Caution: small sample size < n=30
2015 Community Activities Importance
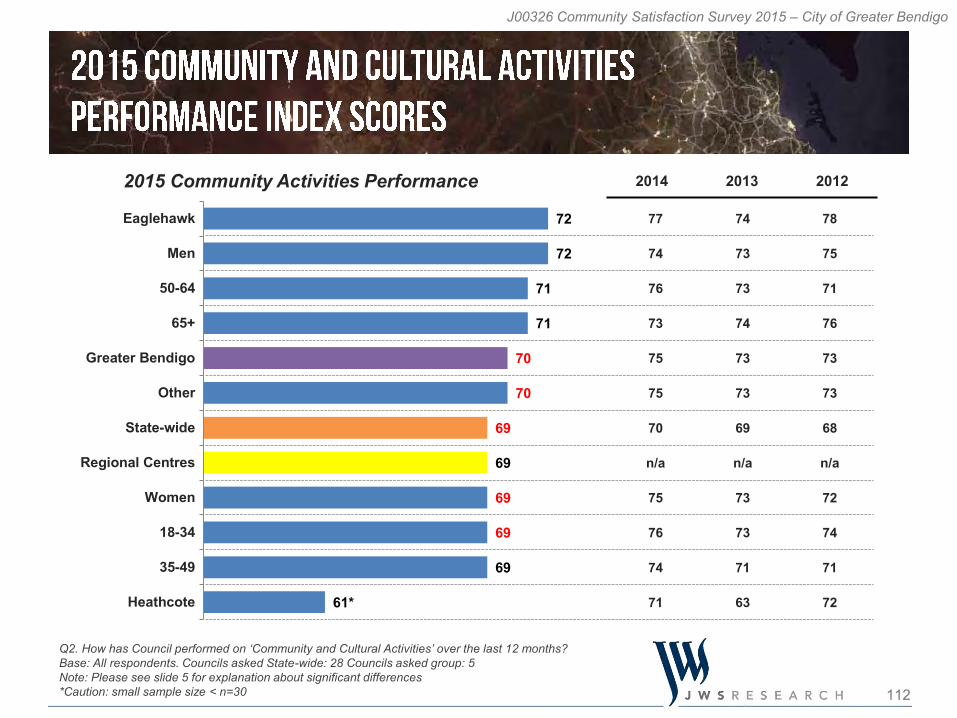
112
J00326 Community Satisfaction Survey 2015 – City of Greater Bendigo
77
74
76
73
75
75
70
n/a
75
76
74
71
74
73
73
74
73
73
69
n/a
73
73
71
63
78
75
71
76
73
73
68
n/a
72
74
71
72
72
72
71
71
70
70
69
69
69
69
69
61*
Eaglehawk
Men
50-64
65+
Greater Bendigo
Other
State-wide
Regional Centres
Women
18-34
35-49
Heathcote
Q2. How has Council performed on ‘Community and Cultural Activities’ over the last 12 months?Base: All respondents. Councils asked State-wide: 28 Councils asked group: 5 Note: Please see slide 5 for explanation about significant differences*Caution: small sample size < n=30
2015 Community Activities Performance 2014 2013 2012
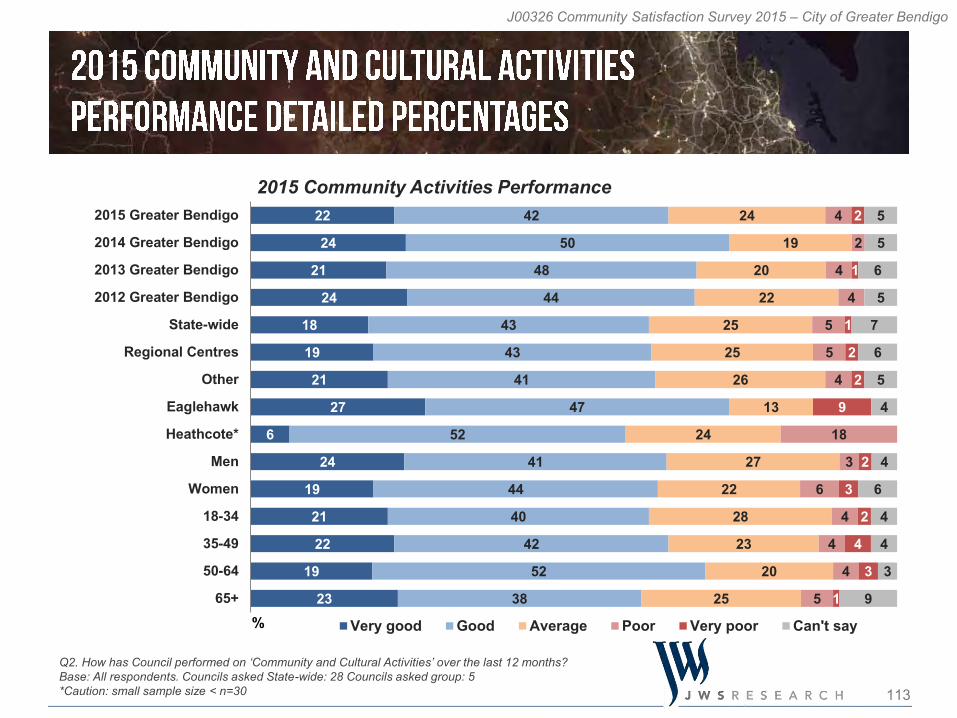
113
J00326 Community Satisfaction Survey 2015 – City of Greater Bendigo
22
24
21
24
18
19
21
27
6
24
19
21
22
19
23
42
50
48
44
43
43
41
47
52
41
44
40
42
52
38
24
19
20
22
25
25
26
13
24
27
22
28
23
20
25
4
2
4
4
5
5
4
18
3
6
4
4
4
5
2
1
1
2
2
9
2
3
2
4
3
1
5
5
6
5
7
6
5
4
4
6
4
4
3
9
2015 Greater Bendigo
2014 Greater Bendigo
2013 Greater Bendigo
2012 Greater Bendigo
State-wide
Regional Centres
Other
Eaglehawk
Heathcote*
Men
Women
18-34
35-49
50-64
65+% Very good Good Average Poor Very poor Can't say
Q2. How has Council performed on ‘Community and Cultural Activities’ over the last 12 months?Base: All respondents. Councils asked State-wide: 28 Councils asked group: 5*Caution: small sample size < n=30
2015 Community Activities Performance
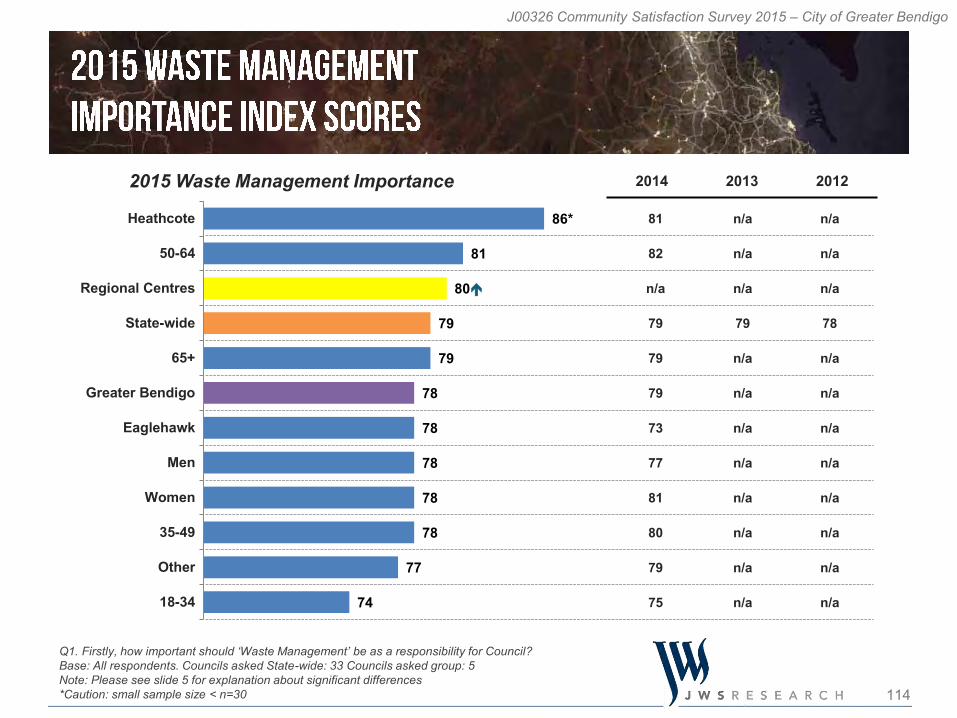
114
J00326 Community Satisfaction Survey 2015 – City of Greater Bendigo
81
82
n/a
79
79
79
73
77
81
80
79
75
n/a
n/a
n/a
79
n/a
n/a
n/a
n/a
n/a
n/a
n/a
n/a
n/a
n/a
n/a
78
n/a
n/a
n/a
n/a
n/a
n/a
n/a
n/a
86*
81
80
79
79
78
78
78
78
78
77
74
Heathcote
50-64
Regional Centres
State-wide
65+
Greater Bendigo
Eaglehawk
Men
Women
35-49
Other
18-34
Q1. Firstly, how important should ‘Waste Management’ be as a responsibility for Council?Base: All respondents. Councils asked State-wide: 33 Councils asked group: 5 Note: Please see slide 5 for explanation about significant differences*Caution: small sample size < n=30
2014 2013 20122015 Waste Management Importance
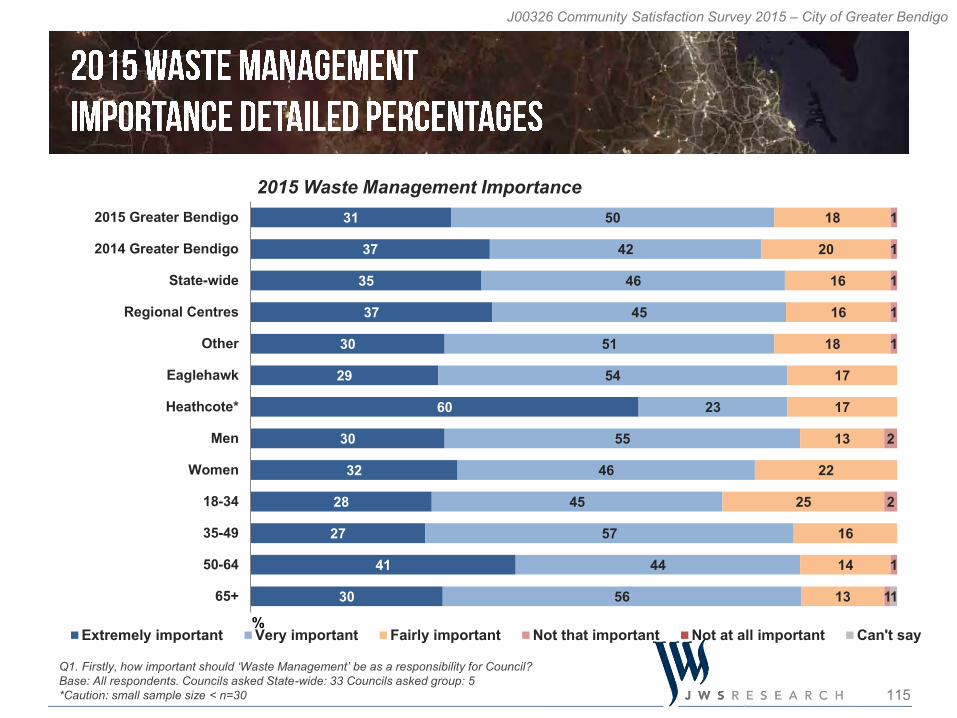
115
J00326 Community Satisfaction Survey 2015 – City of Greater Bendigo
31
37
35
37
30
29
60
30
32
28
27
41
30
50
42
46
45
51
54
23
55
46
45
57
44
56
18
20
16
16
18
17
17
13
22
25
16
14
13
1
1
1
1
1
2
2
1
11
2015 Greater Bendigo
2014 Greater Bendigo
State-wide
Regional Centres
Other
Eaglehawk
Heathcote*
Men
Women
18-34
35-49
50-64
65+
%Extremely important Very important Fairly important Not that important Not at all important Can't say
Q1. Firstly, how important should ‘Waste Management’ be as a responsibility for Council?Base: All respondents. Councils asked State-wide: 33 Councils asked group: 5*Caution: small sample size < n=30
2015 Waste Management Importance
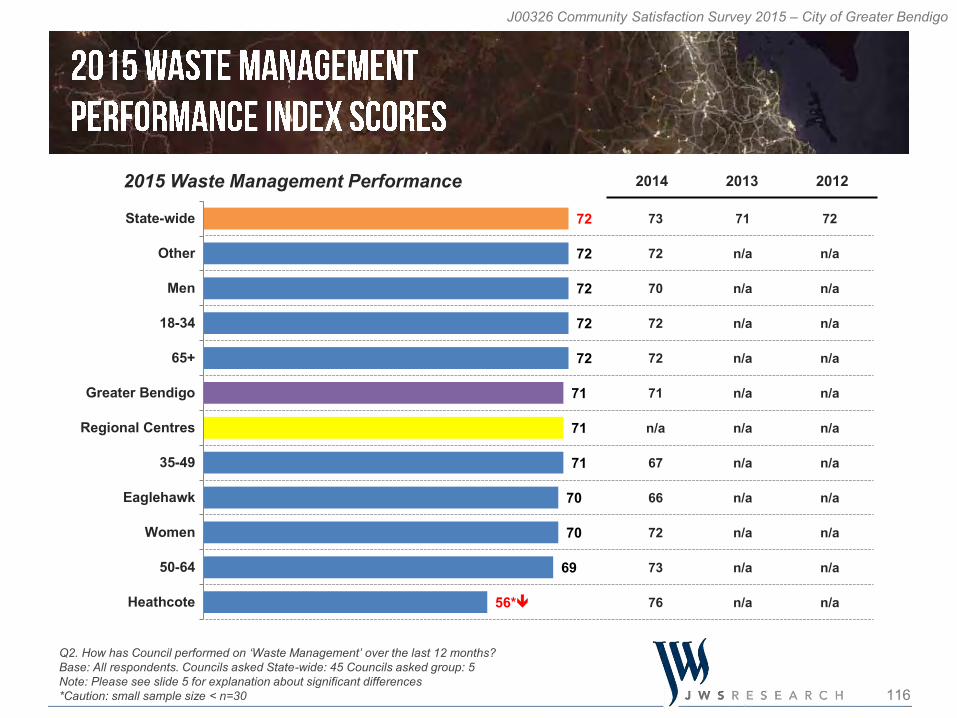
116
J00326 Community Satisfaction Survey 2015 – City of Greater Bendigo
73
72
70
72
72
71
n/a
67
66
72
73
76
71
n/a
n/a
n/a
n/a
n/a
n/a
n/a
n/a
n/a
n/a
n/a
72
n/a
n/a
n/a
n/a
n/a
n/a
n/a
n/a
n/a
n/a
n/a
72
72
72
72
72
71
71
71
70
70
69
56*
State-wide
Other
Men
18-34
65+
Greater Bendigo
Regional Centres
35-49
Eaglehawk
Women
50-64
Heathcote
Q2. How has Council performed on ‘Waste Management’ over the last 12 months?Base: All respondents. Councils asked State-wide: 45 Councils asked group: 5 Note: Please see slide 5 for explanation about significant differences*Caution: small sample size < n=30
2015 Waste Management Performance 2014 2013 2012
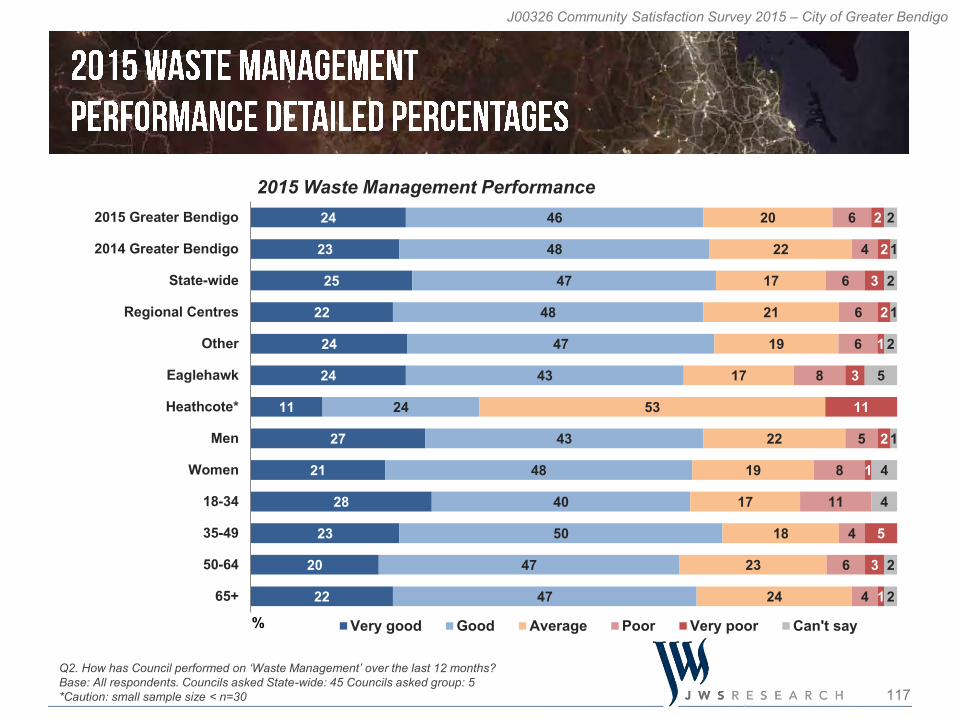
117
J00326 Community Satisfaction Survey 2015 – City of Greater Bendigo
24
23
25
22
24
24
11
27
21
28
23
20
22
46
48
47
48
47
43
24
43
48
40
50
47
47
20
22
17
21
19
17
53
22
19
17
18
23
24
6
4
6
6
6
8
5
8
11
4
6
4
2
2
3
2
1
3
11
2
1
5
3
1
2
1
2
1
2
5
1
4
4
2
2
2015 Greater Bendigo
2014 Greater Bendigo
State-wide
Regional Centres
Other
Eaglehawk
Heathcote*
Men
Women
18-34
35-49
50-64
65+
% Very good Good Average Poor Very poor Can't say
Q2. How has Council performed on ‘Waste Management’ over the last 12 months?Base: All respondents. Councils asked State-wide: 45 Councils asked group: 5*Caution: small sample size < n=30
2015 Waste Management Performance
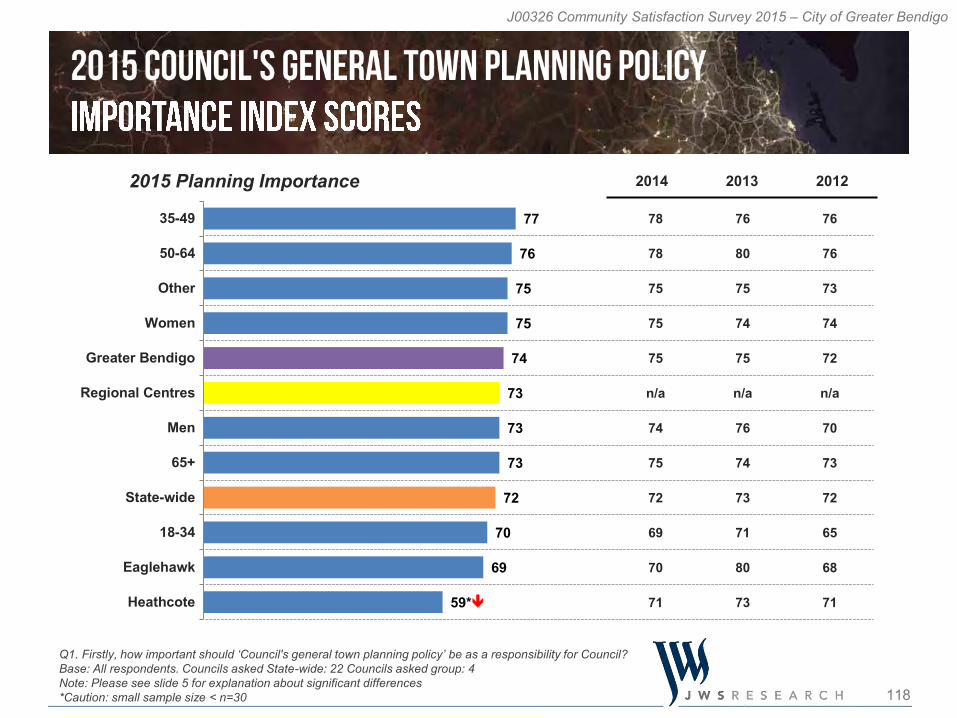
118
J00326 Community Satisfaction Survey 2015 – City of Greater Bendigo
78
78
75
75
75
n/a
74
75
72
69
70
71
76
80
75
74
75
n/a
76
74
73
71
80
73
76
76
73
74
72
n/a
70
73
72
65
68
71
77
76
75
75
74
73
73
73
72
70
69
59*
35-49
50-64
Other
Women
Greater Bendigo
Regional Centres
Men
65+
State-wide
18-34
Eaglehawk
Heathcote
Q1. Firstly, how important should ‘Council's general town planning policy’ be as a responsibility for Council?Base: All respondents. Councils asked State-wide: 22 Councils asked group: 4 Note: Please see slide 5 for explanation about significant differences*Caution: small sample size < n=30
2014 2013 20122015 Planning Importance
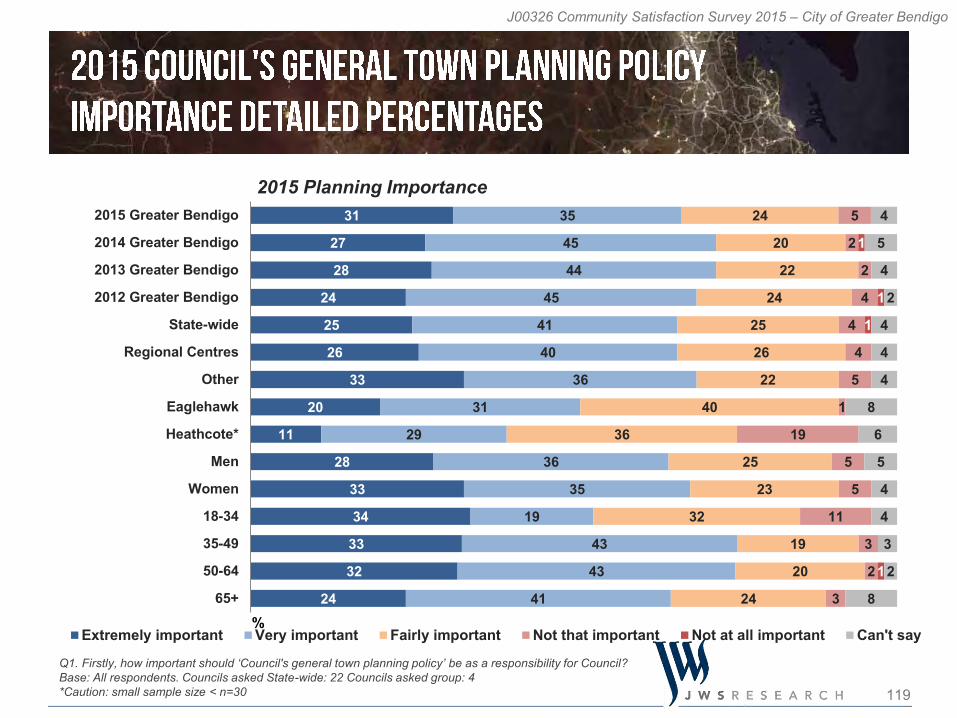
119
J00326 Community Satisfaction Survey 2015 – City of Greater Bendigo
31
27
28
24
25
26
33
20
11
28
33
34
33
32
24
35
45
44
45
41
40
36
31
29
36
35
19
43
43
41
24
20
22
24
25
26
22
40
36
25
23
32
19
20
24
5
2
2
4
4
4
5
1
19
5
5
11
3
2
3
1
1
1
1
4
5
4
2
4
4
4
8
6
5
4
4
3
2
8
2015 Greater Bendigo
2014 Greater Bendigo
2013 Greater Bendigo
2012 Greater Bendigo
State-wide
Regional Centres
Other
Eaglehawk
Heathcote*
Men
Women
18-34
35-49
50-64
65+%
Extremely important Very important Fairly important Not that important Not at all important Can't say
Q1. Firstly, how important should ‘Council's general town planning policy’ be as a responsibility for Council?Base: All respondents. Councils asked State-wide: 22 Councils asked group: 4*Caution: small sample size < n=30
2015 Planning Importance
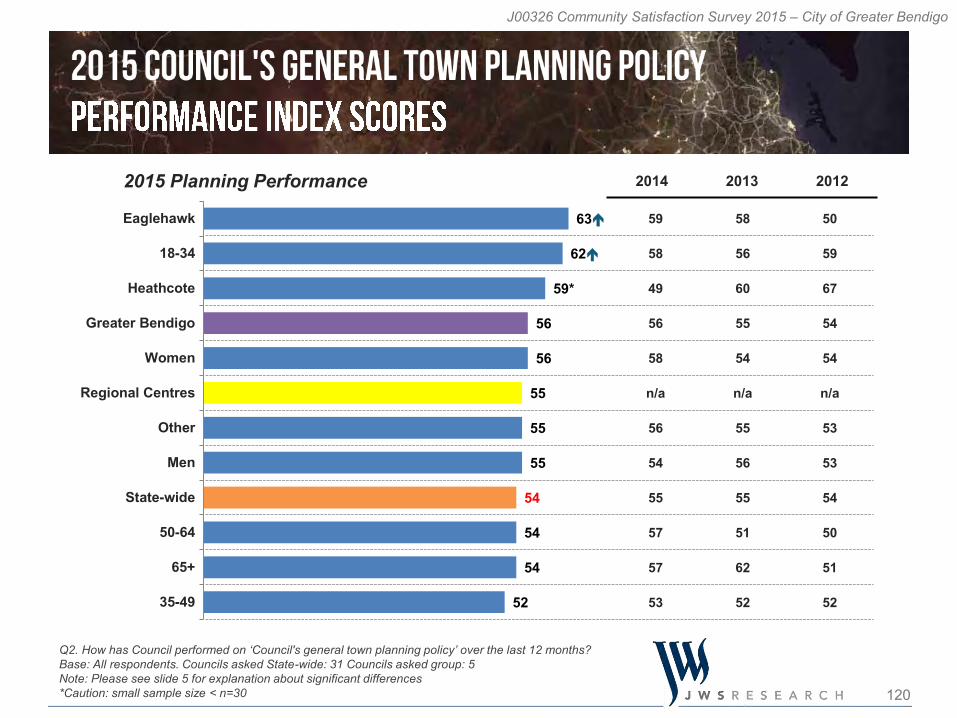
120
J00326 Community Satisfaction Survey 2015 – City of Greater Bendigo
59
58
49
56
58
n/a
56
54
55
57
57
53
58
56
60
55
54
n/a
55
56
55
51
62
52
50
59
67
54
54
n/a
53
53
54
50
51
52
63
62
59*
56
56
55
55
55
54
54
54
52
Eaglehawk
18-34
Heathcote
Greater Bendigo
Women
Regional Centres
Other
Men
State-wide
50-64
65+
35-49
Q2. How has Council performed on ‘Council's general town planning policy’ over the last 12 months?Base: All respondents. Councils asked State-wide: 31 Councils asked group: 5 Note: Please see slide 5 for explanation about significant differences*Caution: small sample size < n=30
2015 Planning Performance 2014 2013 2012
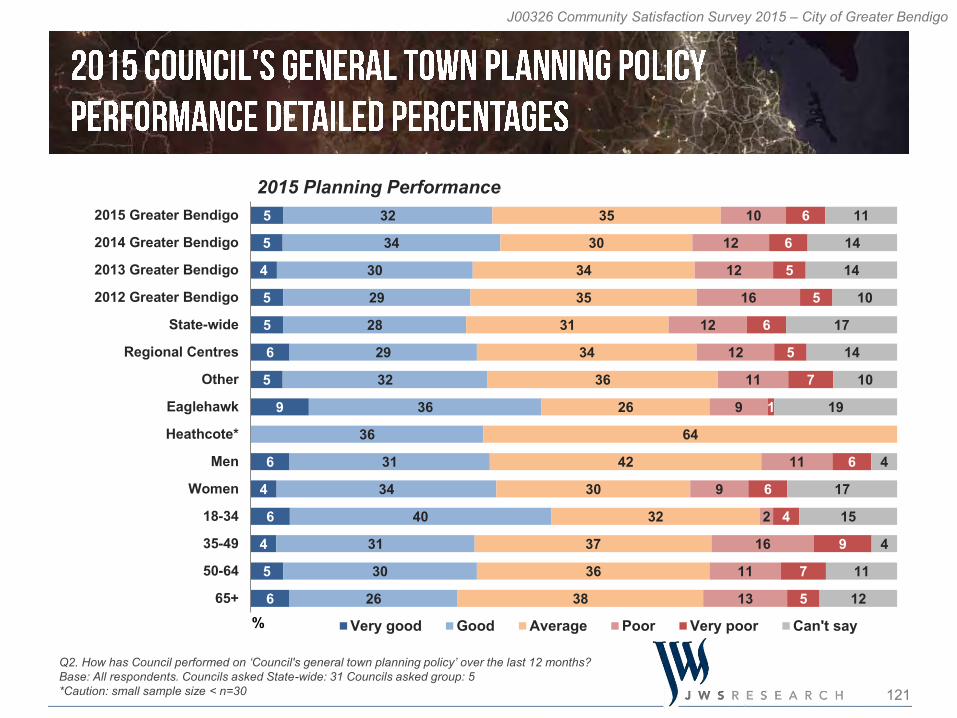
121
J00326 Community Satisfaction Survey 2015 – City of Greater Bendigo
5
5
4
5
5
6
5
9
6
4
6
4
5
6
32
34
30
29
28
29
32
36
36
31
34
40
31
30
26
35
30
34
35
31
34
36
26
64
42
30
32
37
36
38
10
12
12
16
12
12
11
9
11
9
2
16
11
13
6
6
5
5
6
5
7
1
6
6
4
9
7
5
11
14
14
10
17
14
10
19
4
17
15
4
11
12
2015 Greater Bendigo
2014 Greater Bendigo
2013 Greater Bendigo
2012 Greater Bendigo
State-wide
Regional Centres
Other
Eaglehawk
Heathcote*
Men
Women
18-34
35-49
50-64
65+% Very good Good Average Poor Very poor Can't say
Q2. How has Council performed on ‘Council's general town planning policy’ over the last 12 months?Base: All respondents. Councils asked State-wide: 31 Councils asked group: 5*Caution: small sample size < n=30
2015 Planning Performance
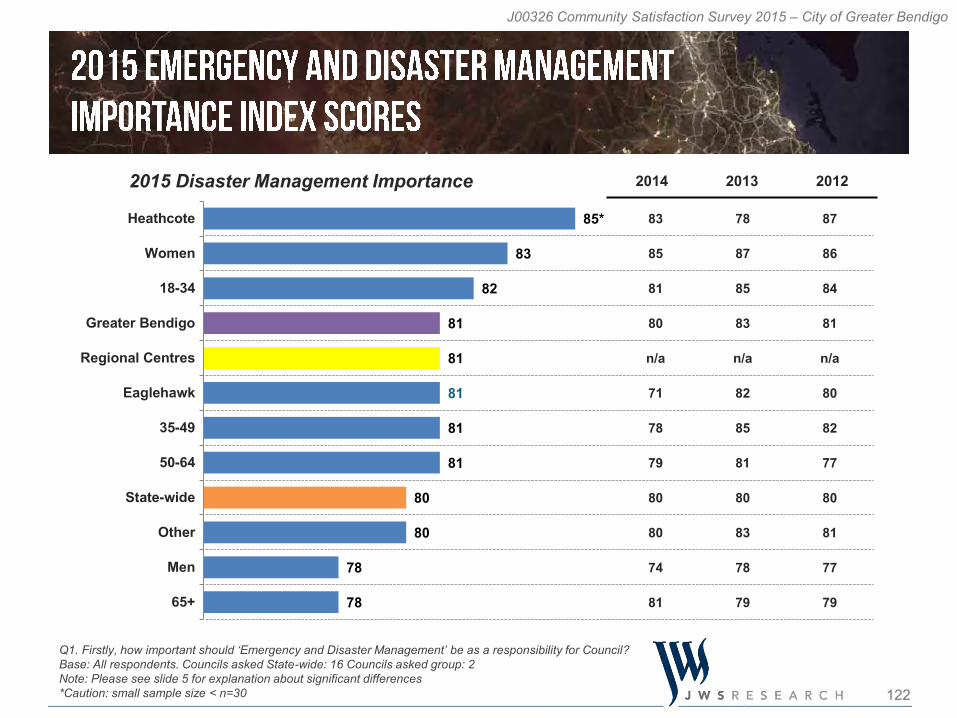
122
J00326 Community Satisfaction Survey 2015 – City of Greater Bendigo
83
85
81
80
n/a
71
78
79
80
80
74
81
78
87
85
83
n/a
82
85
81
80
83
78
79
87
86
84
81
n/a
80
82
77
80
81
77
79
85*
83
82
81
81
81
81
81
80
80
78
78
Heathcote
Women
18-34
Greater Bendigo
Regional Centres
Eaglehawk
35-49
50-64
State-wide
Other
Men
65+
Q1. Firstly, how important should ‘Emergency and Disaster Management’ be as a responsibility for Council?Base: All respondents. Councils asked State-wide: 16 Councils asked group: 2 Note: Please see slide 5 for explanation about significant differences*Caution: small sample size < n=30
2014 2013 20122015 Disaster Management Importance
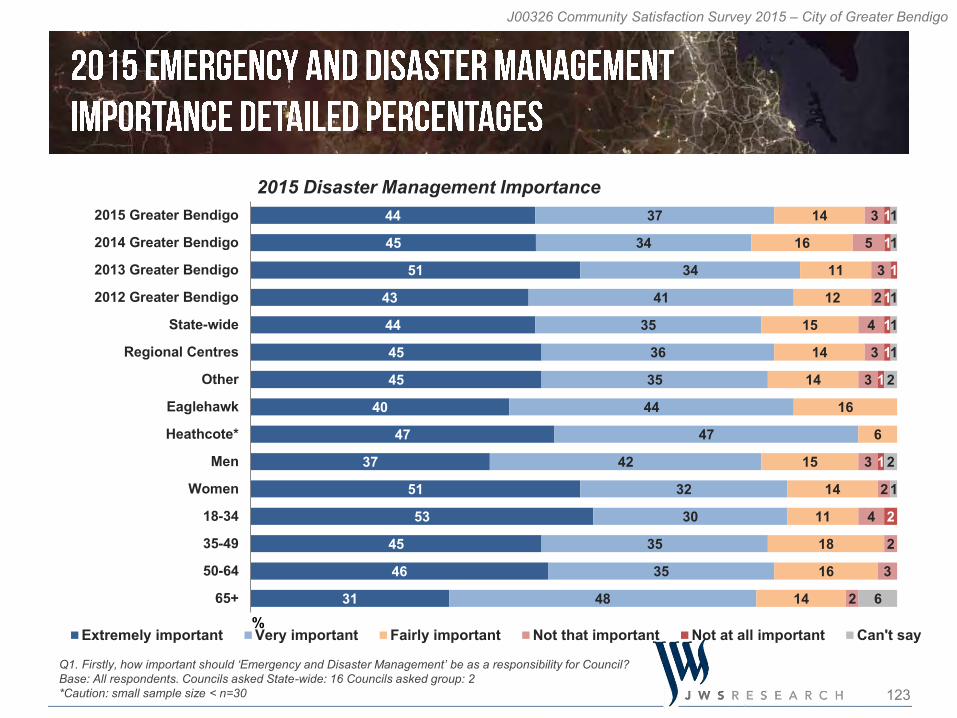
123
J00326 Community Satisfaction Survey 2015 – City of Greater Bendigo
44
45
51
43
44
45
45
40
47
37
51
53
45
46
31
37
34
34
41
35
36
35
44
47
42
32
30
35
35
48
14
16
11
12
15
14
14
16
6
15
14
11
18
16
14
3
5
3
2
4
3
3
3
2
4
2
3
2
1
1
1
1
1
1
1
1
2
1
1
1
1
1
2
2
1
6
2015 Greater Bendigo
2014 Greater Bendigo
2013 Greater Bendigo
2012 Greater Bendigo
State-wide
Regional Centres
Other
Eaglehawk
Heathcote*
Men
Women
18-34
35-49
50-64
65+%
Extremely important Very important Fairly important Not that important Not at all important Can't say
Q1. Firstly, how important should ‘Emergency and Disaster Management’ be as a responsibility for Council?Base: All respondents. Councils asked State-wide: 16 Councils asked group: 2*Caution: small sample size < n=30
2015 Disaster Management Importance
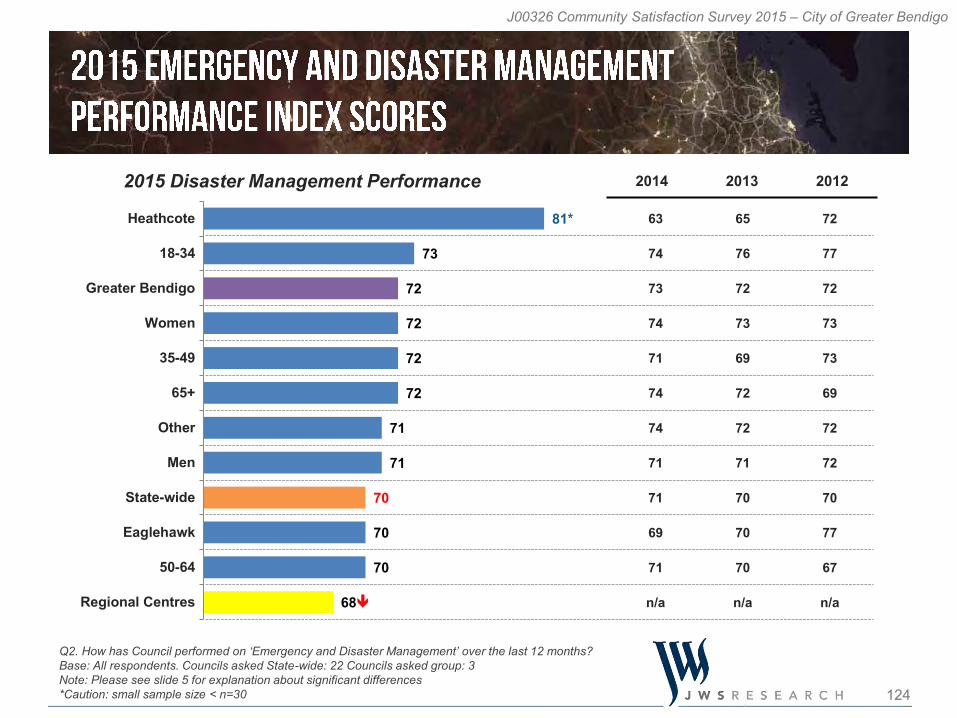
124
J00326 Community Satisfaction Survey 2015 – City of Greater Bendigo
63
74
73
74
71
74
74
71
71
69
71
n/a
65
76
72
73
69
72
72
71
70
70
70
n/a
72
77
72
73
73
69
72
72
70
77
67
n/a
81*
73
72
72
72
72
71
71
70
70
70
68
Heathcote
18-34
Greater Bendigo
Women
35-49
65+
Other
Men
State-wide
Eaglehawk
50-64
Regional Centres
Q2. How has Council performed on ‘Emergency and Disaster Management’ over the last 12 months?Base: All respondents. Councils asked State-wide: 22 Councils asked group: 3 Note: Please see slide 5 for explanation about significant differences*Caution: small sample size < n=30
2015 Disaster Management Performance 2014 2013 2012
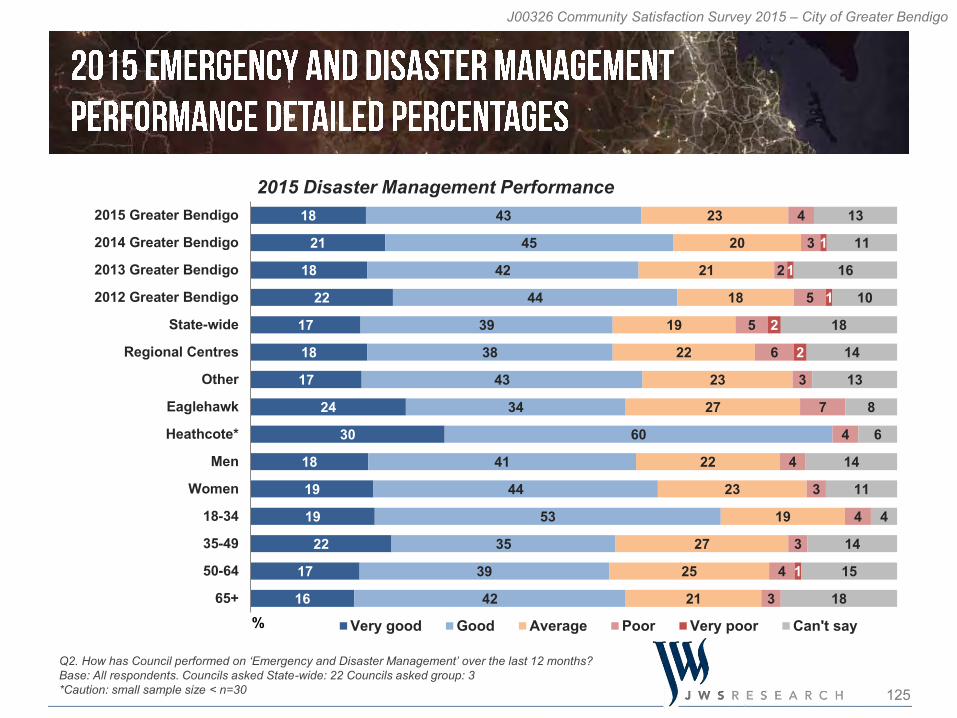
125
J00326 Community Satisfaction Survey 2015 – City of Greater Bendigo
18
21
18
22
17
18
17
24
30
18
19
19
22
17
16
43
45
42
44
39
38
43
34
60
41
44
53
35
39
42
23
20
21
18
19
22
23
27
22
23
19
27
25
21
4
3
2
5
5
6
3
7
4
4
3
4
3
4
3
1
1
1
2
2
1
13
11
16
10
18
14
13
8
6
14
11
4
14
15
18
2015 Greater Bendigo
2014 Greater Bendigo
2013 Greater Bendigo
2012 Greater Bendigo
State-wide
Regional Centres
Other
Eaglehawk
Heathcote*
Men
Women
18-34
35-49
50-64
65+% Very good Good Average Poor Very poor Can't say
Q2. How has Council performed on ‘Emergency and Disaster Management’ over the last 12 months?Base: All respondents. Councils asked State-wide: 22 Councils asked group: 3*Caution: small sample size < n=30
2015 Disaster Management Performance
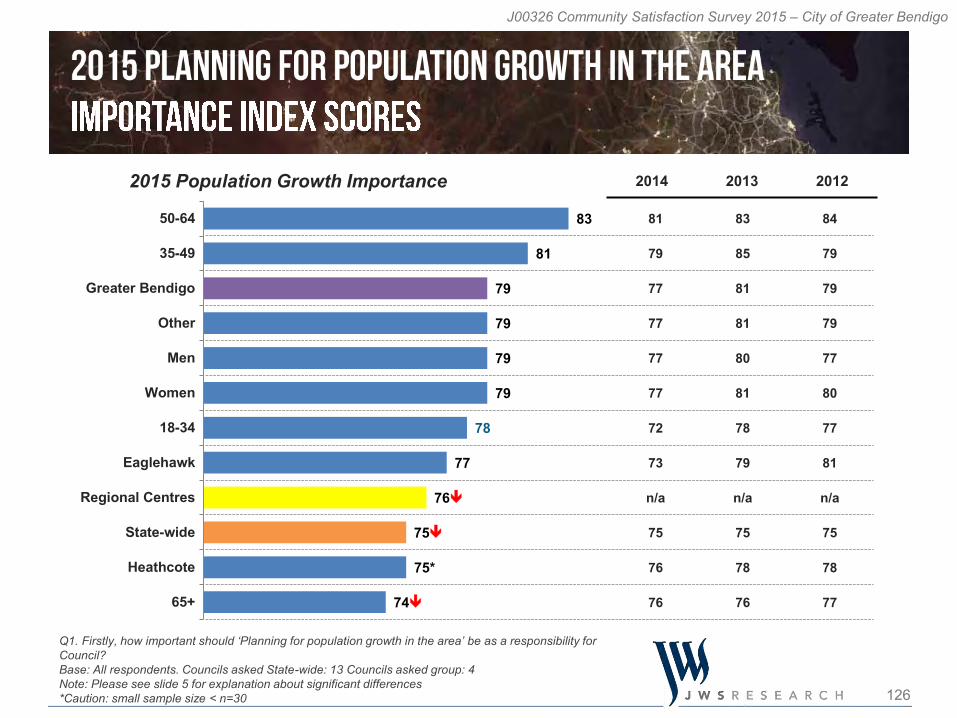
126
J00326 Community Satisfaction Survey 2015 – City of Greater Bendigo
81
79
77
77
77
77
72
73
n/a
75
76
76
83
85
81
81
80
81
78
79
n/a
75
78
76
84
79
79
79
77
80
77
81
n/a
75
78
77
83
81
79
79
79
79
78
77
76
75
75*
74
50-64
35-49
Greater Bendigo
Other
Men
Women
18-34
Eaglehawk
Regional Centres
State-wide
Heathcote
65+
Q1. Firstly, how important should ‘Planning for population growth in the area’ be as a responsibility for Council?Base: All respondents. Councils asked State-wide: 13 Councils asked group: 4 Note: Please see slide 5 for explanation about significant differences*Caution: small sample size < n=30
2014 2013 20122015 Population Growth Importance
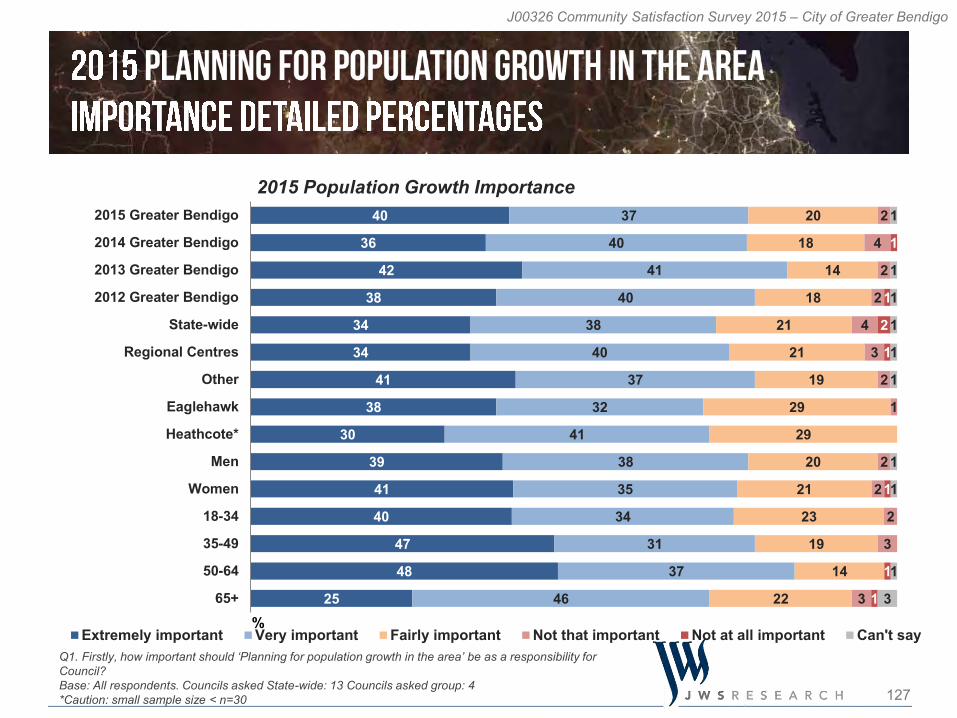
127
J00326 Community Satisfaction Survey 2015 – City of Greater Bendigo
40
36
42
38
34
34
41
38
30
39
41
40
47
48
25
37
40
41
40
38
40
37
32
41
38
35
34
31
37
46
20
18
14
18
21
21
19
29
29
20
21
23
19
14
22
2
4
2
2
4
3
2
1
2
2
2
3
3
1
1
2
1
1
1
1
1
1
1
1
1
1
1
1
1
3
2015 Greater Bendigo
2014 Greater Bendigo
2013 Greater Bendigo
2012 Greater Bendigo
State-wide
Regional Centres
Other
Eaglehawk
Heathcote*
Men
Women
18-34
35-49
50-64
65+%
Extremely important Very important Fairly important Not that important Not at all important Can't sayQ1. Firstly, how important should ‘Planning for population growth in the area’ be as a responsibility for Council?Base: All respondents. Councils asked State-wide: 13 Councils asked group: 4*Caution: small sample size < n=30
2015 Population Growth Importance
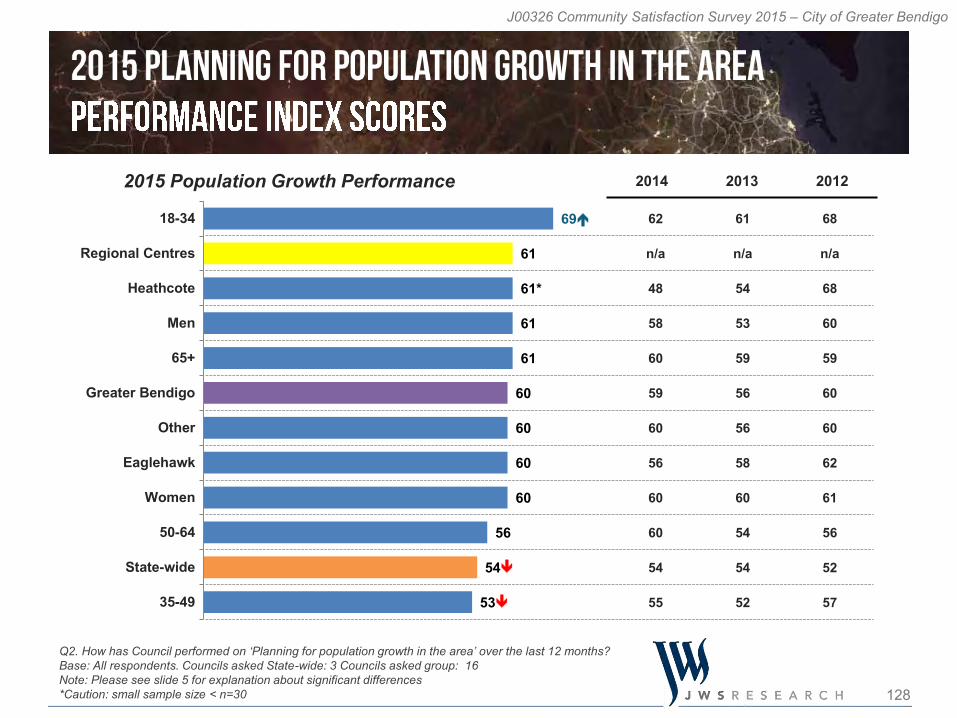
128
J00326 Community Satisfaction Survey 2015 – City of Greater Bendigo
62
n/a
48
58
60
59
60
56
60
60
54
55
61
n/a
54
53
59
56
56
58
60
54
54
52
68
n/a
68
60
59
60
60
62
61
56
52
57
69
61
61*
61
61
60
60
60
60
56
54
53
18-34
Regional Centres
Heathcote
Men
65+
Greater Bendigo
Other
Eaglehawk
Women
50-64
State-wide
35-49
Q2. How has Council performed on ‘Planning for population growth in the area’ over the last 12 months?Base: All respondents. Councils asked State-wide: 3 Councils asked group: 16Note: Please see slide 5 for explanation about significant differences*Caution: small sample size < n=30
2015 Population Growth Performance 2014 2013 2012
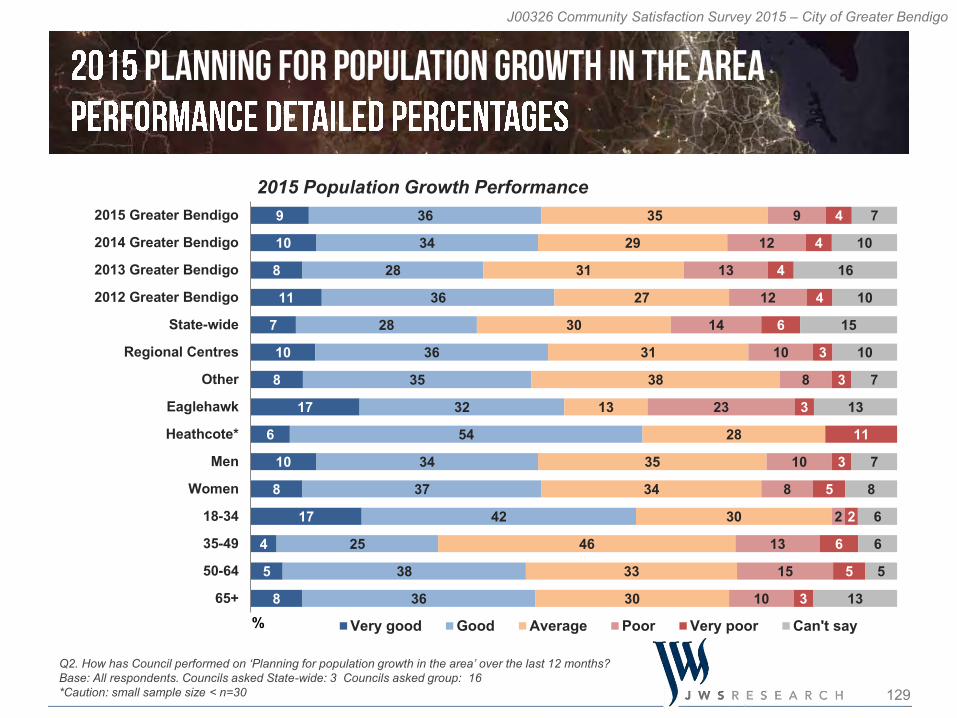
129
J00326 Community Satisfaction Survey 2015 – City of Greater Bendigo
9
10
8
11
7
10
8
17
6
10
8
17
4
5
8
36
34
28
36
28
36
35
32
54
34
37
42
25
38
36
35
29
31
27
30
31
38
13
28
35
34
30
46
33
30
9
12
13
12
14
10
8
23
10
8
2
13
15
10
4
4
4
4
6
3
3
3
11
3
5
2
6
5
3
7
10
16
10
15
10
7
13
7
8
6
6
5
13
2015 Greater Bendigo
2014 Greater Bendigo
2013 Greater Bendigo
2012 Greater Bendigo
State-wide
Regional Centres
Other
Eaglehawk
Heathcote*
Men
Women
18-34
35-49
50-64
65+% Very good Good Average Poor Very poor Can't say
Q2. How has Council performed on ‘Planning for population growth in the area’ over the last 12 months?Base: All respondents. Councils asked State-wide: 3 Councils asked group: 16*Caution: small sample size < n=30
2015 Population Growth Performance
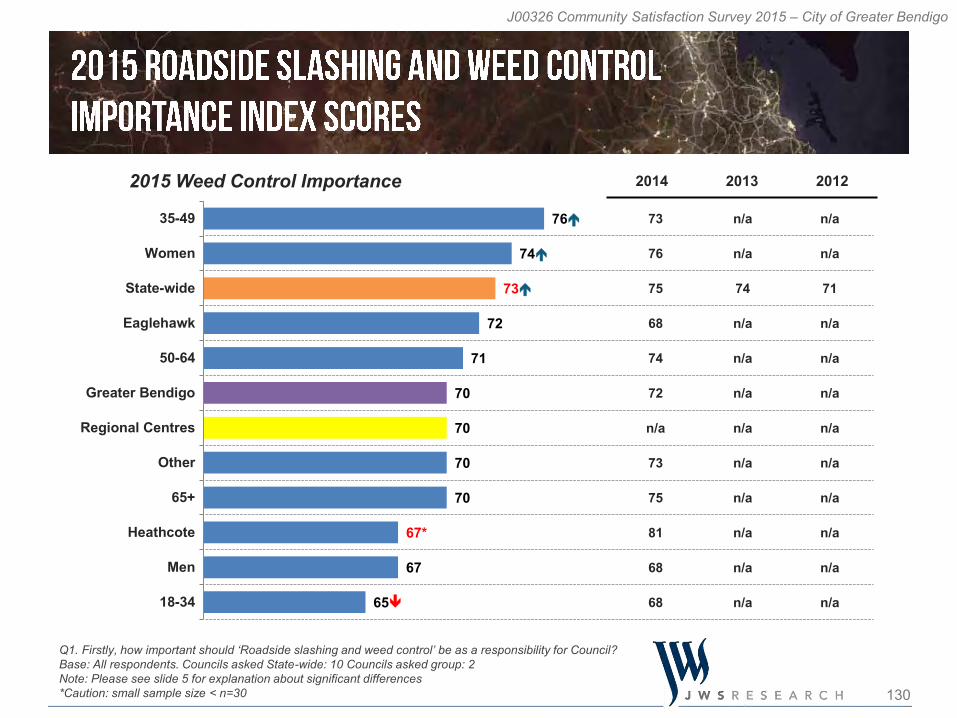
130
J00326 Community Satisfaction Survey 2015 – City of Greater Bendigo
73
76
75
68
74
72
n/a
73
75
81
68
68
n/a
n/a
74
n/a
n/a
n/a
n/a
n/a
n/a
n/a
n/a
n/a
n/a
n/a
71
n/a
n/a
n/a
n/a
n/a
n/a
n/a
n/a
n/a
76
74
73
72
71
70
70
70
70
67*
67
65
35-49
Women
State-wide
Eaglehawk
50-64
Greater Bendigo
Regional Centres
Other
65+
Heathcote
Men
18-34
Q1. Firstly, how important should ‘Roadside slashing and weed control’ be as a responsibility for Council?Base: All respondents. Councils asked State-wide: 10 Councils asked group: 2 Note: Please see slide 5 for explanation about significant differences*Caution: small sample size < n=30
2014 2013 20122015 Weed Control Importance
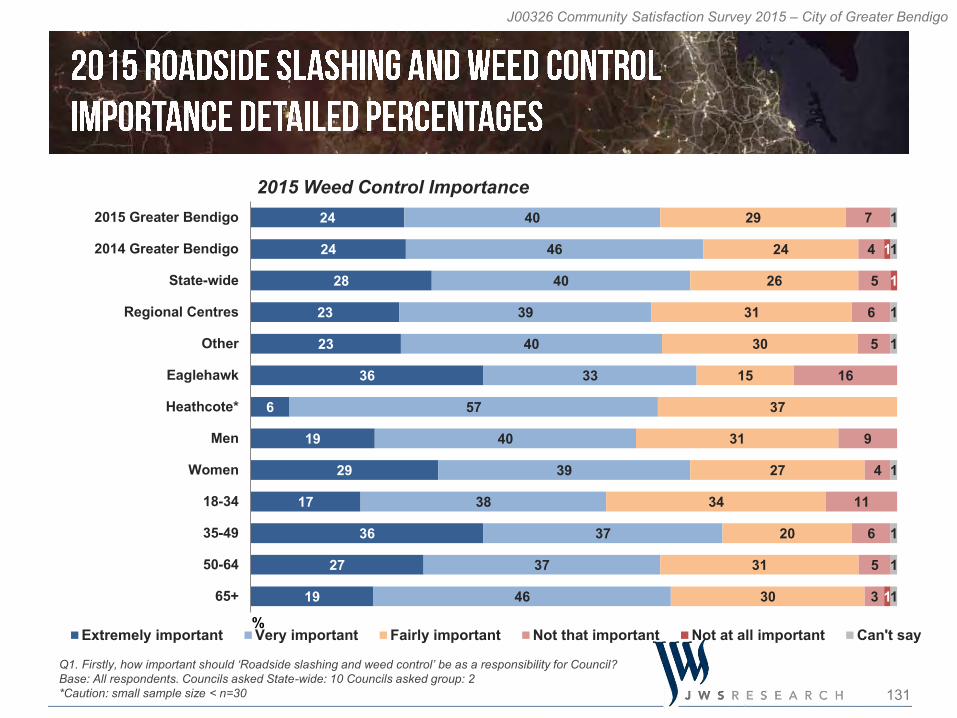
131
J00326 Community Satisfaction Survey 2015 – City of Greater Bendigo
24
24
28
23
23
36
6
19
29
17
36
27
19
40
46
40
39
40
33
57
40
39
38
37
37
46
29
24
26
31
30
15
37
31
27
34
20
31
30
7
4
5
6
5
16
9
4
11
6
5
3
1
1
1
1
1
1
1
1
1
1
1
2015 Greater Bendigo
2014 Greater Bendigo
State-wide
Regional Centres
Other
Eaglehawk
Heathcote*
Men
Women
18-34
35-49
50-64
65+
%Extremely important Very important Fairly important Not that important Not at all important Can't say
Q1. Firstly, how important should ‘Roadside slashing and weed control’ be as a responsibility for Council?Base: All respondents. Councils asked State-wide: 10 Councils asked group: 2*Caution: small sample size < n=30
2015 Weed Control Importance
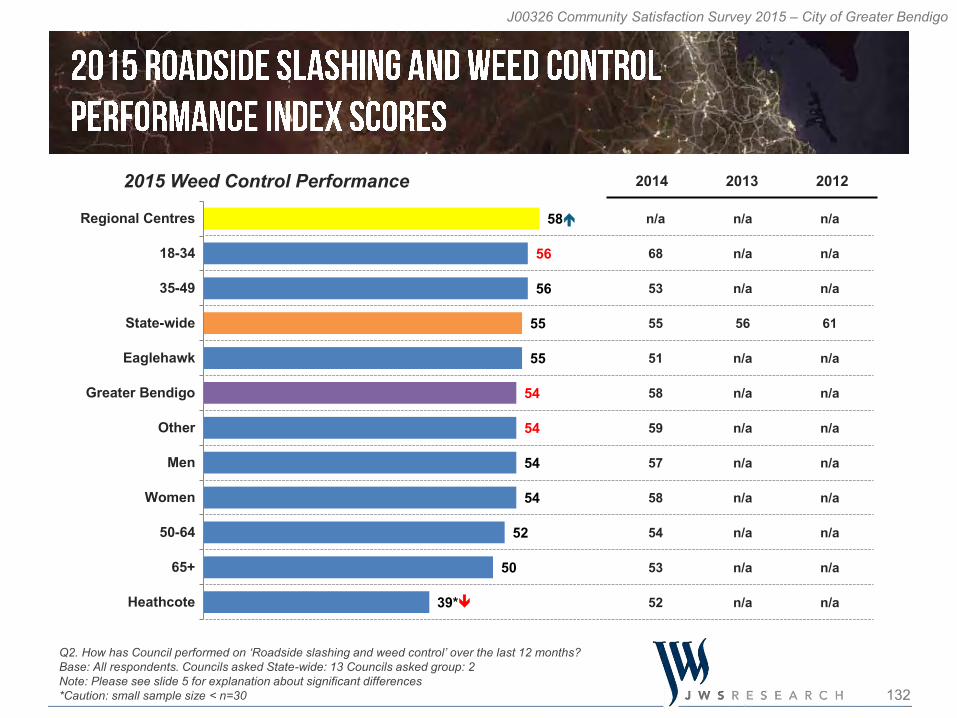
132
J00326 Community Satisfaction Survey 2015 – City of Greater Bendigo
n/a
68
53
55
51
58
59
57
58
54
53
52
n/a
n/a
n/a
56
n/a
n/a
n/a
n/a
n/a
n/a
n/a
n/a
n/a
n/a
n/a
61
n/a
n/a
n/a
n/a
n/a
n/a
n/a
n/a
58
56
56
55
55
54
54
54
54
52
50
39*
Regional Centres
18-34
35-49
State-wide
Eaglehawk
Greater Bendigo
Other
Men
Women
50-64
65+
Heathcote
Q2. How has Council performed on ‘Roadside slashing and weed control’ over the last 12 months?Base: All respondents. Councils asked State-wide: 13 Councils asked group: 2 Note: Please see slide 5 for explanation about significant differences*Caution: small sample size < n=30
2015 Weed Control Performance 2014 2013 2012
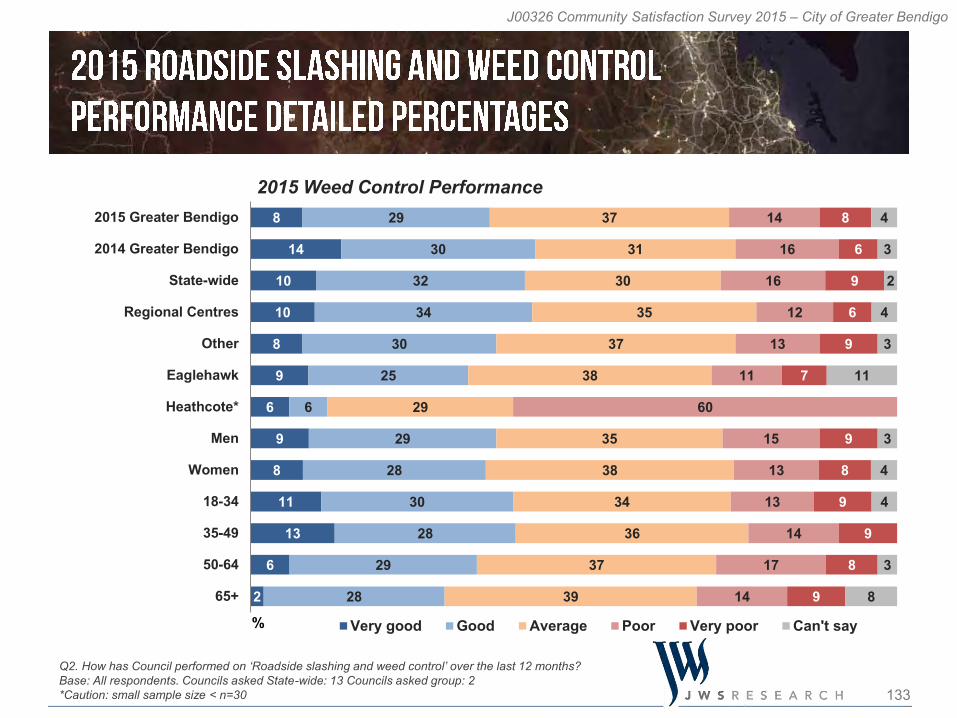
133
J00326 Community Satisfaction Survey 2015 – City of Greater Bendigo
8
14
10
10
8
9
6
9
8
11
13
6
2
29
30
32
34
30
25
6
29
28
30
28
29
28
37
31
30
35
37
38
29
35
38
34
36
37
39
14
16
16
12
13
11
60
15
13
13
14
17
14
8
6
9
6
9
7
9
8
9
9
8
9
4
3
2
4
3
11
3
4
4
3
8
2015 Greater Bendigo
2014 Greater Bendigo
State-wide
Regional Centres
Other
Eaglehawk
Heathcote*
Men
Women
18-34
35-49
50-64
65+
% Very good Good Average Poor Very poor Can't say
Q2. How has Council performed on ‘Roadside slashing and weed control’ over the last 12 months?Base: All respondents. Councils asked State-wide: 13 Councils asked group: 2*Caution: small sample size < n=30
2015 Weed Control Performance
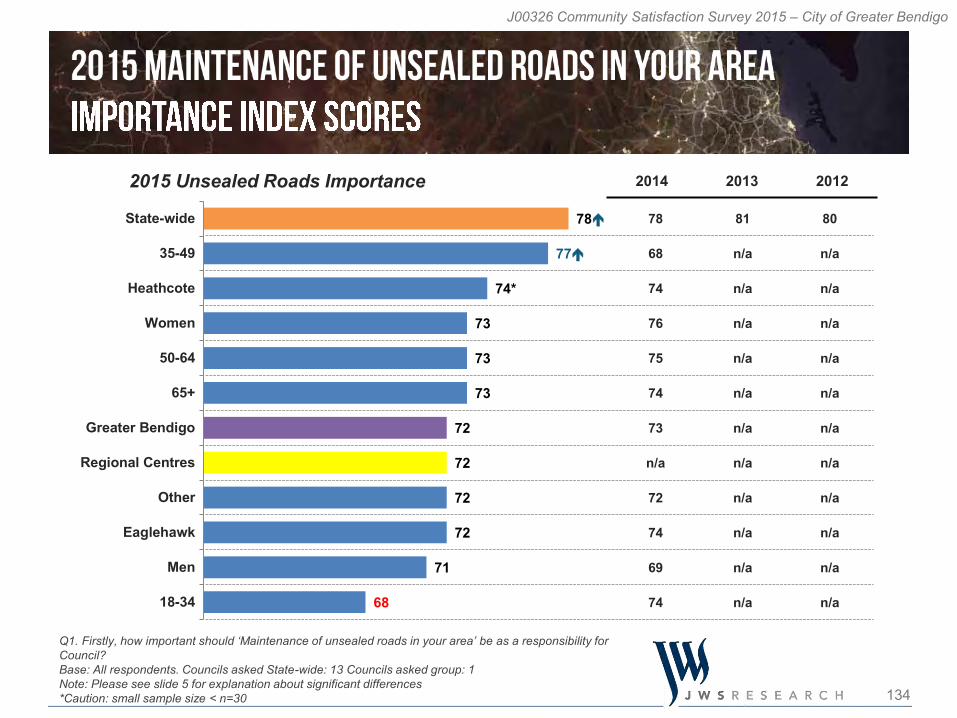
134
J00326 Community Satisfaction Survey 2015 – City of Greater Bendigo
78
68
74
76
75
74
73
n/a
72
74
69
74
81
n/a
n/a
n/a
n/a
n/a
n/a
n/a
n/a
n/a
n/a
n/a
80
n/a
n/a
n/a
n/a
n/a
n/a
n/a
n/a
n/a
n/a
n/a
78
77
74*
73
73
73
72
72
72
72
71
68
State-wide
35-49
Heathcote
Women
50-64
65+
Greater Bendigo
Regional Centres
Other
Eaglehawk
Men
18-34
Q1. Firstly, how important should ‘Maintenance of unsealed roads in your area’ be as a responsibility for Council?Base: All respondents. Councils asked State-wide: 13 Councils asked group: 1 Note: Please see slide 5 for explanation about significant differences*Caution: small sample size < n=30
2014 2013 20122015 Unsealed Roads Importance
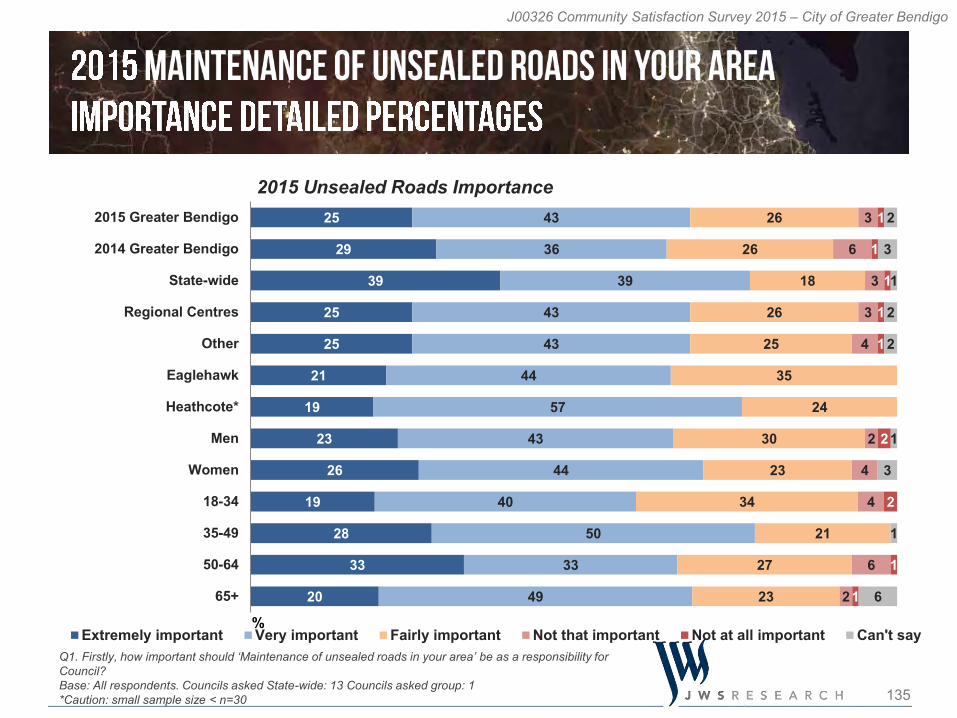
135
J00326 Community Satisfaction Survey 2015 – City of Greater Bendigo
25
29
39
25
25
21
19
23
26
19
28
33
20
43
36
39
43
43
44
57
43
44
40
50
33
49
26
26
18
26
25
35
24
30
23
34
21
27
23
3
6
3
3
4
2
4
4
6
2
1
1
1
1
1
2
2
1
1
2
3
1
2
2
1
3
1
6
2015 Greater Bendigo
2014 Greater Bendigo
State-wide
Regional Centres
Other
Eaglehawk
Heathcote*
Men
Women
18-34
35-49
50-64
65+
%Extremely important Very important Fairly important Not that important Not at all important Can't say
Q1. Firstly, how important should ‘Maintenance of unsealed roads in your area’ be as a responsibility for Council?Base: All respondents. Councils asked State-wide: 13 Councils asked group: 1*Caution: small sample size < n=30
2015 Unsealed Roads Importance
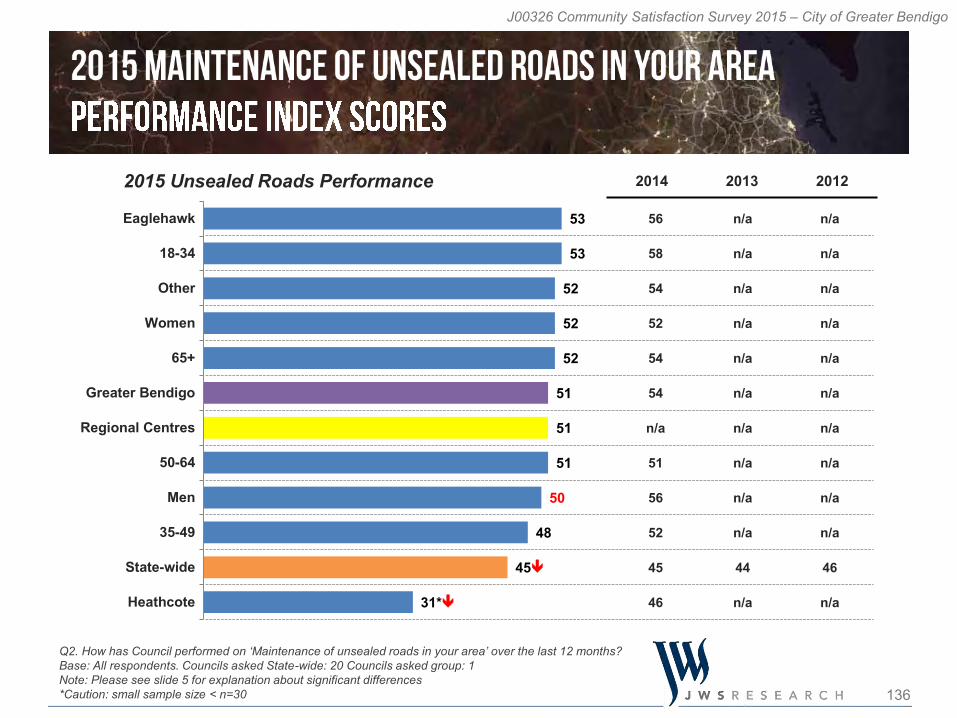
136
J00326 Community Satisfaction Survey 2015 – City of Greater Bendigo
56
58
54
52
54
54
n/a
51
56
52
45
46
n/a
n/a
n/a
n/a
n/a
n/a
n/a
n/a
n/a
n/a
44
n/a
n/a
n/a
n/a
n/a
n/a
n/a
n/a
n/a
n/a
n/a
46
n/a
53
53
52
52
52
51
51
51
50
48
45
31*
Eaglehawk
18-34
Other
Women
65+
Greater Bendigo
Regional Centres
50-64
Men
35-49
State-wide
Heathcote
Q2. How has Council performed on ‘Maintenance of unsealed roads in your area’ over the last 12 months?Base: All respondents. Councils asked State-wide: 20 Councils asked group: 1 Note: Please see slide 5 for explanation about significant differences*Caution: small sample size < n=30
2015 Unsealed Roads Performance 2014 2013 2012
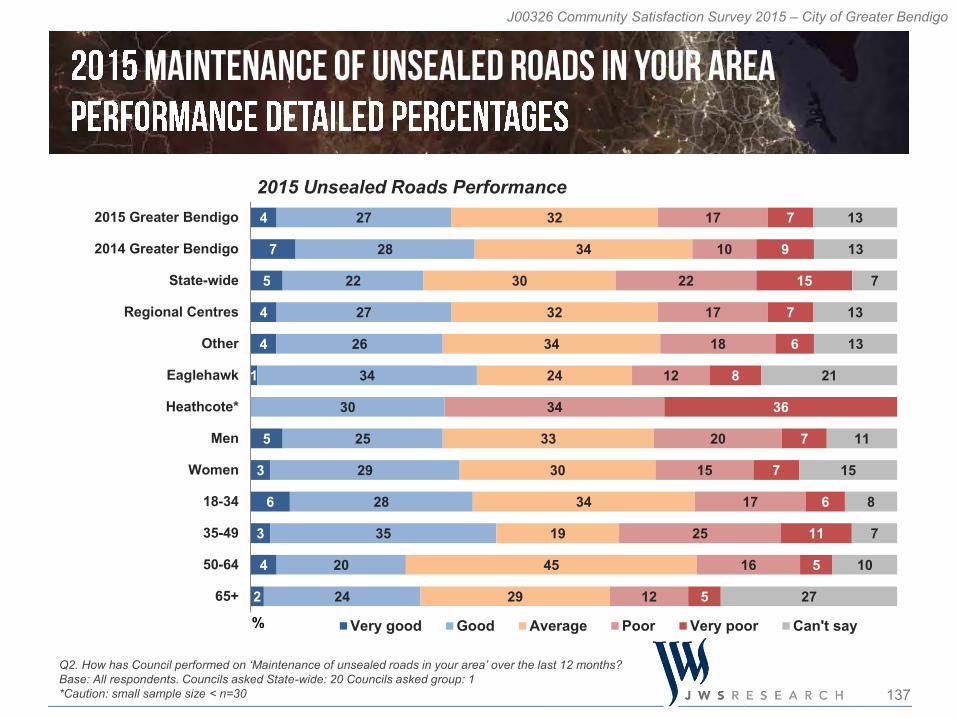
137
J00326 Community Satisfaction Survey 2015 – City of Greater Bendigo
4
7
5
4
4
1
5
3
6
3
4
2
27
28
22
27
26
34
30
25
29
28
35
20
24
32
34
30
32
34
24
33
30
34
19
45
29
17
10
22
17
18
12
34
20
15
17
25
16
12
7
9
15
7
6
8
36
7
7
6
11
5
5
13
13
7
13
13
21
11
15
8
7
10
27
2015 Greater Bendigo
2014 Greater Bendigo
State-wide
Regional Centres
Other
Eaglehawk
Heathcote*
Men
Women
18-34
35-49
50-64
65+
% Very good Good Average Poor Very poor Can't say
Q2. How has Council performed on ‘Maintenance of unsealed roads in your area’ over the last 12 months?Base: All respondents. Councils asked State-wide: 20 Councils asked group: 1*Caution: small sample size < n=30
2015 Unsealed Roads Performance
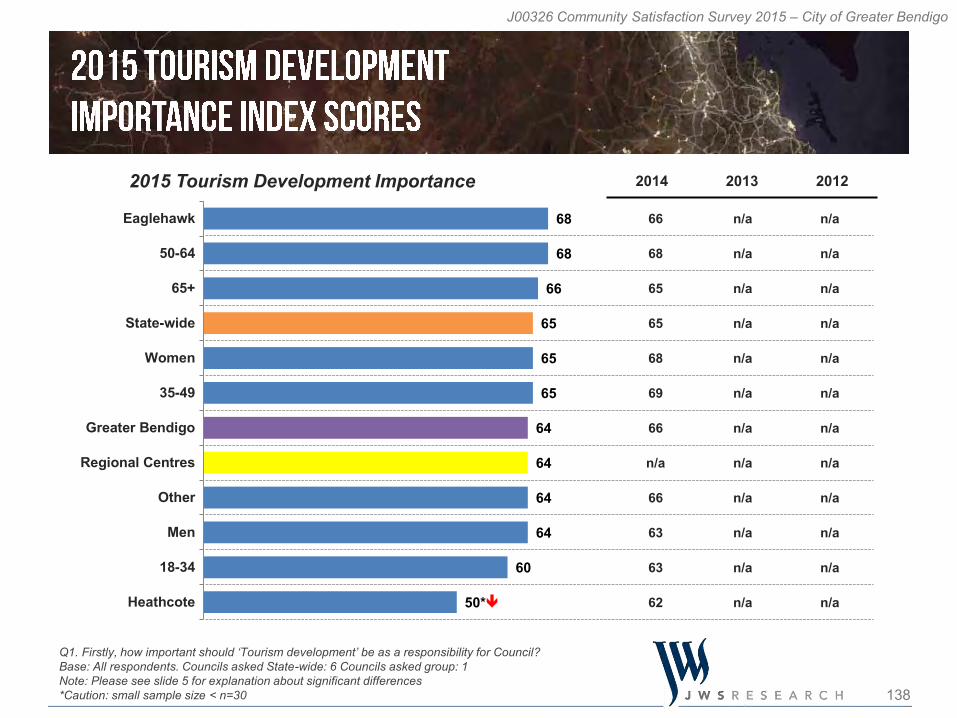
138
J00326 Community Satisfaction Survey 2015 – City of Greater Bendigo
66
68
65
65
68
69
66
n/a
66
63
63
62
n/a
n/a
n/a
n/a
n/a
n/a
n/a
n/a
n/a
n/a
n/a
n/a
n/a
n/a
n/a
n/a
n/a
n/a
n/a
n/a
n/a
n/a
n/a
n/a
68
68
66
65
65
65
64
64
64
64
60
50*
Eaglehawk
50-64
65+
State-wide
Women
35-49
Greater Bendigo
Regional Centres
Other
Men
18-34
Heathcote
Q1. Firstly, how important should ‘Tourism development’ be as a responsibility for Council?Base: All respondents. Councils asked State-wide: 6 Councils asked group: 1 Note: Please see slide 5 for explanation about significant differences*Caution: small sample size < n=30
2014 2013 20122015 Tourism Development Importance
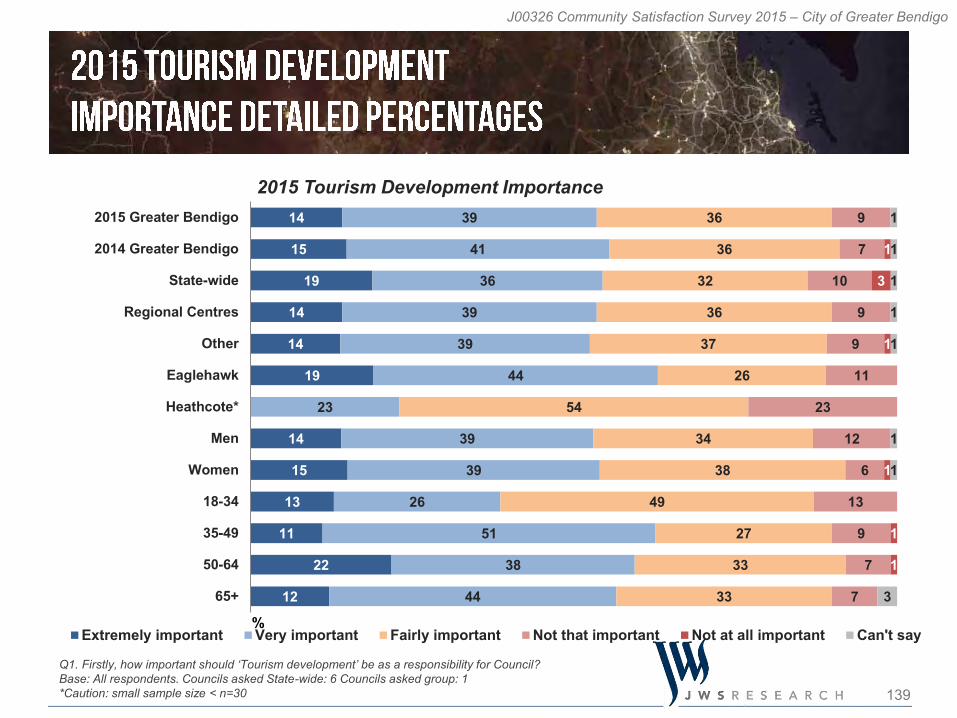
139
J00326 Community Satisfaction Survey 2015 – City of Greater Bendigo
14
15
19
14
14
19
14
15
13
11
22
12
39
41
36
39
39
44
23
39
39
26
51
38
44
36
36
32
36
37
26
54
34
38
49
27
33
33
9
7
10
9
9
11
23
12
6
13
9
7
7
1
3
1
1
1
1
1
1
1
1
1
1
1
3
2015 Greater Bendigo
2014 Greater Bendigo
State-wide
Regional Centres
Other
Eaglehawk
Heathcote*
Men
Women
18-34
35-49
50-64
65+
%Extremely important Very important Fairly important Not that important Not at all important Can't say
Q1. Firstly, how important should ‘Tourism development’ be as a responsibility for Council?Base: All respondents. Councils asked State-wide: 6 Councils asked group: 1*Caution: small sample size < n=30
2015 Tourism Development Importance
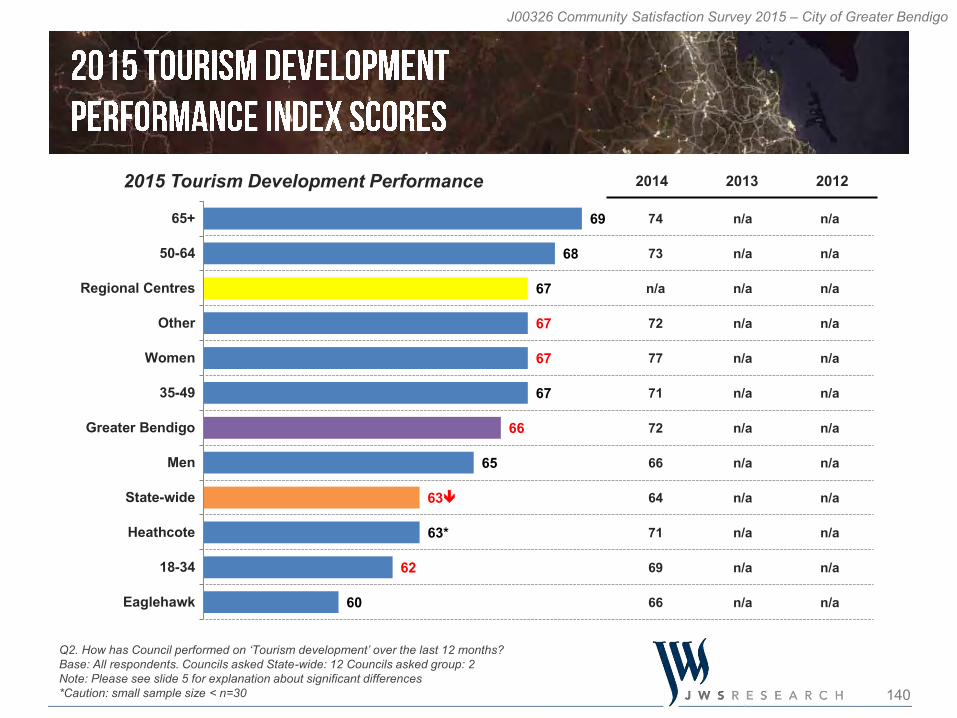
140
J00326 Community Satisfaction Survey 2015 – City of Greater Bendigo
74
73
n/a
72
77
71
72
66
64
71
69
66
n/a
n/a
n/a
n/a
n/a
n/a
n/a
n/a
n/a
n/a
n/a
n/a
n/a
n/a
n/a
n/a
n/a
n/a
n/a
n/a
n/a
n/a
n/a
n/a
69
68
67
67
67
67
66
65
63
63*
62
60
65+
50-64
Regional Centres
Other
Women
35-49
Greater Bendigo
Men
State-wide
Heathcote
18-34
Eaglehawk
Q2. How has Council performed on ‘Tourism development’ over the last 12 months?Base: All respondents. Councils asked State-wide: 12 Councils asked group: 2 Note: Please see slide 5 for explanation about significant differences*Caution: small sample size < n=30
2015 Tourism Development Performance 2014 2013 2012
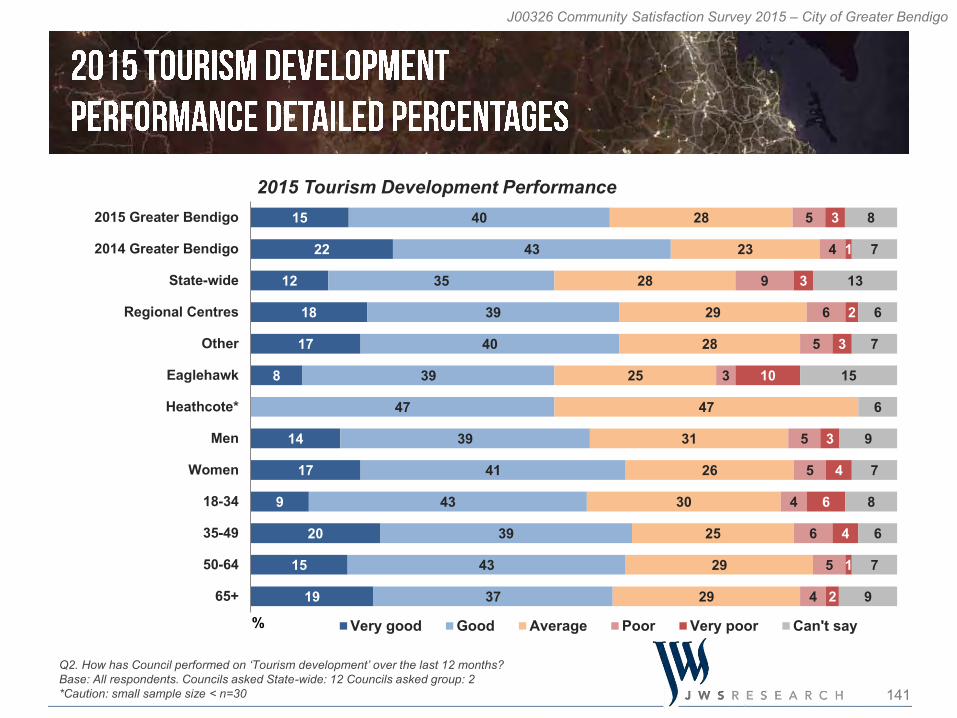
141
J00326 Community Satisfaction Survey 2015 – City of Greater Bendigo
15
22
12
18
17
8
14
17
9
20
15
19
40
43
35
39
40
39
47
39
41
43
39
43
37
28
23
28
29
28
25
47
31
26
30
25
29
29
5
4
9
6
5
3
5
5
4
6
5
4
3
1
3
2
3
10
3
4
6
4
1
2
8
7
13
6
7
15
6
9
7
8
6
7
9
2015 Greater Bendigo
2014 Greater Bendigo
State-wide
Regional Centres
Other
Eaglehawk
Heathcote*
Men
Women
18-34
35-49
50-64
65+
% Very good Good Average Poor Very poor Can't say
Q2. How has Council performed on ‘Tourism development’ over the last 12 months?Base: All respondents. Councils asked State-wide: 12 Councils asked group: 2*Caution: small sample size < n=30
2015 Tourism Development Performance
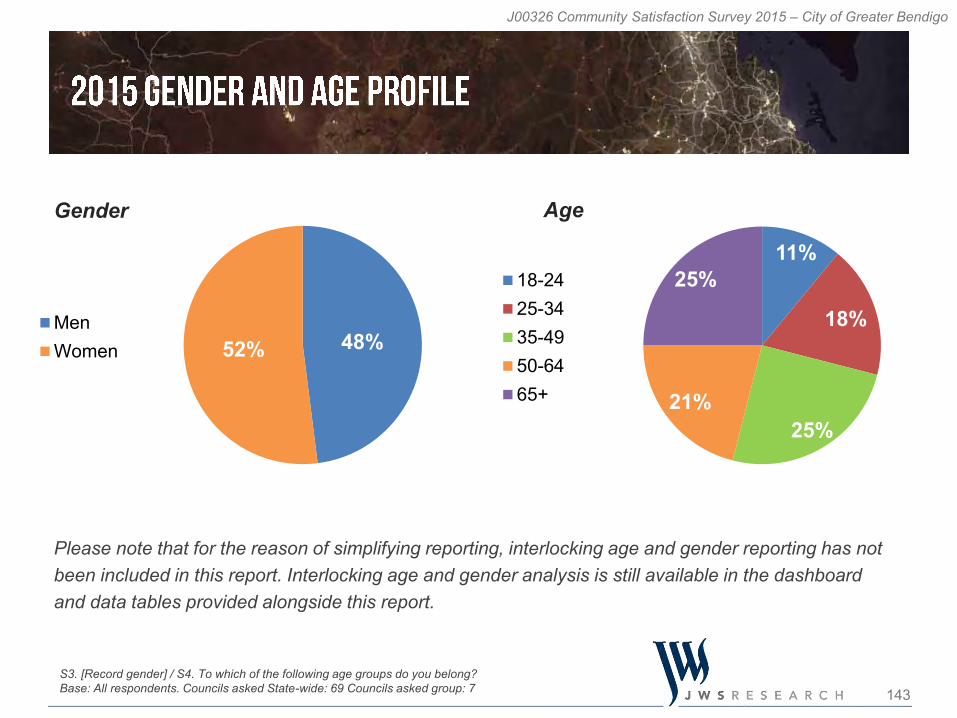
143
J00326 Community Satisfaction Survey 2015 – City of Greater Bendigo
48%52%MenWomen
11%
18%
25%21%
25%18-2425-3435-4950-6465+
Please note that for the reason of simplifying reporting, interlocking age and gender reporting has not been included in this report. Interlocking age and gender analysis is still available in the dashboard and data tables provided alongside this report.
S3. [Record gender] / S4. To which of the following age groups do you belong?Base: All respondents. Councils asked State-wide: 69 Councils asked group: 7
Gender Age


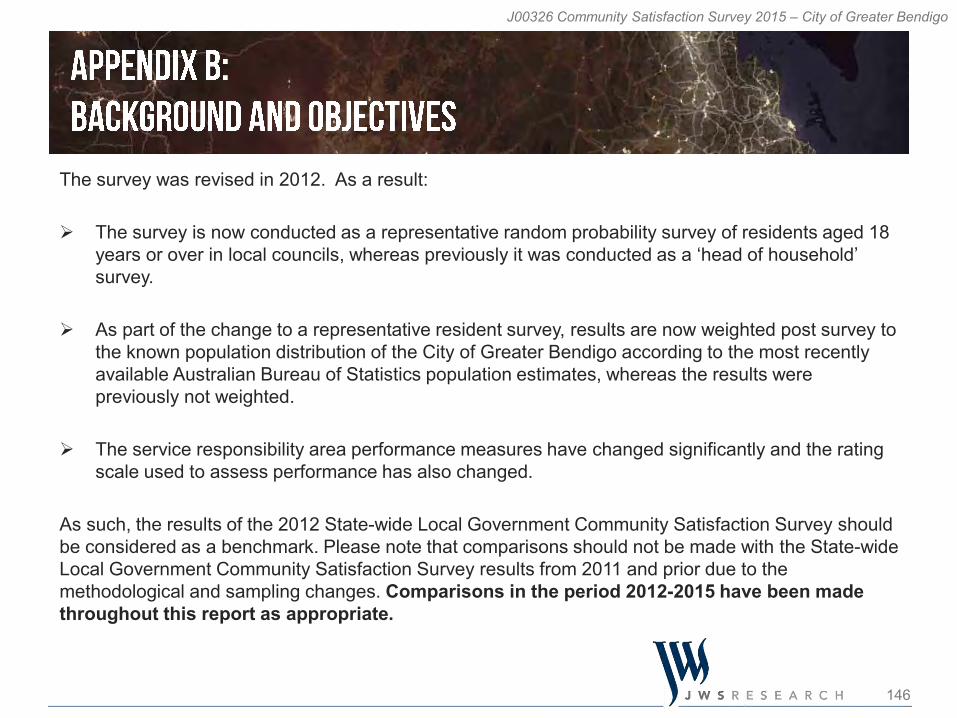
146
J00326 Community Satisfaction Survey 2015 – City of Greater Bendigo
The survey was revised in 2012. As a result:
The survey is now conducted as a representative random probability survey of residents aged 18 years or over in local councils, whereas previously it was conducted as a ‘head of household’ survey.
As part of the change to a representative resident survey, results are now weighted post survey to the known population distribution of the City of Greater Bendigo according to the most recently available Australian Bureau of Statistics population estimates, whereas the results were previously not weighted.
The service responsibility area performance measures have changed significantly and the rating scale used to assess performance has also changed.
As such, the results of the 2012 State-wide Local Government Community Satisfaction Survey should be considered as a benchmark. Please note that comparisons should not be made with the State-wide Local Government Community Satisfaction Survey results from 2011 and prior due to the methodological and sampling changes. Comparisons in the period 2012-2015 have been made throughout this report as appropriate.
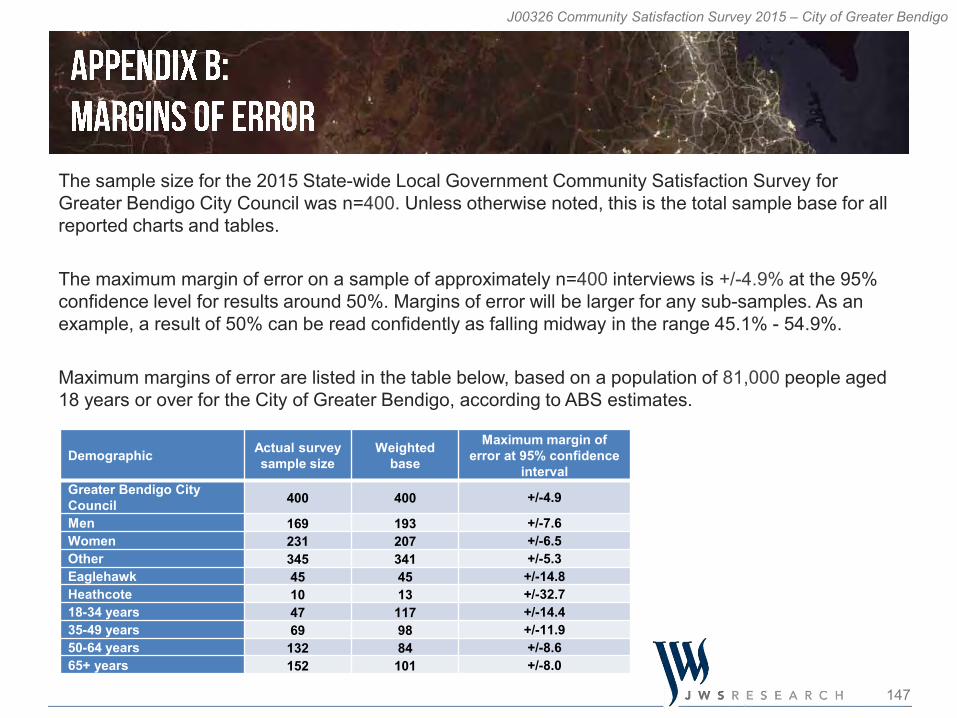
147
J00326 Community Satisfaction Survey 2015 – City of Greater Bendigo
Demographic Actual survey sample size
Weighted base
Maximum margin of error at 95% confidence
intervalGreater Bendigo City Council 400 400 +/-4.9
Men 169 193 +/-7.6Women 231 207 +/-6.5Other 345 341 +/-5.3Eaglehawk 45 45 +/-14.8Heathcote 10 13 +/-32.718-34 years 47 117 +/-14.435-49 years 69 98 +/-11.950-64 years 132 84 +/-8.665+ years 152 101 +/-8.0
The sample size for the 2015 State-wide Local Government Community Satisfaction Survey for Greater Bendigo City Council was n=400. Unless otherwise noted, this is the total sample base for all reported charts and tables.
The maximum margin of error on a sample of approximately n=400 interviews is +/-4.9% at the 95% confidence level for results around 50%. Margins of error will be larger for any sub-samples. As an example, a result of 50% can be read confidently as falling midway in the range 45.1% - 54.9%.
Maximum margins of error are listed in the table below, based on a population of 81,000 people aged 18 years or over for the City of Greater Bendigo, according to ABS estimates.
148
J00326 Community Satisfaction Survey 2015 – City of Greater Bendigo
All participating councils are listed in the State-wide report published on the DELWP website. In 2015, 69 of the 79 Councils throughout Victoria participated in this survey. For consistency of analysis and reporting across all projects, Local Government Victoria has aligned its presentation of data to use standard council groupings. Accordingly, the council reports for the community satisfaction survey provide analysis using these standard council groupings. Please note that councils participating in 2012, 2013 and 2014 vary slightly to those participating in 2015.
Council GroupsCity of Greater Bendigo is classified as a Regional Centres council according to the following classification list:
Metropolitan, Interface, Regional Centres, Large Rural & Small Rural
Councils participating in the Regional Centres group are: Ballarat, Greater Bendigo, Greater Geelong, Greater Shepparton, Latrobe, Mildura and Warrnambool.
Wherever appropriate, results for the City of Greater Bendigo for this 2015 State-wide Local Government Community Satisfaction Survey have been compared against other participating councils in the Regional Centres group and on a State-wide basis. Please note however, that council groupings have changed for 2015. As such, comparisons to previous council group results can not be made within the reported charts. For comparisons with previous groupings, please contact JWS Research.
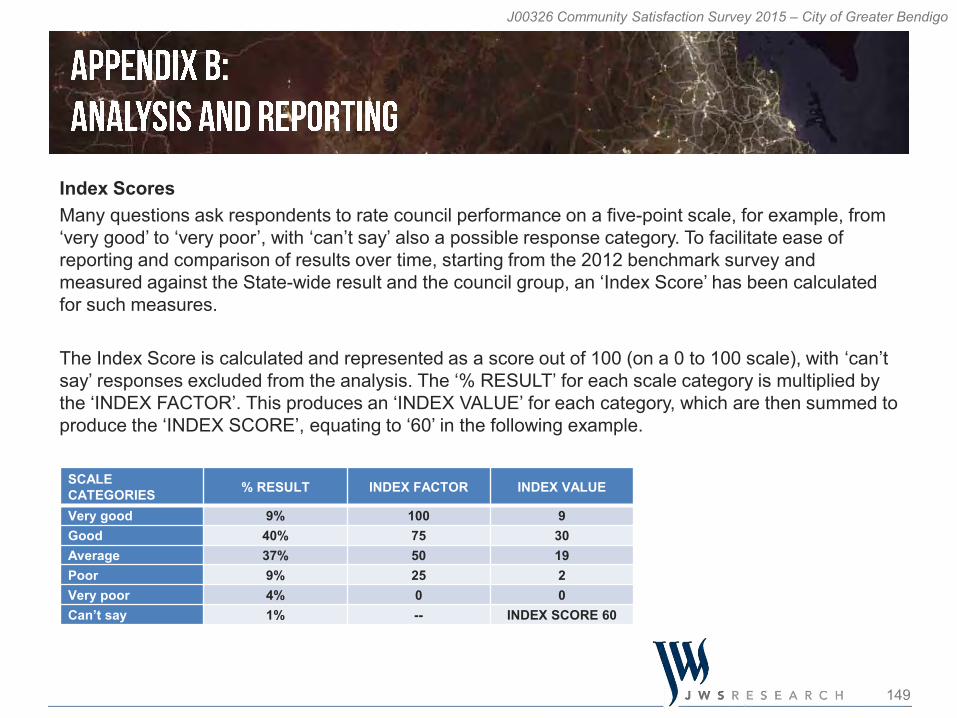
149
J00326 Community Satisfaction Survey 2015 – City of Greater Bendigo
Index ScoresMany questions ask respondents to rate council performance on a five-point scale, for example, from ‘very good’ to ‘very poor’, with ‘can’t say’ also a possible response category. To facilitate ease of reporting and comparison of results over time, starting from the 2012 benchmark survey and measured against the State-wide result and the council group, an ‘Index Score’ has been calculated for such measures.
The Index Score is calculated and represented as a score out of 100 (on a 0 to 100 scale), with ‘can’t say’ responses excluded from the analysis. The ‘% RESULT’ for each scale category is multiplied by the ‘INDEX FACTOR’. This produces an ‘INDEX VALUE’ for each category, which are then summed to produce the ‘INDEX SCORE’, equating to ‘60’ in the following example.
SCALE CATEGORIES % RESULT INDEX FACTOR INDEX VALUE
Very good 9% 100 9Good 40% 75 30Average 37% 50 19Poor 9% 25 2Very poor 4% 0 0Can’t say 1% -- INDEX SCORE 60
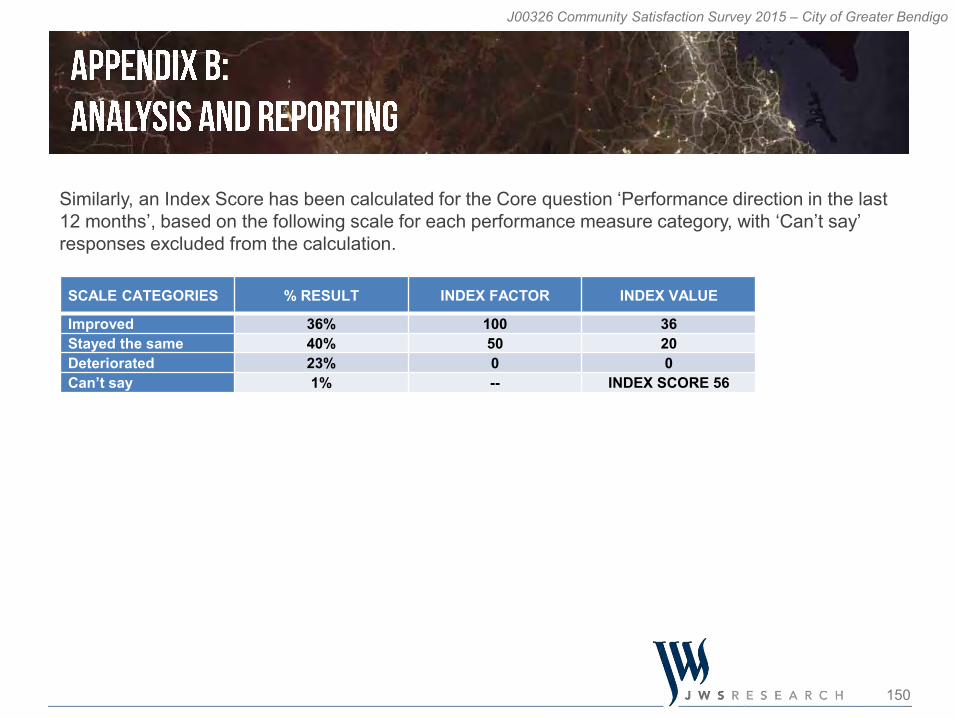
150
J00326 Community Satisfaction Survey 2015 – City of Greater Bendigo
Similarly, an Index Score has been calculated for the Core question ‘Performance direction in the last 12 months’, based on the following scale for each performance measure category, with ‘Can’t say’ responses excluded from the calculation.
SCALE CATEGORIES % RESULT INDEX FACTOR INDEX VALUE
Improved 36% 100 36Stayed the same 40% 50 20Deteriorated 23% 0 0Can’t say 1% -- INDEX SCORE 56
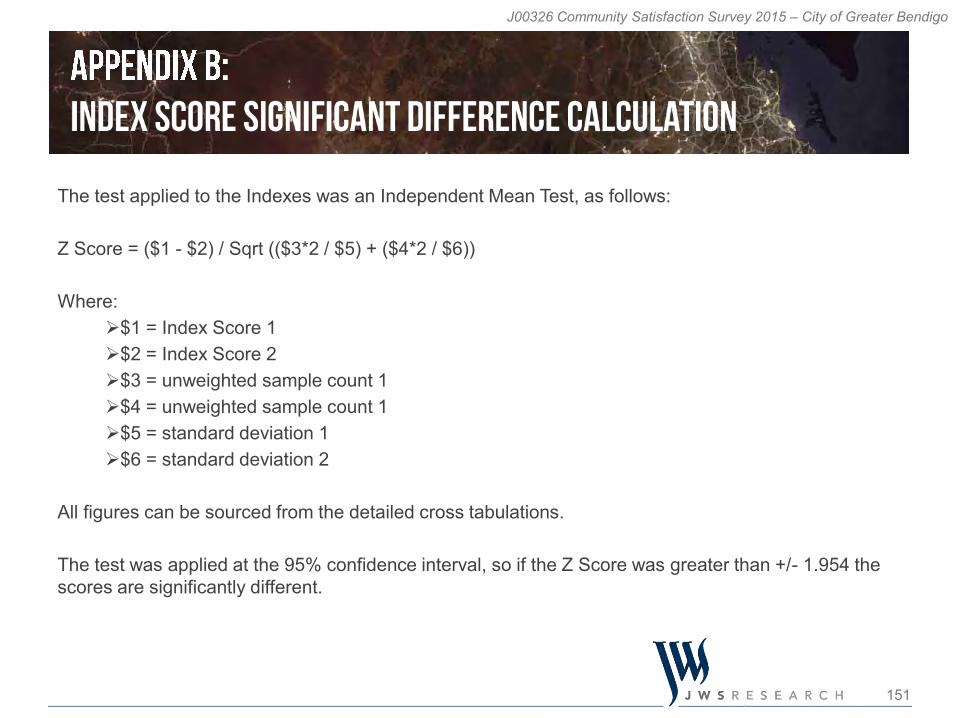
151
J00326 Community Satisfaction Survey 2015 – City of Greater Bendigo
The test applied to the Indexes was an Independent Mean Test, as follows:
Z Score = ($1 - $2) / Sqrt (($3*2 / $5) + ($4*2 / $6))
Where:$1 = Index Score 1$2 = Index Score 2$3 = unweighted sample count 1$4 = unweighted sample count 1$5 = standard deviation 1$6 = standard deviation 2
All figures can be sourced from the detailed cross tabulations.
The test was applied at the 95% confidence interval, so if the Z Score was greater than +/- 1.954 the scores are significantly different.
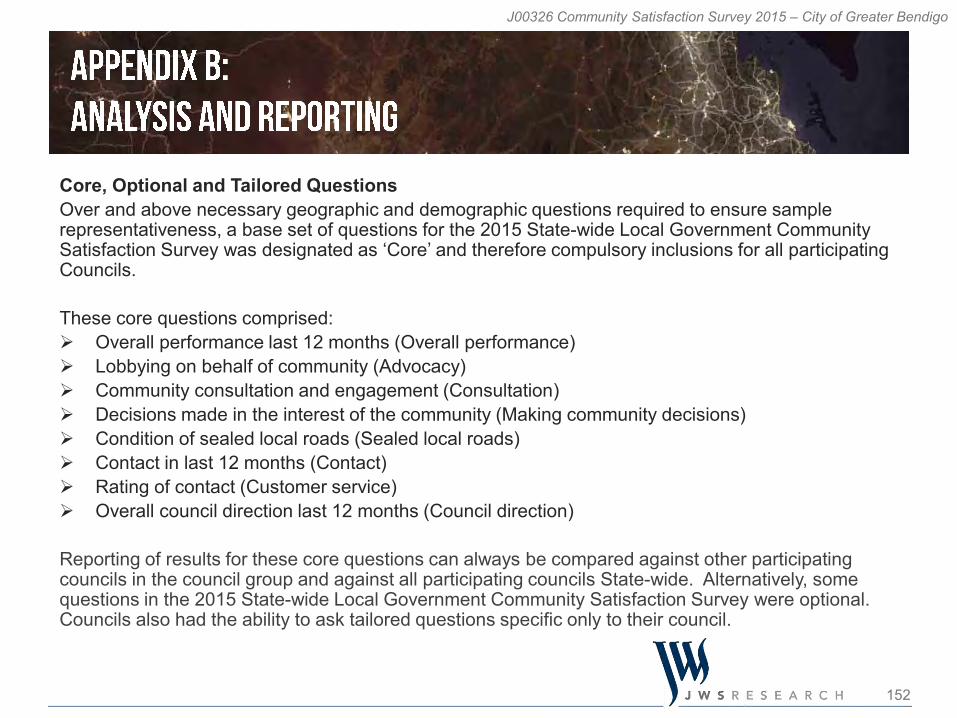
152
J00326 Community Satisfaction Survey 2015 – City of Greater Bendigo
Core, Optional and Tailored QuestionsOver and above necessary geographic and demographic questions required to ensure sample representativeness, a base set of questions for the 2015 State-wide Local Government Community Satisfaction Survey was designated as ‘Core’ and therefore compulsory inclusions for all participating Councils.
These core questions comprised: Overall performance last 12 months (Overall performance) Lobbying on behalf of community (Advocacy) Community consultation and engagement (Consultation) Decisions made in the interest of the community (Making community decisions) Condition of sealed local roads (Sealed local roads) Contact in last 12 months (Contact) Rating of contact (Customer service) Overall council direction last 12 months (Council direction)
Reporting of results for these core questions can always be compared against other participating councils in the council group and against all participating councils State-wide. Alternatively, some questions in the 2015 State-wide Local Government Community Satisfaction Survey were optional. Councils also had the ability to ask tailored questions specific only to their council.
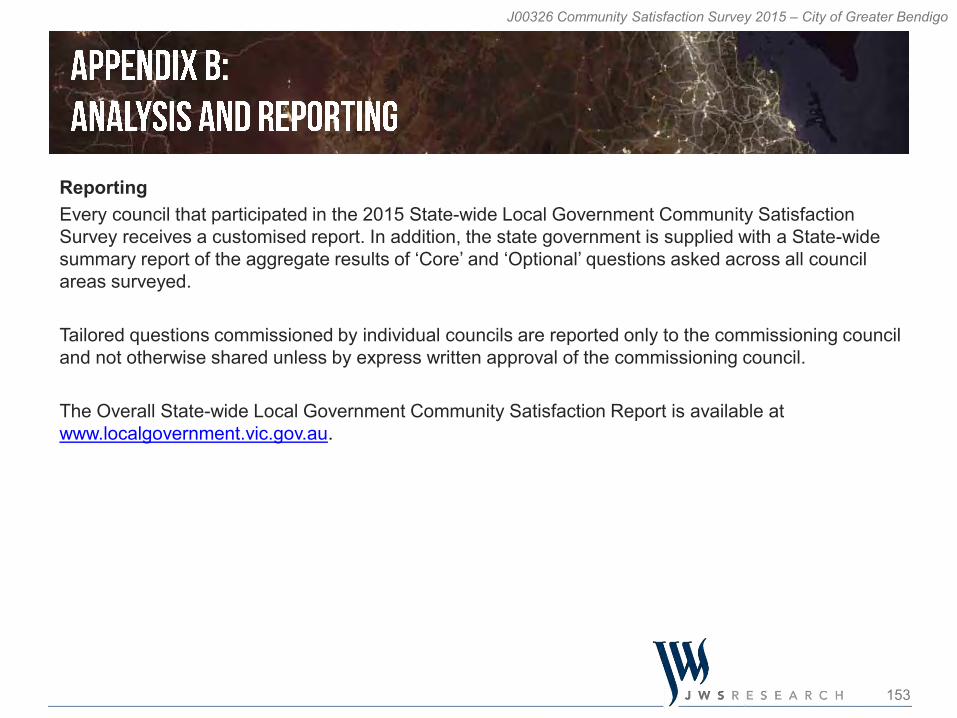
153
J00326 Community Satisfaction Survey 2015 – City of Greater Bendigo
ReportingEvery council that participated in the 2015 State-wide Local Government Community Satisfaction Survey receives a customised report. In addition, the state government is supplied with a State-wide summary report of the aggregate results of ‘Core’ and ‘Optional’ questions asked across all council areas surveyed.
Tailored questions commissioned by individual councils are reported only to the commissioning council and not otherwise shared unless by express written approval of the commissioning council.
The Overall State-wide Local Government Community Satisfaction Report is available at www.localgovernment.vic.gov.au.
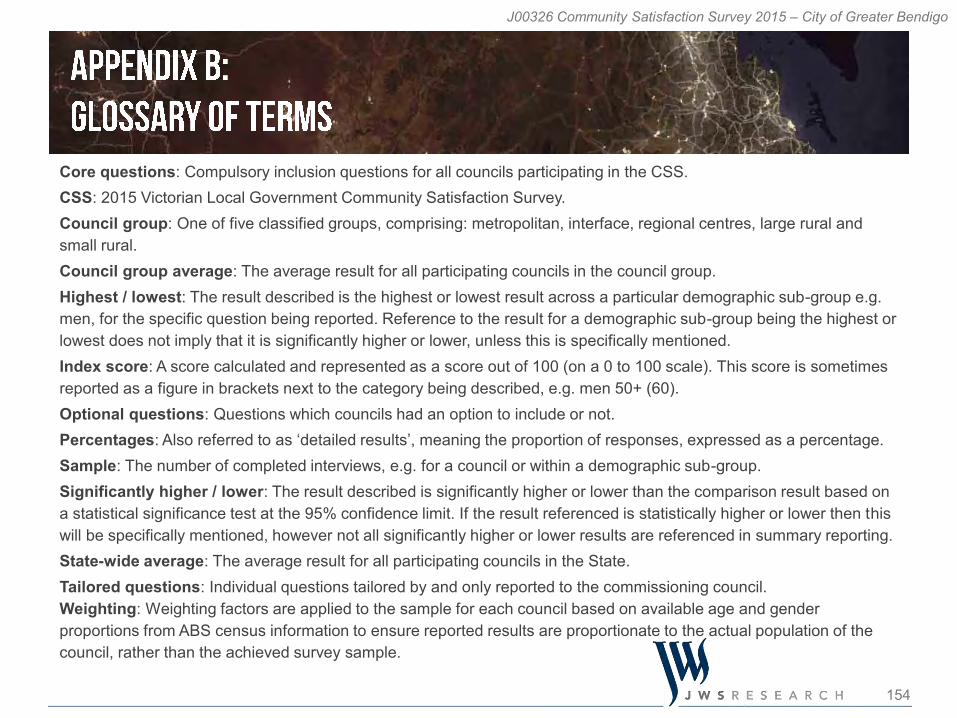
154
J00326 Community Satisfaction Survey 2015 – City of Greater Bendigo
Core questions: Compulsory inclusion questions for all councils participating in the CSS.CSS: 2015 Victorian Local Government Community Satisfaction Survey.Council group: One of five classified groups, comprising: metropolitan, interface, regional centres, large rural and small rural.Council group average: The average result for all participating councils in the council group.Highest / lowest: The result described is the highest or lowest result across a particular demographic sub-group e.g. men, for the specific question being reported. Reference to the result for a demographic sub-group being the highest or lowest does not imply that it is significantly higher or lower, unless this is specifically mentioned.Index score: A score calculated and represented as a score out of 100 (on a 0 to 100 scale). This score is sometimes reported as a figure in brackets next to the category being described, e.g. men 50+ (60).Optional questions: Questions which councils had an option to include or not.Percentages: Also referred to as ‘detailed results’, meaning the proportion of responses, expressed as a percentage.Sample: The number of completed interviews, e.g. for a council or within a demographic sub-group.Significantly higher / lower: The result described is significantly higher or lower than the comparison result based on a statistical significance test at the 95% confidence limit. If the result referenced is statistically higher or lower then thiswill be specifically mentioned, however not all significantly higher or lower results are referenced in summary reporting.State-wide average: The average result for all participating councils in the State.Tailored questions: Individual questions tailored by and only reported to the commissioning council.Weighting: Weighting factors are applied to the sample for each council based on available age and gender proportions from ABS census information to ensure reported results are proportionate to the actual population of the council, rather than the achieved survey sample.
Recommended