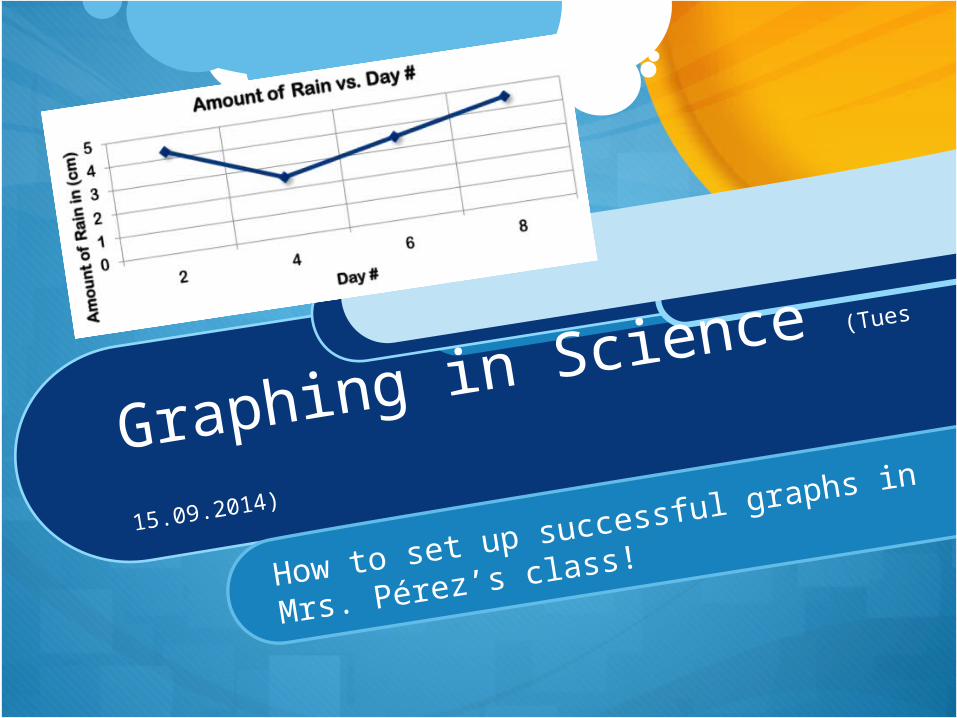
Graphing in Science (Tues
15.09.2014)
How to set up successful graphs in Mrs.
Pérez’s class!
Clear Learning goal
Students will:Students will:
(1) Communicate data through tables and (1) Communicate data through tables and graphs.graphs.
(2) Create appropriate graphs based on (2) Create appropriate graphs based on data.data.
How to set up your graph!
How to set up your graph!
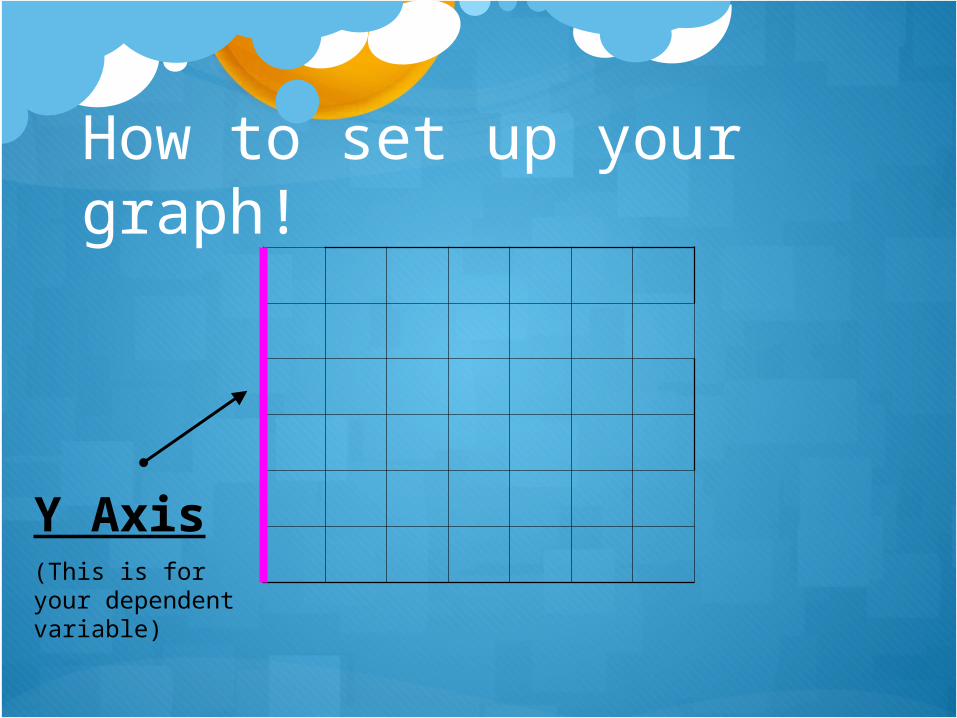
Y Axis
(This is for your dependent variable)
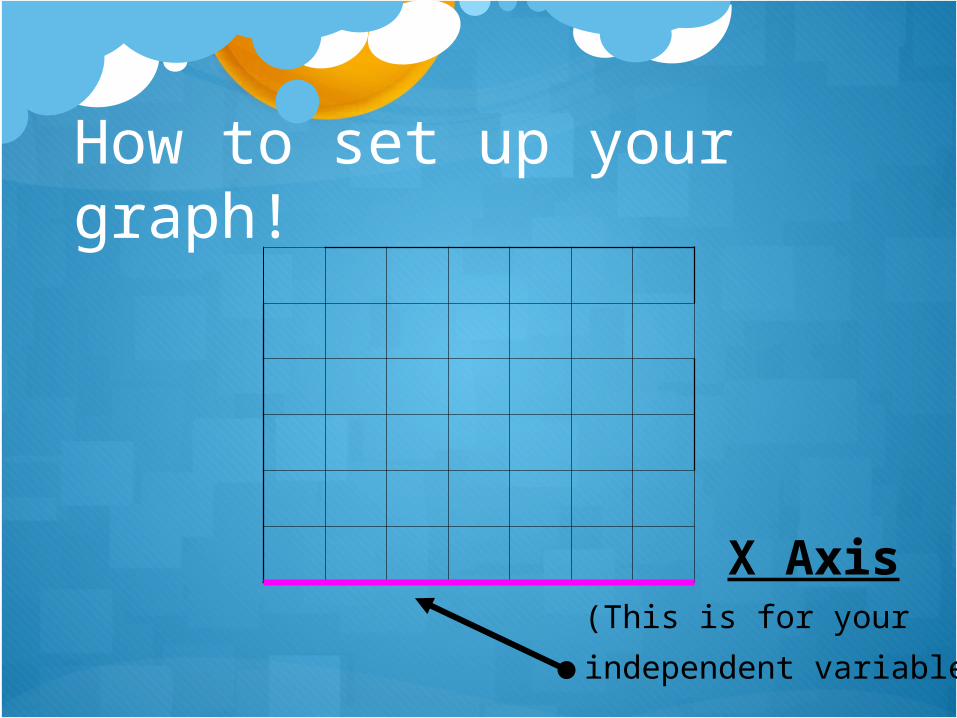
How to set up your graph!
X Axis
(This is for your
independent variable)
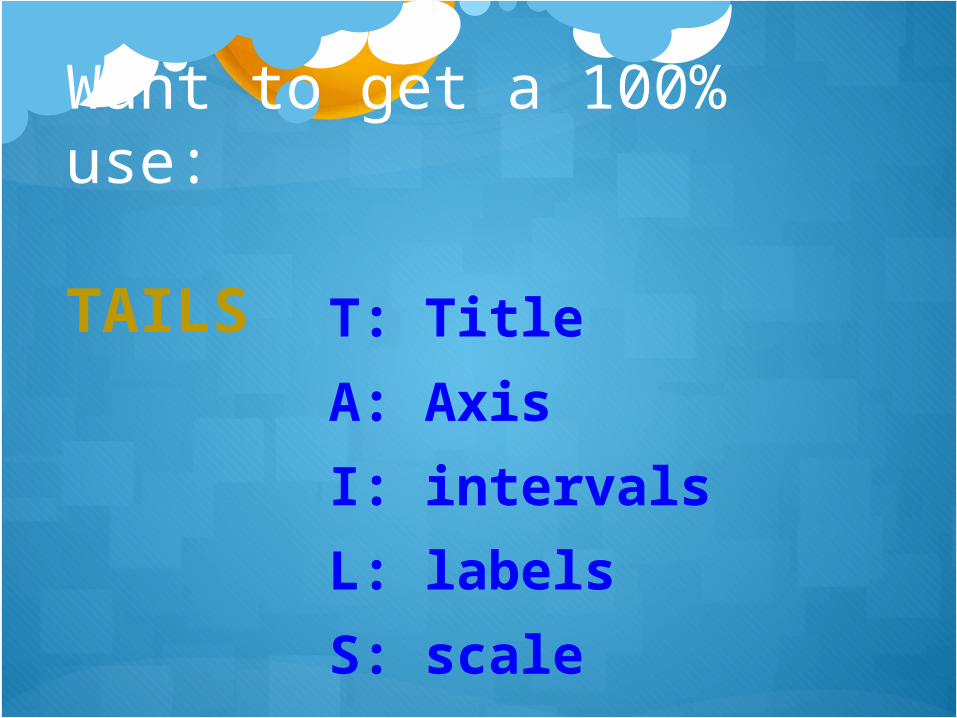
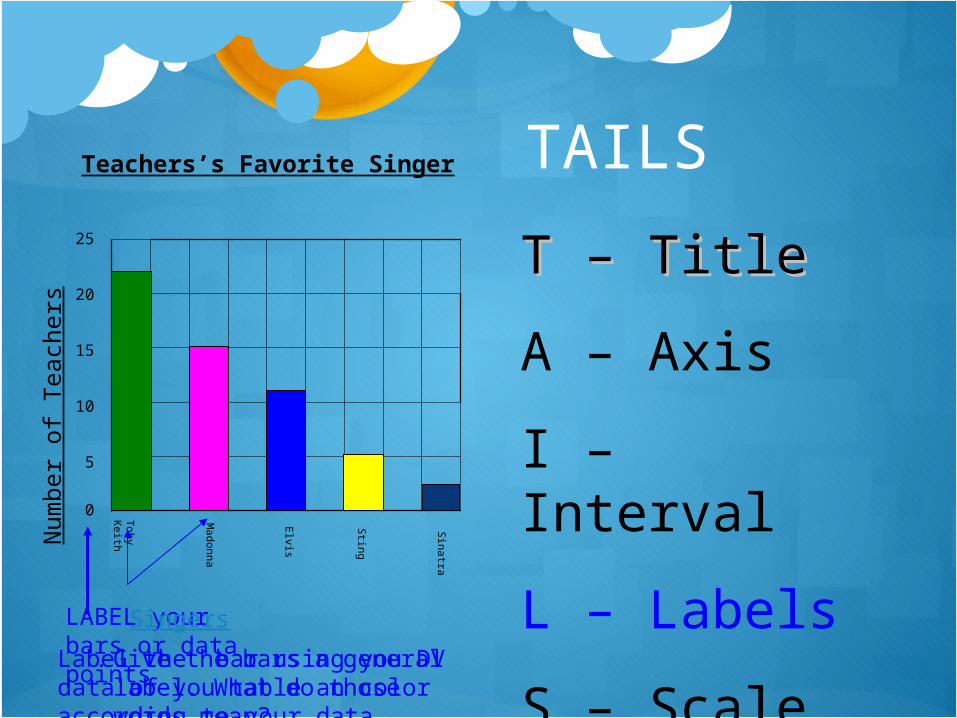
Want to get a 100% use: TAILS
T: Title
A: Axis
I: intervals
L: labels
S: scale
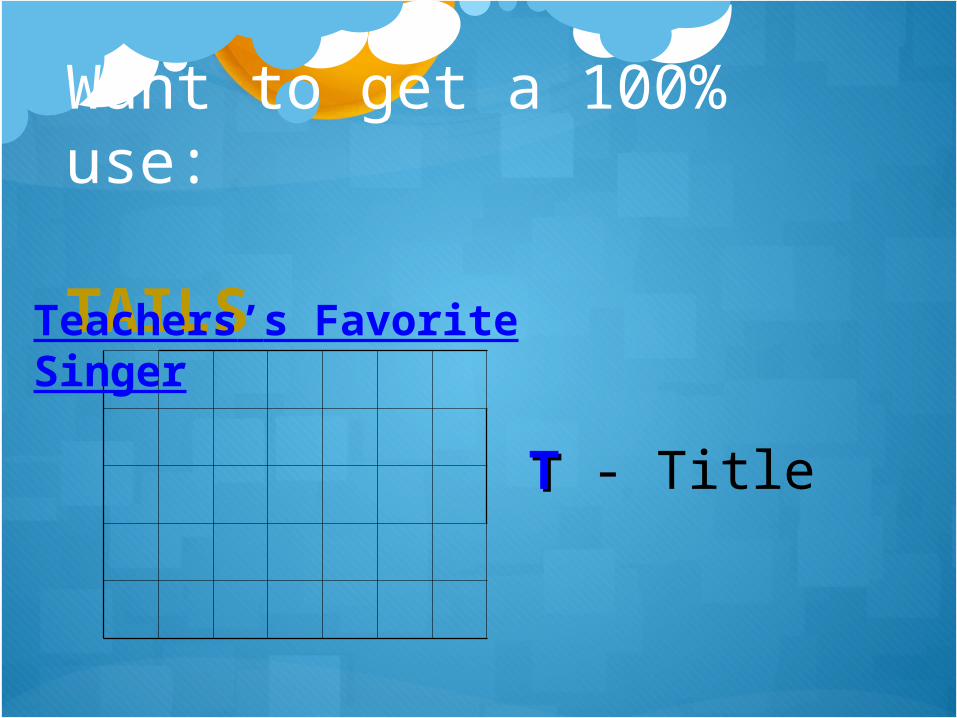
Want to get a 100% use: TAILS
TT - Title
Teachers’s Favorite Singer
T - T - Title
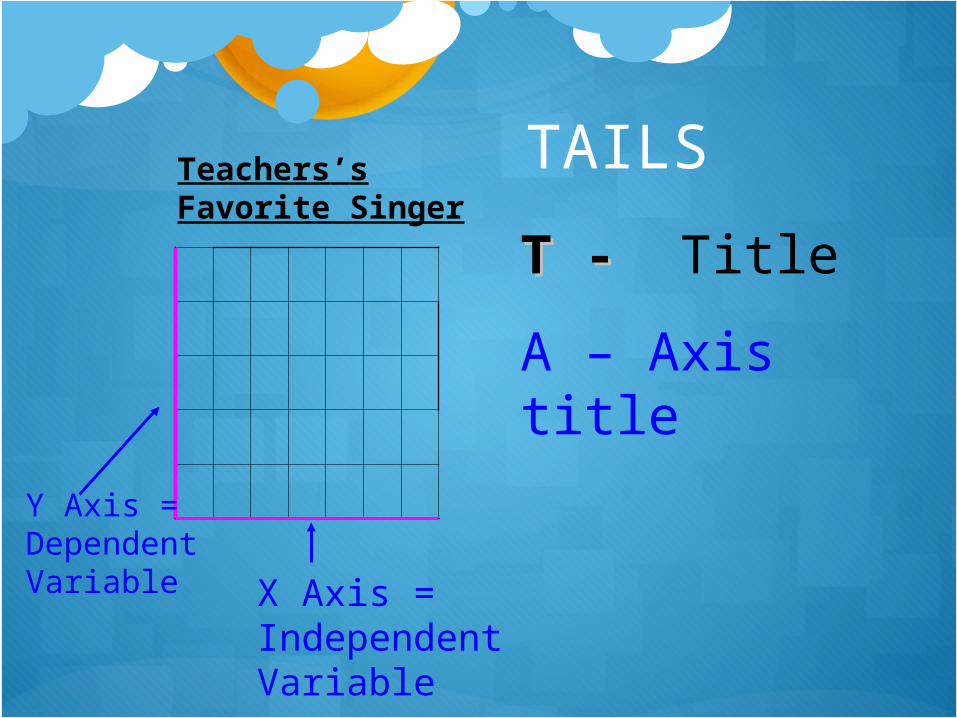
A – Axis title
Teachers’s Favorite Singer
Y Axis = Dependent Variable X Axis =
Independent Variable
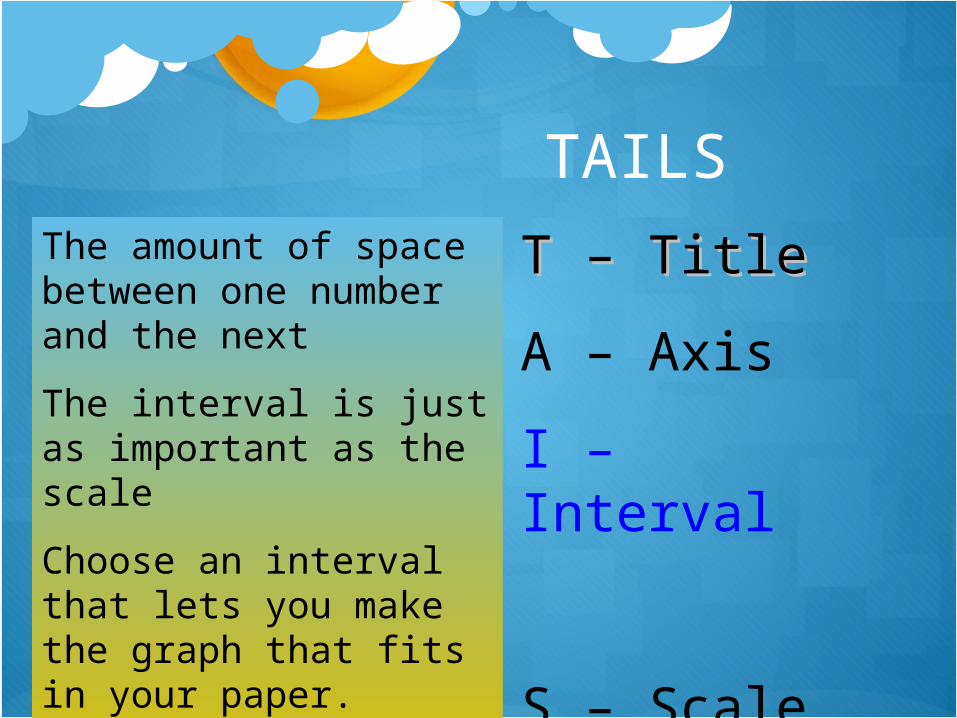
TAILS
TAILS
T – TitleT – Title
A – Axis
I – Interval
S – Scale
The amount of space between one number and the next
The interval is just as important as the scale
Choose an interval that lets you make the graph that fits in your paper.
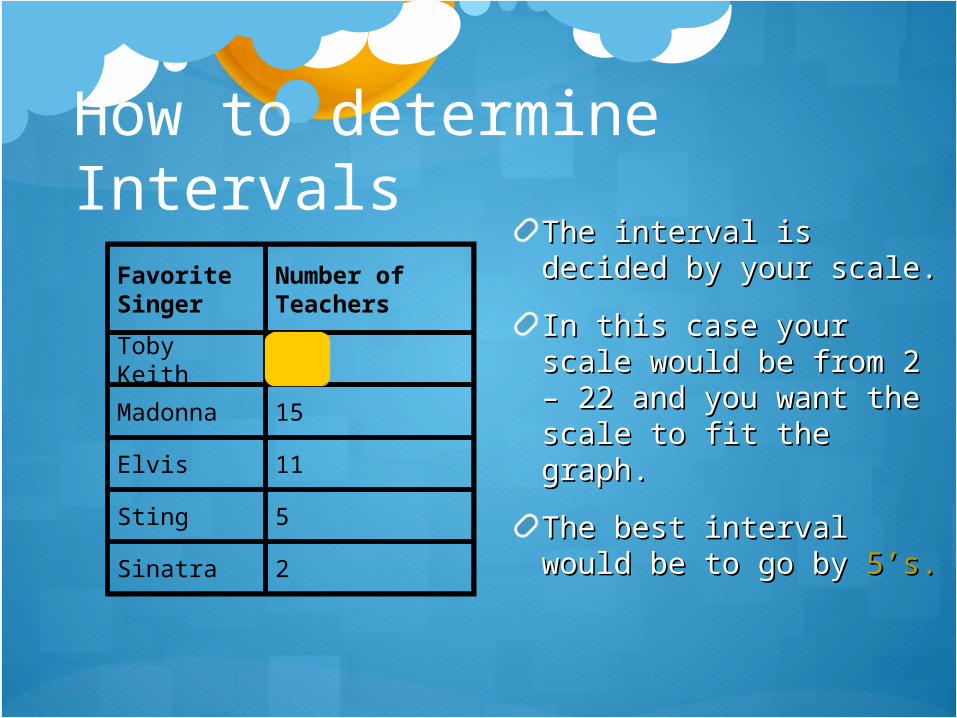
How to determine IntervalsThe interval is The interval is decided by your scale. decided by your scale.
In this case your scale In this case your scale would be from 2 – 22 would be from 2 – 22 and you want the and you want the scale to fit the graph.scale to fit the graph.
The best interval The best interval would be to go by would be to go by 55 ’’s.s.
Favorite Singer
Number of Teachers
Toby Keith 22
Madonna 15
Elvis 11
Sting 5
Sinatra 2
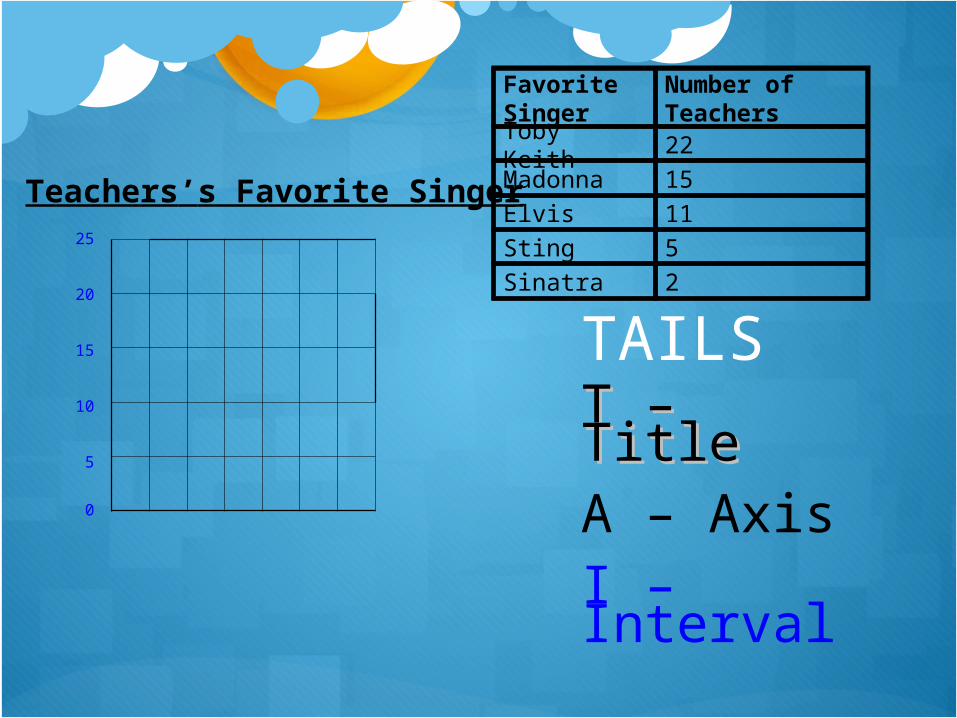
TAILST – TitleT – TitleA – AxisI – Interval
S – Scale
Teachers’s Favorite Singer
0
5
10
15
20
25
Favorite Singer
Number of Teachers
Toby Keith 22Madonna 15Elvis 11Sting 5Sinatra 2
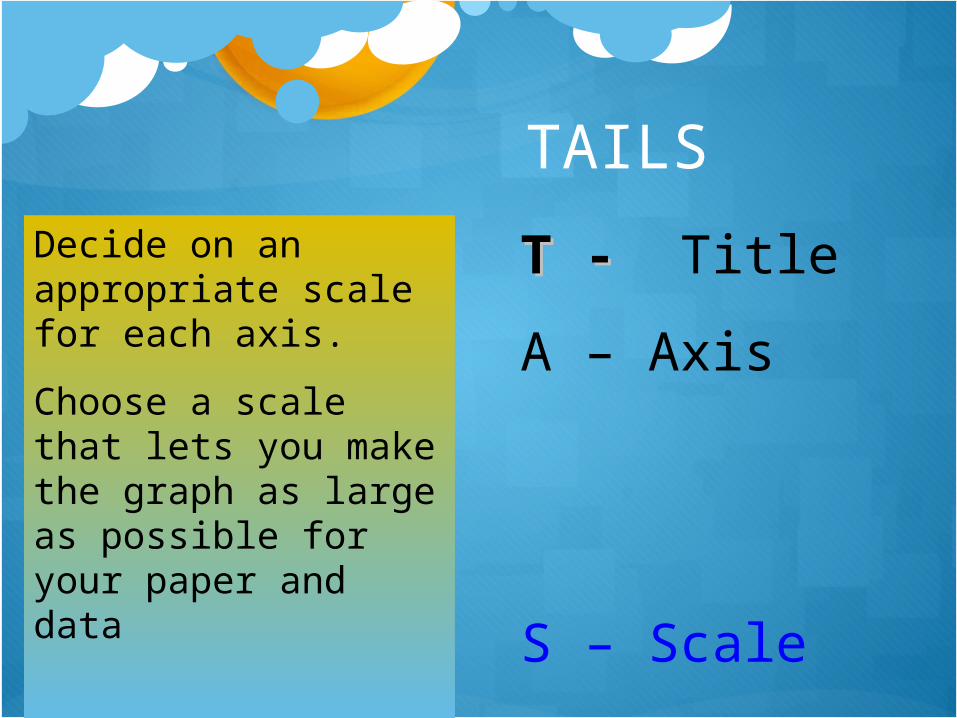
TAILS
T - T - Title
A – Axis
S – Scale
Decide on an appropriate scale for each axis.
Choose a scale that lets you make the graph as large as possible for your paper and data
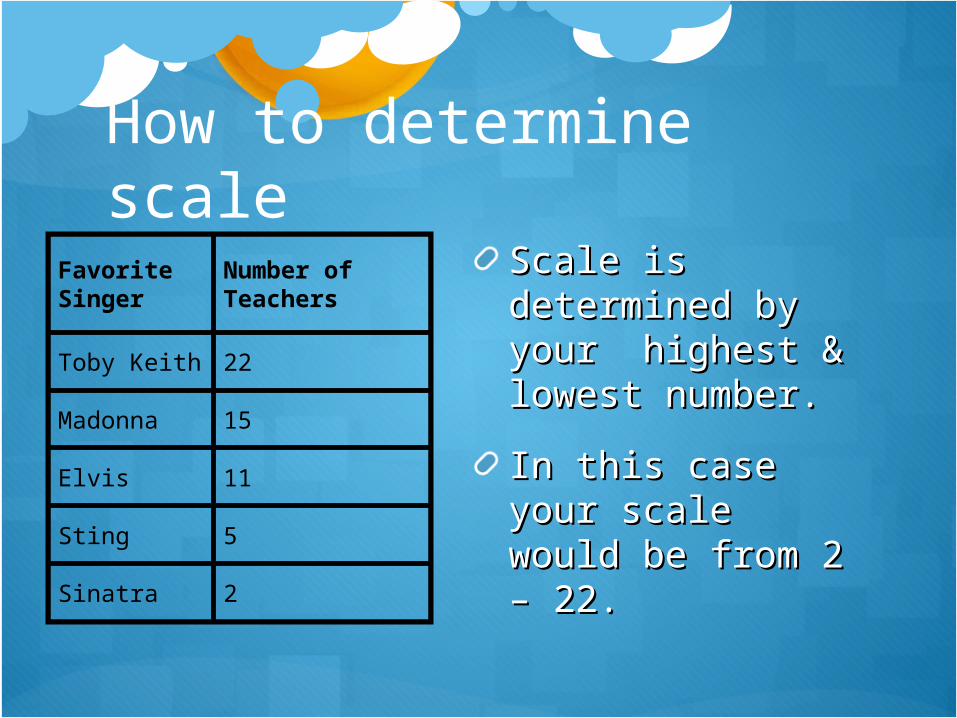
How to determine scale
Scale is Scale is determined by determined by your highest & your highest & lowest number. lowest number.
In this case your In this case your scale would be scale would be from 2 – 22. from 2 – 22.
Favorite Singer
Number of Teachers
Toby Keith 22
Madonna 15
Elvis 11
Sting 5
Sinatra 2
T – TitleT – Title
A – Axis
I – Interval
L – Labels
S – Scale
Teachers’s Favorite Singer
0
5
10
15
20
25
Toby K
eith
Madonna
Elvis
Sting
Sinatra
LABEL your bars or data points
Singers
Give the bars a general label. What do those words mean?
Num
ber
of T
each
ers
Label the bar using you DV data of you table an color according to your data.
TAILS
Let’s see if you are ready for tomorrow Graph Test.
Wednesday, September 17
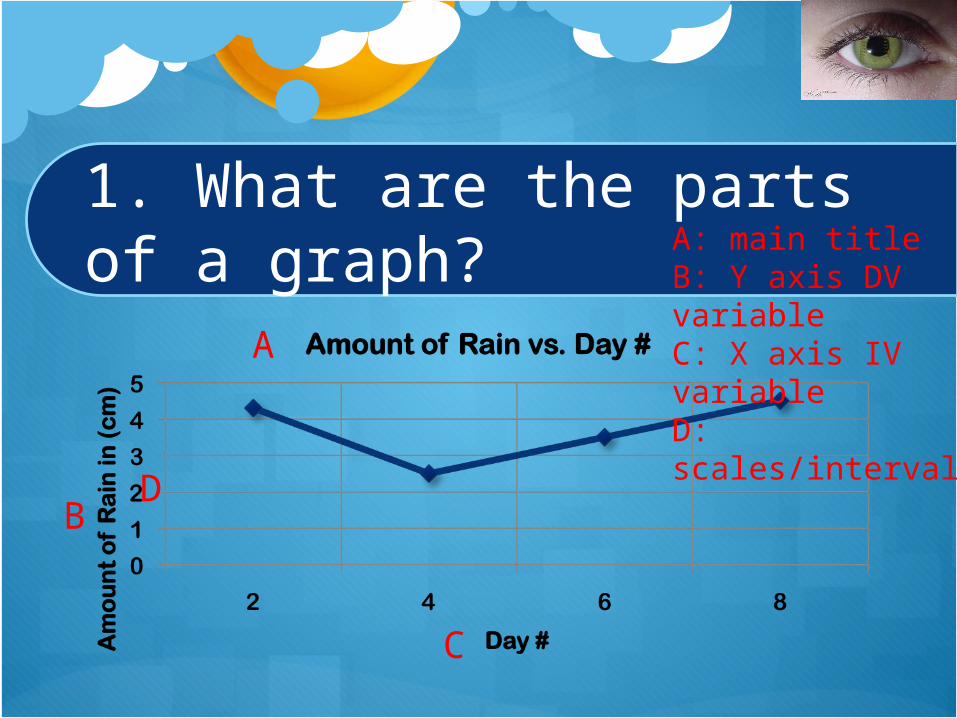
1. What are the parts of a graph?
A
B
C
D
A: main titleB: Y axis DV variableC: X axis IV variableD: scales/interval
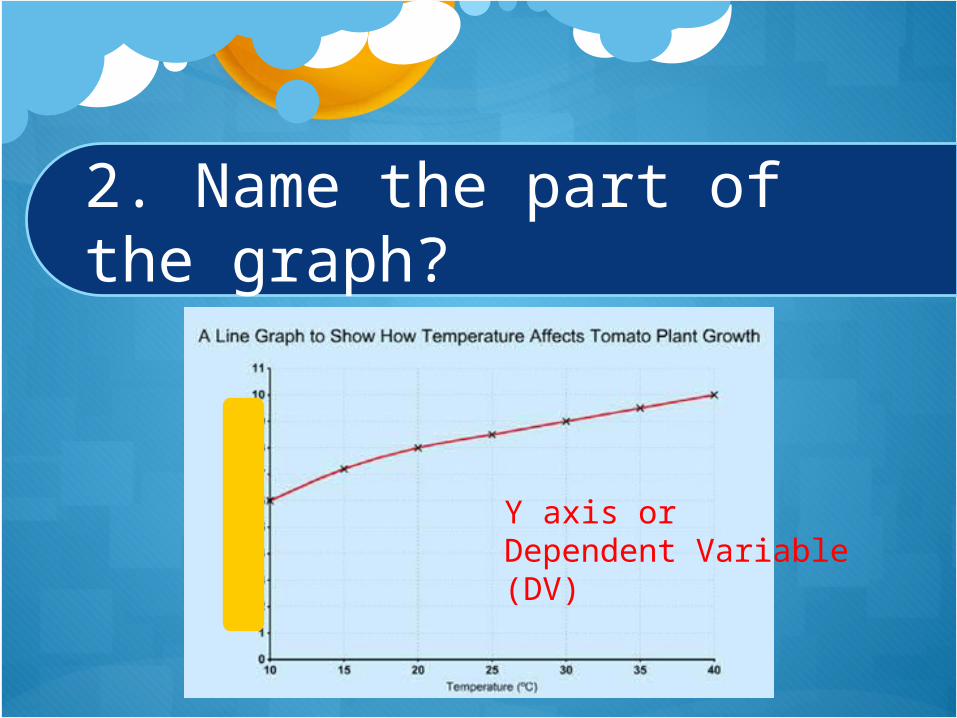
2. Name the part of the graph?
Y axis orDependent Variable (DV)
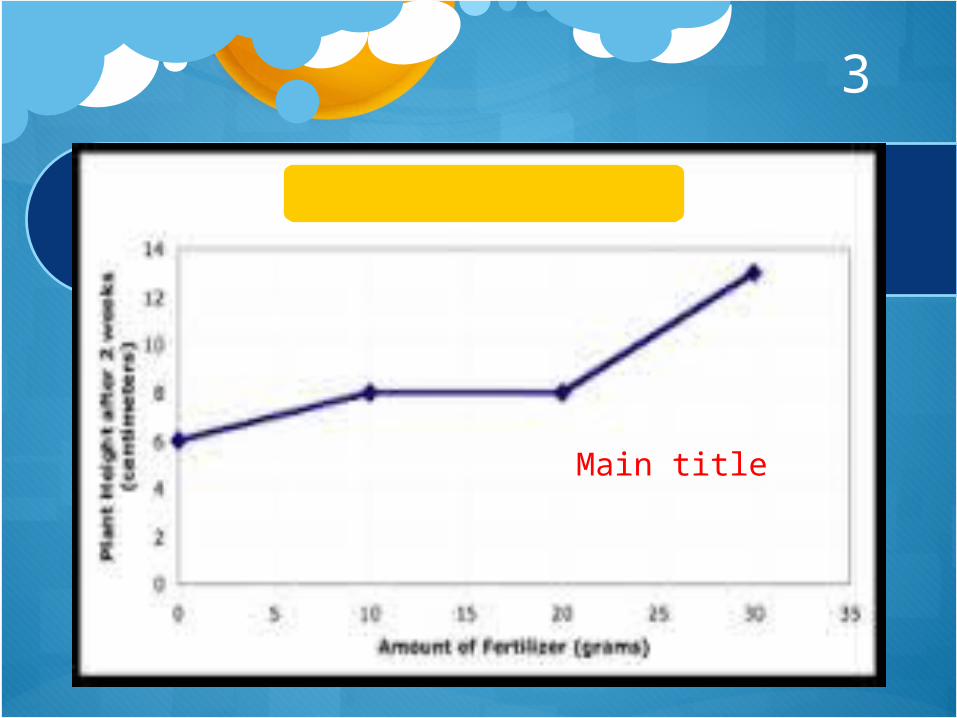
3
Main title
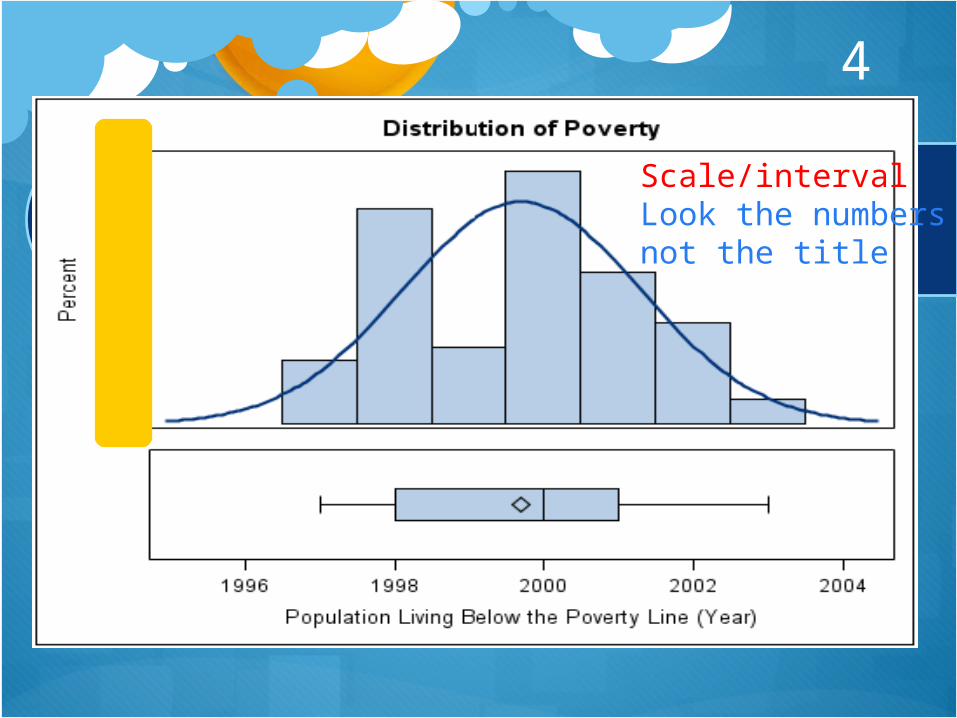
4
Scale/intervalLook the numbers not the title
5
Bar graph.
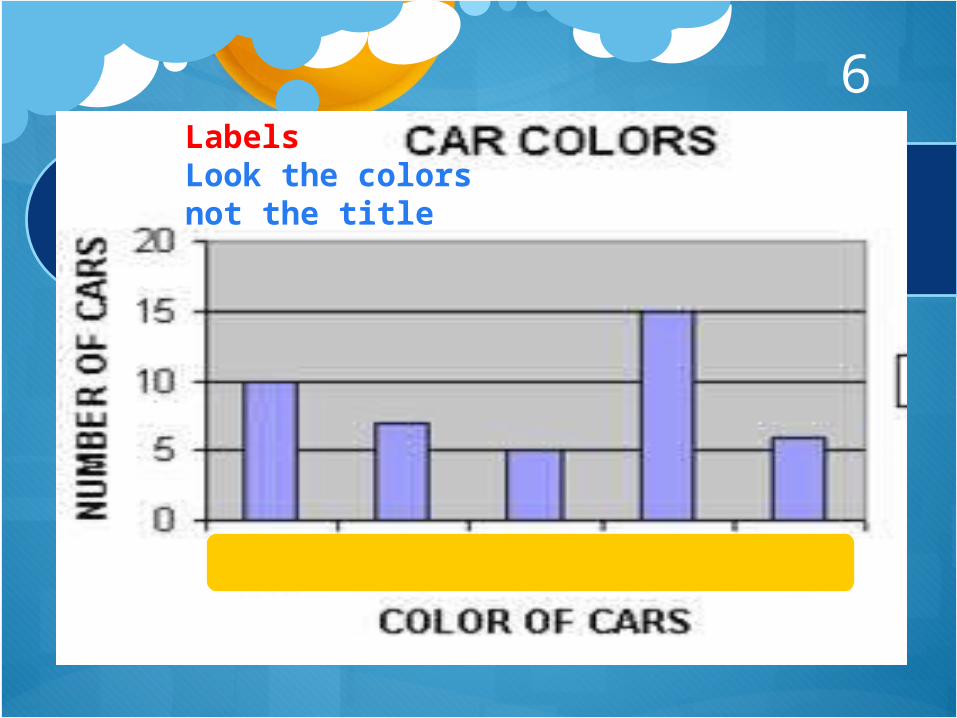
6LabelsLook the colors not the title
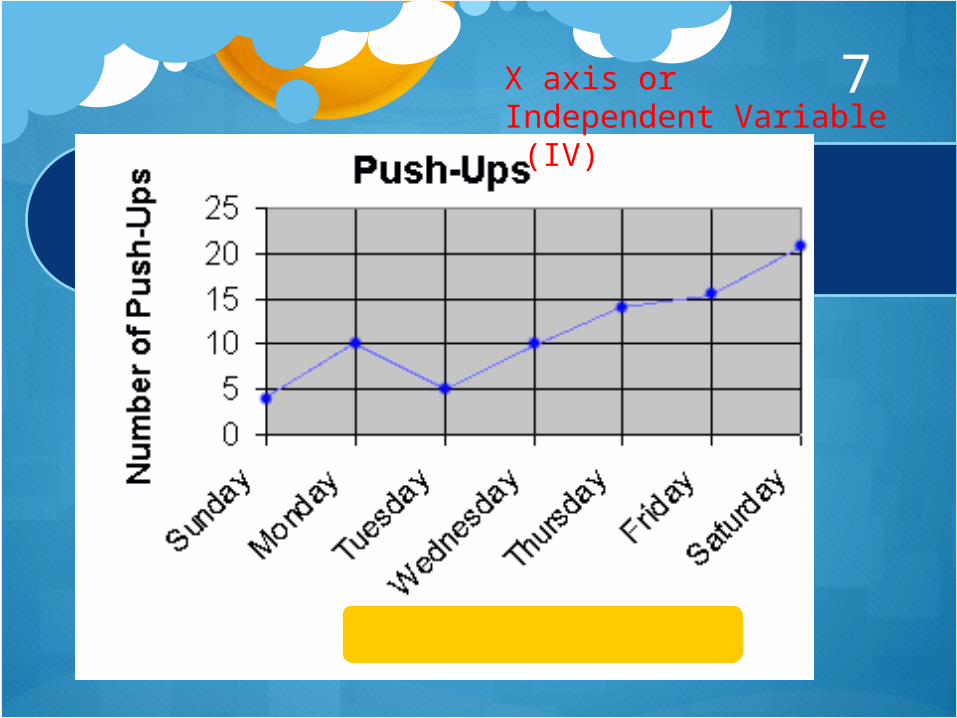
7X axis orIndependent Variable (IV)
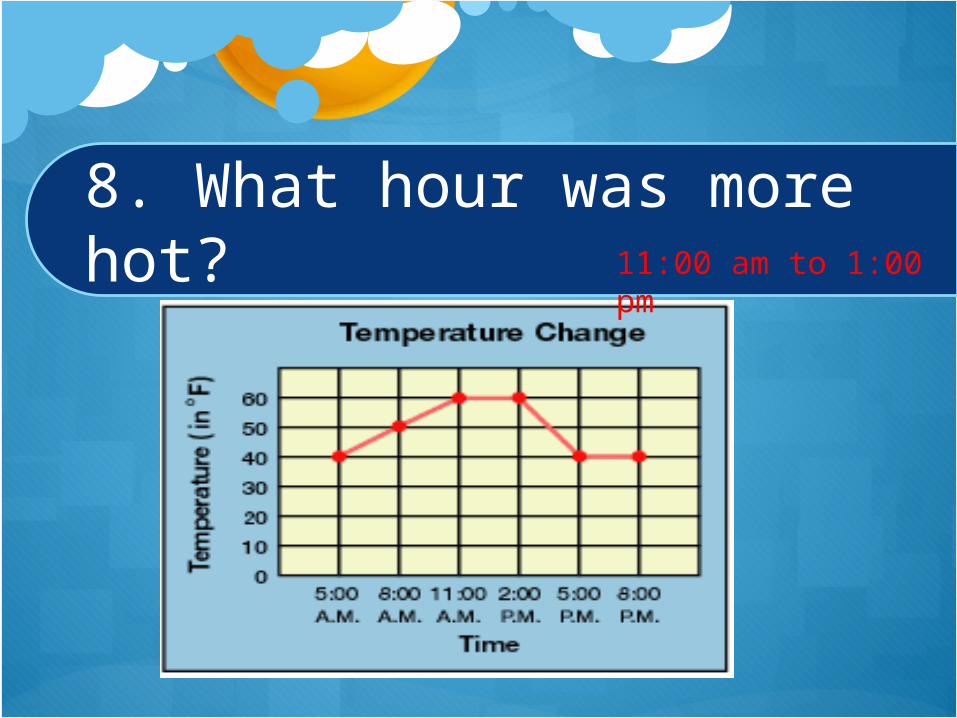
8. What hour was more hot? 11:00 am to 1:00 pm
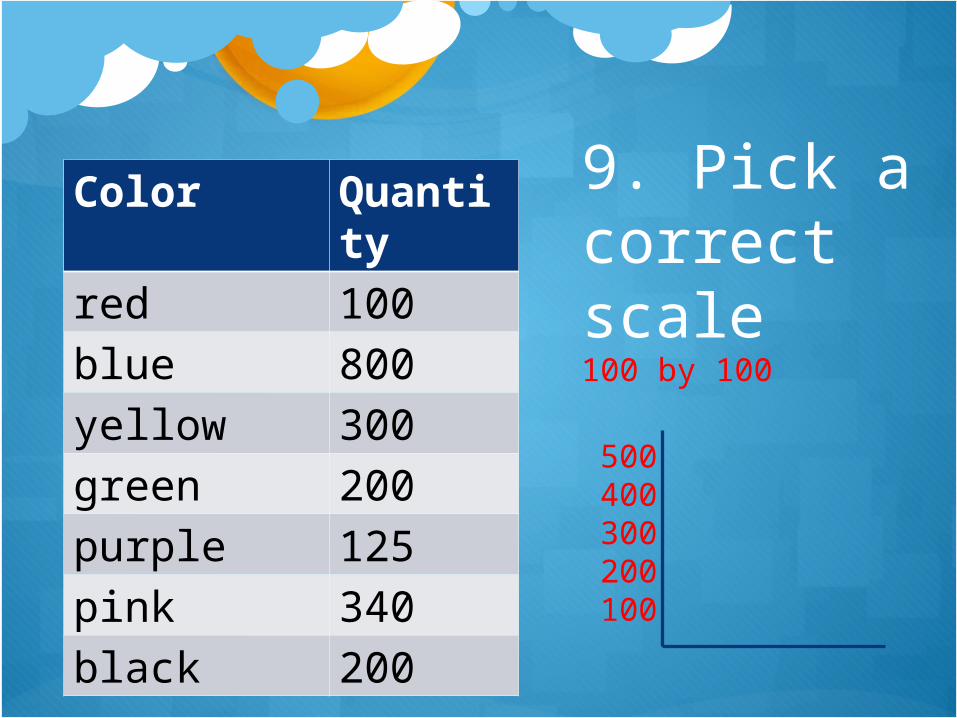
9. Pick a correct scale
Color Quantity
red 100blue 800yellow 300green 200purple 125pink 340black 200
100 by 100
500 400300200100
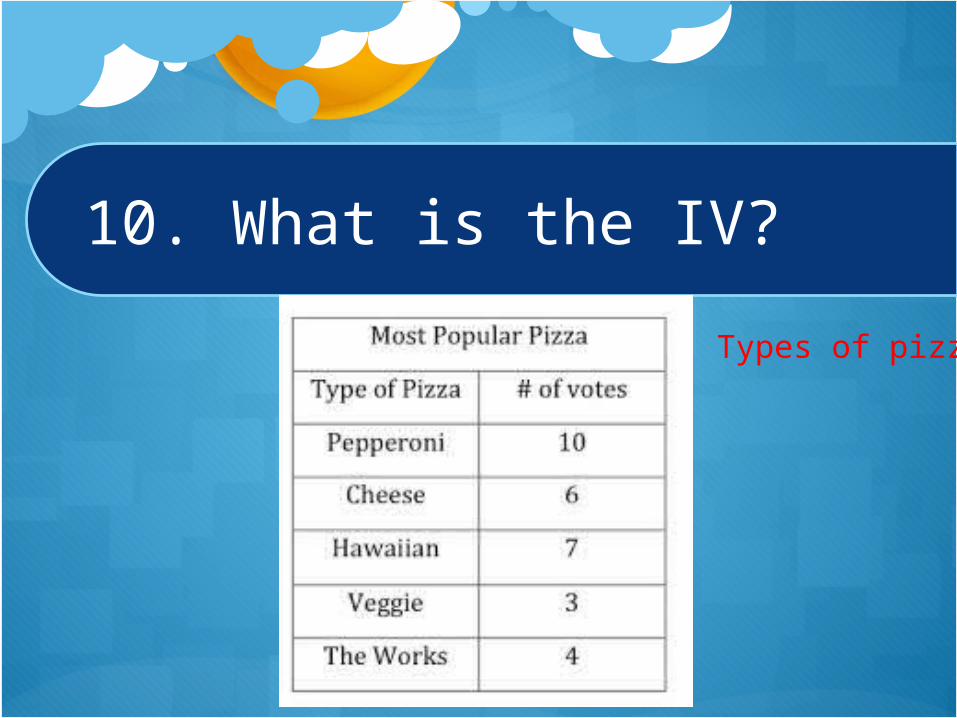
10. What is the IV?
Types of pizza
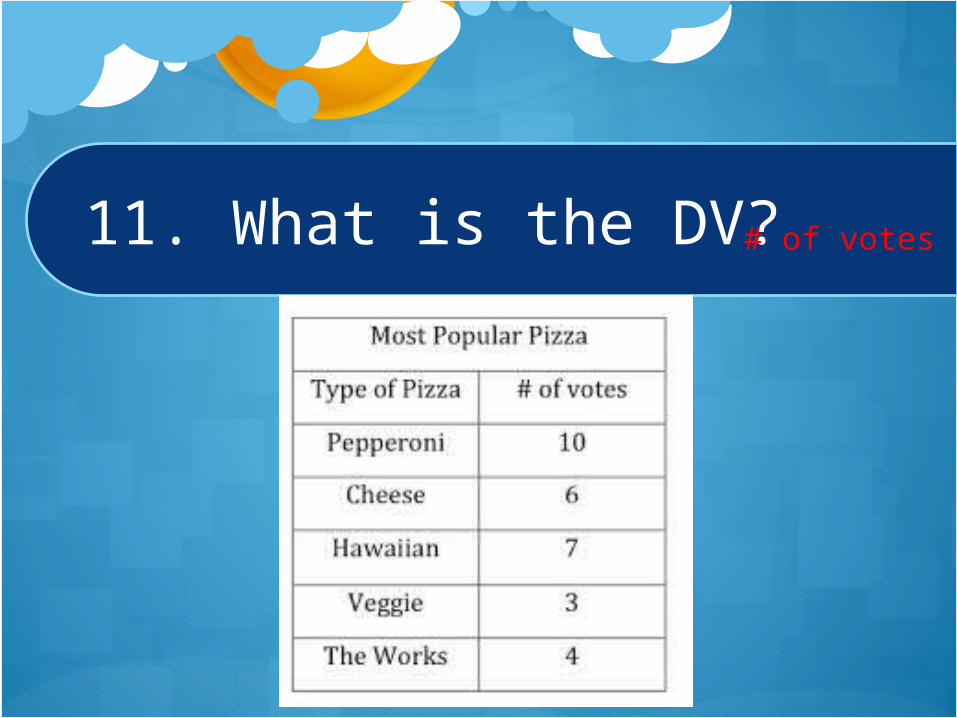
11. What is the DV? # of votes
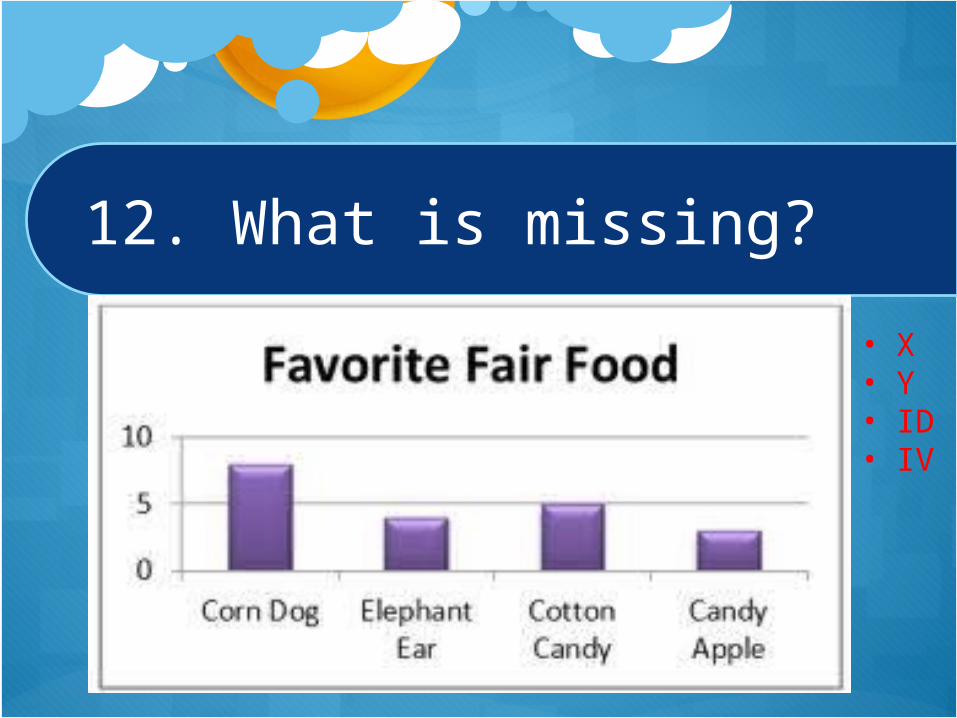
12. What is missing?
• X • Y• ID• IV
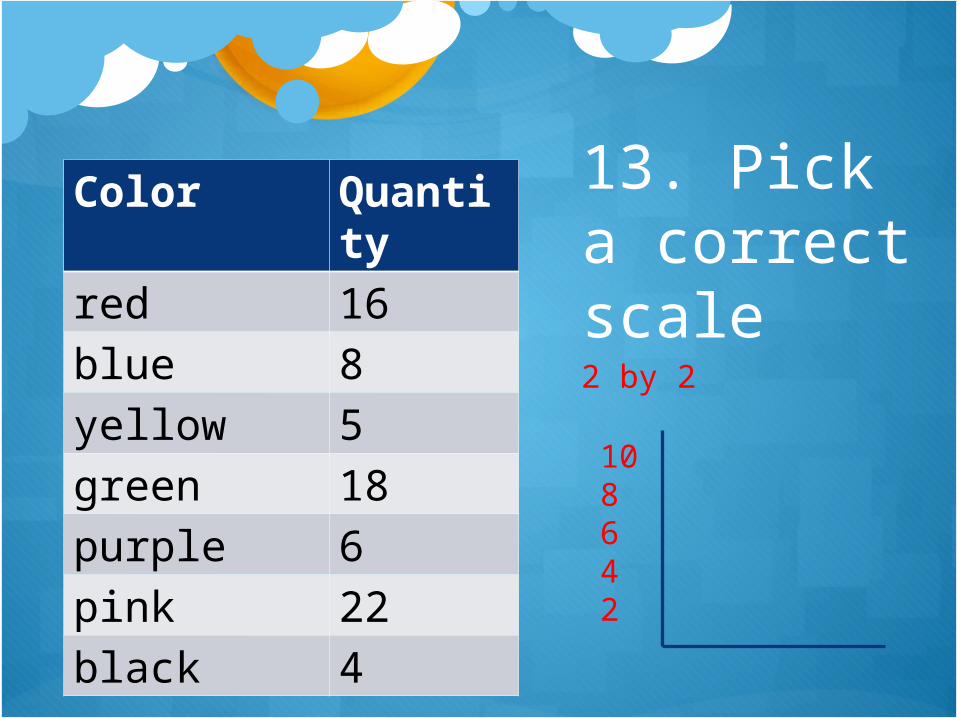
13. Pick a correct scale
Color Quantity
red 16blue 8yellow 5green 18purple 6pink 22black 4
2 by 2
10 8642
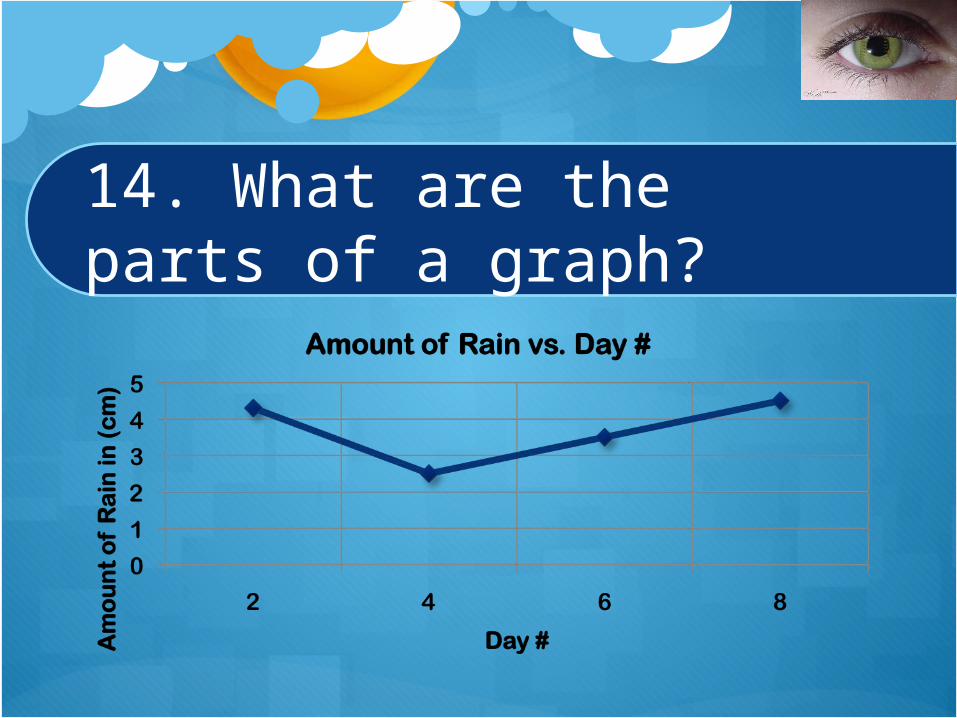
14. What are the parts of a graph?
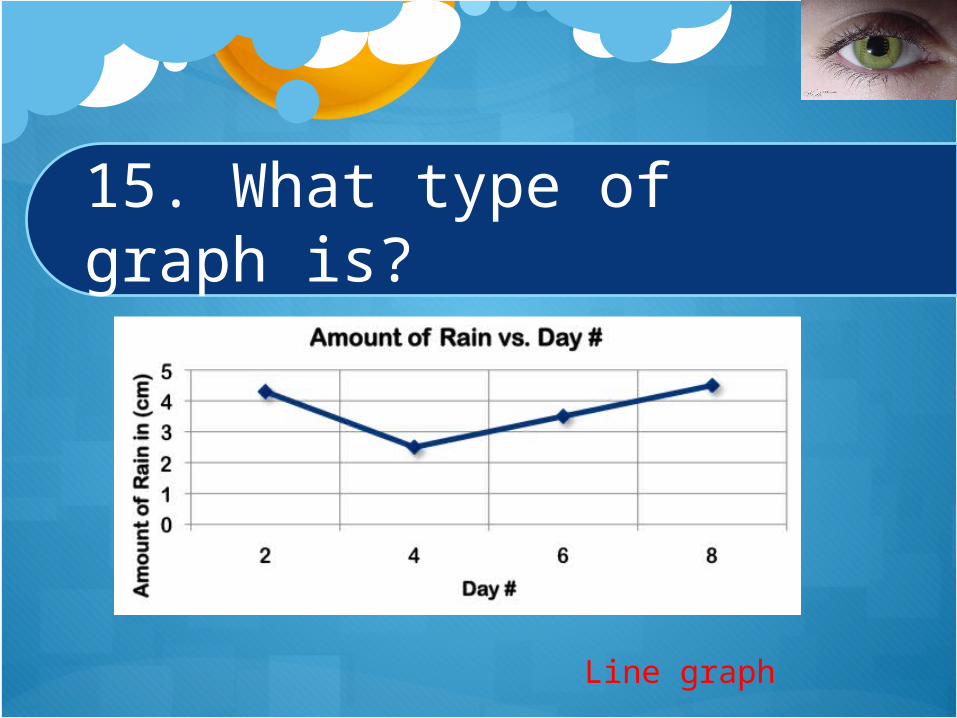
15. What type of graph is?
Line graph
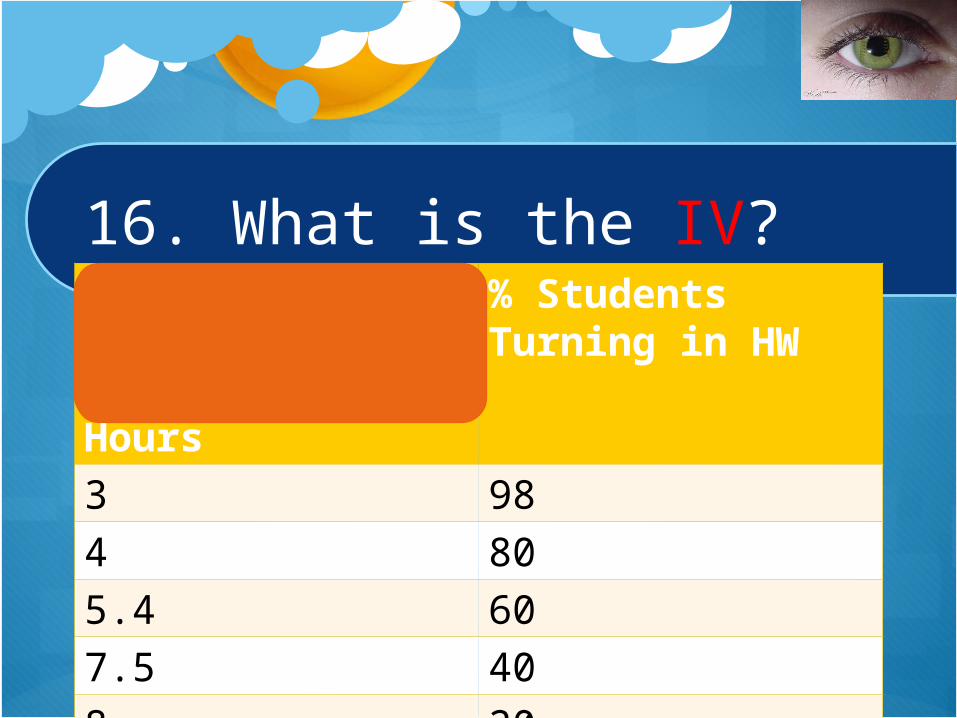
16. What is the IV?Average Weekly Television Watching in Hours
% Students Turning in HW
3 984 805.4 607.5 408 20
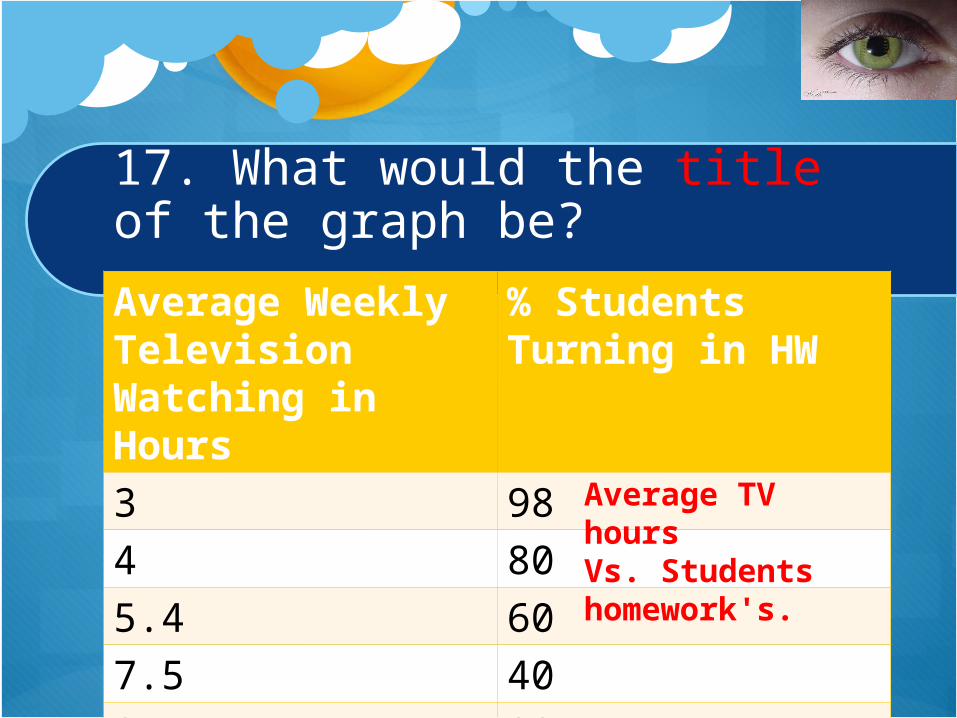
17. What would the title of the graph be?
Average Weekly Television Watching in Hours
% Students Turning in HW
3 984 805.4 607.5 408 20
Average TV hoursVs. Students homework's.
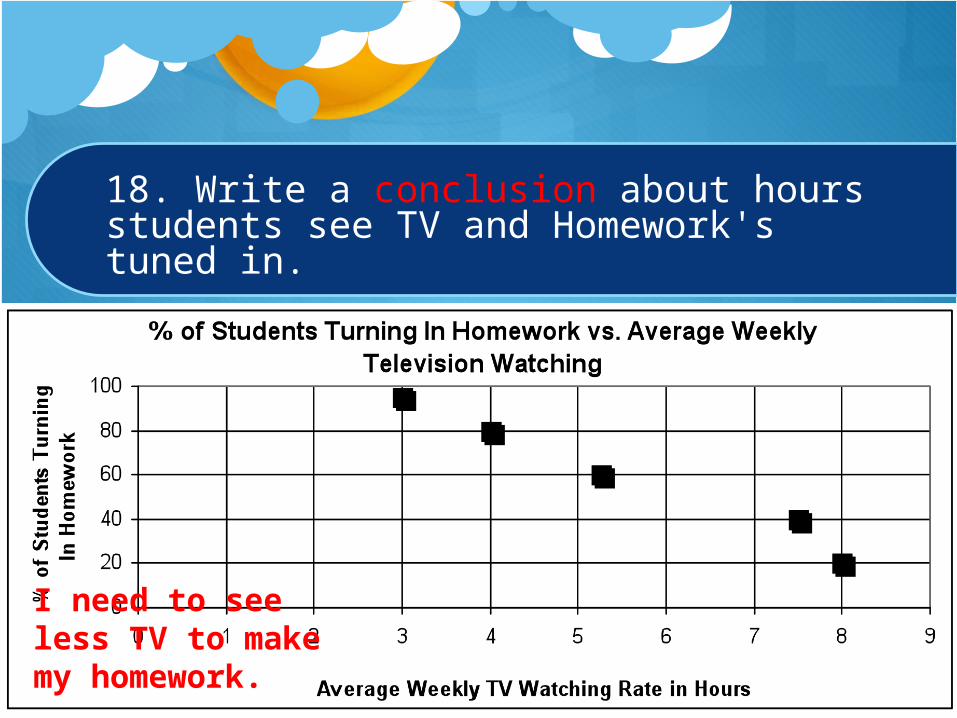
18. Write a conclusion about hours students see TV and Homework's tuned in.
I need to see less TV to make my homework.
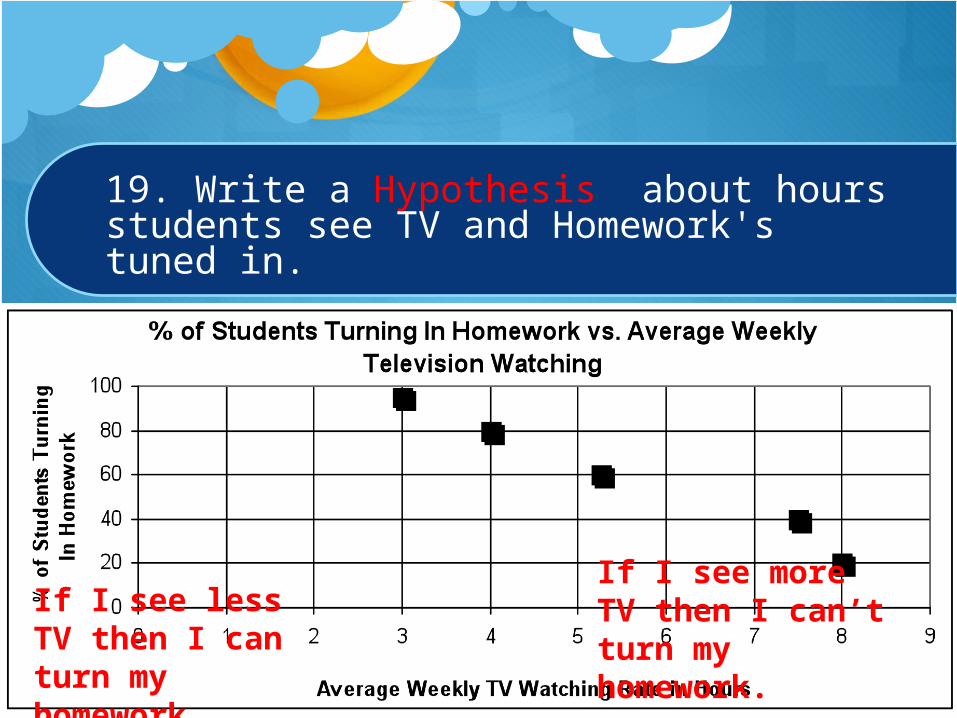
19. Write a Hypothesis about hours students see TV and Homework's tuned in.
If I see less TV then I can turn my homework.
If I see more TV then I can’t turn my homework.
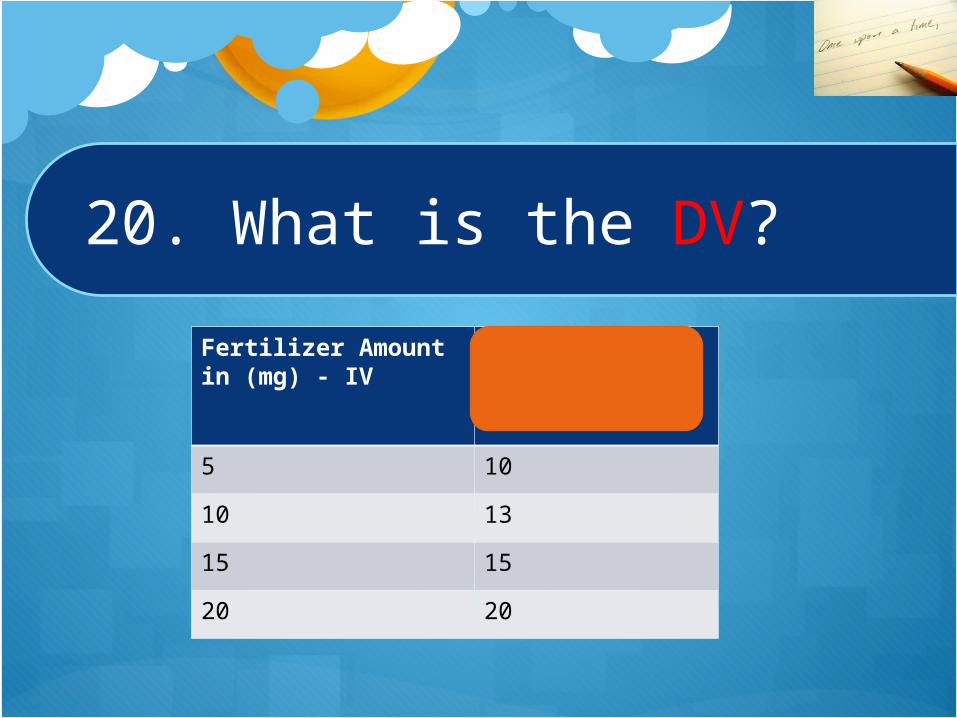
Fertilizer Amount in (mg) - IV
Plant Height in (cm) - DV
5 10
10 13
15 15
20 20
20. What is the DV?
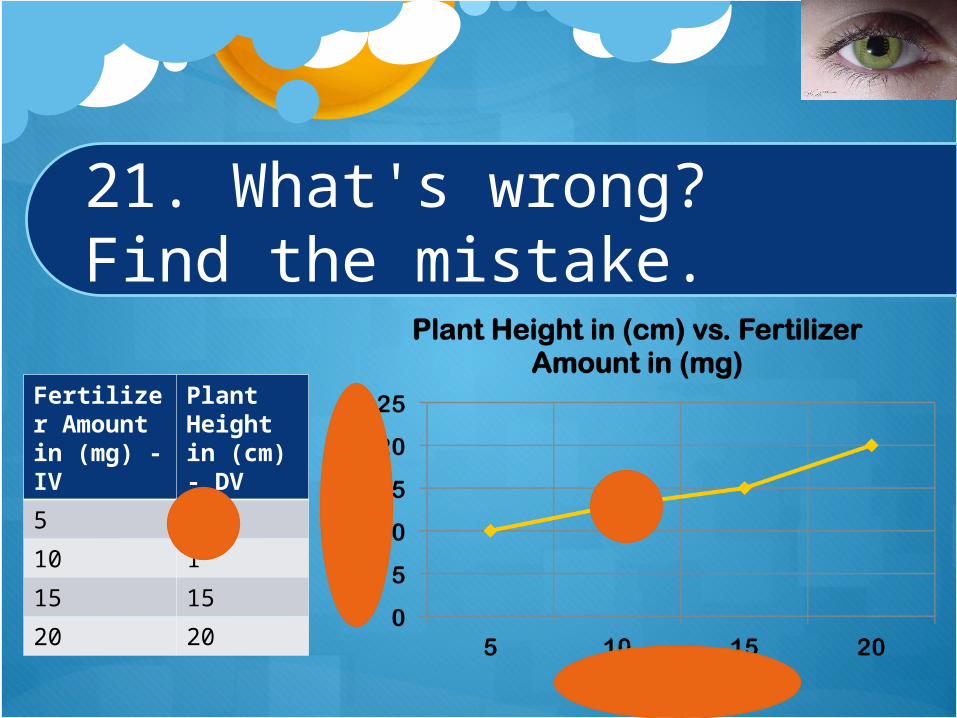
21. What's wrong? Find the mistake.
Fertilizer Amount in (mg) - IV
Plant Height in (cm) - DV
5 10
10 1
15 15
20 20
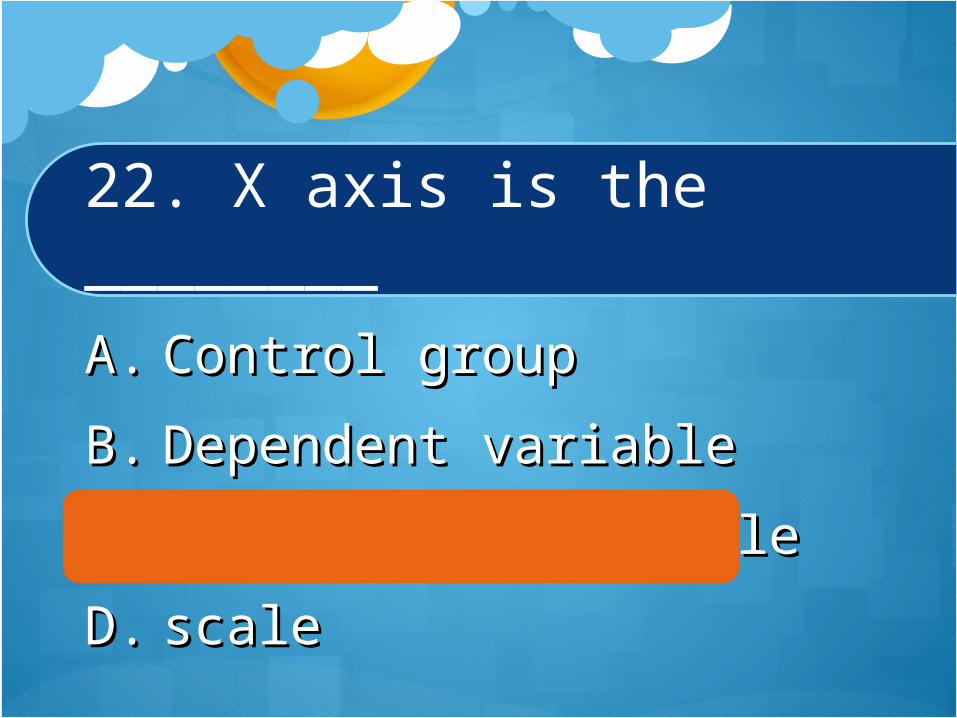
22. X axis is the ________
A.A. Control groupControl group
B.B. Dependent variableDependent variable
C.C. Independent variableIndependent variable
D.D. scalescale
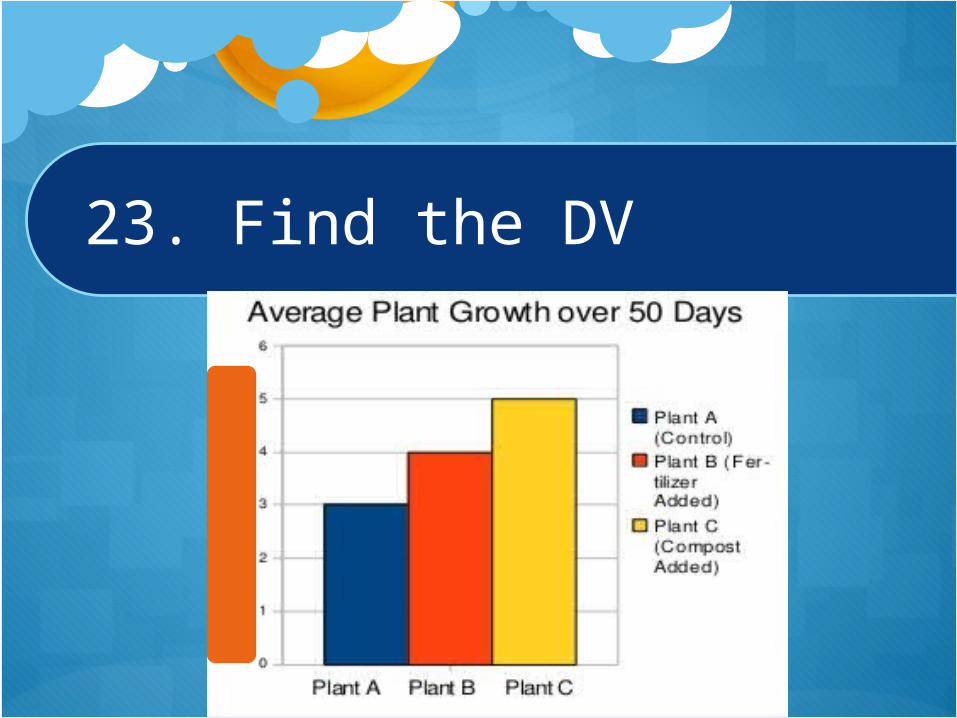
23. Find the DV
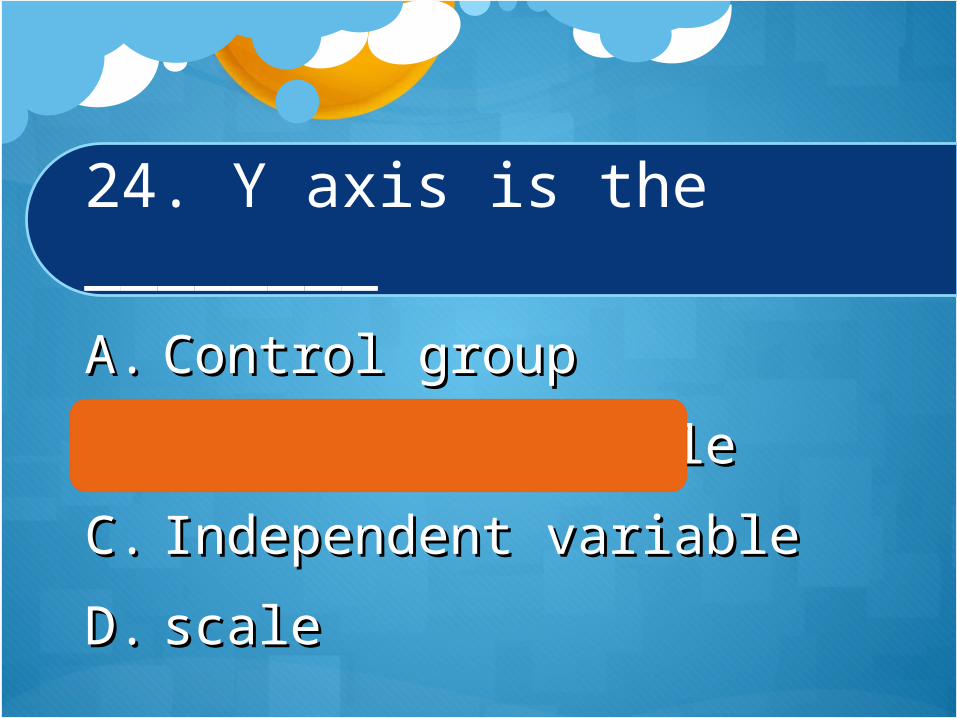
24. Y axis is the ________
A.A. Control groupControl group
B.B. Dependent variableDependent variable
C.C. Independent variableIndependent variable
D.D. scalescale
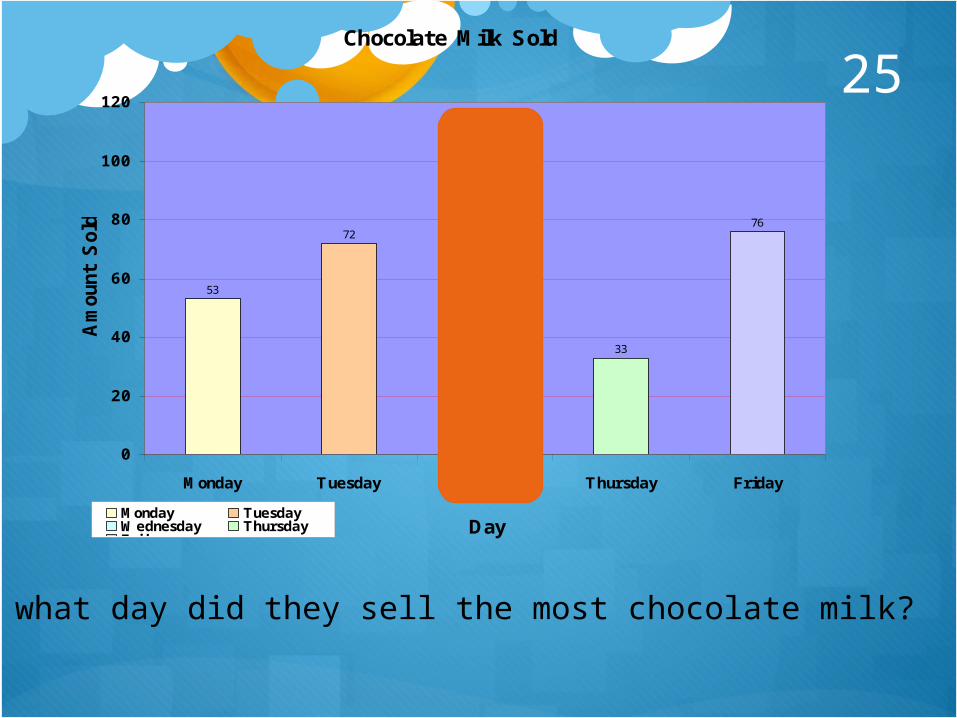
On what day did they sell the most chocolate milk?
Chocolate Milk Sold
53
72
112
33
76
0
20
40
60
80
100
120
Monday Tuesday Wednesday Thursday Friday
Day
Am
ount
Sol
d
Monday TuesdayWednesday ThursdayFriday
25
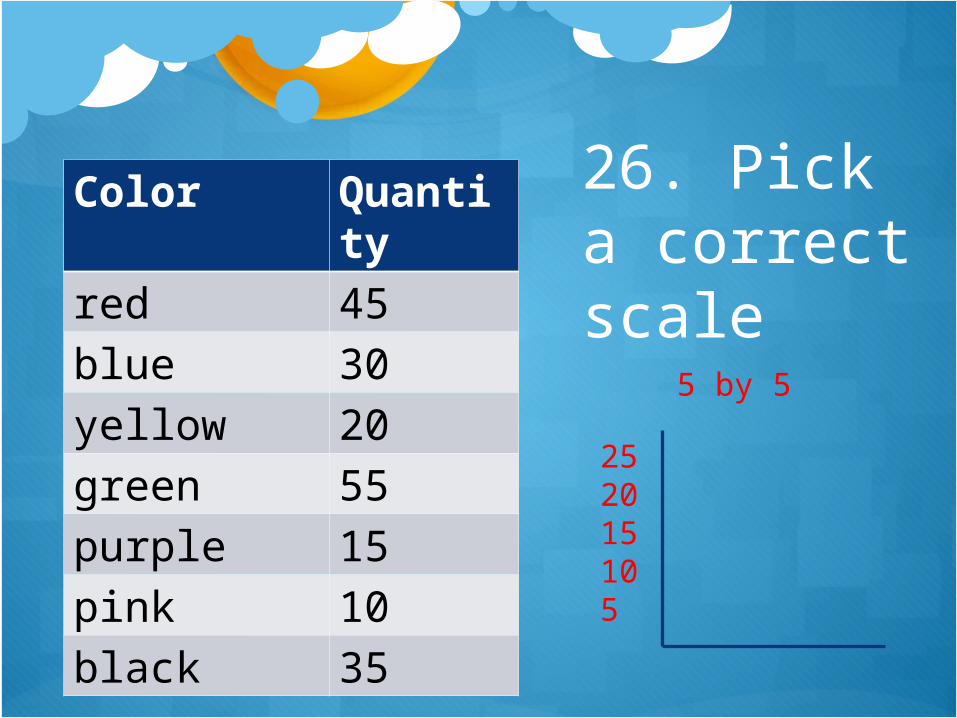
26. Pick a correct scale
Color Quantity
red 45blue 30yellow 20green 55purple 15pink 10black 35
25 2015105
5 by 5
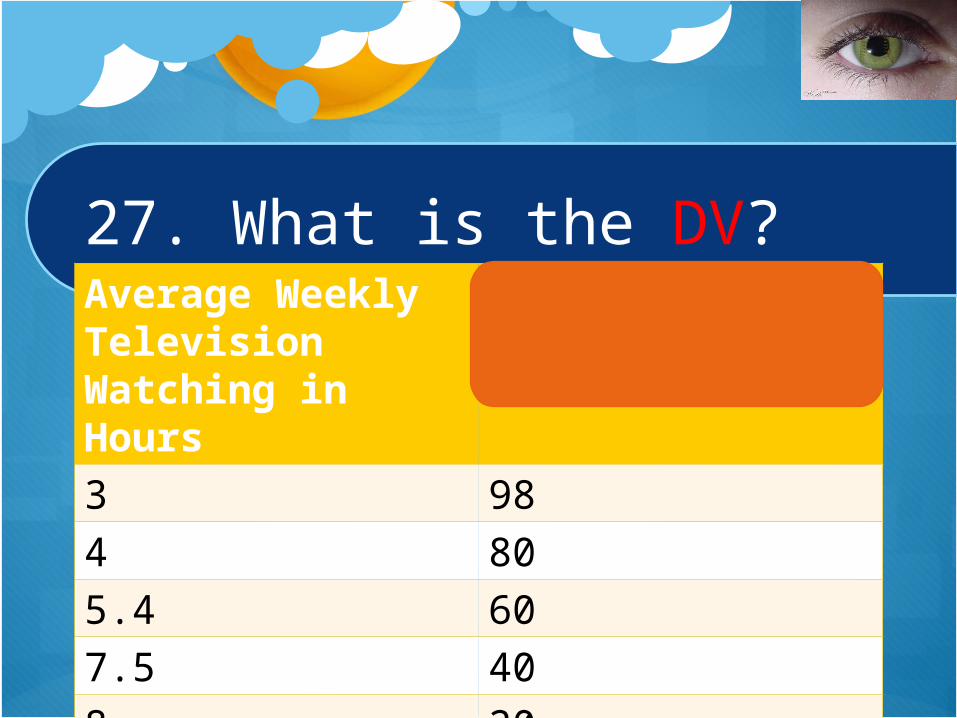
27. What is the DV?Average Weekly Television Watching in Hours
% Students Turning in HW
3 984 805.4 607.5 408 20
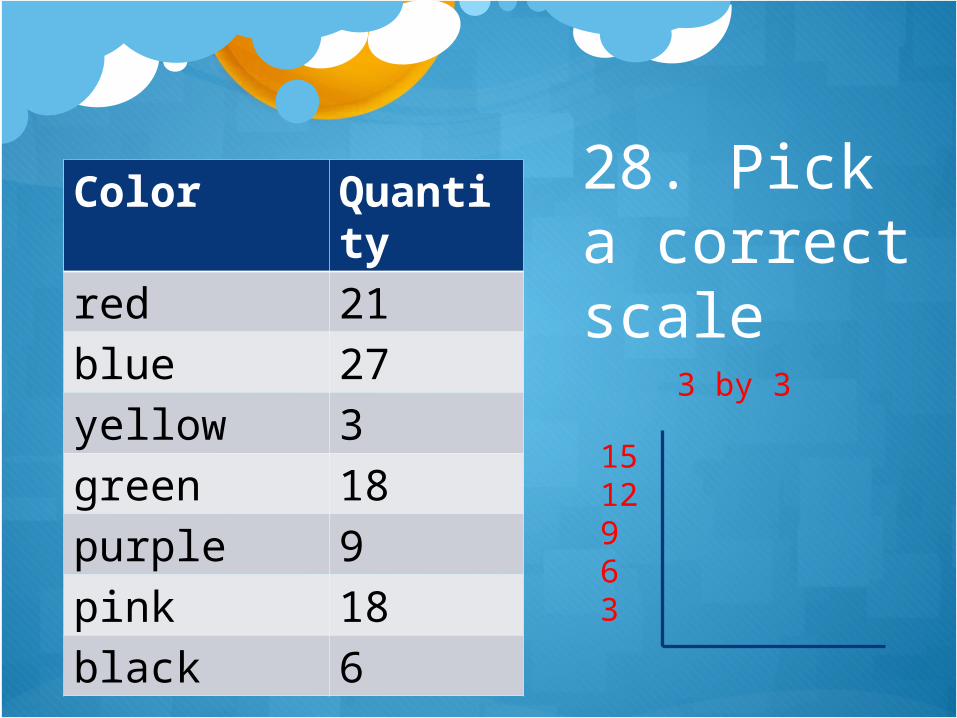
28. Pick a correct scale
Color Quantity
red 21blue 27yellow 3green 18purple 9pink 18black 6
15 12963
3 by 3
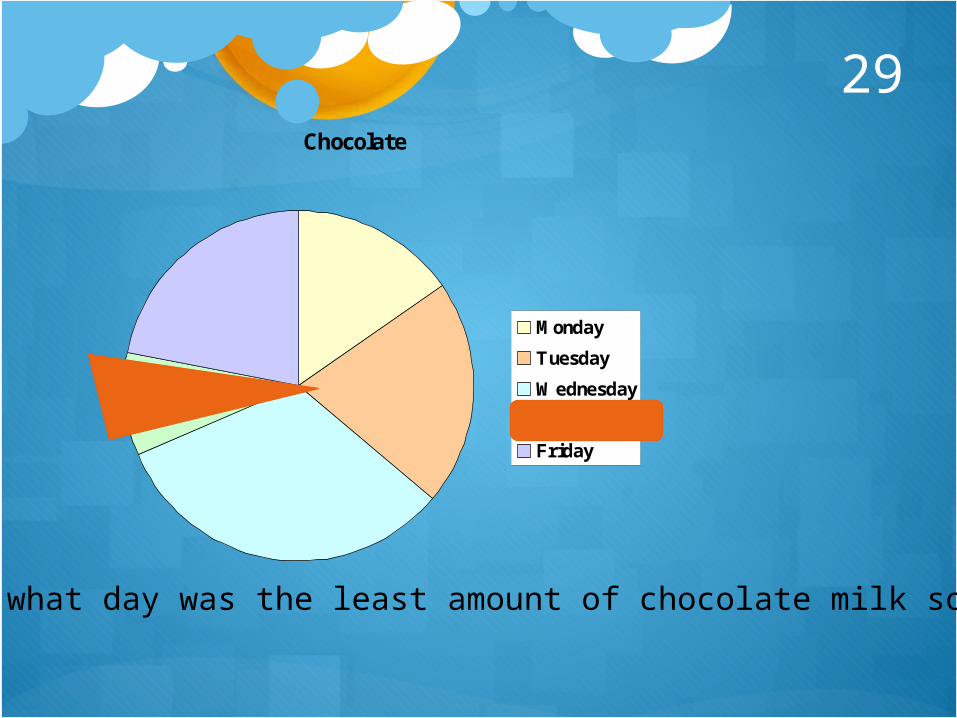
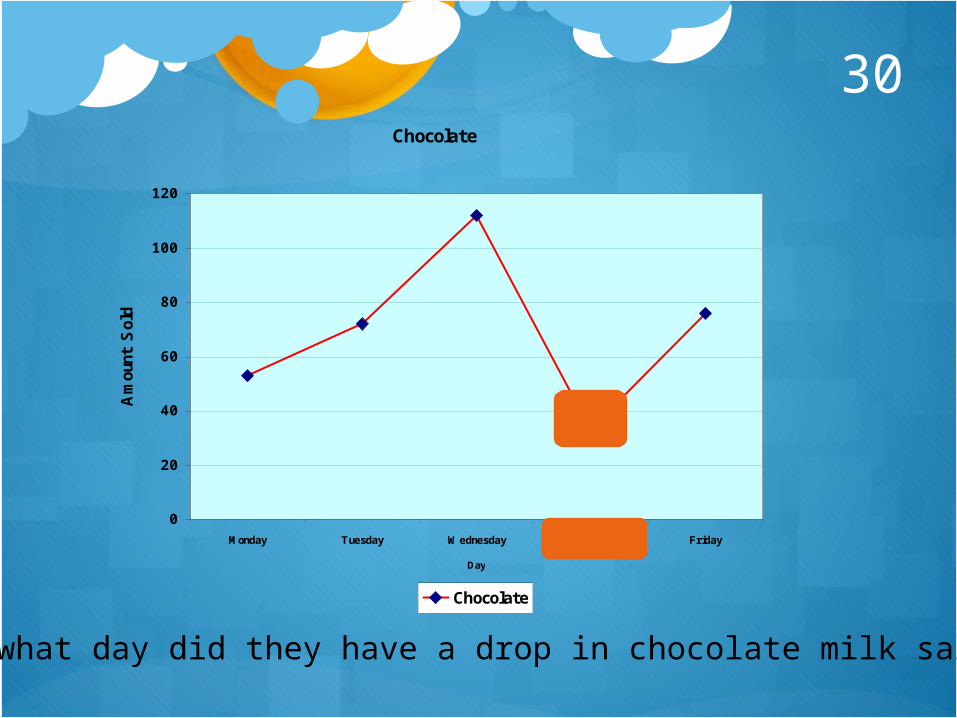
Chocolate
Monday
Tuesday
Wednesday
Thursday
Friday
On what day was the least amount of chocolate milk sold?
29
Chocolate
0
20
40
60
80
100
120
Monday Tuesday Wednesday Thursday Friday
Day
Am
ount
Sol
d
Chocolate
On what day did they have a drop in chocolate milk sales?
30
31. A variable that never changes and let us compare.
A.A. Control groupControl group
B.B. Dependent variableDependent variable
C.C. Independent variableIndependent variable
D.D. scalescale
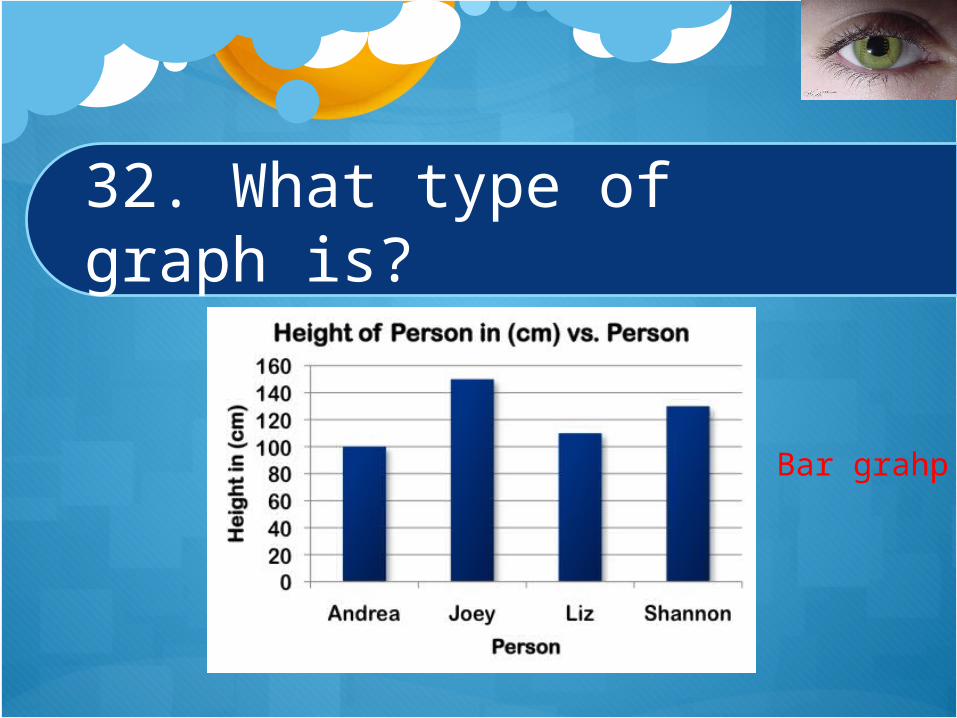
32. What type of graph is?
Bar grahp
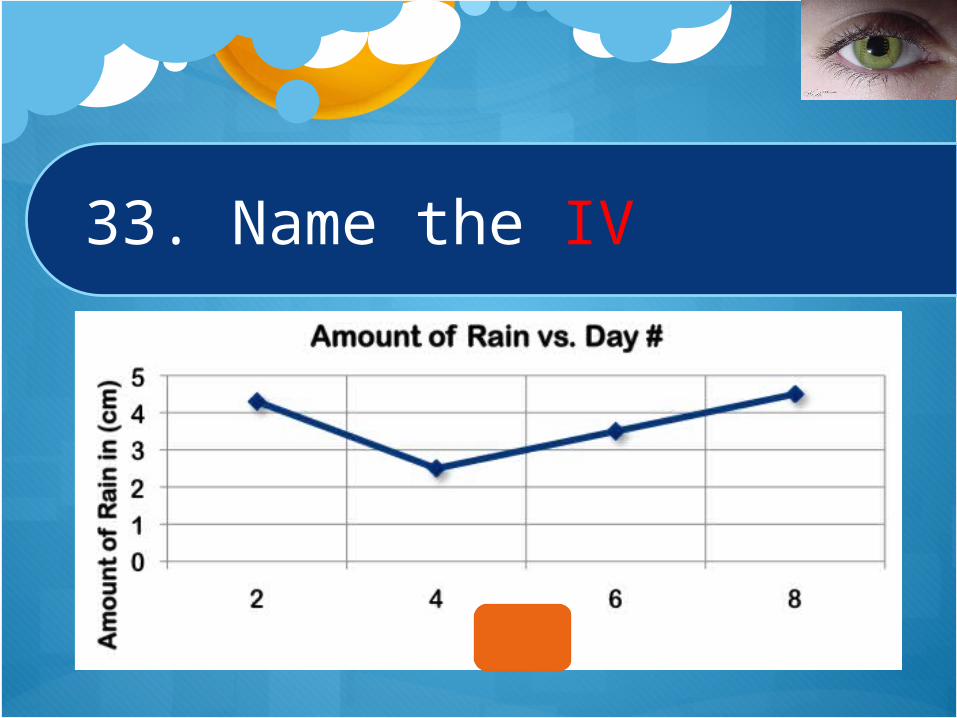
33. Name the IV
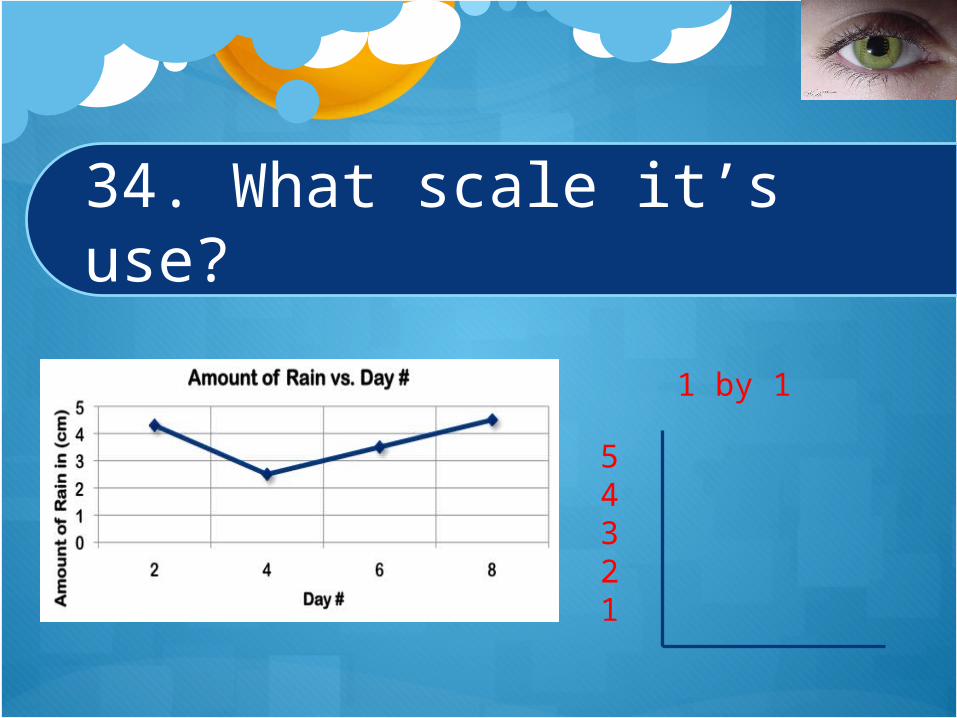
34. What scale it’s use?
1 by 1
5 4321
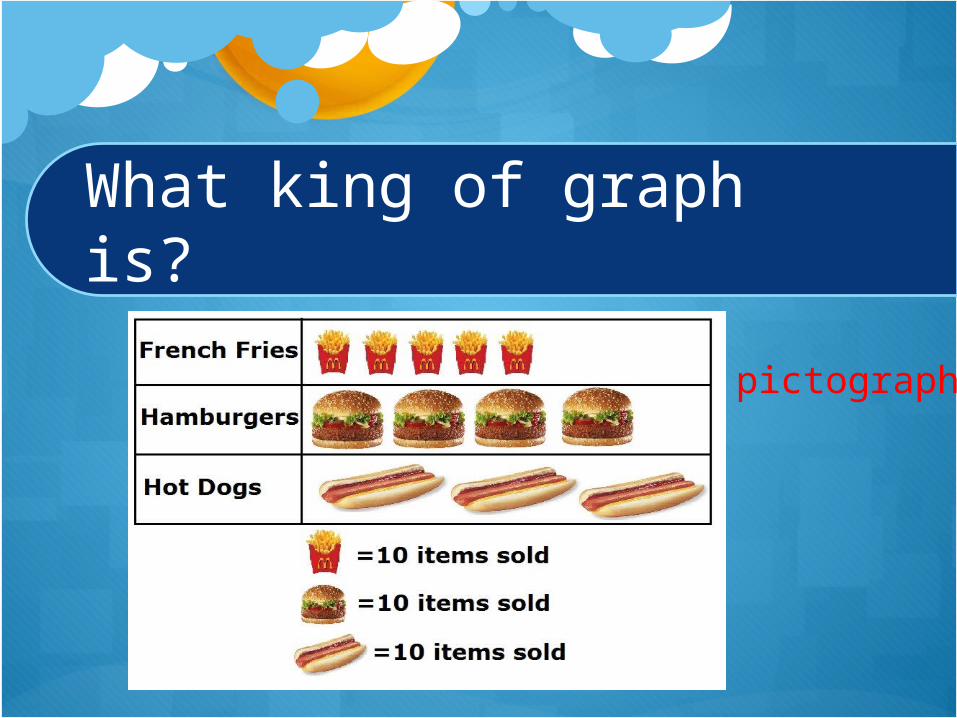
What king of graph is?
pictograph
Recommended