Project funded by the European Commission under Grant Agreement n°696656
Graphene Core 1 Graphene-Based Disruptive Technologies
Horizon 2020 RIA
WP1 Enabling Research Deliverable 1.3 “Report on Water Filtration and Gas
Separation Properties of Graphene-Based Nanocapillaries”
Main Author: Andre Geim, UNIMAN
Due date of deliverable: M18
Actual submission date: M18
Dissemination level: PU

Graphene Core 1 D1.3 4 October 2017 2/16
List of Contributors Partner Acronym Partner Name Name of the contact
6 UNIMAN University of Manchester A.K. Gem
Graphene Core 1 D1.3 4 October 2017 3/16
TABLE OF CONTENTS
List of Contributors .................................................................................................. 2
Summary ................................................................................................................... 4
Introduction ............................................................................................................... 5
1 Graphene Membranes for Water Purification and Desalination ..................... 5
1.1 Tunable Sieving of Ions Using Graphene Oxide Membranes ...............................5
1.2 Molecular Transport Through Capillaries Made with Atomic Scale Precision ....7
2 Scalable and Efficient Separation of Hydrogen Isotopes Using Graphene-Based Electrochemical Pumping ............................................................................ 9
Conclusions ............................................................................................................ 13
References .............................................................................................................. 15

Graphene Core 1 D1.3 4 October 2017 4/16
Summary Graphene and graphene oxide membranes show exceptional molecular permeation
properties, with a promise for many applications. However, up to now, their use in ion sieving
and desalination technologies was limited by a permeation cut-off of ∼9 Å, which is notably
larger than hydrated ion diameters for common salts. The cut-off is determined by the
interlayer spacing d ∼13.5 Å resulting from a swelling effect, typical for graphene oxide
laminates immersed in water. During Core1 of the Flagship, UNIMAN have developed
methods for controlling the swelling in graphene oxide membranes to achieve accurate and
tuneable ion sieving1 (see Section 1.1). Importantly, ion permeation rates decrease
exponentially with decreasing the sieve size but water transport is only weakly affected (by a
factor of <2). The latter is attributed to a low barrier for water molecules entry and large slip
lengths inside graphene capillaries. For a better understanding of how water passes such
thin capillaries, UNIMAN studied water permeation through ultimately thin (angstrom-scale)
capillaries that can be viewed as if individual atomic planes were removed from a bulk
crystal, leaving behind flat voids of a chosen height2. These capillaries were fabricated by
van der Waals assembly of graphitic flakes in conjunction with other two-dimensional crystals
as spacers in between graphitic top/bottom plates. The observed unexpectedly fast flow2, up
to 1 m/s, is attributed to high capillary pressures (∼1,000 bar) combined with a large slip
length (see Section 1.2). For channels that accommodate only a few layers of water, the flow
exhibits a marked enhancement, which we associate with an increased structural order in
nanoconfined water2. Overall, the above-listed results have demonstrated a possibility to
achieve a scalable method to obtain graphene-based membranes with limited swelling,
which exhibit 97% rejection for NaCl1.
Graphene membranes also show promise as material for the hydrogen isotopes separation.
As compared to graphene’s applications in water desalination, such applications involve
proton/deuteron transport across a single graphene monolayer. During Core 1, UNIMAN
have shown a possibility of a fully-scalable approach3, based on the use of graphene grown
by chemical vapour deposition, which allows a proton-deuteron separation factor of around 8
(see Section 2). The energy consumption for the proposed technology is projected to be
orders of magnitude smaller with respect to the existing technologies (for details, see Section
2), with a membrane based on 30 m2 of graphene, a readily accessible amount, could
provide a heavy-water output comparable to that of modern plants.

Graphene Core 1 D1.3 4 October 2017 5/16
Introduction
1 Graphene Membranes for Water Purification and Desalination
1.1 Tunable Sieving of Ions Using Graphene Oxide Membranes
Selectively permeable membranes with sub-nm pores have potential for water filtration,
molecular separation and desalination, as nanopores with sizes comparable to the diameter
D of hydrated ions are expected to show enhanced ion selectivity4. Graphene oxide (GO)5
has exceptional water permeation and molecular sieving properties6, 7, 8 as well as good
prospects for industrial scale production9, 10. Molecular permeation through GO membranes
is believed to occur along graphene channels that develop between GO sheets6, and their
sieving properties are defined by the interlayer spacing, d, which depends on the humidity of
the environment6, 7. UNIMAN research during Core 1 has demonstrated that immersing GO
membranes in liquid water leads to intercalation of 2–3 layers of water molecules between
individual GO sheets, which results in swelling and d ≈ 13.5 Å. The effective pore-size of 9 Å
in these swollen membranes (excluding the space occupied by carbon atoms) is larger than
a typical size of hydrated ions and restricts possible uses of GO for size-exclusion based ion
sieving7. A number of strategies have been tried to inhibit the swelling effect (partial reduction
of GO11, ultraviolet reduction of GO-titania hybrid membranes12, and covalent
crosslinking13,14,15). Now, UNIMAN have shown1 that by using physical confinement (Figure
1a), one can control the interlayer distance, d in the laminates, varying it from ≈ 9.8 to ≈ 6.4
Å, hence, changing ion selectivity due to dehydration effects whereas permeation of water
molecules remains largely unaffected.
Figure 1 GO membranes with tuneable interlayer spacing. (a) Schematic illustrating the direction of ion/water permeation along graphene planes. (b) PCGO membrane glued into a rectangular slot within a plastic disk of 5 cm in diameter. (c) Optical micrograph of the cross-sectional area marked by a red rectangle in (b), which shows 100-µm-thick GO laminates (black) embedded in epoxy. (d) SEM image from the marked region in (c). Scale bar, 1µm. (e) Humidity-dependent d found using X-ray diffraction.

Graphene Core 1 D1.3 4 October 2017 6/16
Measurement setup used by UNIMAN was similar to the one previously reported7: it
consisted of two Teflon compartments (feed and permeate) separated by a PCGO
membrane. Thick (≈100 µm) GO laminates were prepared by vacuum filtration of aqueous
GO solutions, as reported previously6. The laminates were cut into rectangular strips (4 mm ×
10 mm) and stored for one to two weeks at different relative humidity (RH), achieved using
saturated salt solutions6, 16. The resulting interlayer spacing, Figure 1e, was measured by X-
ray diffraction and varied from 6.4 to 9.8 Å with RH changing from zero to 100%. GO
laminates soaked in water showed d ≈ 13.7 ± 0.3 Å. Individual GO strips with desirable d
were then encapsulated and stacked together using Stycast epoxy (Figures 1b,c) to increase
the available cross-section for filtration to ∼1 mm. The embedding in epoxy was also used to
restrict swelling of GO. These epoxy-embedded GO laminates (Figure 1c), referred to as
physically confined GO (PCGO) membranes, have been glued into a slot made in either
metal or plastic plate (Figure 1b). Two sides of these stacked PCGO membranes were then
trimmed off to make sure that all the nanochannels are open (Figure 1d) for the permeation
experiments, in which ions and water molecules passed along the lamination direction as
shown in Figure 1a. The feed and permeate compartments were filled with 10 mL of a salt
solution and deionized water, respectively. Quantitative analysis of anion and cation
permeation between the compartments was carried out using ion chromatography (IC) and
inductively coupled plasma atomic emission spectroscopy (ICP-AES), respectively.
Figure 2 Tuneable ion sieving. (a) Permeation rates through PCGO membranes with different interlayer distances (colour coded). The salts used: KCl, NaCl, LiCl, CaCl2 and MgCl2. (b) Permeation rates for K+ and Na+ depend exponentially on the interlayer distance. (c) Temperature dependence for K+ permeation. Figure 2a summarises the results obtained for various ions permeating through PCGO
membranes with different interlayer spacing:
• The permeation rates and the cut-off diameter for salt permeation decrease
monotonically with decreasing d. When plotted as a function of d, the observed ion
permeation rates for Na+ and K+ showed an exponential dependence, decreasing by
two orders of magnitude as d decreased from 9.8 to 7.4 Å (Figure 2b). Membranes

Graphene Core 1 D1.3 4 October 2017 7/16
with d ≈ 6.4 Å showed no detectable ion concentration even after five days (PCGO
membranes did not swell in water over time).
• The same PCGO membranes showed only a little variation in permeation rates for
water (Figure 2b), decreasing by a factor of ≈ 2 for the same range of d. This
observation also rules out that the observed changes in ion permeation could be
related to clogging of graphene capillaries.
In a bulk solution, water molecules stabilize ions by forming concentric hydration shells. For
an ion to enter a channel with δ < D, some water molecules must be removed from the
hydration shell. The higher the ion charge, the stronger it attracts water molecules.
Accordingly, ions with larger hydration free energies and, therefore, ‘tougher’ water shells are
expected to experience larger barriers for entry into atomic-scale capillaries and
exponentially smaller permeation rates. Ions with weakly bound shells are easier to strip from
their water molecules and allow entry into nanochannels. Molecular Dynamics (MD)
simulations support the above-described mechanism of dehydration-limited ion permeation
for PCGO membranes. MD analysis yielded ≈ 97% salt rejection for the GO-Gr membranes
with a water flux of ≈ 0.5 L/m2×h. UNIMAN’s studies of permeation at different temperatures,
T (Figure 2c) agree with such a physical picture. For both channel sizes, d = 9.8 and d= 7.9
Å, the permeation rates follow the activation Arrhenius law, exp (-E/kBT), with E = 72 ± 7 and
20 ± 2 kJ/mol for K+ ion permeation through PCGO membranes with d ≈ 7.9 and 9.8 Å,
respectively.
1.2 Molecular Transport Through Capillaries Made with Atomic Scale Precision
UNIMAN have extended the top-down approach to creating nanocapillary systems17 by using
atomic flatness and atomic thinness of graphene, which has permitted them to breach the 2
nm height limit for the nanocapillary channels. The new system, Figure 3, consist of
atomically-flat top and bottom graphite crystals that are separated by an array of spacers
made using etched few-layer graphene. Such structures are fabricated by van der Waals
(vdW) assembly using dry transfer techniques18. The height h of the channel available for
molecular transport in such devices is N a where a ≈ 3.4 Å is the interlayer distance in
graphite. The newly fabricated capillaries had the same channel width w ≈ 130 nm, with
length L varied between 2 and 10 µm, and 200 of them were incorporated within each
device.

Graphene Core 1 D1.3 4 October 2017 8/16
Figure 3 Graphene capillary devices. (a) Their principal schematic. The arrow indicates the flow direction used in all the experiments. (b) Scanning electron microscopy (SEM) image of a trilayer device (top view). (c) SEM micrograph of a cross-section of another device showing an array of capillaries with h ≈ 15 nm. (d) Cross-sectional bright field image of a bilayer capillary (h ≈ 7 Å) in a scanning transmission electron microscope (STEM). (e) High angle annular dark field (HAADF) image of the channel’s edge.
He-leak tests have shown that most of the devices were open, except for monolayer
capillaries (N = 1) which never exhibited any detectable permeation. Devices with larger N
gradually deteriorated and, after several days of measurements, often became blocked due
to hydrocarbon contamination. However, when immersed in water, the capillaries showed
much greater resilience: if kept in water, the capillaries did not get blocked for months.
UNIMAN team used precision gravimetry, Figure 4, to measure weight losses from a
miniature container filled with water and sealed with a Si nitride chip incorporating a
nanocapillary device. In Figure 4, the slope of the measured curve yields the water
evaporation rate, Q, with Q studied in six devices with the same height (N = 3) but different L.
The observed dependence on L indicates that the measured evaporation rate is limited by
water flow through capillaries. Several trilayer devices show practically the same
Q ≈ 10-8 g s-1 normalized for 1 µm effective length, which translates into a flow velocity of
≈ 0.1 m s-1 for the shortest device in Figure 4b (L ̃≈ 4 µm).
UNIMAN have also investigated how the capillary flow depended on N using more than 30
different devices. Figure 5 shows that, as h decreases from ≈ 10 nm (maximum height in our
gravimetric experiments), Q also decreases, as generally expected. However, for h < 2 nm,
Q unexpectedly shoots up by more than an order of magnitude with respect to the trend
exhibited by large-N capillaries, and a profound peak appears at N = 4–5 (Figure 5b).
50 nm
Top graphite
1 µm
Hole
L
a
b
2 nm
STEM HAADF
Channel
Bilayer spacer
e
Top graphite
Bottom graphite
d
100 nm
c
SEM
Bilayer channel Top graphite
Bottom graphite
Spacer
STEM bright field
SEM
w
Graphene channels
Si nitride
Bottom graphite
Spacer Top graphite
Top graphite Bottom graphite
Channel Spacer Pt

Graphene Core 1 D1.3 4 October 2017 9/16
Figure 4 Water permeation through graphene nanocapillaries. (a) Weight loss due to water evaporation through one of our trilayer devices. Bottom inset: Optical image of this particular device that has 200 parallel channels with L ranging from 3.6 to 10.1 µm. (b), Weight loss rate, Q, measured for 6 trilayer devices with different effective L .̃
The physics behind the non-monotonic dependence Q(N) is determined by the orientation of
water molecules inside the narrow channel, prescribed by the atomically flat walls. Molecular
Dynamics (MD) simulations2 using typical parameters for water-water and water-carbon
interactions produced the Q(N) dependence shown in the inset of Figure 5b, which
qualitatively reproduces experimental findings, including the peak at small N and even its
absolute value.
Figure 5 Water flow through channels of different height. (a) Examples of gravimetric measurements for various N, at 21°C in near zero humidity, and the curves are normalized for devices’ effective length, L ̃. (b) Dependence of Q on capillary height (the data are normalized by L ̃ and also given per one channel). Inset: Flow rates found in MD simulations.
2 Scalable and Efficient Separation of Hydrogen Isotopes Using Graphene-Based Electrochemical Pumping
Separating hydrogen isotopes3 is a task of vast proportions. Over a thousand tons of heavy
water (D2O) are produced every year19 (www.hwb.gov.in/htmldocs/general/about.asp) to
supply nuclear reactors worldwide as well as for medical and research applications. The
production remains expensive for two reasons. First, the low natural abundance of deuterium
(0.015%) implies that huge amounts of water should be processed (the industry standard for
Graphene Core 1 D1.3 4 October 2017 10/16
initial enrichment is 20% of D2O)20, 21. Second, current technologies often need hundreds of
stages to achieve the required degree of separation20, 22. This means that heavy water plants
are large even compared to many chemical plants20, 21. These issues result in high capital
costs and large energy consumption20, 21. Separating tritium – hydrogen’s heaviest isotope –
is equally important and challenging, not least for its radioactivity23, 24. Nuclear reactors
produce tritium during their operation, which has to be continuously removed to ensure
optimum performance19,24. The current demand stimulates search for new separation
technologies that could provide higher separation factors, reduce the number of stages and
minimize the energy consumption.
UNIMAN’s research during FP7 stage of the Flagship has shown that while monolayers of
graphene and hexagonal boron-nitride (hBN) are impermeable to thermal atoms and
molecules25, 26 in gases and liquids, they are permeable to hydrogen nuclei: protons and
deuterons27, 28, with ability to separate protons from deuterons29. The origin of the isotope
effect was attributed to the energy barrier posed by the 2D crystals, affected the zero-point
vibrations of the nucleon, hence critically sensitive to its mass. The effective barrier is higher
for deuterons than for protons because both are bound in their initial state to Nafion or water
molecules, and zero-point oscillations at the hydrogen bond lift protons higher in energy than
deuterons29, 30, 31. This energy difference results in different rates of thermally-activated
permeation across the barrier, hence, to the isotope separation.
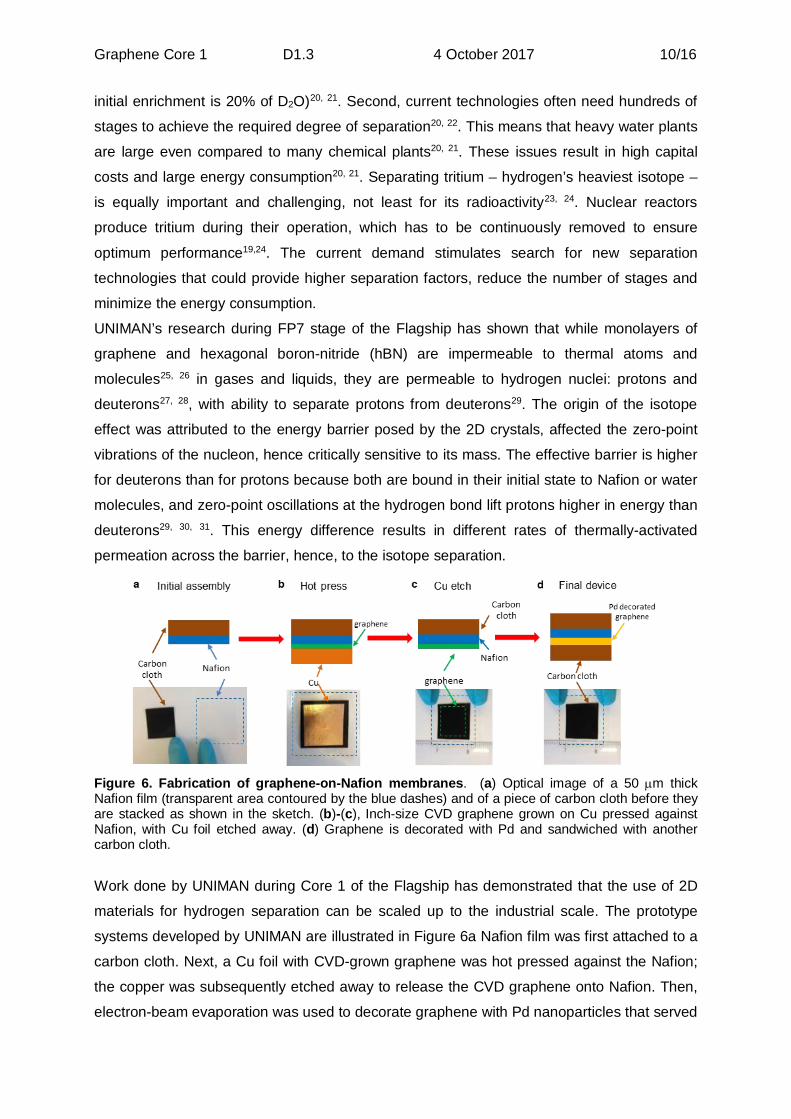
Figure 6. Fabrication of graphene-on-Nafion membranes. (a) Optical image of a 50 µm thick Nafion film (transparent area contoured by the blue dashes) and of a piece of carbon cloth before they are stacked as shown in the sketch. (b)-(c), Inch-size CVD graphene grown on Cu pressed against Nafion, with Cu foil etched away. (d) Graphene is decorated with Pd and sandwiched with another carbon cloth.
Work done by UNIMAN during Core 1 of the Flagship has demonstrated that the use of 2D
materials for hydrogen separation can be scaled up to the industrial scale. The prototype
systems developed by UNIMAN are illustrated in Figure 6a Nafion film was first attached to a
carbon cloth. Next, a Cu foil with CVD-grown graphene was hot pressed against the Nafion;
the copper was subsequently etched away to release the CVD graphene onto Nafion. Then,
electron-beam evaporation was used to decorate graphene with Pd nanoparticles that served

Graphene Core 1 D1.3 4 October 2017 11/16
as a catalyst to increase graphene’s hydrogen isotope transparency27, 29. Finally, graphene
was covered with another carbon cloth, both to prevent its accidental damage and to
electrically contact graphene over the entire area. In these systems, graphene coverage was
∼ 95%, and scanning electron microscopy and Raman spectroscopy showed that the transfer
did not introduce any significant amount of microscopic defects. The size of the tested
membranes was about 1 square inch.
Figure 7 Characterization of isotope separation by electrochemical pumping using CVD-graphene on Nafion. (a) Schematic of measurement setup. (b) Gas molar fractions in the permeate, detected by mass spectrometry. (c) Hydrogen H1 in the permeate as a function of its concentration in the feed. Symbols: Different colours correspond to three devices. (d) H2 flux (throughput per unit area) as a function of electric current.
The permeability of protons and deuterons across the graphene-on-Nafion membranes was
studied using mass spectrometry29. To this end, the membranes were placed between two
chambers, feed and permeate, and the two carbon cloths were electrically contacted as
shown in Figure 7a. In the feed, we a large volume of vapour-gas mixtures of H2O-H2 and
D2O-D2 was placed, with a chosen atomic fraction of hydrogen (H1); this fraction remained
fixed during a given measurement and could be changed as required. The opposite side of
the membrane faced a vacuum chamber connected to a mass spectrometer. This setup
represents an electrochemical pump32 explained in Figure 7a. By applying a voltage bias
across the device, one can pump protons and deuterons through Nafion and across
graphene. These isotopes recombine on the permeate side to form three possible molecular
species – H2, D2 HD – which are detected by the mass spectrometer, with the simultaneously

Graphene Core 1 D1.3 4 October 2017 12/16
measured electrical current through the circuit and the gas flux (throughput per unit area) for
each of the gases29.
There are two key characteristics to monitor in these measurements: isotope selectivity and
hydrogen throughput. Figure 7b shows the molar fraction of the three gases in the permeate
(H2, D2 and HD) for different atomic fractions of in the feed. The data for the permeated
gases can be converted directly into H1 atomic fractions. The latter are plotted in Figure 7c as
a function of H1on fraction in the feed and show that the membranes preferentially allow
protons through. For example, for equal amounts of H1 and deuterium (H2) in the feed (50%
H atomic fraction), H1 accounts for up to ≈90% of atoms in the permeate. It is worth
mentioning that the isotopes are electrochemically pumped mostly across the areas covered
with graphene, because the latter provides the electrical contact necessary for the pump
operation. The second key characteristic of electrochemical pumping is its throughput (flux
times area A) which for potential applications needs to be as high as possible. Figure 7d
shows the measured gas flux Φ as a function of the electric current I through our devices.
The dependence is accurately described by Faraday’s law of electrolysis Φ = I/2FA, where F
is Faraday’s constant and the factor of 2 accounts for two atoms in each H2 molecule. This
means that we reached 100% Faradaic efficiency for converting electron current into
hydrogen flux. For a biases V ≲1.5 V used by UNIMAN, both I and Φ varied linearly with V
(see Figure 7d inset). The measured flux is quite significant and, for example, at 0.5 V our
electrochemical pump provided a throughput of ∼0.8 mmol h-1 cm-2. If a membrane with an
area of 30 m2 is employed, this would translate into ∼50,000 m3 of processed gas mixtures
per year (at standard temperature and pressure) or, equivalently, ∼40 tons of heavy water
pa. The latter number is comparable with a typical annual output of existing heavy-water
production plants19.
Figure 8 Comparison of the electrochemical pumping with other technologies available for heavy water production.

Graphene Core 1 D1.3 4 October 2017 13/16
For the known throughput and separation factor, it is straightforward to estimate the energy
needed to enrich hydrogen with the natural deuterium concentration of 0.015% up to 20%
required for primary heavy water production20, 22. Despite the slight decrease in the
separation factor with respect to the maximum achievable ⍺ ~10 for ideal graphene at room
temperature29, ⍺ ~8 is still high enough to minimize the amount of feed that needs to be
processed. Using the Rayleigh equation33, we find that it is required to process ~3800 moles
of hydrogen feed per mole of enriched product. The total power P required is given by P = IV.
Therefore, with an operational voltage of ~0.5 V, the power density (p=P/A) per unit of gas
flux is given by p/Φ=2FV ~ 26 Wh mol-1 which depends only on the applied voltage, in
agreement with the data in Figure 7d. This allows for the estimate that graphene-based
electrochemical pumping would involve energy costs of E ~20 GJ per kg of 20% enriched
heavy water.
Overall, the demonstrated electrochemical pumping offers a large separation factor,
extremely low energy costs, potentially small footprint, competitive throughput and rather
straightforward design of industrial scale facilities. It is instructive to compare the proposed
technology with those either currently employed or considered for heavy water production.
The situation is summarized in Figure 8. It shows that the new graphene-based technology
occupies a highly desirable and previously empty corner within the parameter space (E, ⍺).
The most utilized technologies today are the Girdler-Sulfide (GS) and monothermal-NH3/H2
processes19. They are characterized by ⍺ ∼1.3 and 6, respectively, and both require E∼30 GJ
kg-1. Our electrochemical pumping exhibits (E, ⍺) = (∼20 GJ kg-1, ∼8), outperforming all the
other technologies. Moreover, the above estimate for E was rather conservative, so we
believe that the energy costs can be reduced by at least an order of magnitude by a number
of design changes. For example, the operating temperature can be increased to 60℃, which
would result in an exponential increase in graphene’s proton conductivity; by a factor of 10 as
proven in previous experiments27,29. This should lead to an equivalent reduction in E (see the
red arrow in Figure 8). The separation factor would also decrease but only to ≈7 29, which
would translate only into an increase of ~20% in the amount of feed.
Conclusions Overall, during this project the group has demonstrated that graphene and graphene oxide
membranes are versatile materials for making systems for filtration of water and hydrogen-
isotope separation1, 2, 3. Scalable fabrication of the membranes suitable for the proposed new
technologies requires taking this research to higher technology readiness levels, and the
whole direction will benefit from moving the development of graphene-based membranes for
desalination and isotopic separation to WP13 for in Core 2 of the Flagship. At the same time,

Graphene Core 1 D1.3 4 October 2017 14/16
there are many questions to be explored at the level of fundamental science, which should
not be ignored. In particular, one can also alter chemical and physical characteristics of
capillaries discussed in Section 1.2 using different atomically flat crystals for channel walls
(for example, change their hydrophilicity or electrical properties), or employ different 2D
materials (such as hBN) for separation of protons and deuterons. On top of this, the new
technology may be even more attractive for tritium decontamination and extraction. The
identified mechanism behind proton-deuteron sieving implies a separation factor of ≈30 for
H1 - H3 (tritium) separation29, in stark contrast with cryogenic distillation which offers a
separation factor of ≲1.8 for this process23.

Graphene Core 1 D1.3 4 October 2017 15/16
References 1 Jijo Abraham, et al Tunable sieving of ions using graphene oxide membranes, Nature Nanotechnology 12, 546–550 (2017) 2 B. Radha, et al Molecular transport through capillaries made with atomic-scale precision. Nature 538, 222–225 (2016) 3 M. Lozada-Hidalgo et al, Scalable and efficient separation of hydrogen isotopes using graphene-based electrochemical pumping, Nature Communications 8, 5215 (2017) 4 Sahu, S., Ventra, M. D. & Zwolak, M. Dehydration as a universal mechanism for ion selectivity in graphene and other atomically thin pores. Nano Letters, 17(8), 4719–4724 (2017). 5 Dreyer, D. R., Park, S., Bielawski, C. W. & Ruoff, R. S. The chemistry of graphene oxide. Chem. Soc. Rev. 39, 228-240 (2010). 6 Nair, R. R., Wu, H. A., Jayaram, P. N., Grigorieva, I. V. & Geim, A. K. Unimpeded permeation of water through helium-leak-tight graphene-based membranes. Science 335, 442-444 (2012). 7 Joshi, R. K. et al. Precise and ultrafast molecular sieving through graphene oxide Membranes. Science 343, 752-754 (2014). 8 Sun, P. Z., Wang, K. L. & Zhu, H. W. Recent developments in graphene-based membranes: Structure, mass-transport mechanism and potential applications. Adv. Mater. 28, 2287-2310 (2016). 9 Akbari, A. et al. Large-area graphene-based nanofiltration membranes by shear alignment of discotic nematic liquid crystals of graphene oxide. Nature Communications 7, 10891 (2016). 10 Liu, G. P., Jin, W. Q. & Xu, N. P. Graphene-based membranes. Chem. Soc. Rev. 44, 5016-5030 (2015). 11 Liu, H. Y., Wang, H. T. & Zhang, X. W. Facile fabrication of freestanding ultrathin reduced graphene oxide membranes for water purification. Adv. Mater. 27, 249-254 (2015). 12 Sun, P. Z. et al. Highly efficient quasi-static water desalination using monolayer graphene oxide/titania hybrid laminates. NPG Asia Mater. 7, e162 (2015). 13 Hu, M. & Mi, B. X. Enabling graphene oxide nanosheets as water separation membranes. Environ. Sci. Technol. 47, 3715-3723 (2013). 14 Hung, W. S. et al. Cross-linking with diamine monomers to prepare composite graphene oxide-framework membranes with varying d-spacing. Chem. Mater. 26, 2983-2990 (2014). 15 Zhang, Y., Zhang, S. & Chung, T. S. Nanometric graphene oxide framework membranes with enhanced heavy metal removal via nanofiltration. Environ. Sci. Technol. 49, 10235-10242 (2015). 16 Greenspan, L. Humidity fixed-points of binary saturated aqueous-solutions. J. Res. Natl. Bur. Stand. Sect. A 81, 89-96 (1977). 17 Duan, C. & Majumdar, A. Anomalous ion transport in 2-nm hydrophilic nanochannels. Nature Nanotechnology (2010), 5, 848-852. 18 Geim, A. K. & Grigorieva, I. V. Van der Waals heterostructures. Nature (2013), 499, 419-425. 19 International Atomic Energy Agency. Heavy water reactors : status and project development. International Atomic Energy Agency. Technical reports series, no. 407 (2002). 20 Rae, H. K. Separation of Hydrogen Isotopes, Selecting Heavy Water Processes. (Am. Chem. Soc. 1978). 21 Miller, A. I. Heavy Water: A Manufacturers’ Guide for the Hydrogen Century. Can. Nucl. Soc. Bull. 22, 1–14 (2001). 22 Morris, J. W., Bebbington, W. P., Garvin, R. G. & Schroder, M. C. Heavy Water for the Savannah River Site. Proc. Symp. Savannah River Site 50th Anniv. (2000). 23 Vasaru, G. Tritium Isotope Separation. (CRC Press, 1993).
Graphene Core 1 D1.3 4 October 2017 16/16
24 International Atomic Energy Agency. Handling of Tritium-Bearing Wastes, Technical Report Series No. 203, (1981). 25 Bunch, J. S. et al. Impermeable atomic membranes from graphene sheets. Nano Letters 8, 2458–2462 (2008). 26 Koenig, S. P., Wang, L., Pellegrino, J. & Bunch, J. S. Selective molecular sieving through porous graphene. Nature Nanotechnology 7, 728–32 (2012). 27 Hu, S. et al. Proton transport through one-atom-thick crystals. Nature 516, 227–230 (2014). 28 Achtyl, J. L. et al. Aqueous proton transfer across single-layer graphene. Nature Communications 6, 6539 (2015) 29 Lozada-Hidalgo, M. et al. Sieving hydrogen isotopes through two-dimensional crystals. Science 351, 68–70 (2016). 30 Marx, D. Proton transfer 200 years after von Grotthuss: insights from ab initio simulations. Chemphyschem 7 (9), 1848–1870 (2006). 31 Wiberg, K. B. The deuterium isotope effect. Chem. Rev. 55, 713–743 (1955). 32 Iwahara, H. Hydrogen pumps using proton-conducting ceramics and their applications. Solid State Ionics 125, 271–278 (1999). 33 Gorak, A. & Sorensen, E. Distillation: Fundamentals and Principles. (Elsevier, 2014).
Recommended