Grade 10 ScienceGrade 10 Science
Motion UnitMotion Unit
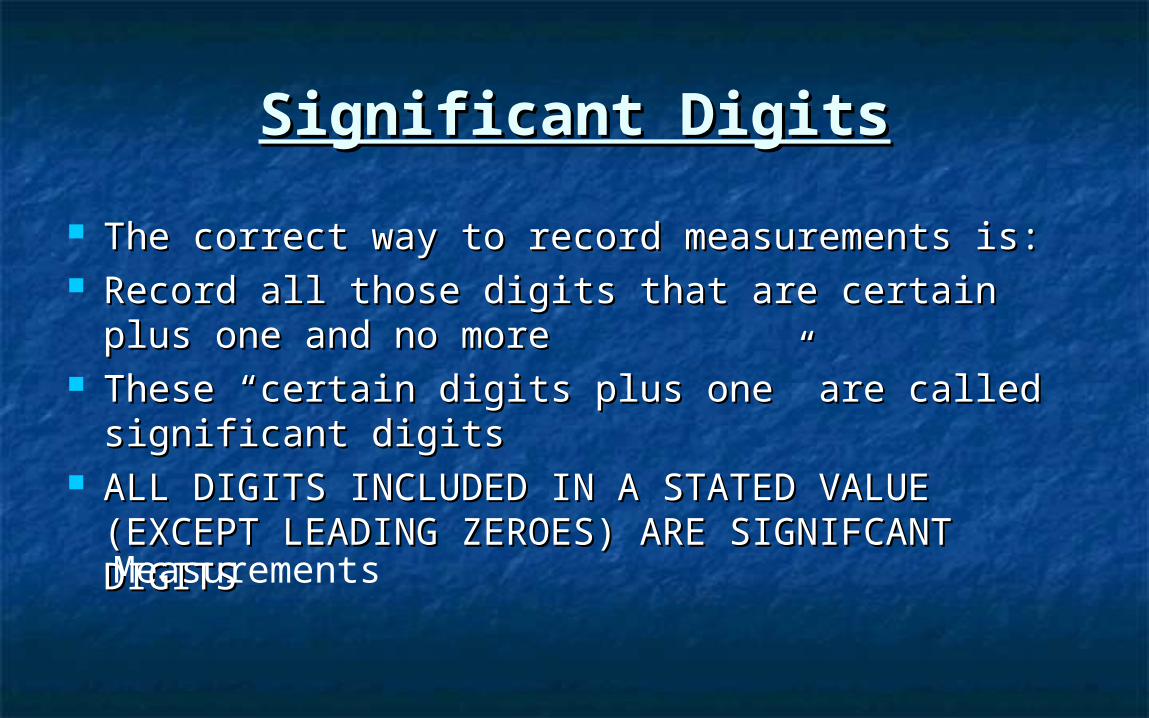
Significant DigitsSignificant Digits
The correct way to record measurements is:The correct way to record measurements is: Record all those digits that are certain plus one and Record all those digits that are certain plus one and
no moreno more These “certain digits plus one” are called significant These “certain digits plus one” are called significant
digitsdigits ALL DIGITS INCLUDED IN A STATED VALUE (EXCEPT ALL DIGITS INCLUDED IN A STATED VALUE (EXCEPT
LEADING ZEROES) ARE SIGNIFCANT DIGITSLEADING ZEROES) ARE SIGNIFCANT DIGITSMeasurements
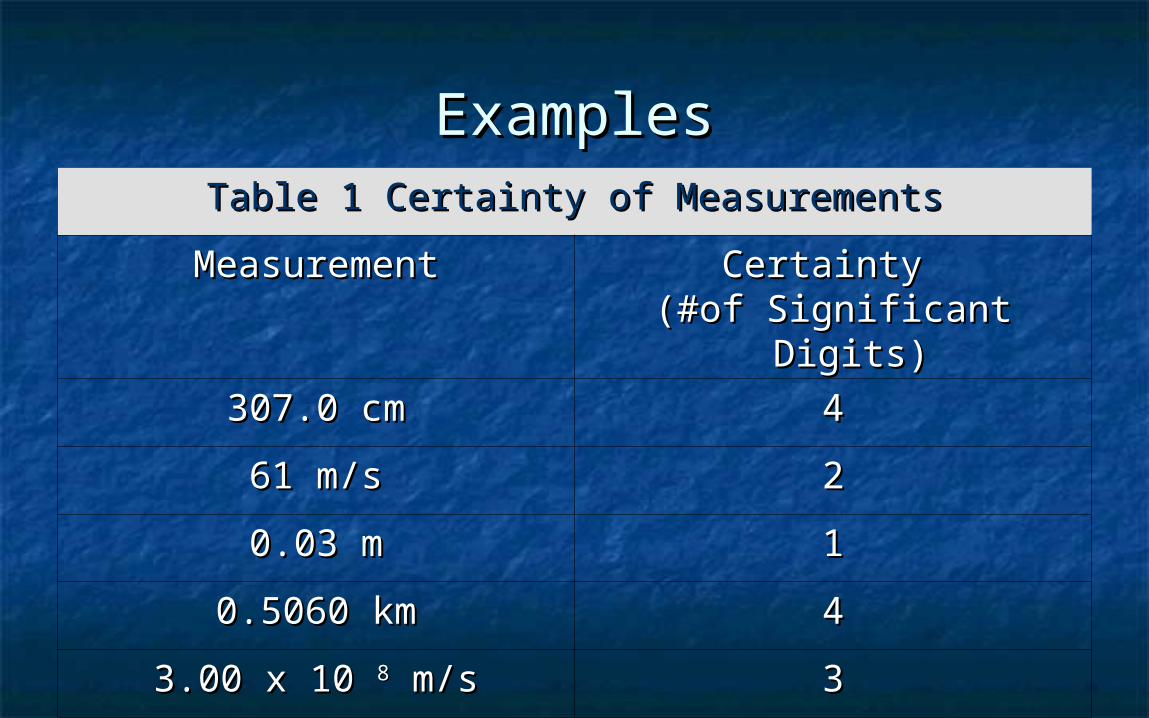
ExamplesExamplesTable 1 Certainty of MeasurementsTable 1 Certainty of Measurements
MeasurementMeasurement Certainty Certainty (#of Significant Digits)(#of Significant Digits)
307.0 cm307.0 cm 44
61 m/s61 m/s 22
0.03 m0.03 m 11
0.5060 km0.5060 km 44
3.00 x 10 3.00 x 10 88 m/s m/s 33
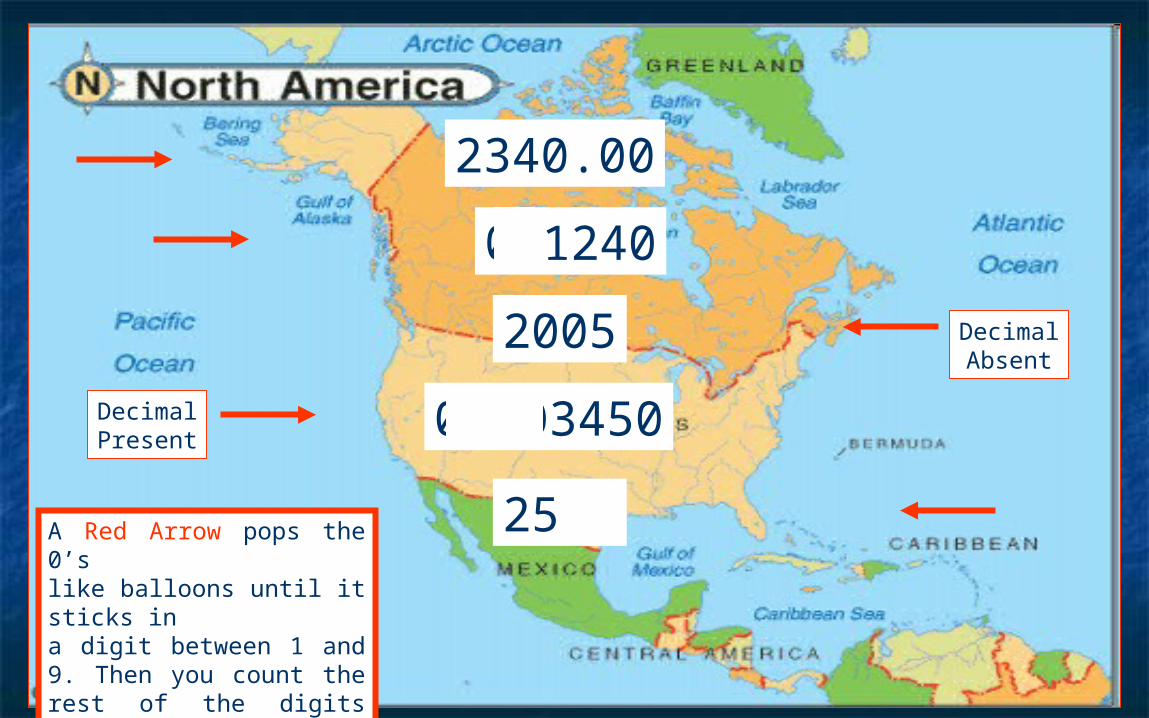
DecimalPresent
DecimalAbsent
0.1240
2005
0.003450
2500
2340.00
A Red Arrow pops the 0’slike balloons until it sticks ina digit between 1 and 9. Then you count the rest of the digits that are left.
Counted and Exact ValuesCounted and Exact Values
When you count the number of something When you count the number of something (example – students in the class), this is an exact (example – students in the class), this is an exact value and has an infinite number of significant value and has an infinite number of significant digits.digits.
When you use a defined value such as 100 When you use a defined value such as 100 cm/m or 60 s/min, you also have an infinite number cm/m or 60 s/min, you also have an infinite number of significant digits.of significant digits.
Note the calculation rules on BLM 9.2BNote the calculation rules on BLM 9.2B
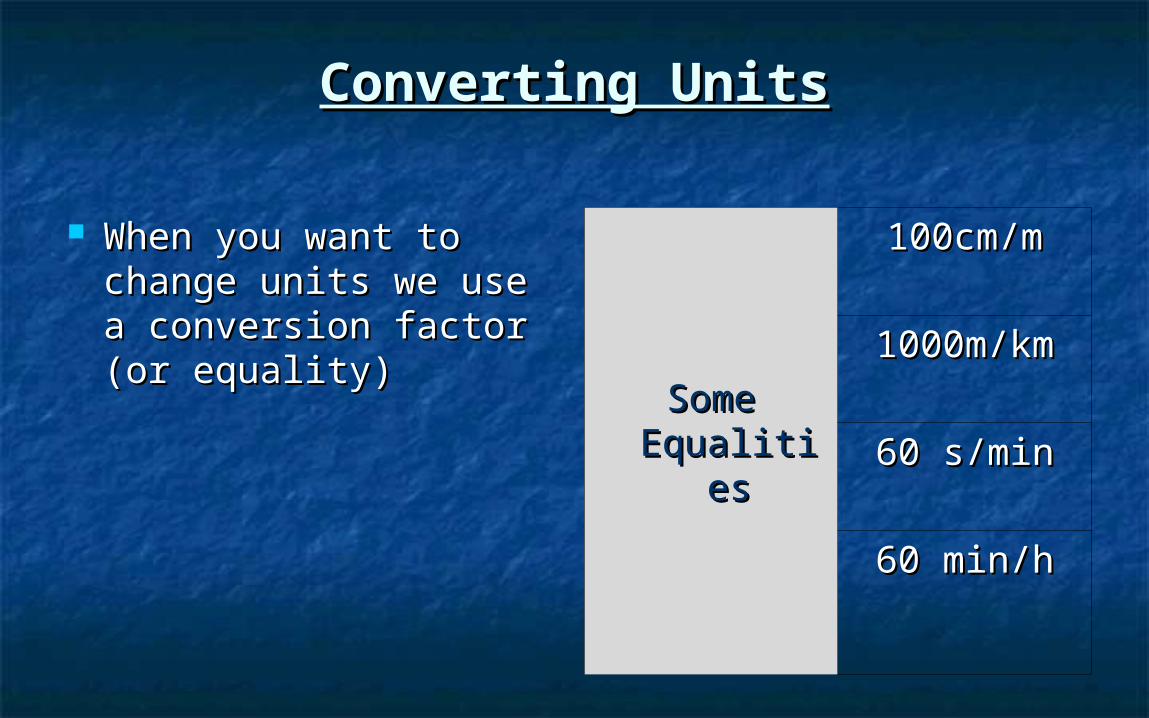
Converting UnitsConverting Units
When you want to When you want to change units we use a change units we use a conversion factor (or conversion factor (or equality)equality)
Some Some EqualitiesEqualities
100cm/m100cm/m
1000m/km1000m/km
60 s/min60 s/min
60 min/h60 min/h
Assignment : Significant Digits Assignment : Significant Digits
BLM 9.2a, 9.2b Complete the Significant Digits Worksheet Complete the Significant Digits Worksheet
See answer keySee answer key Questions 1-6, 9 pg 349 in your textQuestions 1-6, 9 pg 349 in your text
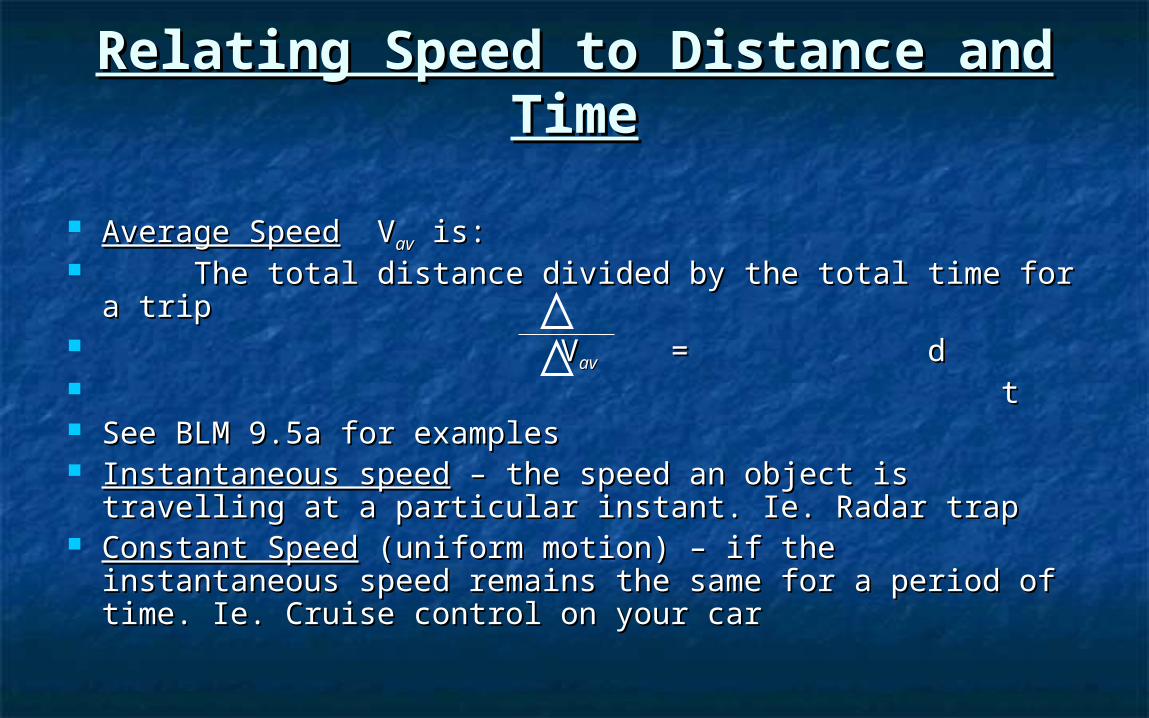
Relating Speed to Distance and Relating Speed to Distance and TimeTime
Average SpeedAverage Speed V Vavav is: is: The total distance divided by the total time for a tripThe total distance divided by the total time for a trip VVavav = d = d tt See BLM 9.5a for examplesSee BLM 9.5a for examples Instantaneous speedInstantaneous speed – the speed an object is travelling at a – the speed an object is travelling at a
particular instant. Ie. Radar trapparticular instant. Ie. Radar trap Constant SpeedConstant Speed (uniform motion) – if the instantaneous (uniform motion) – if the instantaneous
speed remains the same for a period of time. Ie. Cruise speed remains the same for a period of time. Ie. Cruise control on your carcontrol on your car
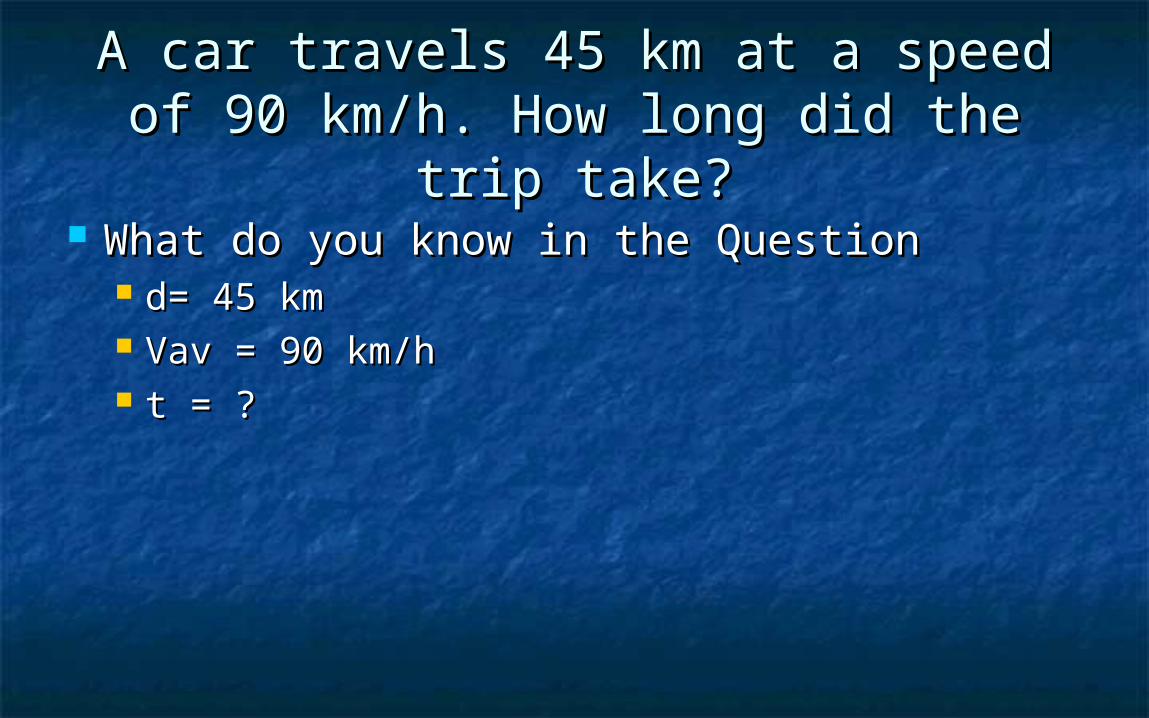
A car travels 45 km at a speed of 90 A car travels 45 km at a speed of 90 km/h. How long did the trip take?km/h. How long did the trip take?
What do you know in the QuestionWhat do you know in the Question d= 45 km d= 45 km Vav = 90 km/hVav = 90 km/h t = ?t = ?
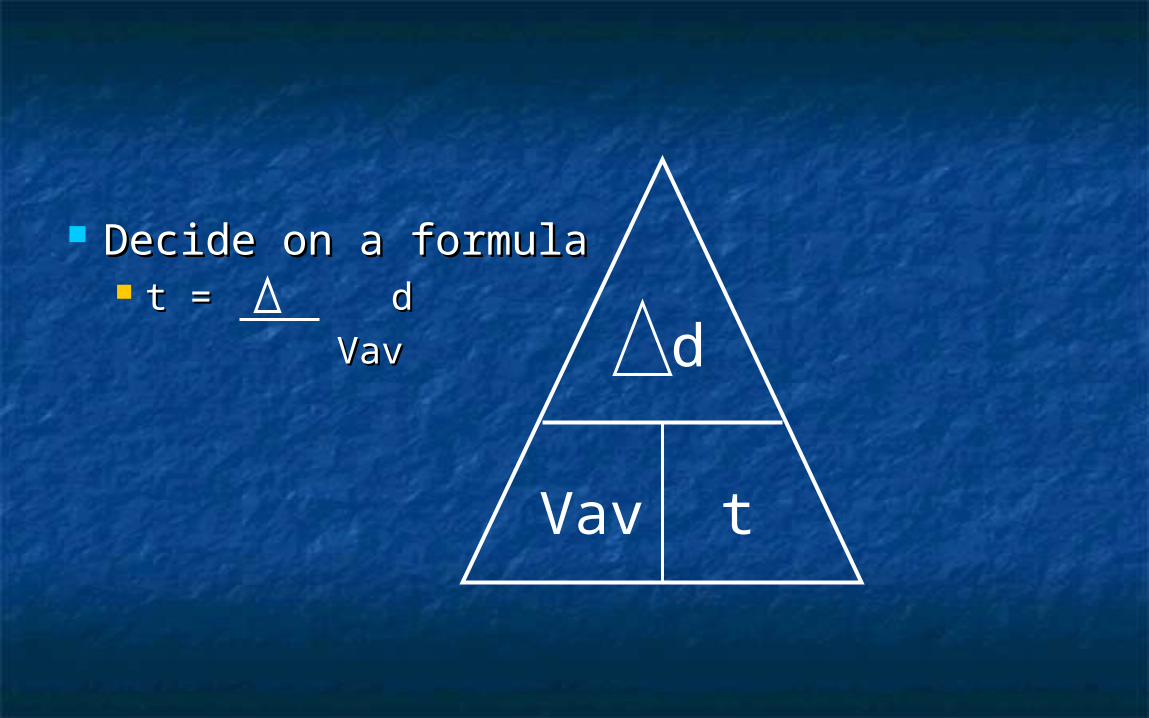
Decide on a formulaDecide on a formula t = dt = d
VavVav
t
d
Vav
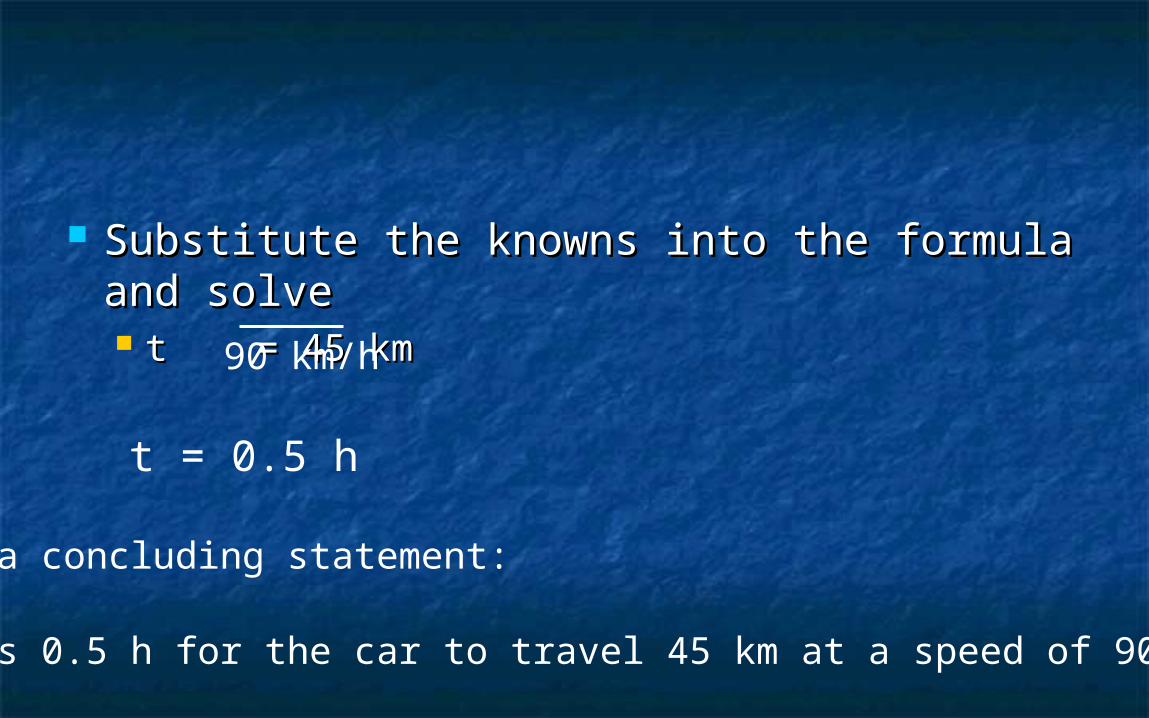
Substitute the knowns into the formula and Substitute the knowns into the formula and solvesolve t = 45 kmt = 45 km90 km/h
t = 0.5 h
•Write a concluding statement:
It takes 0.5 h for the car to travel 45 km at a speed of 90 km/h
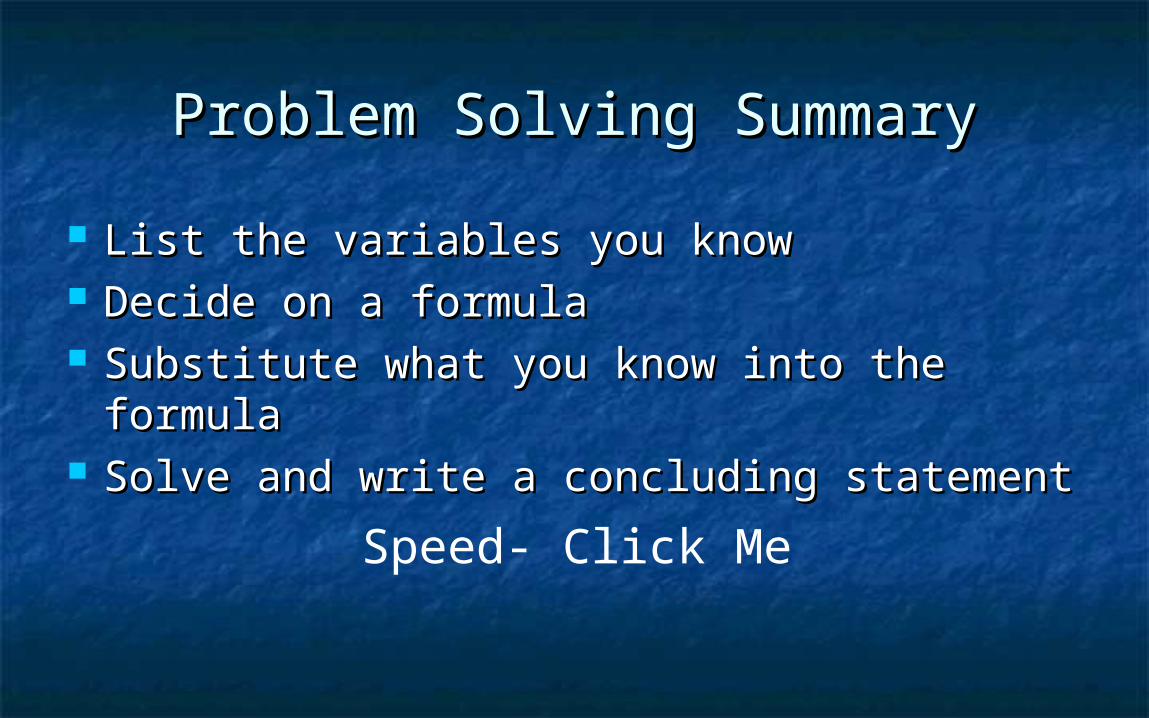
Problem Solving SummaryProblem Solving Summary
List the variables you knowList the variables you know Decide on a formula Decide on a formula Substitute what you know into the formulaSubstitute what you know into the formula Solve and write a concluding statementSolve and write a concluding statement
Speed- Click Me
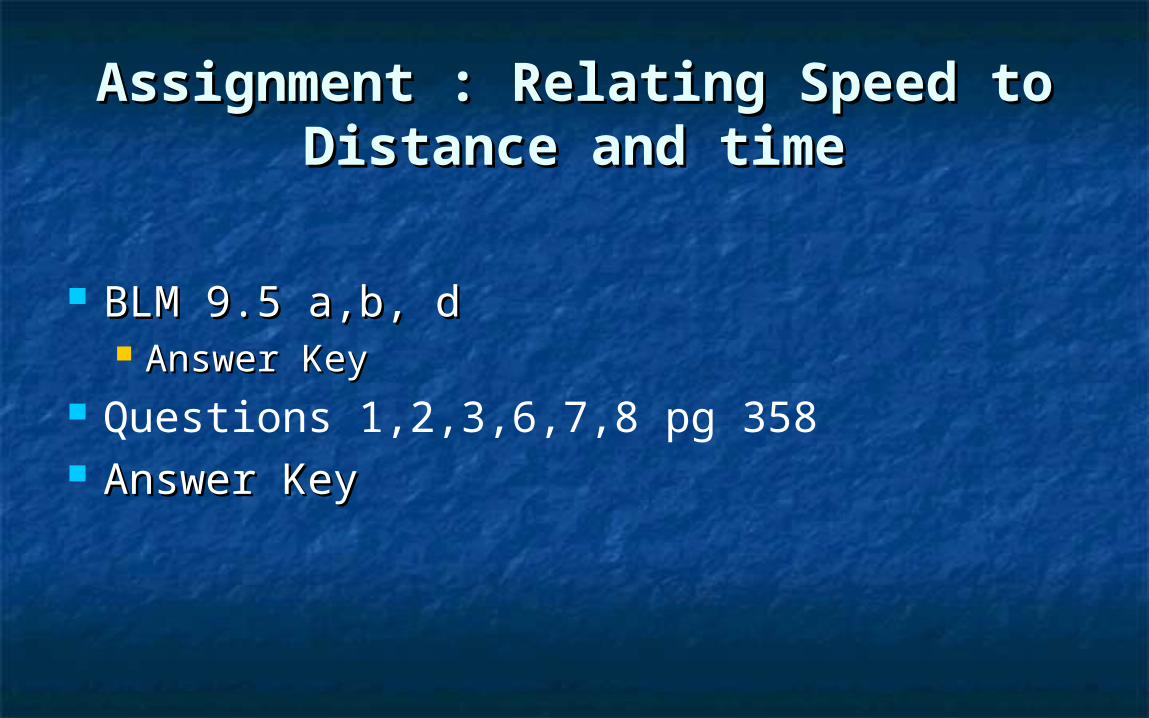
Assignment : Relating Speed to Assignment : Relating Speed to Distance and timeDistance and time
BLM 9.5 a,b, dBLM 9.5 a,b, d Answer KeyAnswer Key
Questions 1,2,3,6,7,8 pg 358 Answer KeyAnswer Key
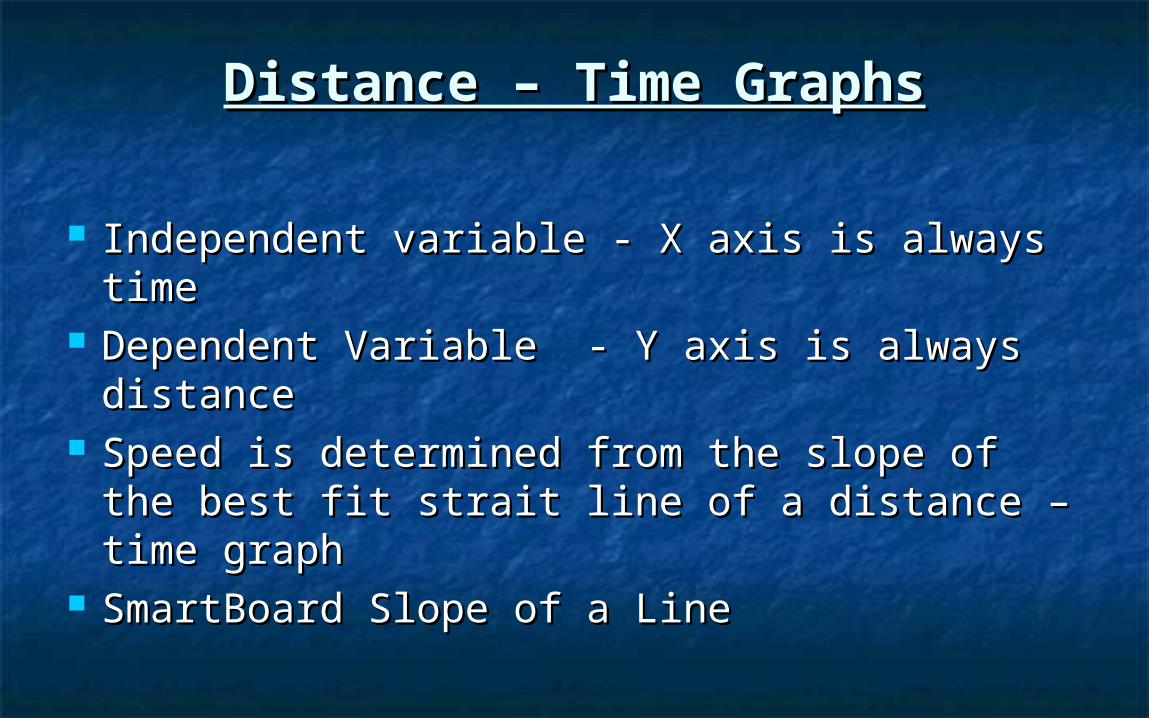
Distance – Time GraphsDistance – Time Graphs
Independent variable - X axis is always timeIndependent variable - X axis is always time Dependent Variable - Y axis is always Dependent Variable - Y axis is always
distancedistance Speed is determined from the slope of the Speed is determined from the slope of the
best fit strait line of a distance – time graphbest fit strait line of a distance – time graph SmartBoard Slope of a LineSmartBoard Slope of a Line
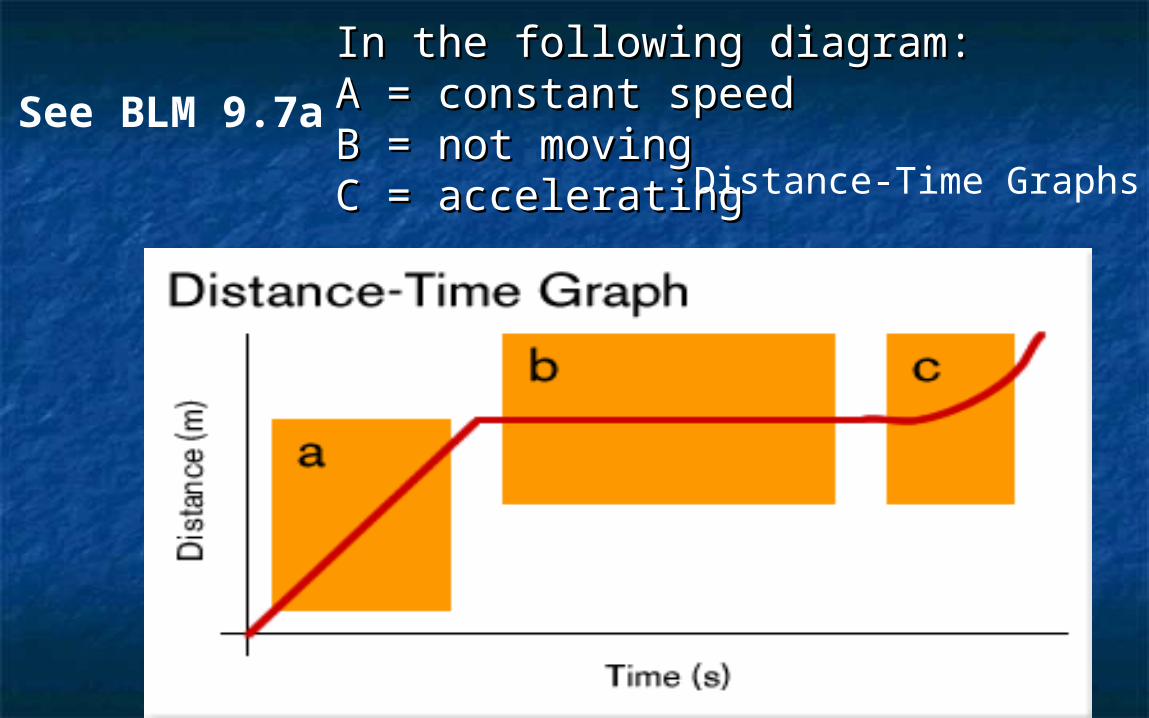
See BLM 9.7a
In the following diagram: In the following diagram: A = constant speedA = constant speedB = not movingB = not movingC = acceleratingC = accelerating Distance-Time Graphs
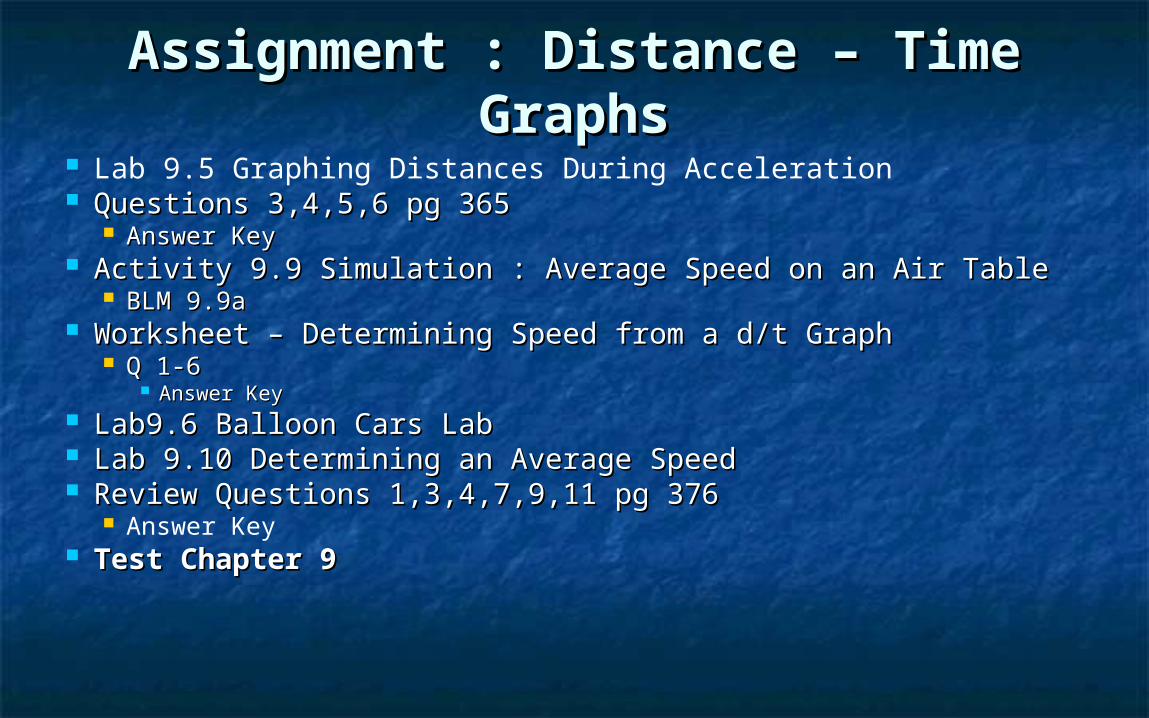
Assignment : Distance – Time Assignment : Distance – Time GraphsGraphs
Lab 9.5 Graphing Distances During Acceleration Questions 3,4,5,6 pg 365Questions 3,4,5,6 pg 365
Answer KeyAnswer Key Activity 9.9 Simulation : Average Speed on an Air TableActivity 9.9 Simulation : Average Speed on an Air Table
BLM 9.9aBLM 9.9a Worksheet – Determining Speed from a d/t GraphWorksheet – Determining Speed from a d/t Graph
Q 1-6Q 1-6 Answer KeyAnswer Key
Lab9.6 Balloon Cars LabLab9.6 Balloon Cars Lab Lab 9.10 Determining an Average SpeedLab 9.10 Determining an Average Speed Review Questions 1,3,4,7,9,11 pg 376Review Questions 1,3,4,7,9,11 pg 376
Answer Key Test Chapter 9Test Chapter 9
Chapter 11 Displacement and Chapter 11 Displacement and VelocityVelocity
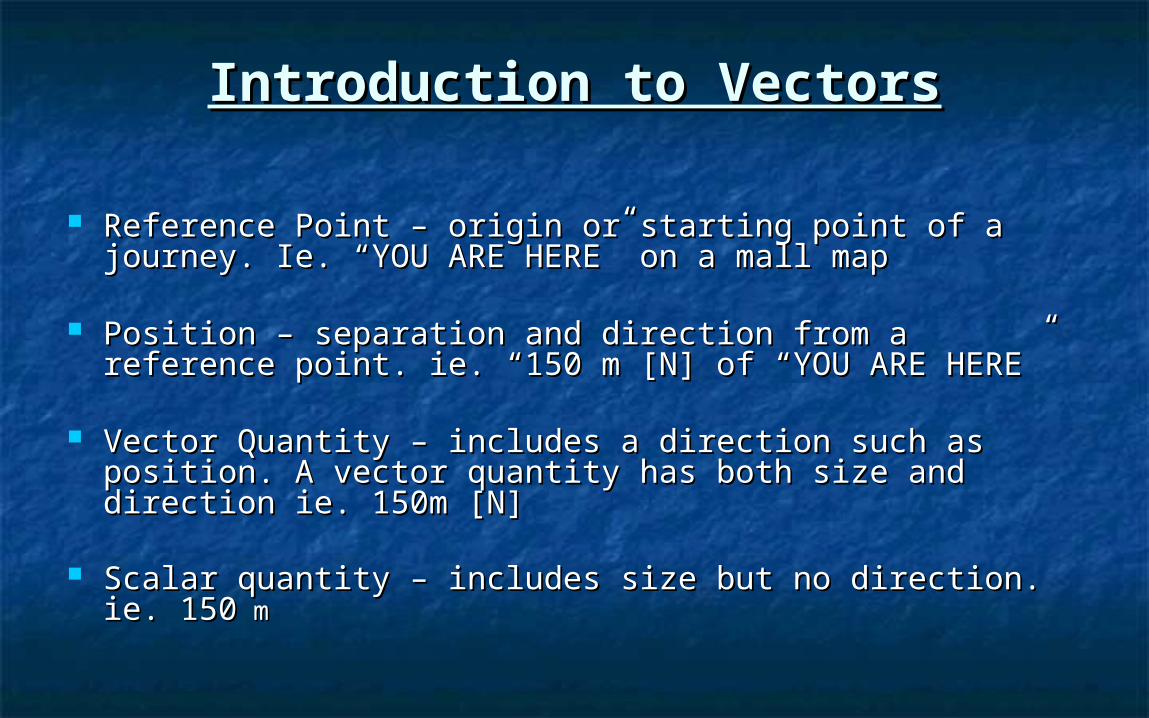
Introduction to VectorsIntroduction to Vectors
Reference Point – origin or starting point of a journey. Ie. Reference Point – origin or starting point of a journey. Ie. “YOU ARE HERE” on a mall map“YOU ARE HERE” on a mall map
Position – separation and direction from a reference point. Position – separation and direction from a reference point. ie. “150 m [N] of “YOU ARE HERE”ie. “150 m [N] of “YOU ARE HERE”
Vector Quantity – includes a direction such as position. A Vector Quantity – includes a direction such as position. A vector quantity has both size and direction ie. 150m [N]vector quantity has both size and direction ie. 150m [N]
Scalar quantity – includes size but no direction. ie. 150Scalar quantity – includes size but no direction. ie. 150 m m
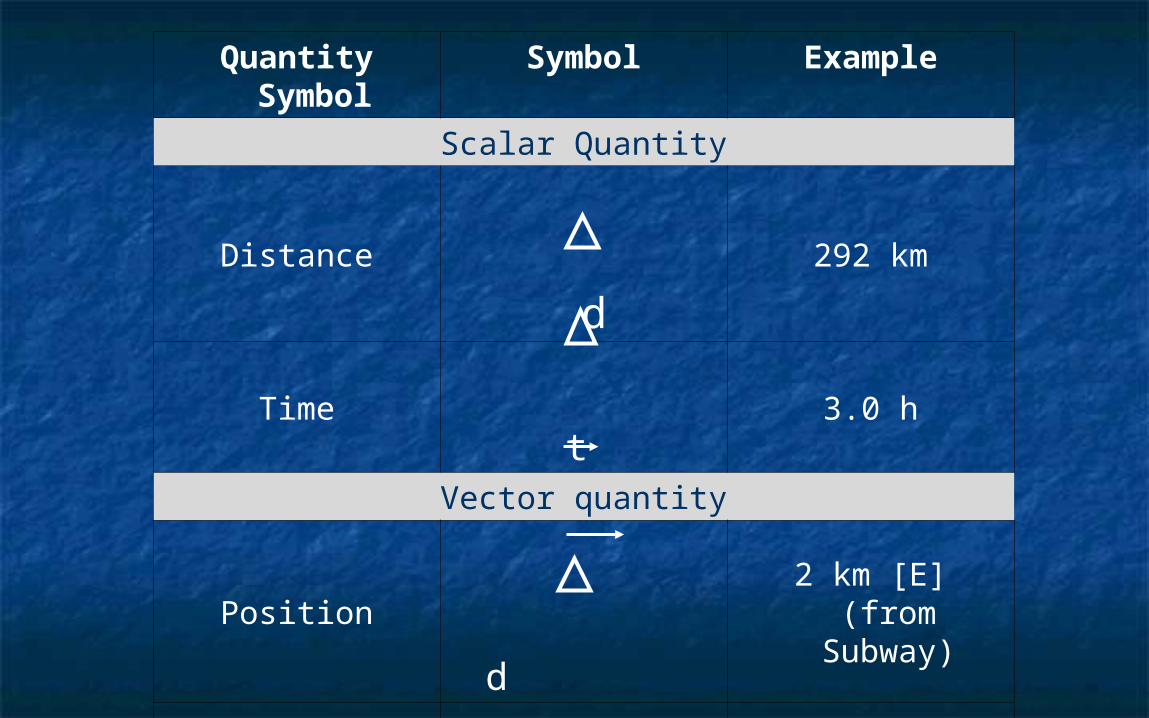
Quantity SymbolSymbol Example
Scalar Quantity
Distance
d 292 km
Time t
3.0 h
Vector quantity
Position d
2 km [E] (from Subway)
Displacement
d 292 km [S]
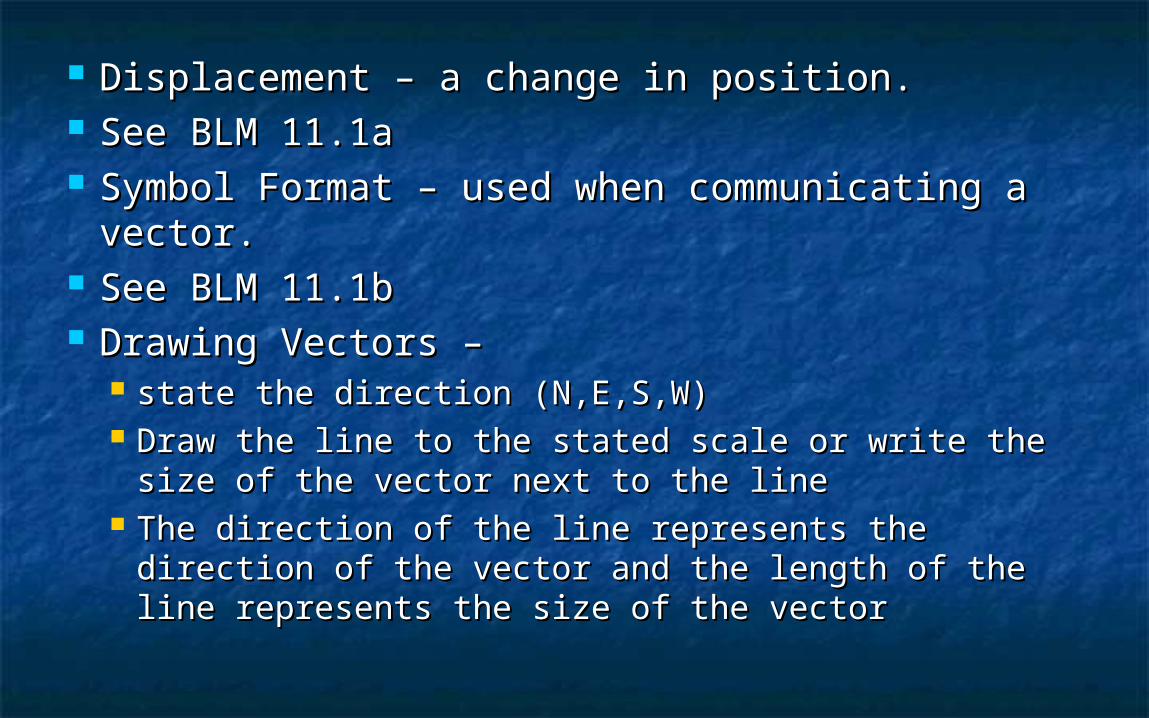
Displacement – a change in position. Displacement – a change in position. See BLM 11.1aSee BLM 11.1a Symbol Format – used when communicating a Symbol Format – used when communicating a
vector. vector. See BLM 11.1bSee BLM 11.1b Drawing Vectors – Drawing Vectors –
state the direction (N,E,S,W)state the direction (N,E,S,W) Draw the line to the stated scale or write the size of Draw the line to the stated scale or write the size of
the vector next to the linethe vector next to the line The direction of the line represents the direction of The direction of the line represents the direction of
the vector and the length of the line represents the the vector and the length of the line represents the size of the vectorsize of the vector
Assignment : Introduction to VectorsAssignment : Introduction to Vectors
Questions 1,5,6,7,8 pg 417Questions 1,5,6,7,8 pg 417 Walk the Graph Activity pg 418 & BLM 11.2Walk the Graph Activity pg 418 & BLM 11.2
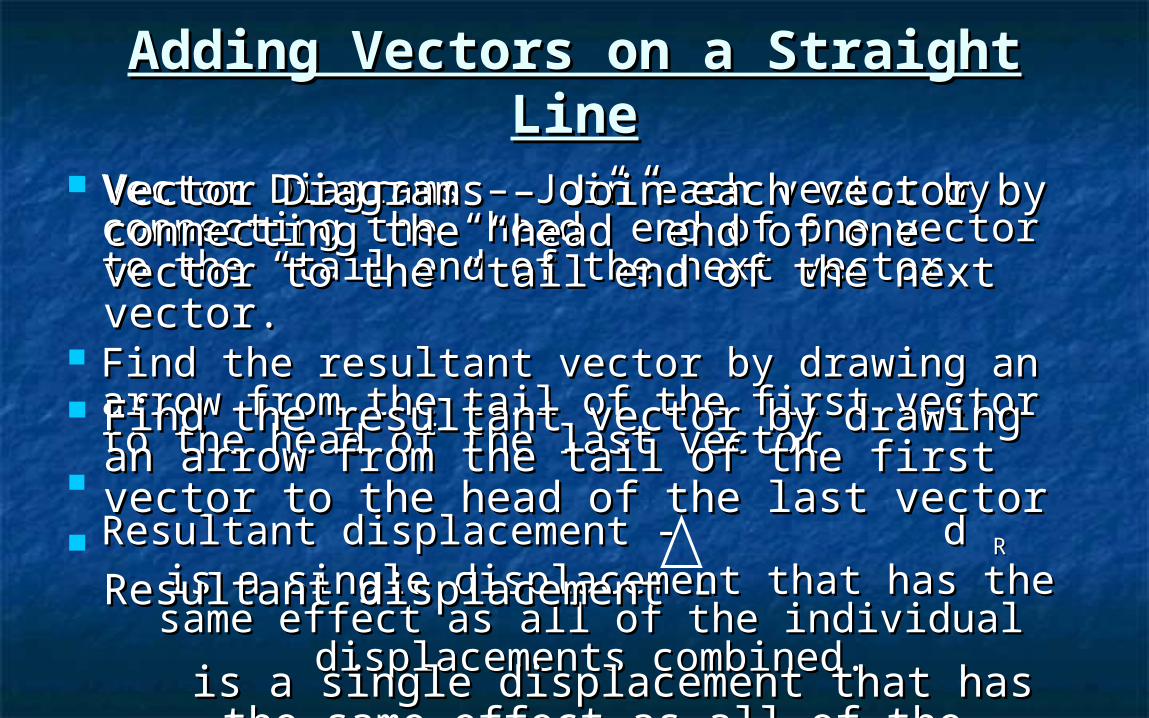
Vector Diagrams – Join each vector by Vector Diagrams – Join each vector by connecting the “head” end of one vector to connecting the “head” end of one vector to the “tail end of the next vector.the “tail end of the next vector.
Find the resultant vector by drawing an Find the resultant vector by drawing an arrow from the tail of the first vector to the arrow from the tail of the first vector to the head of the last vectorhead of the last vector
Resultant displacement - d Resultant displacement - d RR is a single displacement that has the same is a single displacement that has the same
effect as all of the individual displacements effect as all of the individual displacements combined.combined.
Vector Diagrams – Join each vector by Vector Diagrams – Join each vector by connecting the “head” end of one vector to connecting the “head” end of one vector to the “tail end of the next vector.the “tail end of the next vector.
Find the resultant vector by drawing an Find the resultant vector by drawing an arrow from the tail of the first vector to the arrow from the tail of the first vector to the head of the last vectorhead of the last vector
Resultant displacement - Resultant displacement - is a single displacement that has the same is a single displacement that has the same
effect as all of the individual displacements effect as all of the individual displacements combined.combined.
Adding Vectors on a Straight LineAdding Vectors on a Straight Line
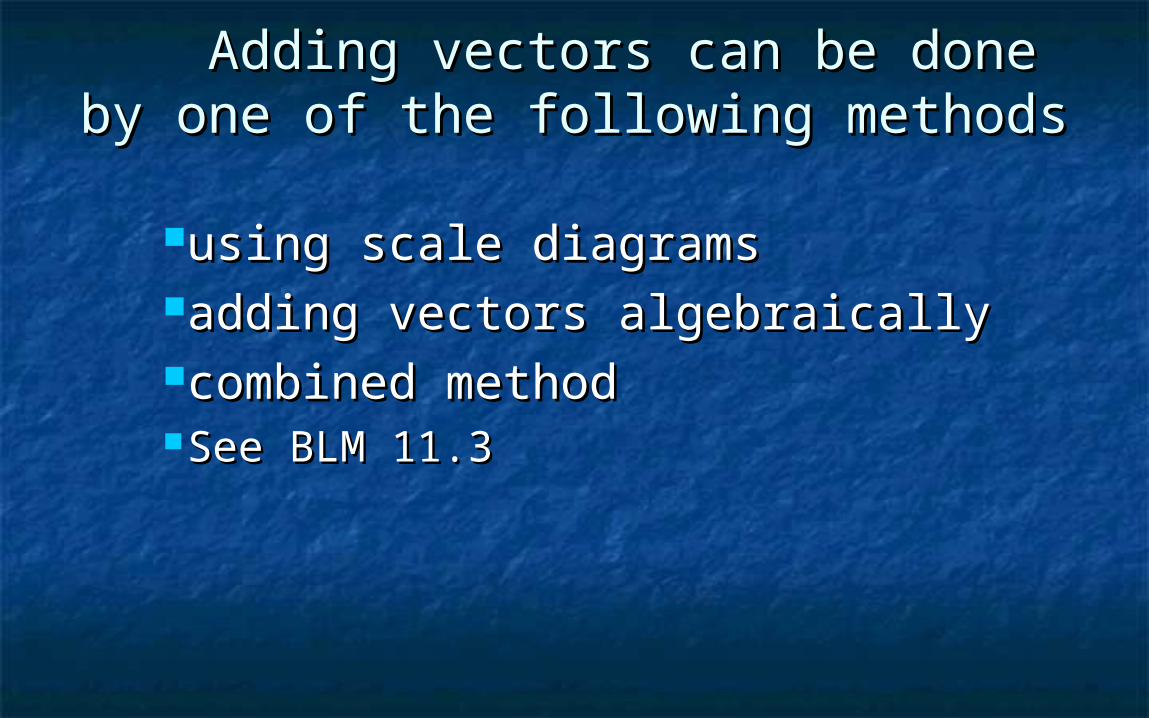
Adding vectors can be done by Adding vectors can be done by one of the following methodsone of the following methods
using scale diagramsusing scale diagramsadding vectors algebraicallyadding vectors algebraicallycombined methodcombined methodSee BLM 11.3See BLM 11.3
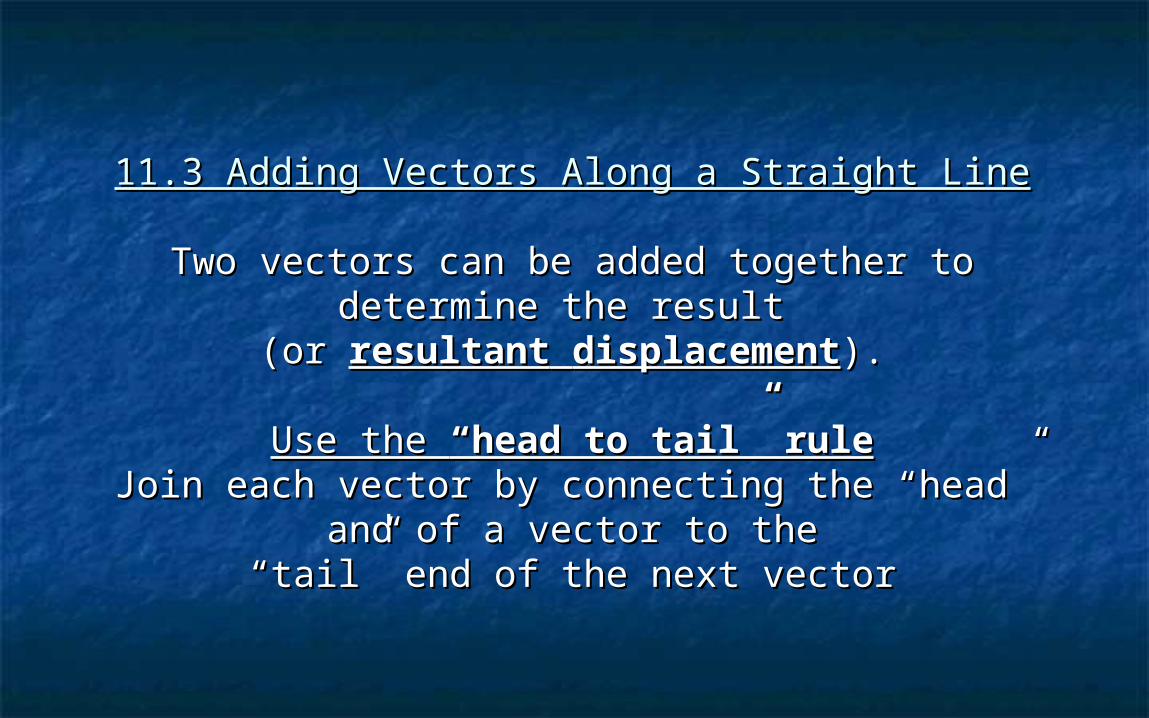
11.3 Adding Vectors Along a Straight Line11.3 Adding Vectors Along a Straight Line
Two vectors can be added together to determine Two vectors can be added together to determine the result the result
(or (or resultantresultant displacementdisplacement).).
Use the Use the “head to tail” rule“head to tail” ruleJoin each vector by connecting the “head” and of Join each vector by connecting the “head” and of
a vector to thea vector to the“tail” end of the next vector“tail” end of the next vector
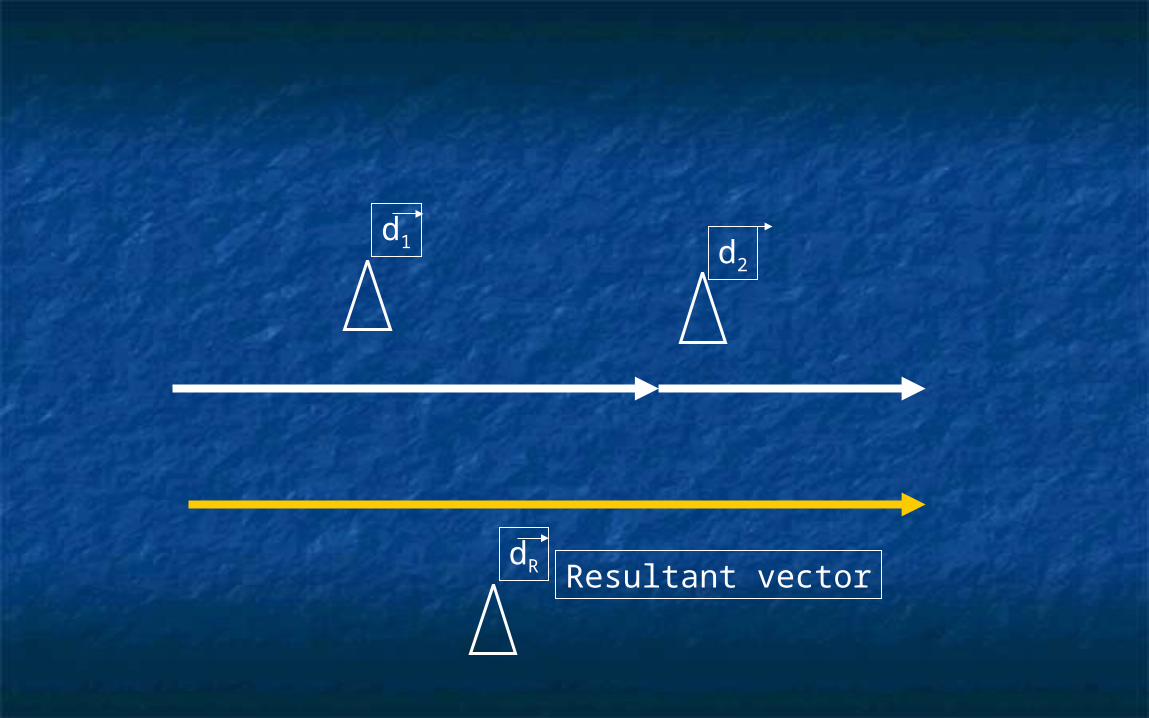
d1 d2
dR Resultant vector
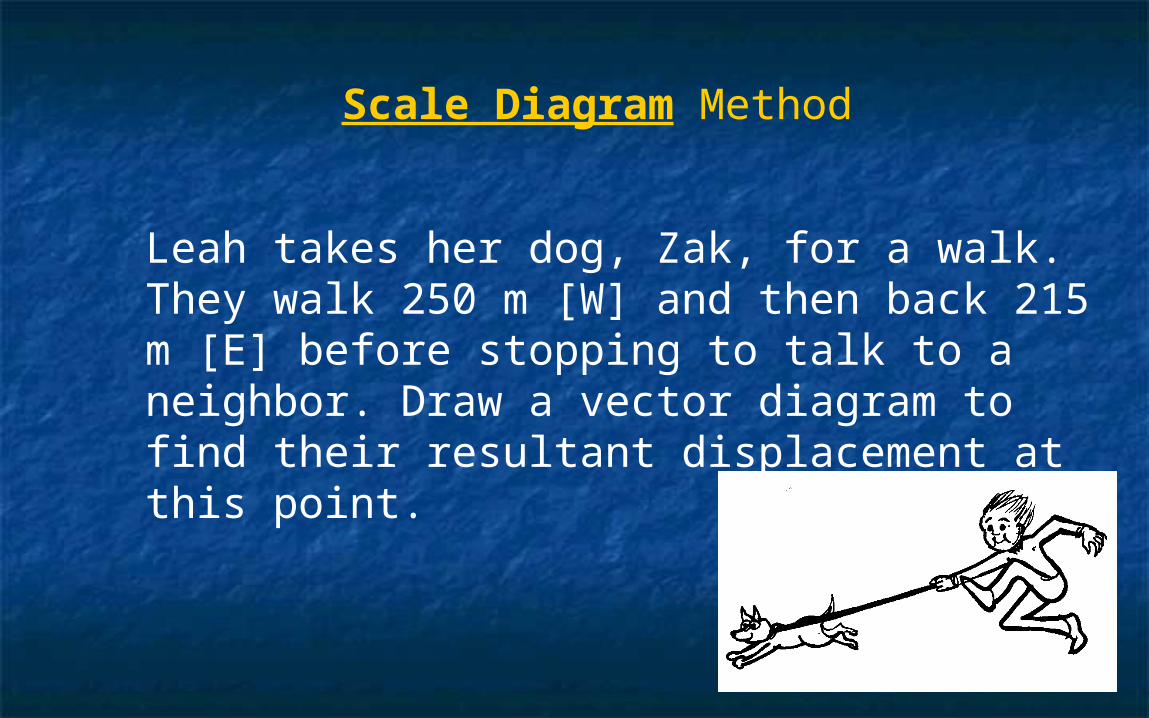
Leah takes her dog, Zak, for a walk. They walk 250 m [W] and then back 215 m [E] before stopping to talk to a neighbor. Draw a vector diagram to find their resultant displacement at this point.
Scale Diagram Method
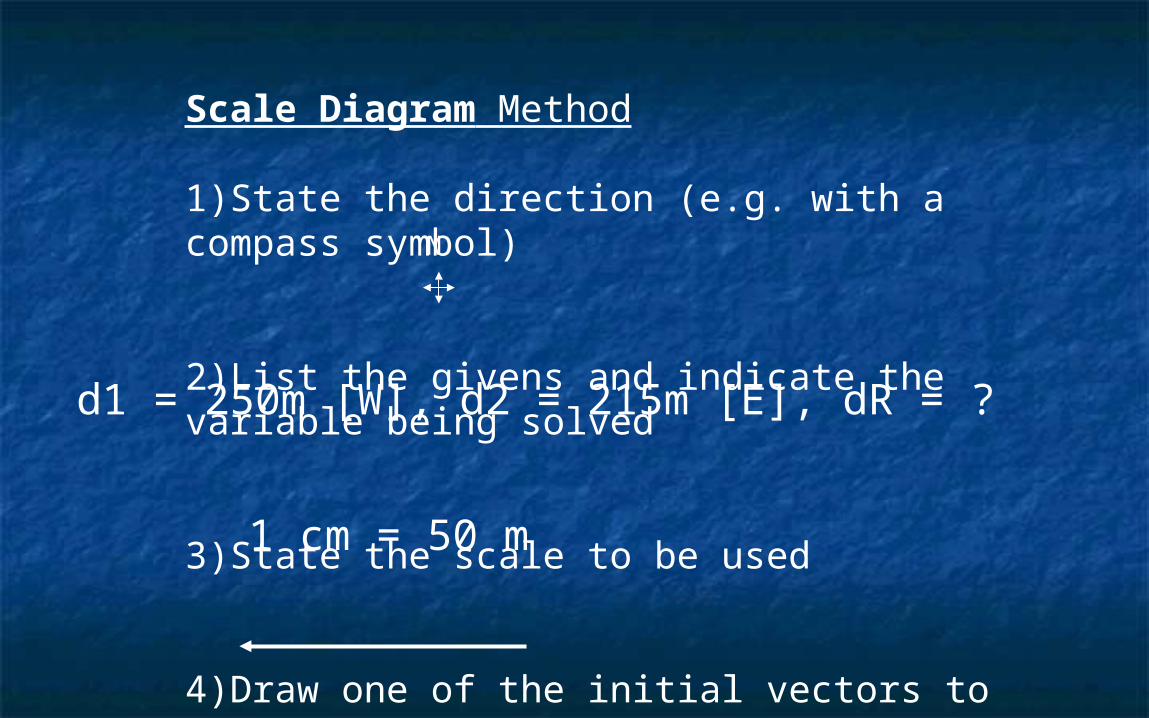
Scale Diagram Method
1)State the direction (e.g. with a compass symbol)
2)List the givens and indicate the variable being solved
3)State the scale to be used
4)Draw one of the initial vectors to scale
d1 = 250m [W], d2 = 215m [E], dR = ?
1 cm = 50 m
N
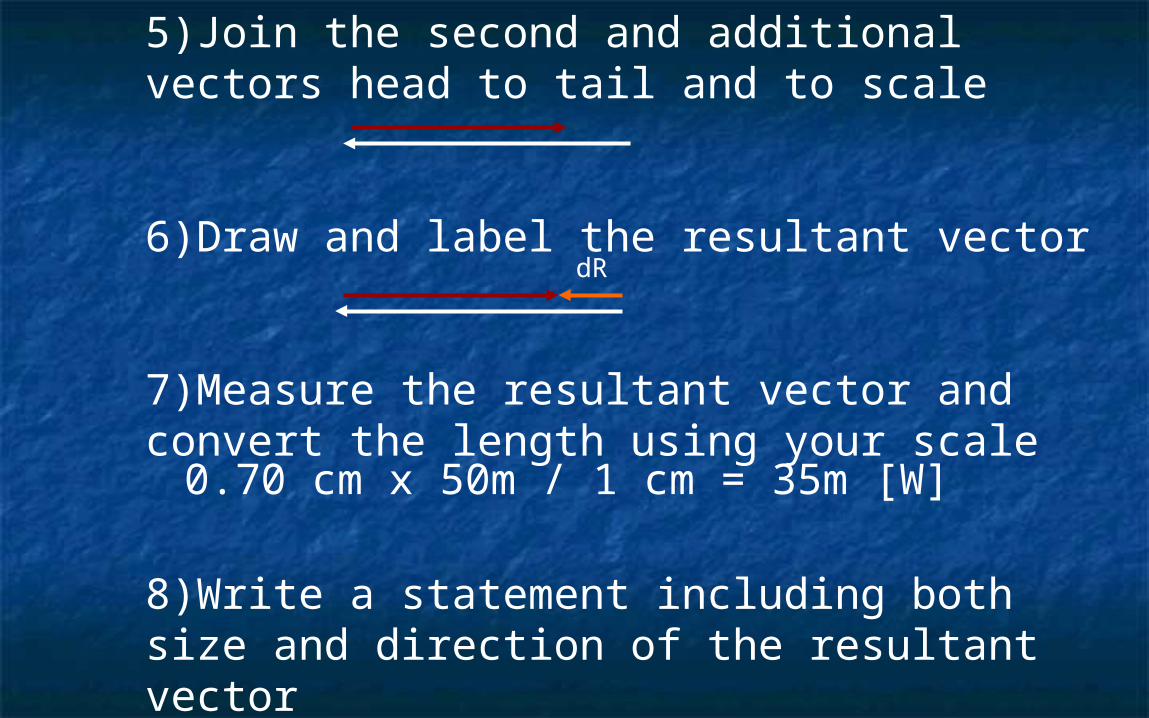
5)Join the second and additional vectors head to tail and to scale
6)Draw and label the resultant vector
7)Measure the resultant vector and convert the length using your scale
8)Write a statement including both size and direction of the resultant vector
dR
0.70 cm x 50m / 1 cm = 35m [W]
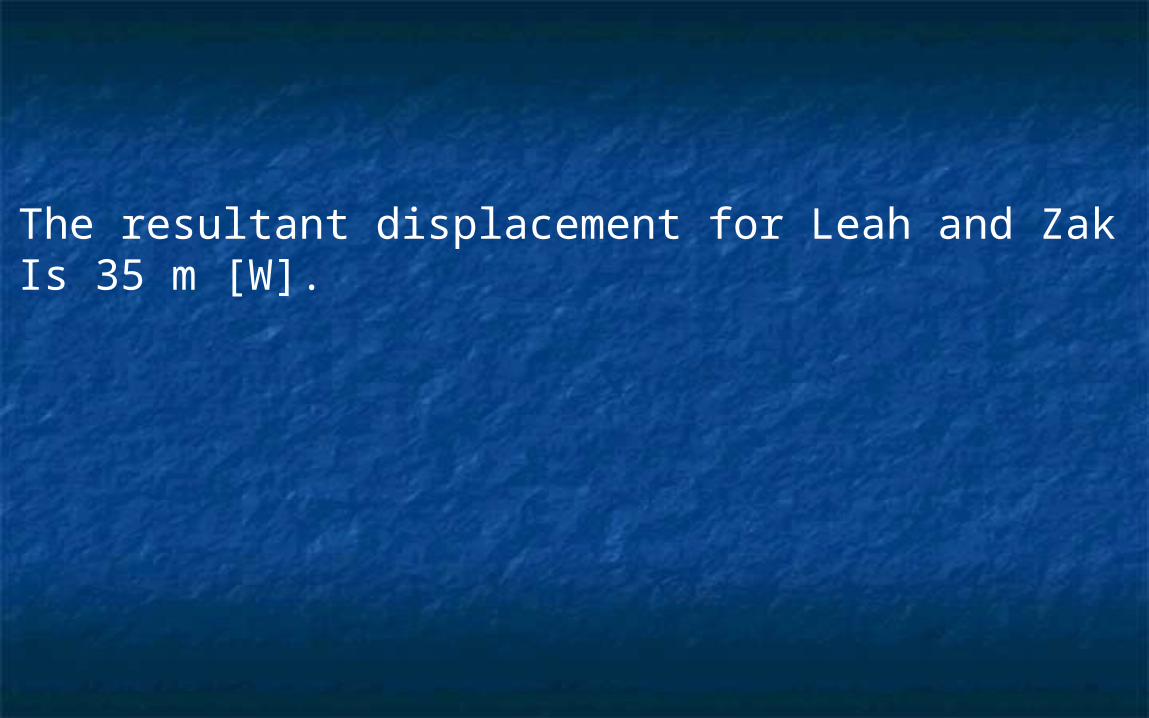
The resultant displacement for Leah and ZakIs 35 m [W].
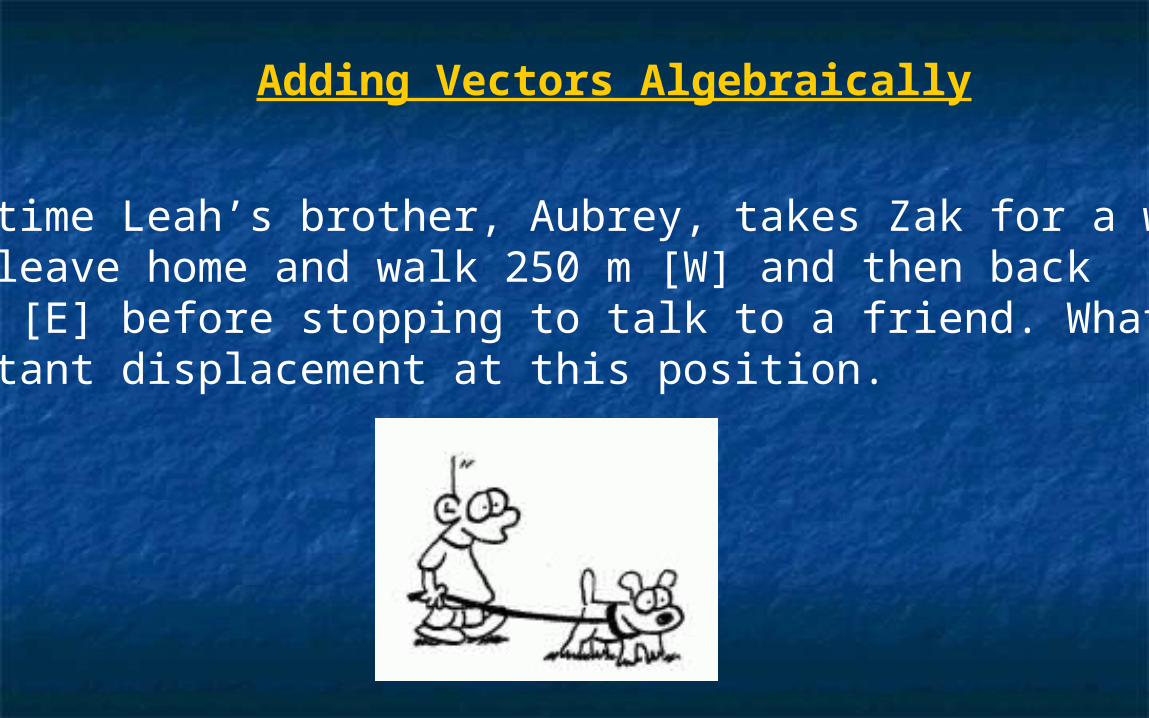
Adding Vectors Algebraically
This time Leah’s brother, Aubrey, takes Zak for a walkThey leave home and walk 250 m [W] and then back 175 m [E] before stopping to talk to a friend. What is the resultant displacement at this position.
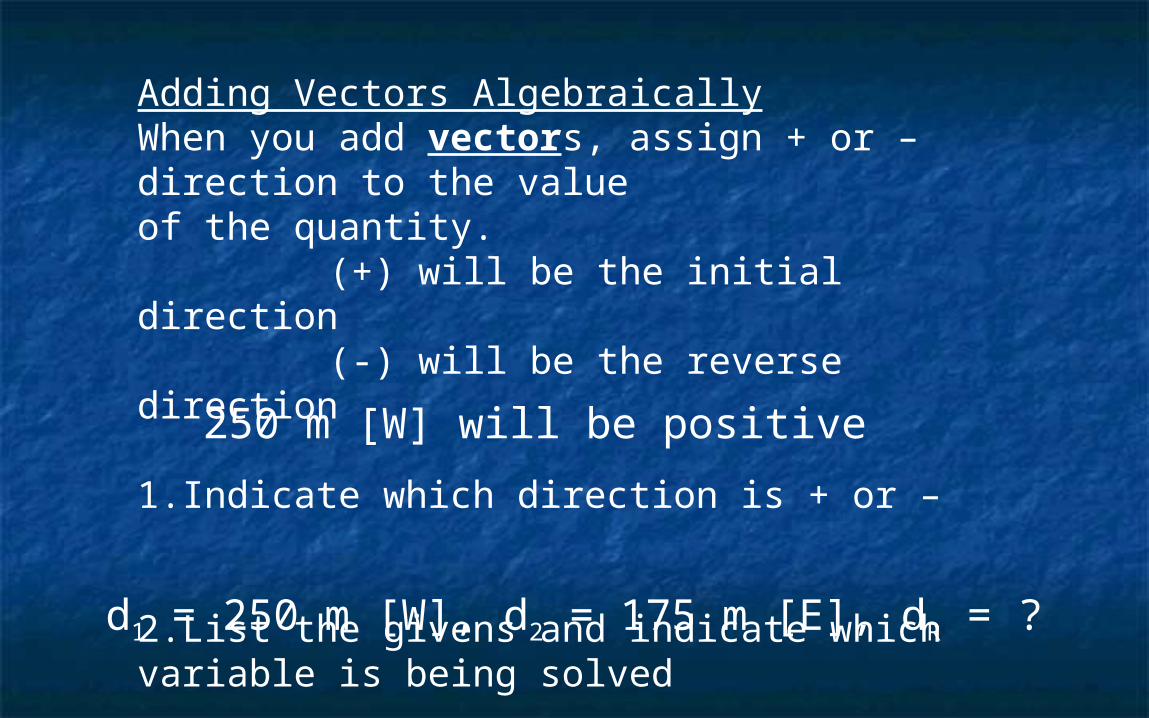
Adding Vectors AlgebraicallyWhen you add vectors, assign + or – direction to the valueof the quantity.
(+) will be the initial direction(-) will be the reverse direction
1.Indicate which direction is + or –
2.List the givens and indicate which variable is being solved
250 m [W] will be positive
d1 = 250 m [W], d2 = 175 m [E], dR = ?
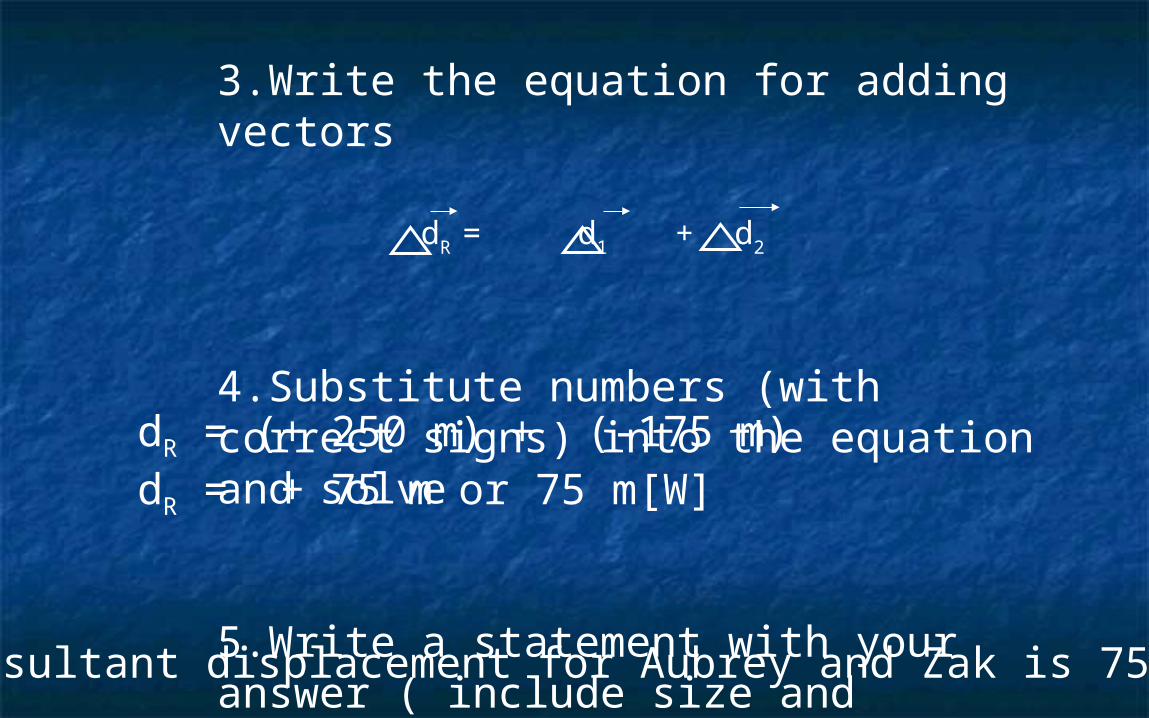
3.Write the equation for adding vectors
4.Substitute numbers (with correct signs) into the equation and solve
5.Write a statement with your answer ( include size and direction)
d1 + d2dR =
dR = (+ 250 m) + (-175 m)dR = + 75 m or 75 m[W]
The resultant displacement for Aubrey and Zak is 75 m [W]
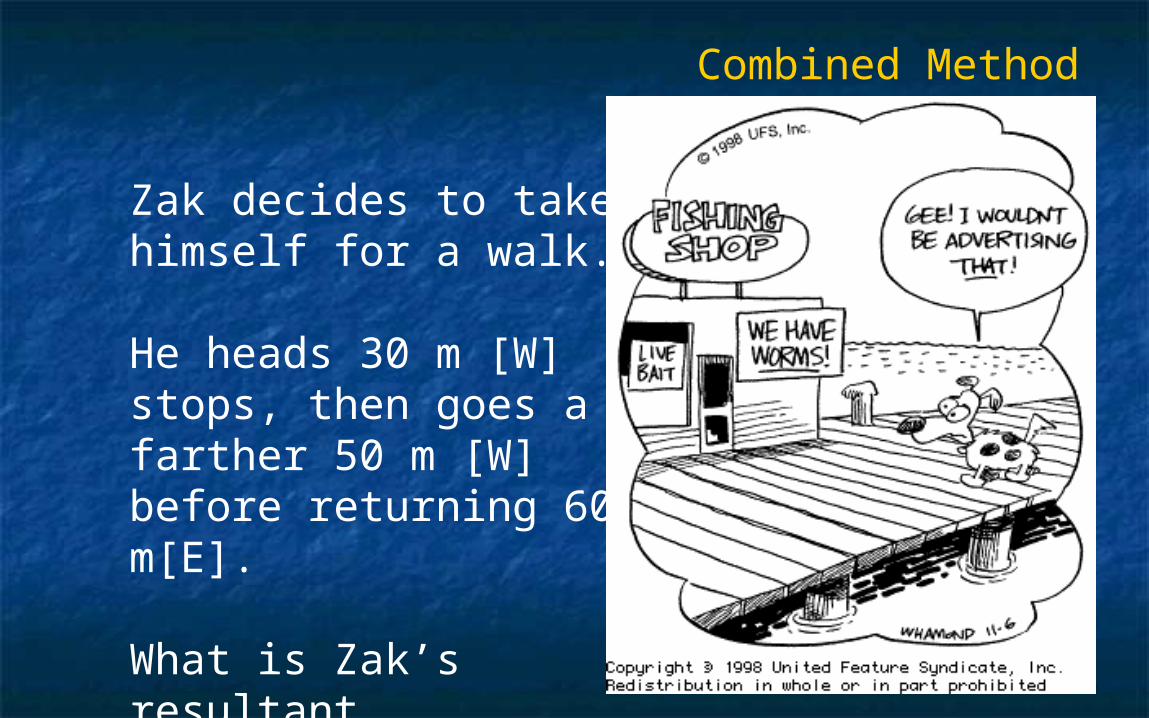
Combined Method
Zak decides to take himself for a walk.
He heads 30 m [W] stops, then goes a farther 50 m [W] before returning 60 m[E].
What is Zak’s resultant displacement?
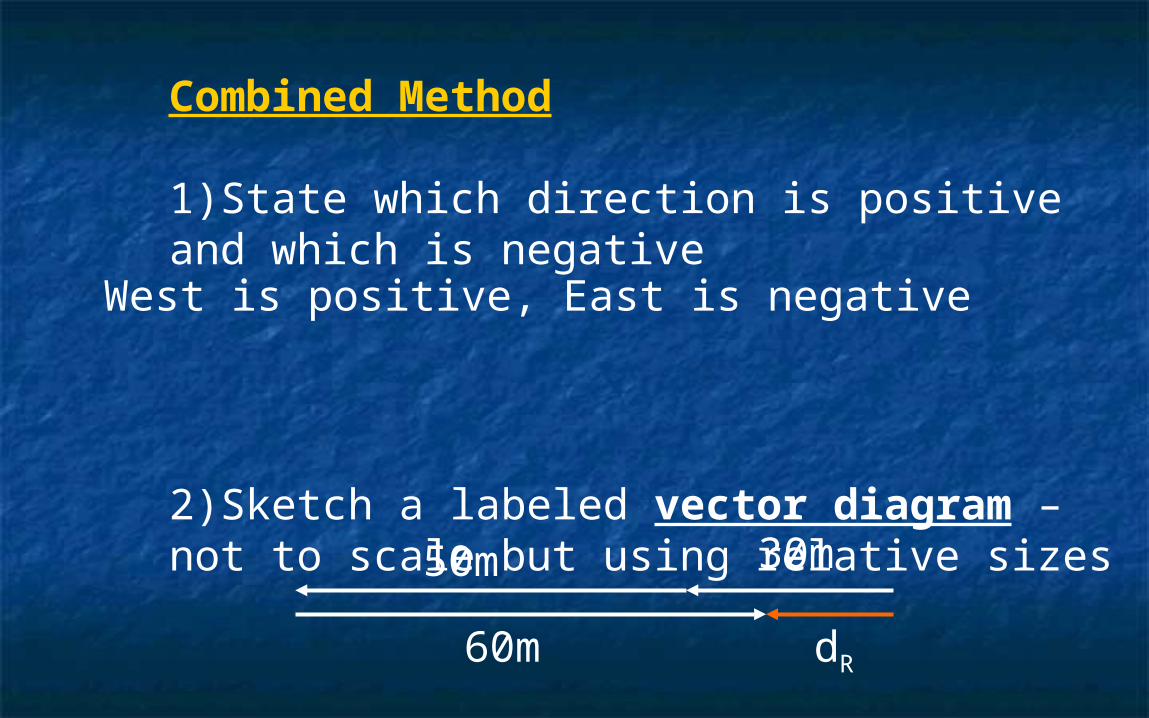
Combined Method 1)State which direction is positive and which is negative
2)Sketch a labeled vector diagram – not to scale but using relative sizes
West is positive, East is negative
30m50m
60m dR
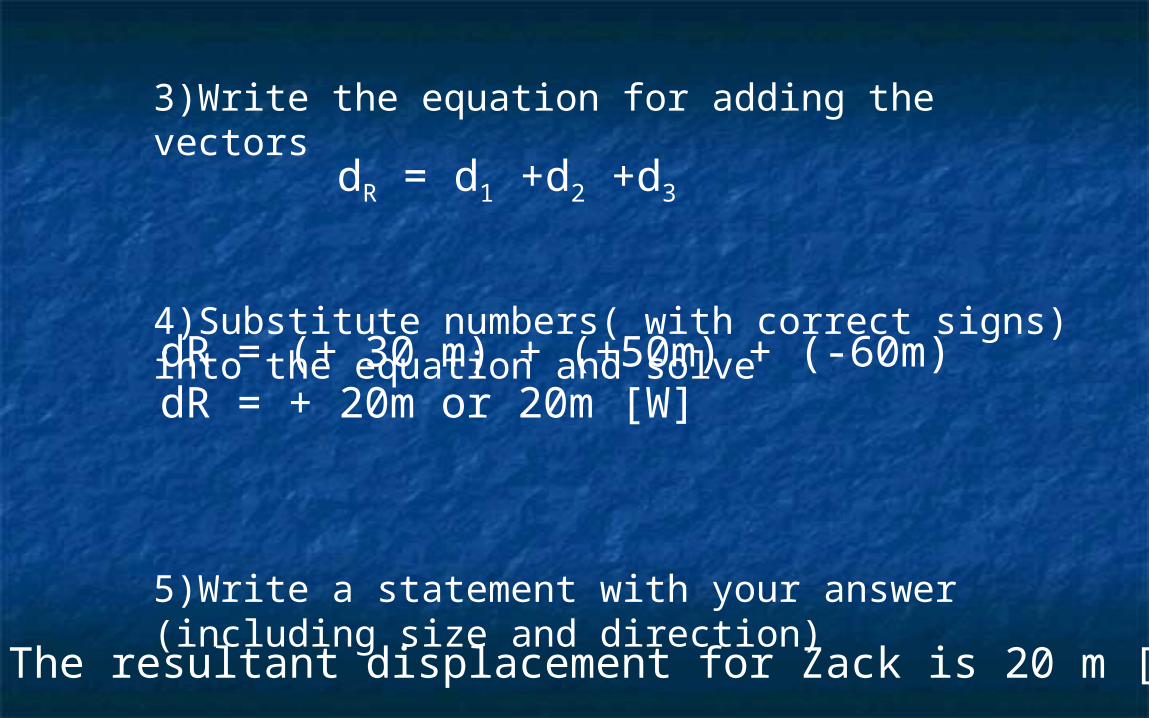
3)Write the equation for adding the vectors
4)Substitute numbers( with correct signs) into the equation and solve
5)Write a statement with your answer (including size and direction)
dR = d1 +d2 +d3
dR = (+ 30 m) + (+50m) + (-60m) dR = + 20m or 20m [W]
The resultant displacement for Zack is 20 m [W]
Assignment : Adding Vectors in a Assignment : Adding Vectors in a Straight LineStraight Line
Questions 1-3,5-7 pg 423 Answer KeyQuestions 1-3,5-7 pg 423 Answer Key Activity “Bug Race”Activity “Bug Race”
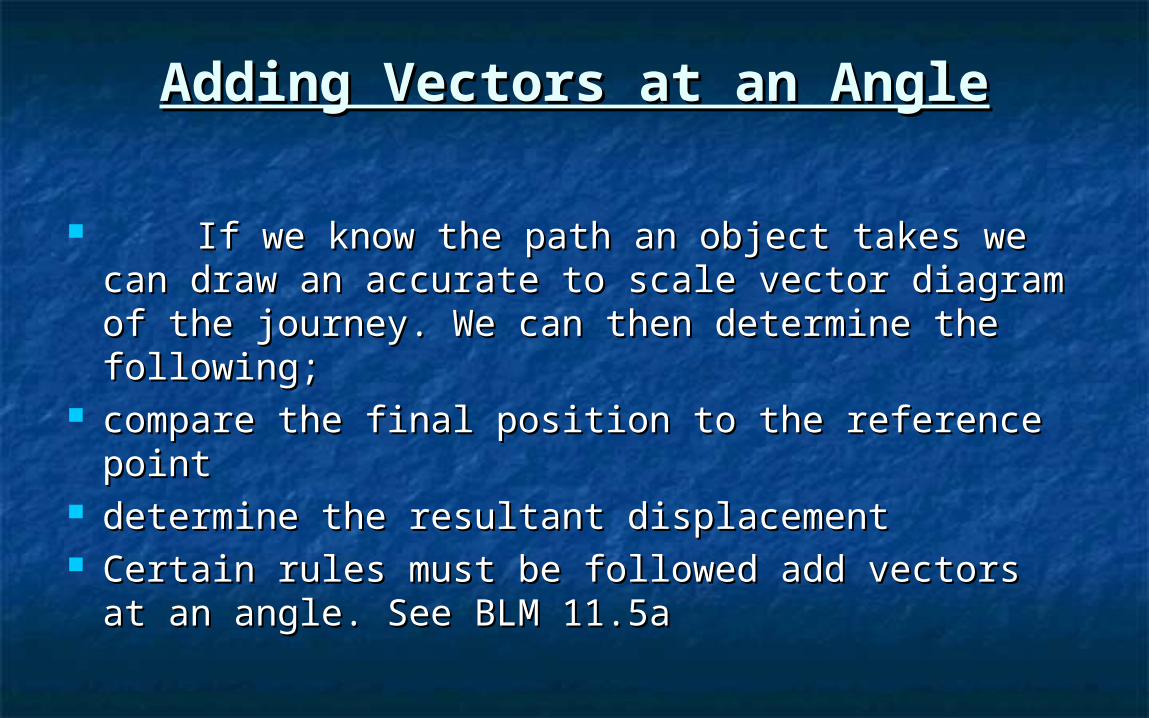
Adding Vectors at an AngleAdding Vectors at an Angle
If we know the path an object takes we can If we know the path an object takes we can draw an accurate to scale vector diagram of the draw an accurate to scale vector diagram of the journey. We can then determine the following;journey. We can then determine the following;
compare the final position to the reference pointcompare the final position to the reference point determine the resultant displacementdetermine the resultant displacement Certain rules must be followed add vectors at an Certain rules must be followed add vectors at an
angle. See BLM 11.5aangle. See BLM 11.5a
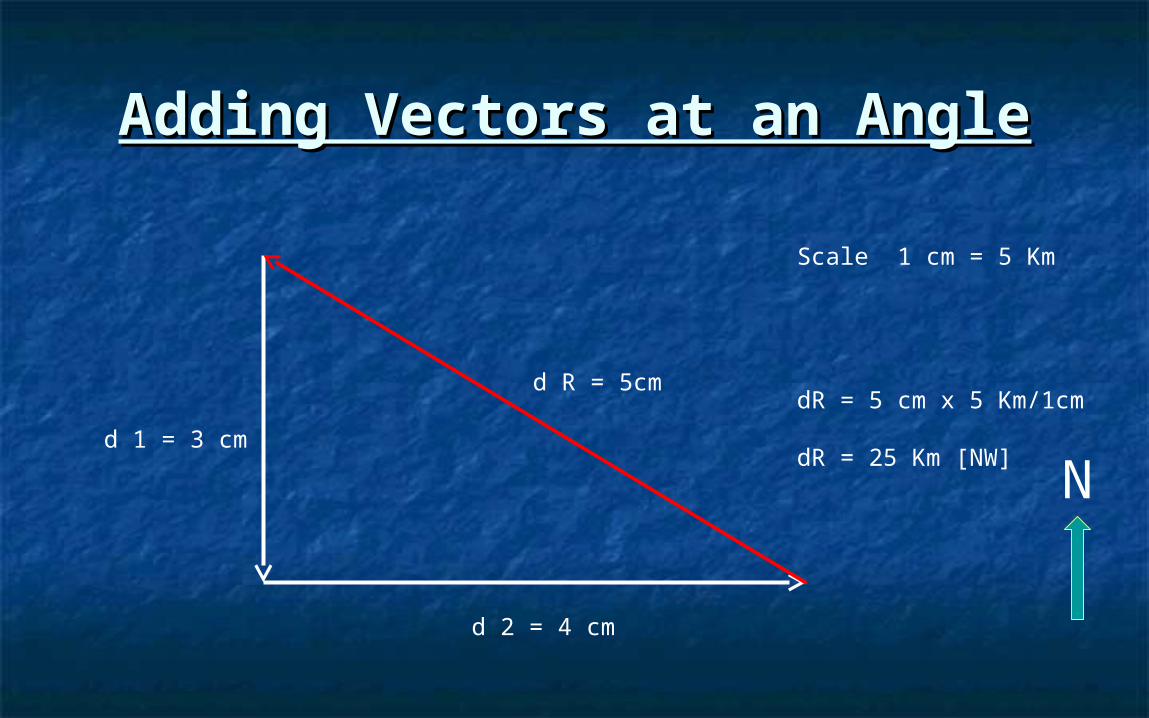
Adding Vectors at an AngleAdding Vectors at an Angle
d 1 = 3 cm
d 2 = 4 cm
d R = 5cm
Scale 1 cm = 5 Km
dR = 5 cm x 5 Km/1cm
dR = 25 Km [NW]N
Assignment : Adding Vectors at an Assignment : Adding Vectors at an AngleAngle
BLM 11.5bBLM 11.5b Activity “Hide a Penny Treasure Hunt”Activity “Hide a Penny Treasure Hunt”
VelocityVelocity
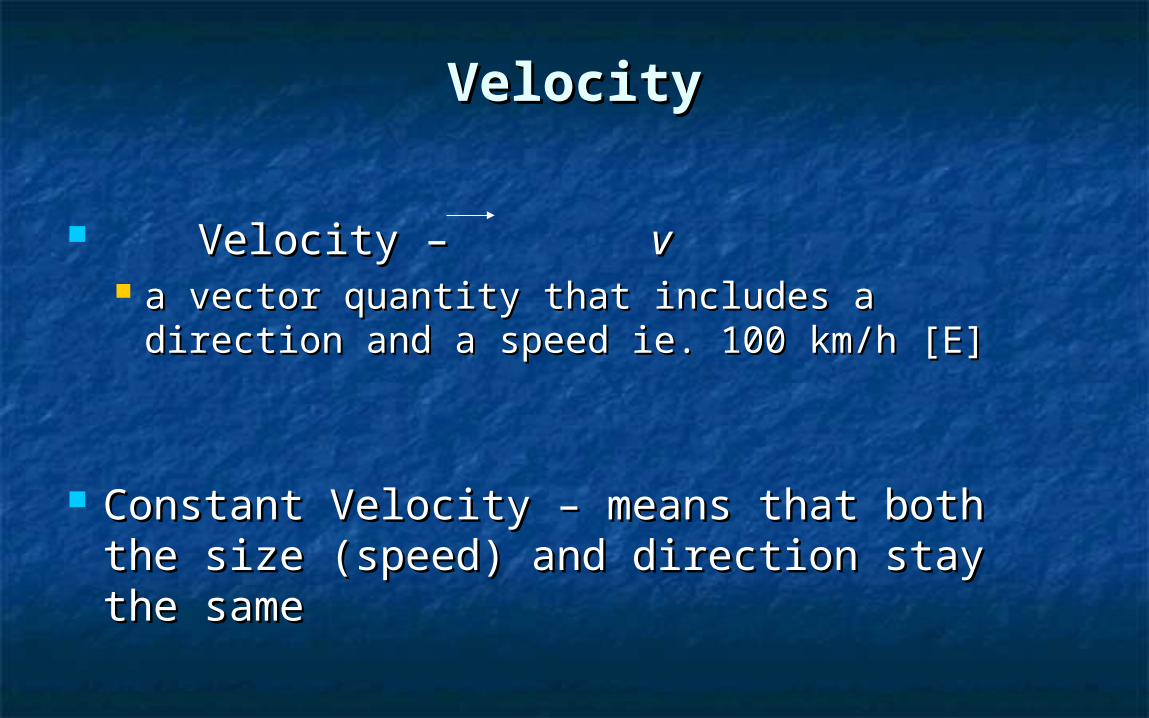
Velocity – Velocity – vv a vector quantity that includes a direction and a a vector quantity that includes a direction and a
speed ie. 100 km/h [E]speed ie. 100 km/h [E]
Constant Velocity – means that both the size Constant Velocity – means that both the size (speed) and direction stay the same(speed) and direction stay the same
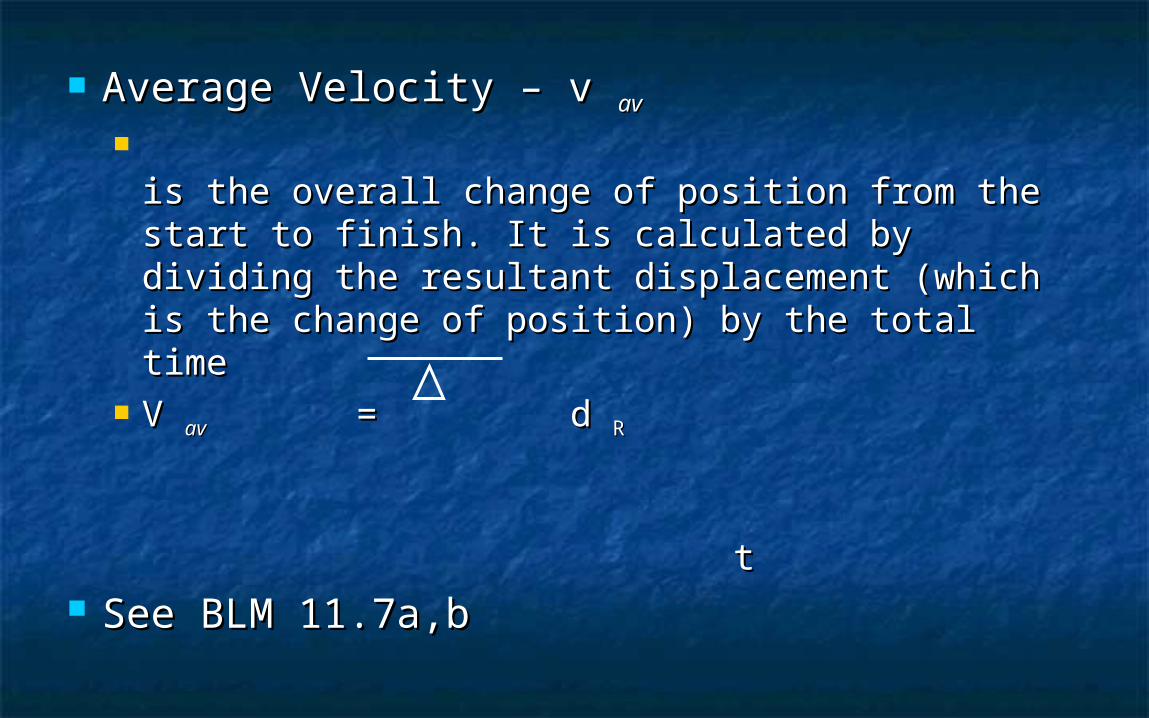
Average Velocity – v Average Velocity – v avav
is the overall change of position from the start to is the overall change of position from the start to finish. It is calculated by dividing the resultant finish. It is calculated by dividing the resultant displacement (which is the change of position) by displacement (which is the change of position) by the total timethe total time
V V avav = d = d R R
tt See BLM 11.7a,bSee BLM 11.7a,b
Assignment : VelocityAssignment : Velocity
BLM 11.7cBLM 11.7c Questions 3,5,7, pg 436Questions 3,5,7, pg 436 Activity Tracking and Position pg 438 & BLM Activity Tracking and Position pg 438 & BLM
11.911.9 Review Questions 4,8,9,10 pg 442Review Questions 4,8,9,10 pg 442 Test Chapter 11Test Chapter 11
Chapter 12 Displacement, Chapter 12 Displacement, Velocity, and AccelerationVelocity, and Acceleration
Position – Time GraphsPosition – Time Graphs
Position and displacement are vectors Position and displacement are vectors and include direction. It is possible to and include direction. It is possible to represent vector motion on a graph. Very represent vector motion on a graph. Very much like a distance –time graph. Can you much like a distance –time graph. Can you see the differences?see the differences?
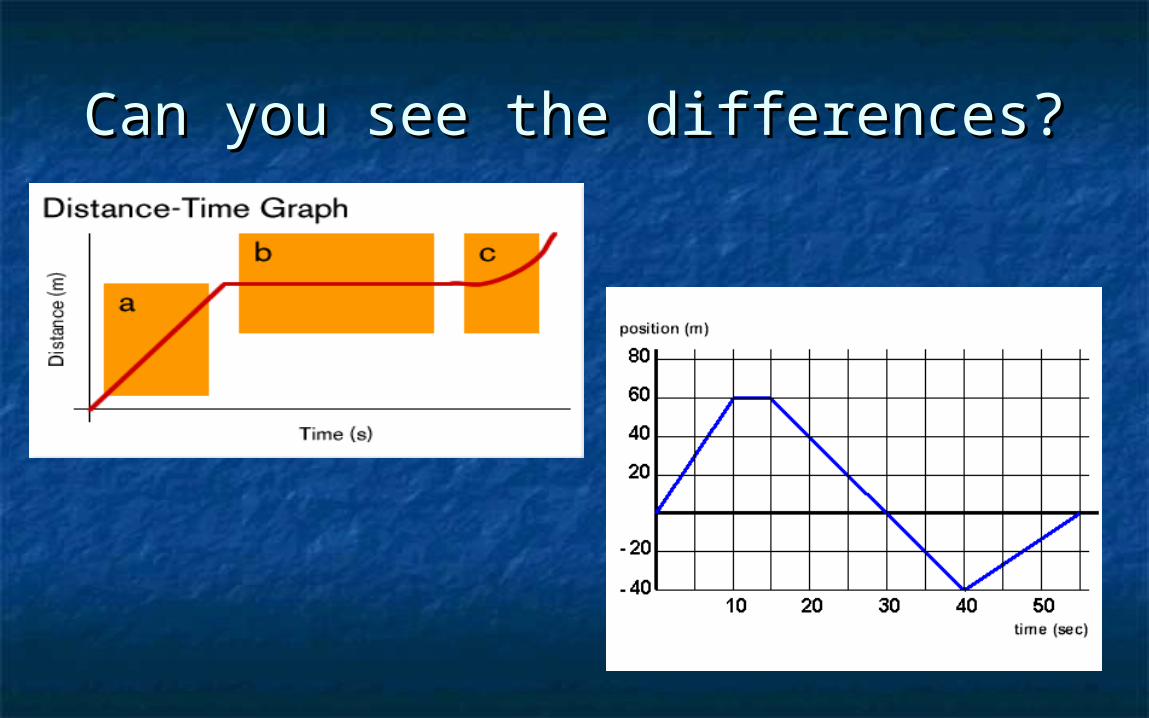
Can you see the differences?Can you see the differences?
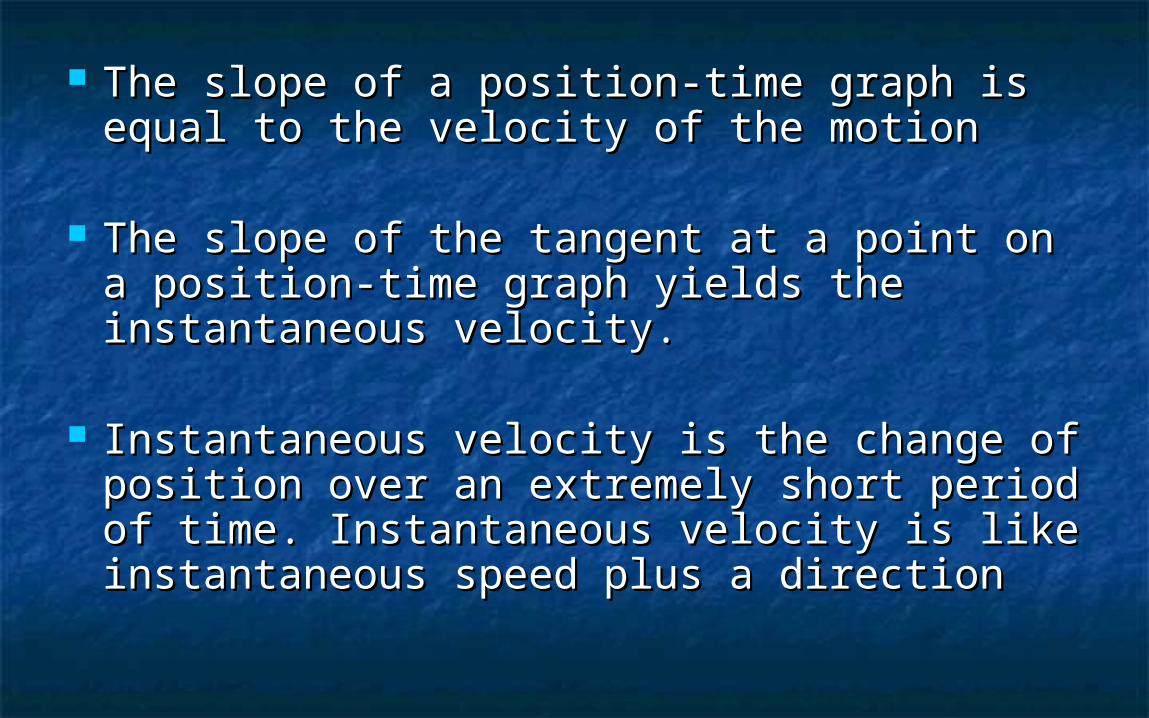
The slope of a position-time graph is equal to The slope of a position-time graph is equal to the velocity of the motionthe velocity of the motion
The slope of the tangent at a point on a The slope of the tangent at a point on a position-time graph yields the instantaneous position-time graph yields the instantaneous velocity.velocity.
Instantaneous velocity is the change of Instantaneous velocity is the change of position over an extremely short period of position over an extremely short period of time. Instantaneous velocity is like time. Instantaneous velocity is like instantaneous speed plus a direction instantaneous speed plus a direction
Assignment : Position-Time GraphsAssignment : Position-Time Graphs
Activity : Describing Position-Time Graphs “Walk the Dog”
Activity : The Helicopter Challenge Exercise : BLM 12.1 a,b,c
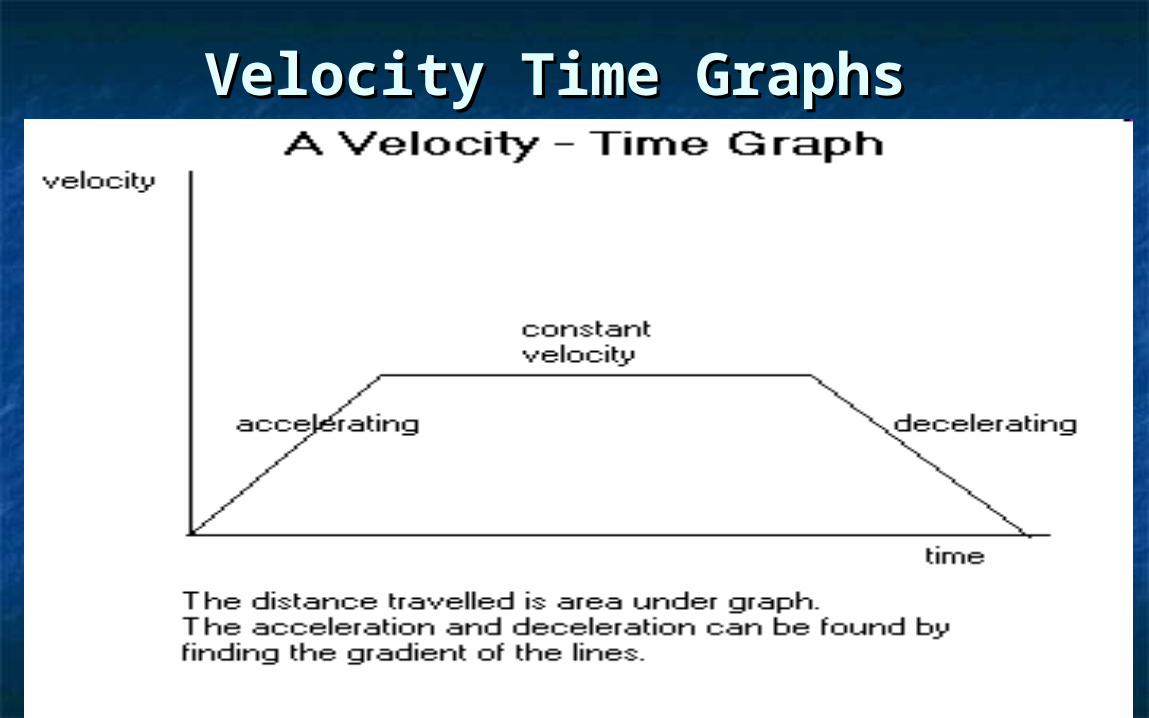
Velocity Time GraphsVelocity Time Graphs
AA velocity – time graph can show travel in velocity – time graph can show travel in opposite directions over a period of time.opposite directions over a period of time.
The slope of the line on a velocity –time The slope of the line on a velocity –time graph indicates the acceleration of an objectgraph indicates the acceleration of an object
Acceleration – aAcceleration – a
is calculated by dividing the change in is calculated by dividing the change in velocity by the time. Because there is a velocity by the time. Because there is a direction associated with the velocity, the direction associated with the velocity, the acceleration is also a vector quantity.acceleration is also a vector quantity.
Constant acceleration is uniformly changing Constant acceleration is uniformly changing velocity.velocity.
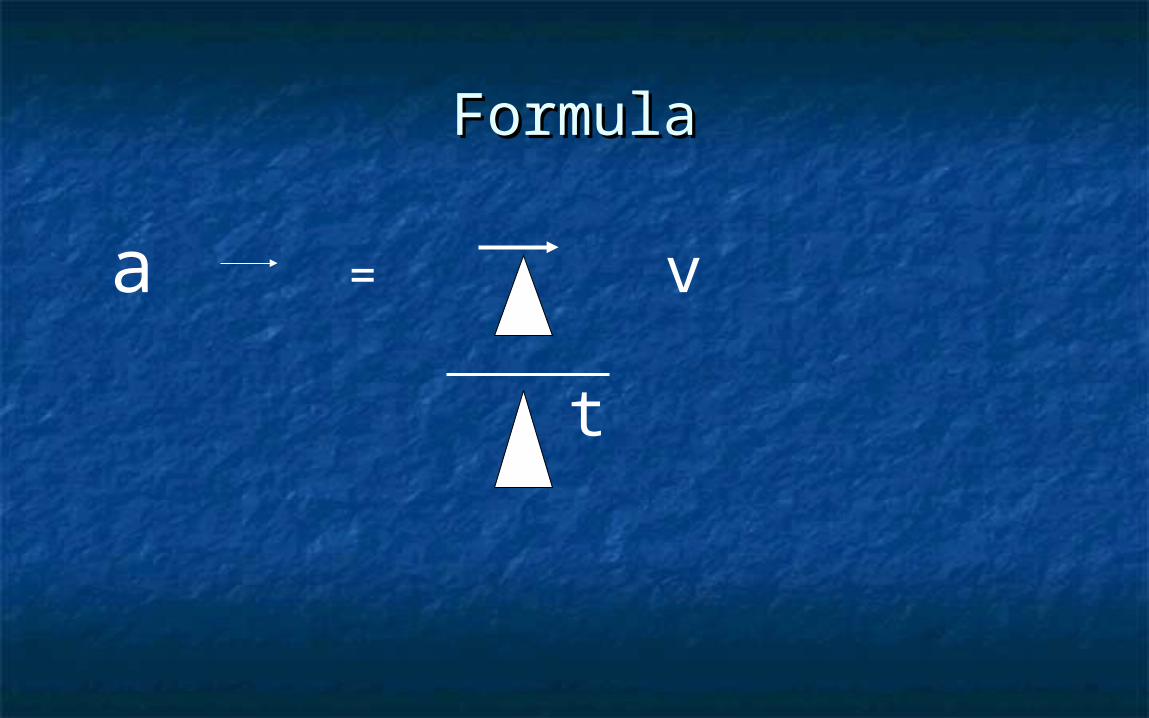
FormulaFormula
a = v
t

V av = d R
Average Velocity of an object in motion can Average Velocity of an object in motion can be determined from the ratio of total be determined from the ratio of total distance divided by total elapsed time.distance divided by total elapsed time.
t
See BLM 12.2 a,b
Assignment : Velocity – Time GraphsAssignment : Velocity – Time Graphs
BLM 12.2 cBLM 12.2 c
Acceleration and DisplacementAcceleration and Displacement
Acceleration is the change of velocity over Acceleration is the change of velocity over timetime
Questions 5,7,8 pg 465Questions 5,7,8 pg 465 Test Chapter 12 Test Chapter 12
Recommended