GRA 5917: Input Politics and Public Opinion
Logistic regression in political economy
GRA 5917 Public Opinion and Input Politics. Lecture, September 9th 2010
Lars C. Monkerud, Department of Public Governance,
BI Norwegian School of Management
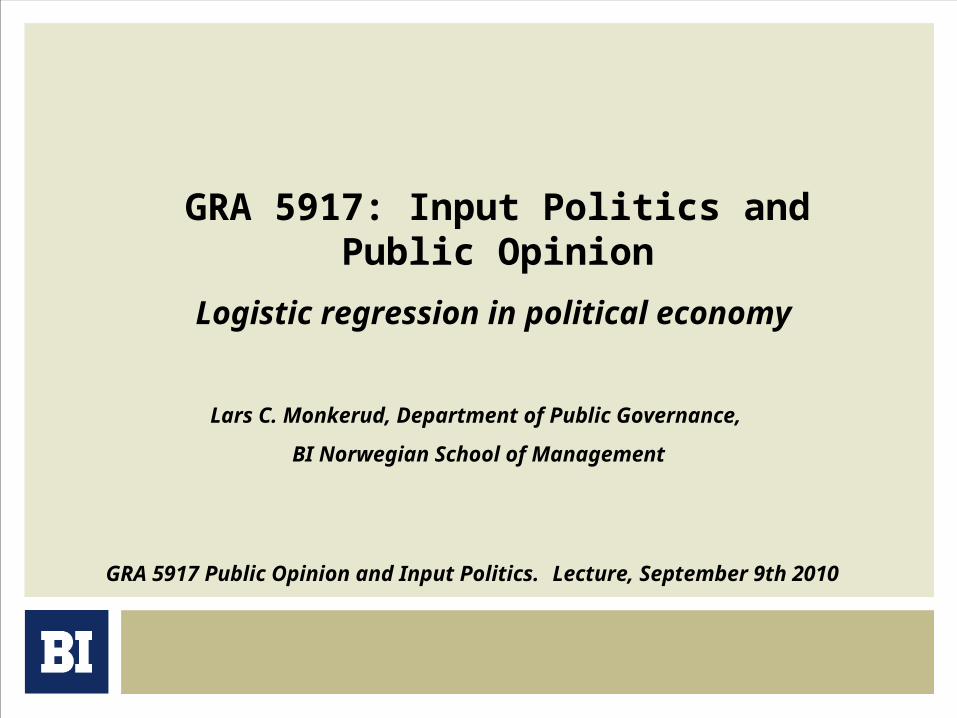
First, though: Interaction effects in basic regression analysis (from last week)…
• Given the model…
…simple rearrangment yields
eXXXXy BAABBBAA 0
that is…
AABBBBABAA XXyXXy /or /
eXXXyeXXXy AABAABBBBABABA )(or )( 00
Interaction effects in basic regression analysis
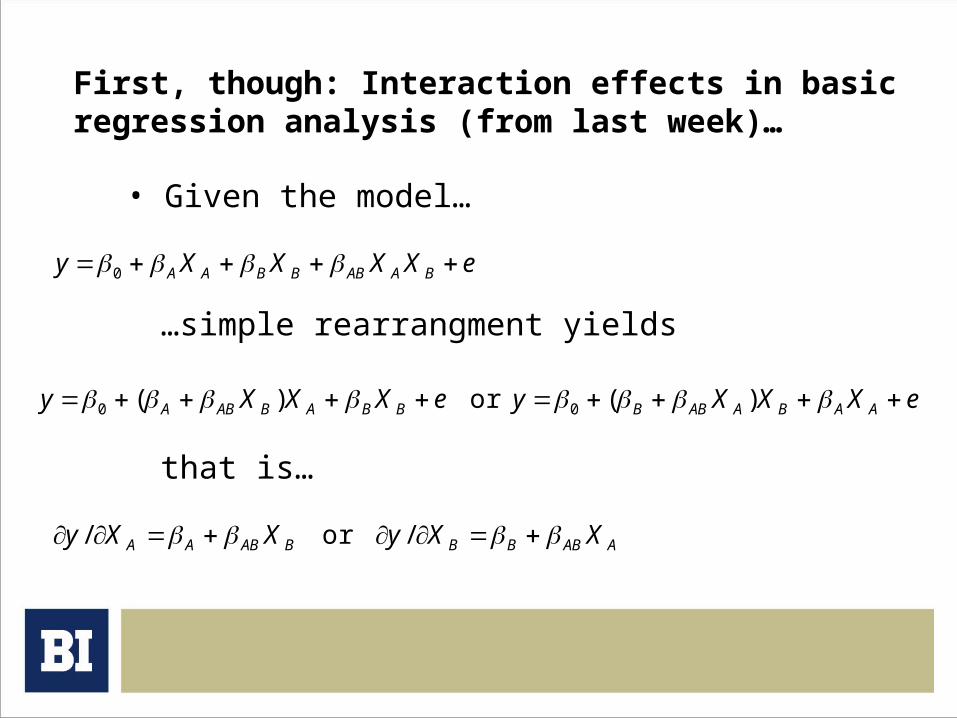
• Model with interaction terms…
…entails symmetry: Effect of one variable contingent on the other and vice versa
…terms are mostly not to be interpreted in isolation: A effect of XA when XB=0 (but, consider centering of variables to rescale an interesting value of XB to 0); AB tells whether effect of XA (XB) on Y depends on XB (XA) for some values of XB (XA) …additive terms are not to be seen as unconditional effects; little sense in asking of effect of Xk in general
Interaction effects in basic regression analysis
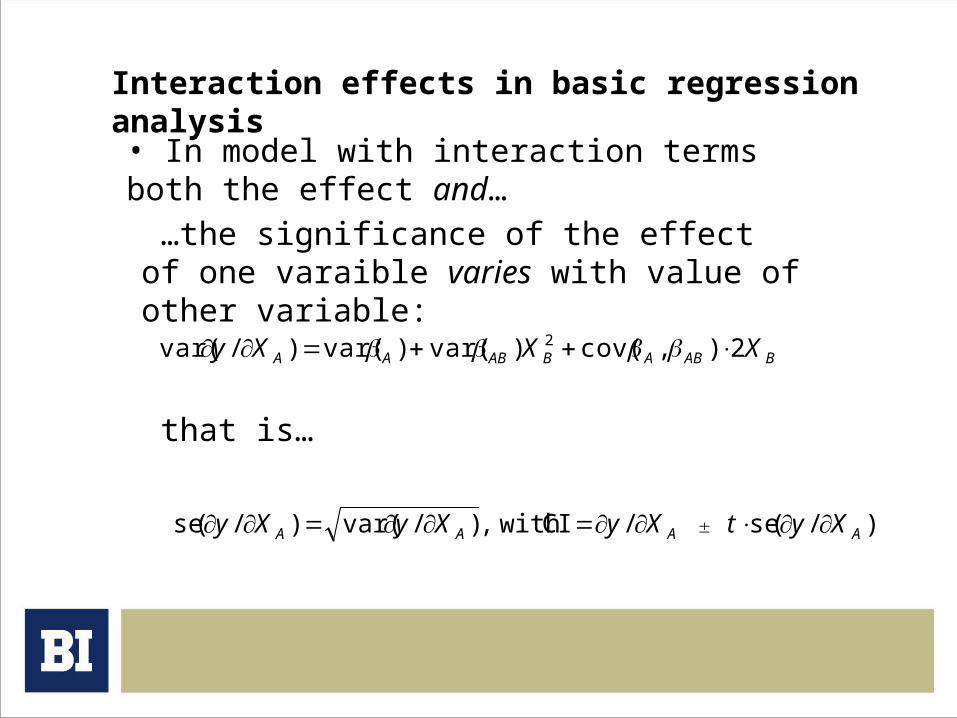
• In model with interaction terms both the effect and…
…the significance of the effect of one varaible varies with value of other variable:
that is…
)/(se /CI with ,)/var()/(se AAAA XytXyXyXy
BABABABAA XXXy 2),cov()var()var()/var( 2
Interaction effects in basic regression analysis
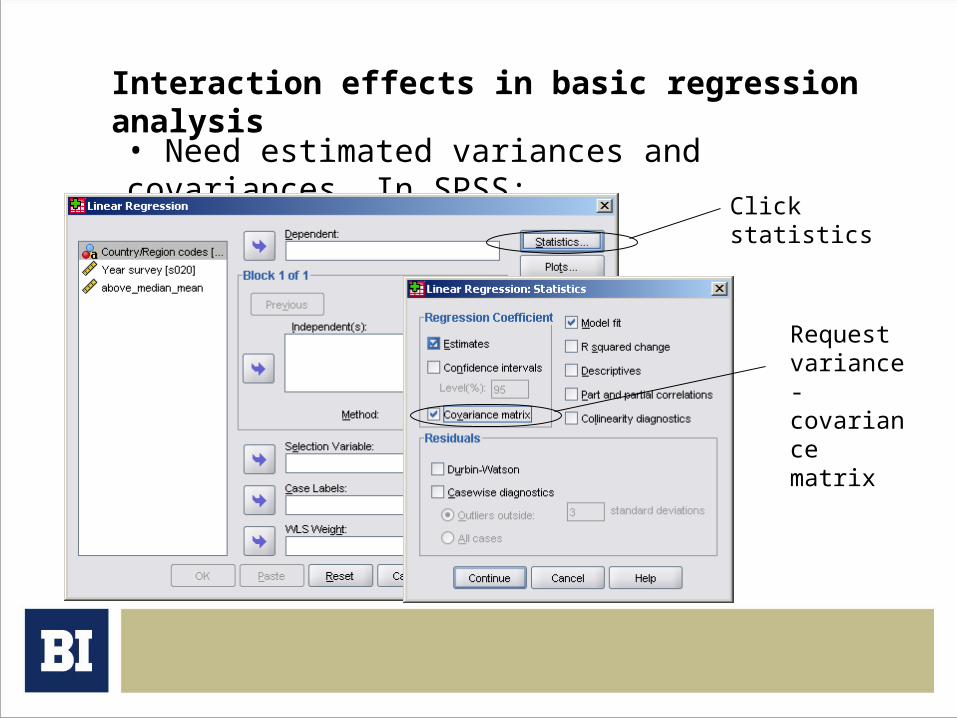
• Need estimated variances and covariances. In SPSS:
Click statistics
Request variance-covariance matrix
Interaction effects in basic regression analysis
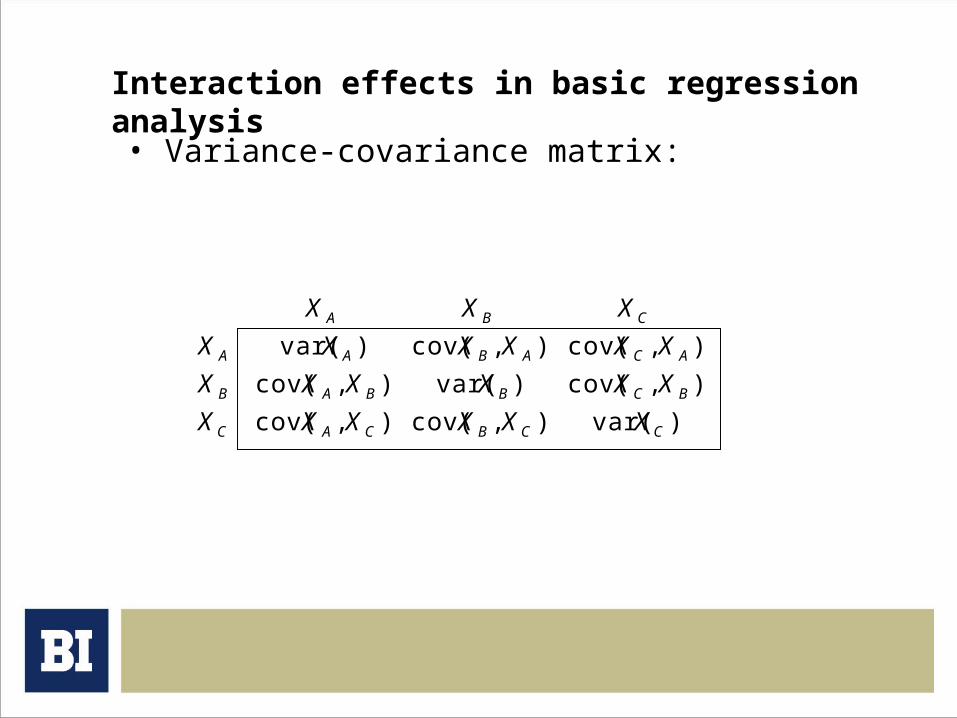
• Variance-covariance matrix:
)var(),cov(),cov(
),cov()var(),cov(
),cov(),cov()var(
CCBCAC
BCBBAB
ACABAA
CBA
XXXXXX
XXXXXX
XXXXXX
XXX
Interaction effects… an example: Government duration
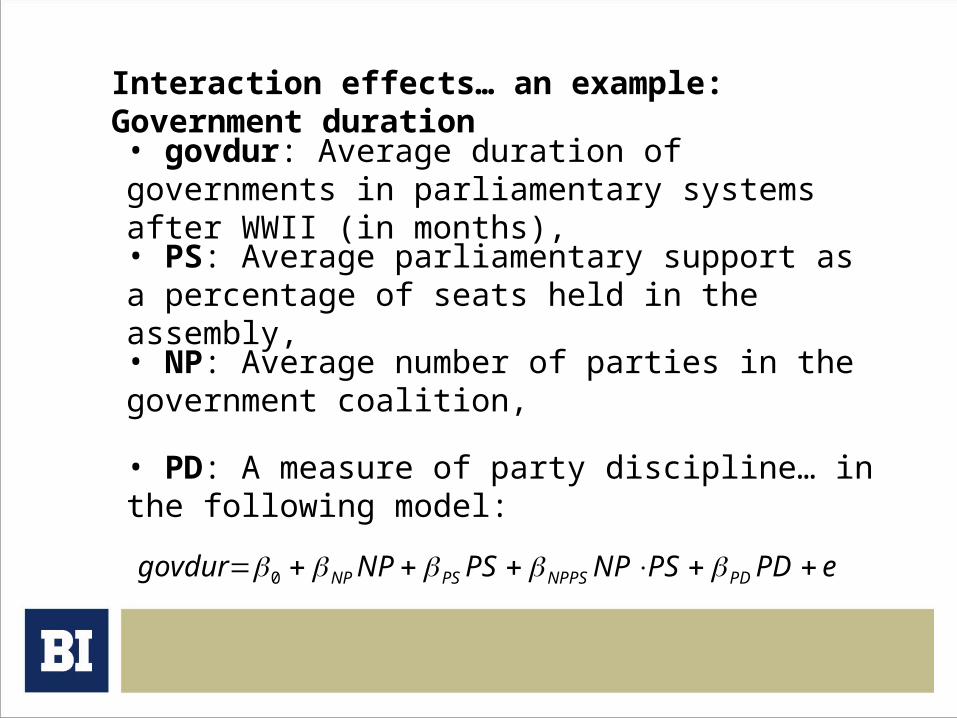
• govdur: Average duration of governments in parliamentary systems after WWII (in months),
• PS: Average parliamentary support as a percentage of seats held in the assembly,
• NP: Average number of parties in the government coalition,
• PD: A measure of party discipline… in the following model:
ePDPSNPPSNPgovdur PDNPPSPSNP 0
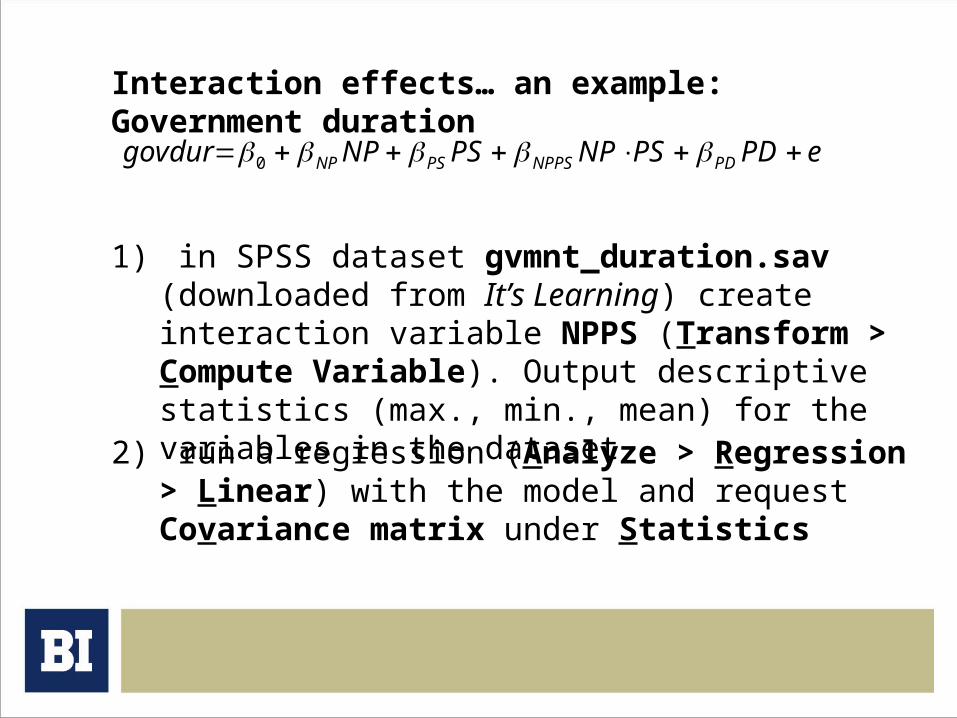
Interaction effects… an example: Government duration
1) in SPSS dataset gvmnt_duration.sav (downloaded from It’s Learning) create interaction variable NPPS (Transform > Compute Variable). Output descriptive statistics (max., min., mean) for the variables in the dataset
2) run a regression (Analyze > Regression > Linear) with the model and request Covariance matrix under Statistics
ePDPSNPPSNPgovdur PDNPPSPSNP 0
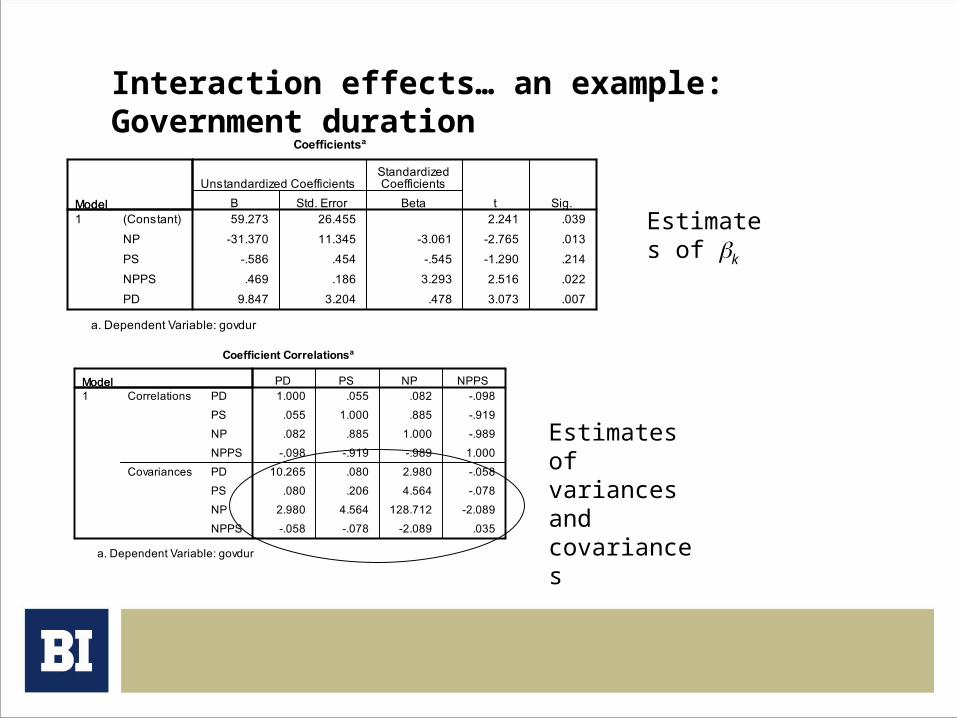
Interaction effects… an example: Government duration
Estimates of k
Estimates of variances and covariances
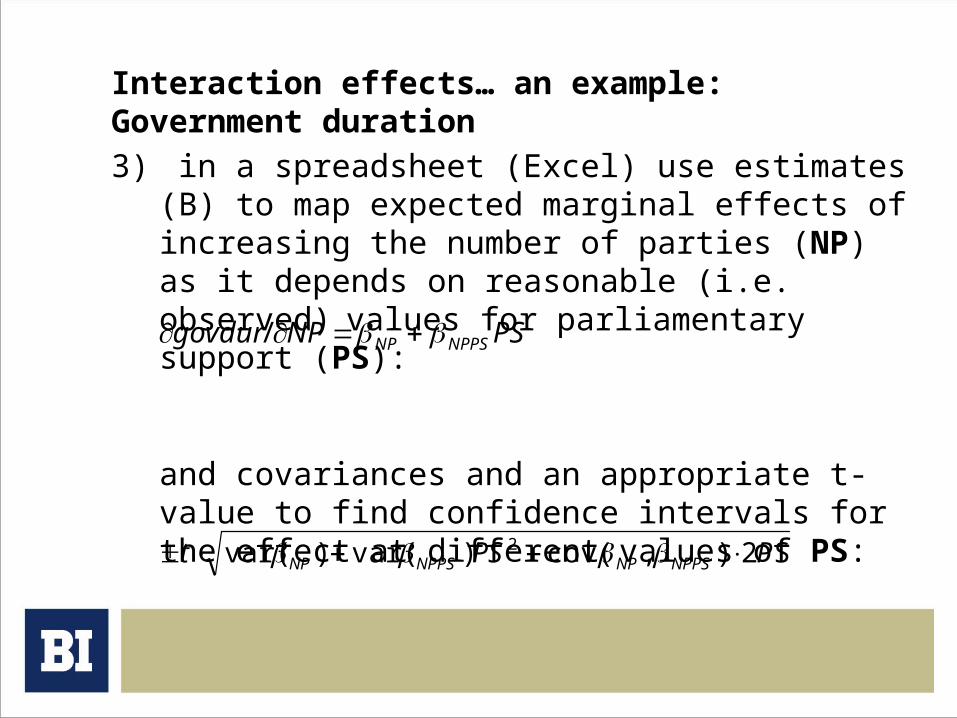
Interaction effects… an example: Government duration
3) in a spreadsheet (Excel) use estimates (B) to map expected marginal effects of increasing the number of parties (NP) as it depends on reasonable (i.e. observed)
values for parliamentary support (PS):
and covariances and an appropriate t-value to find confidence intervals for the effect at different values of PS:
PSNPgovdur NPPSNP /
S2),cov()var()var( 2 PPSt NPPSNPNPPSNP
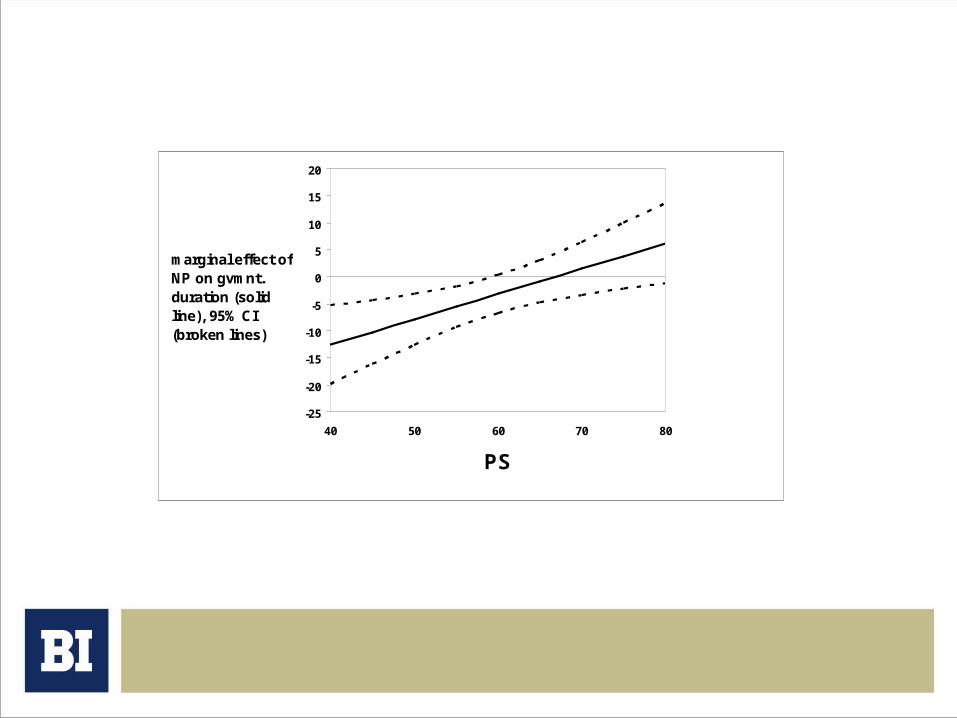
-25
-20
-15
-10
-5
0
5
10
15
20
40 50 60 70 80
PS
marginal effect of NP on gvmnt. duration (solid line), 95% CI (broken lines)
Excercise (I)
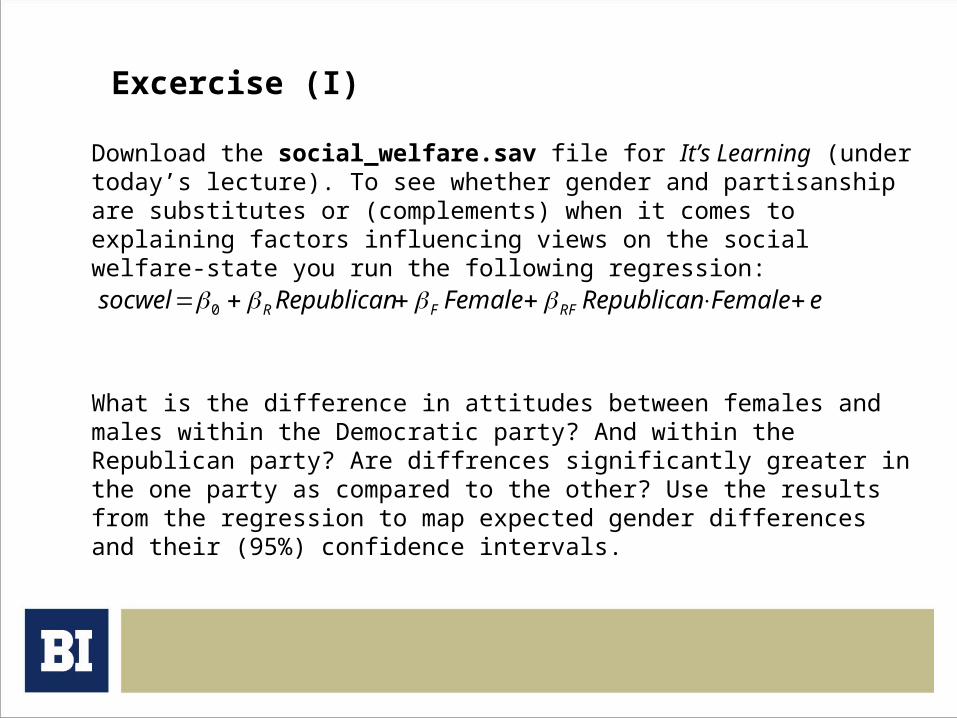
1) Download the social_welfare.sav file for It’s Learning (under today’s lecture). To see whether gender and partisanship are substitutes or (complements) when it comes to explaining factors influencing views on the social welfare-state you run the following regression:
What is the difference in attitudes between females and males within the Democratic party? And within the Republican party? Are diffrences significantly greater in the one party as compared to the other? Use the results from the regression to map expected gender differences and their (95%) confidence intervals.
eFemaleRepublicanFemaleRepublicansocwel RFFR 0
Excercise (II)
1) Under today’s lecture on It’s Learning download the lr_md2.sav data that combines the left-right self placement median etsimate from the 1990s with Persson and Tabellini’s economic and institutional data (the 85cross…sav). Construct interaction terms between the LR estimate (md_est) and the institutional indicators (propres2, majpar2 etc.) and perform a regression where you include these intarction terms. Analyze the effect of changing from a proportional parliamentary system to a majoritarian parliamentary system as the electorate’s ideological position changes (a la Gable and Hix (2005; figure2)). Compare the results to G&H’s original result.
Logistic regression
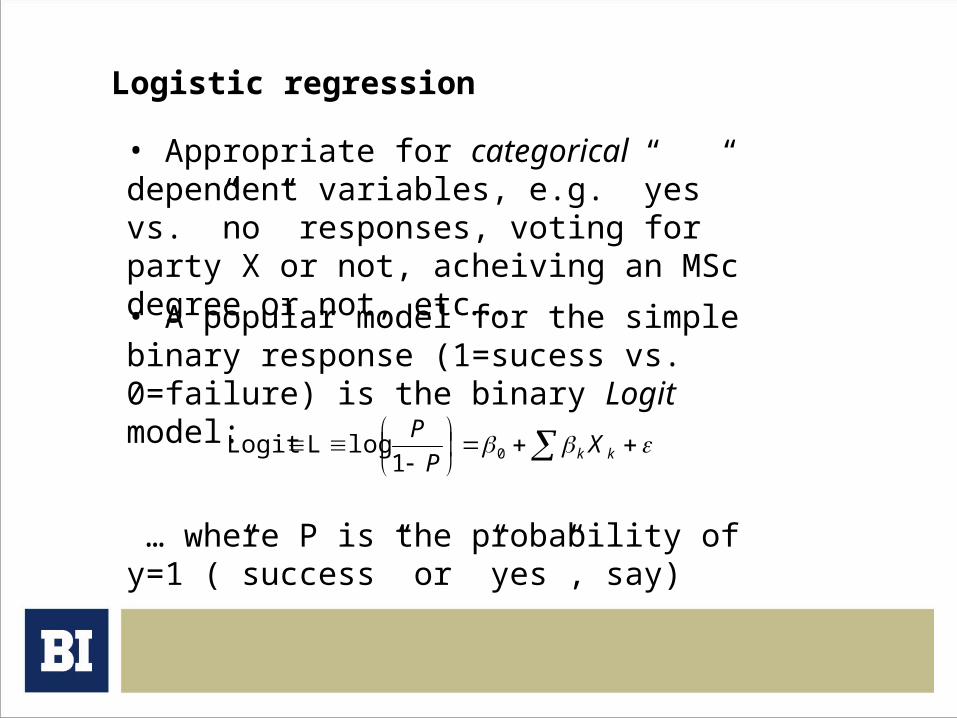
• Appropriate for categorical dependent variables, e.g. ”yes” vs. ”no” responses, voting for party X or not, acheiving an MSc degree or not, etc….
• A popular model for the simple binary response (1=sucess vs. 0=failure) is the binary Logit model:
… where P is the probability of y=1 (”success” or ”yes”, say)
kk X
P
P01
logLLogit
Logistic regression
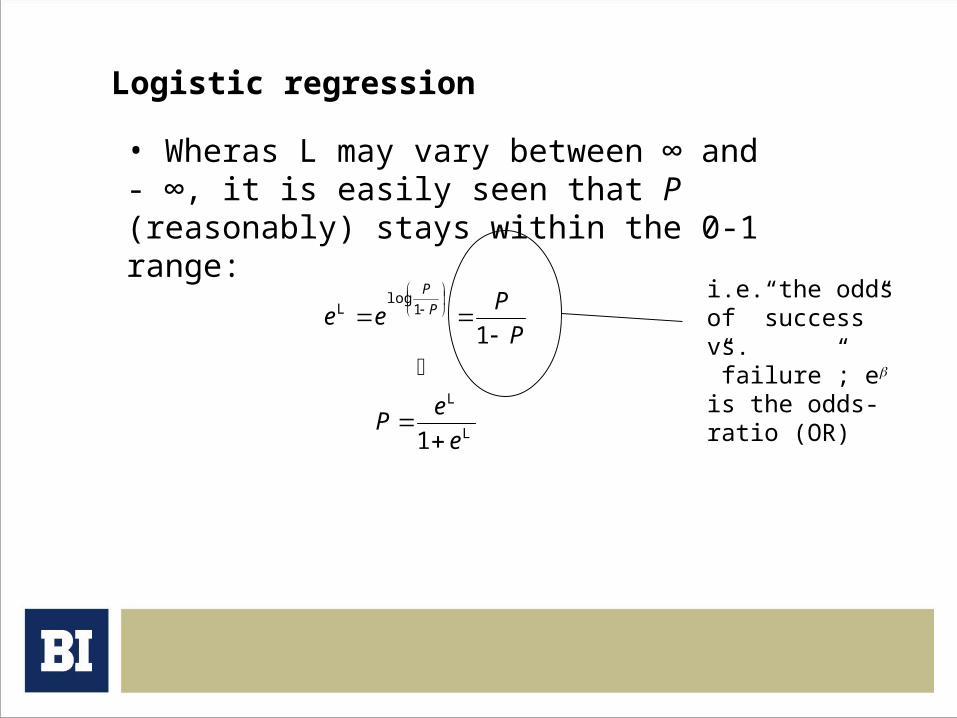
• Wheras L may vary between ∞ and - ∞, it is easily seen that P (reasonably) stays within the 0-1 range:
L
L
1log
L
1
1
e
eP
P
Pee P
P
i.e. the odds of ”success” vs. ”failure”; e is the odds-ratio (OR)
Logistic regression
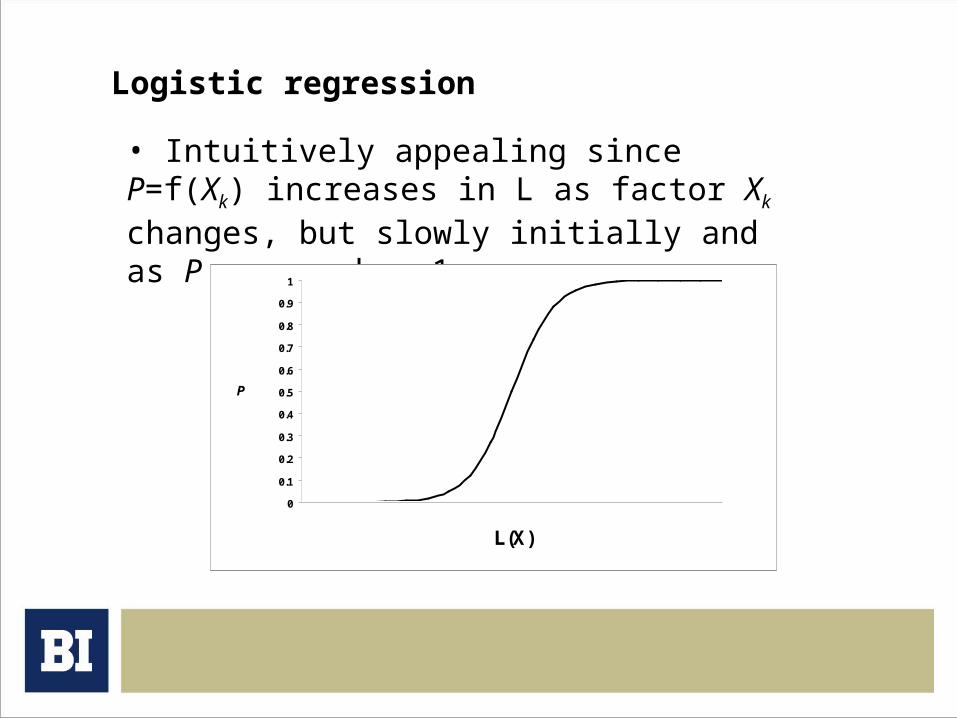
• Intuitively appealing since P=f(Xk) increases in L as factor Xk changes, but slowly initially and as P approaches 1:
0
0.1
0.2
0.3
0.4
0.5
0.6
0.7
0.8
0.9
1
L(X)
P
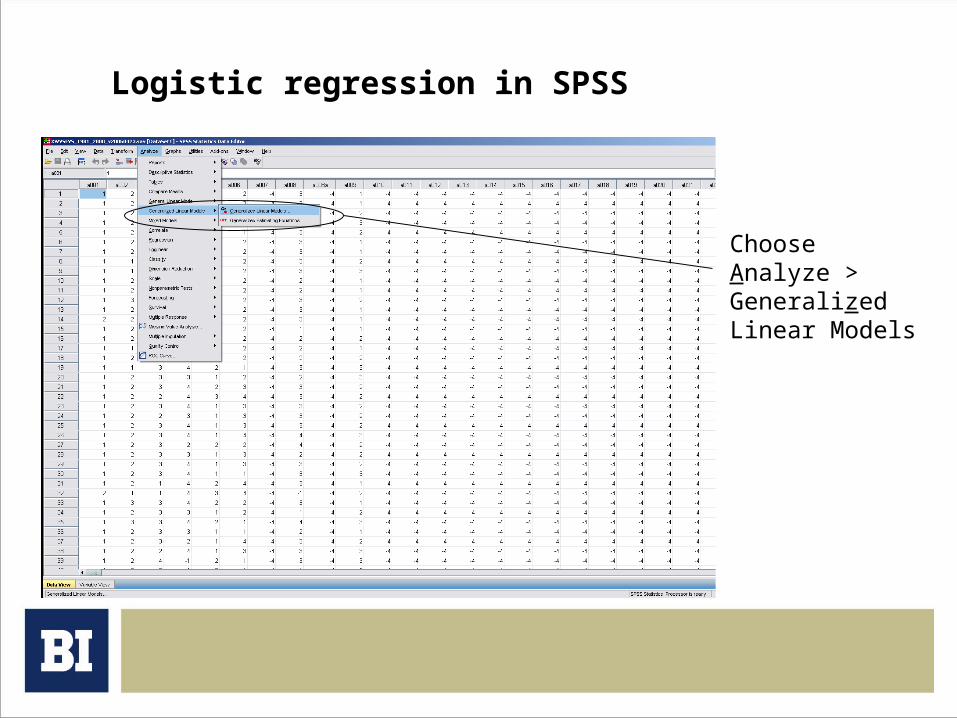
Logistic regression in SPSS
Choose Analyze > Generalized Linear Models
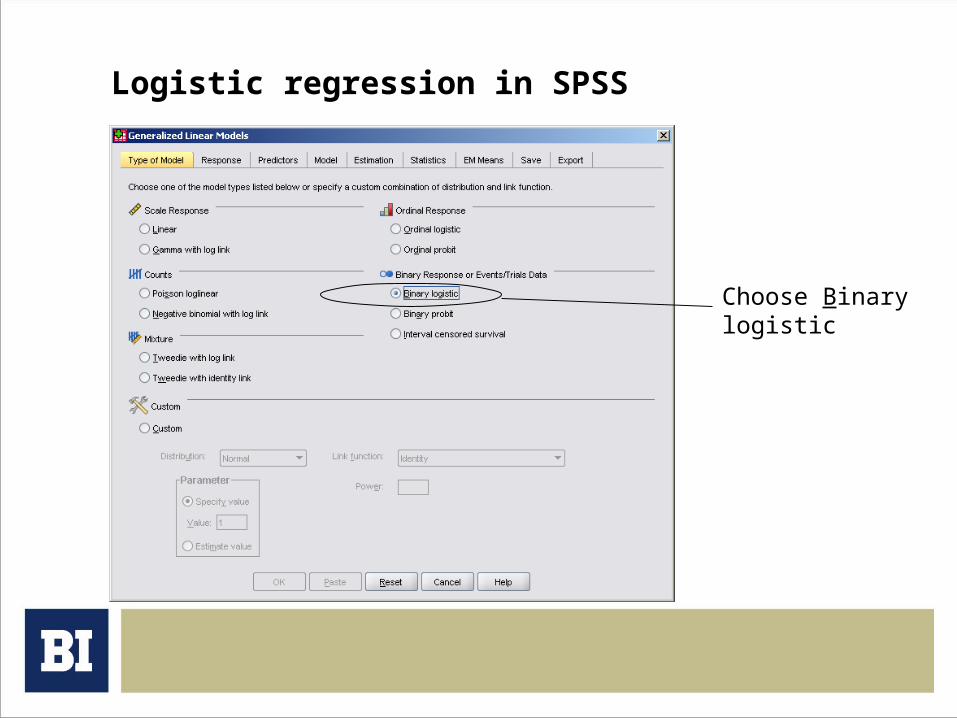
Logistic regression in SPSS
Choose Binary logistic
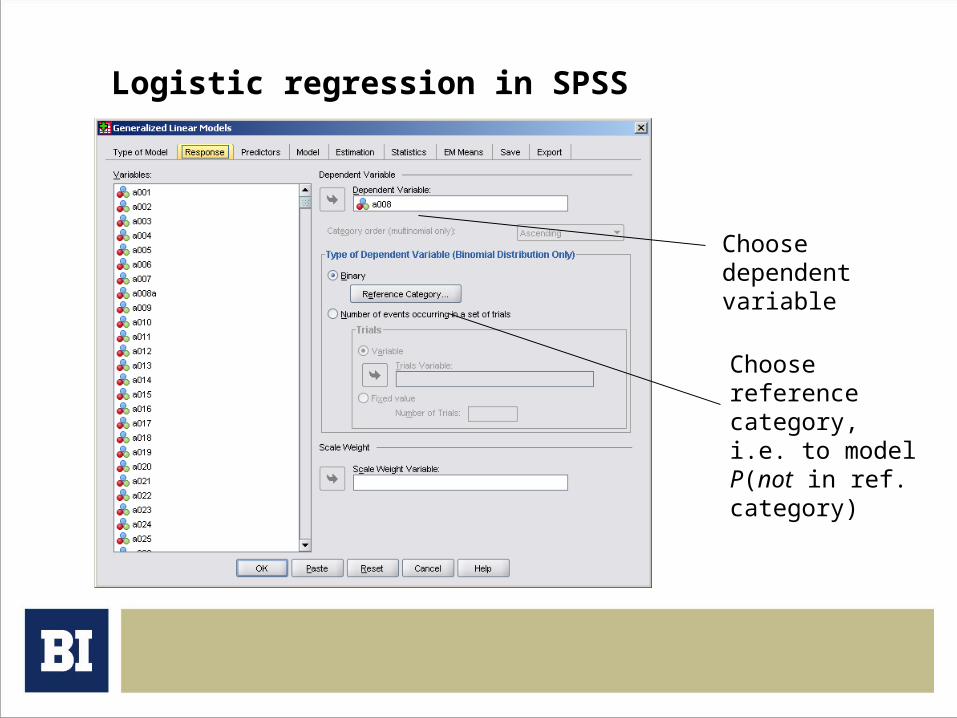
Logistic regression in SPSS
Choose dependent variable
Choose reference category, i.e. to model P(not in ref. category)
Logistic regression in SPSS
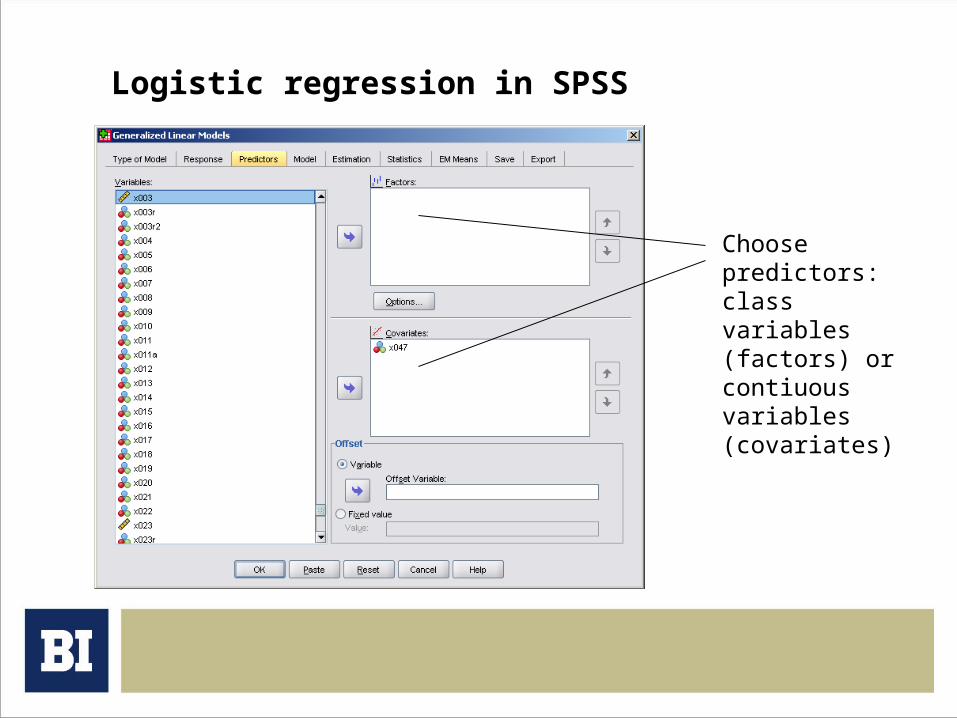
Choose predictors: class variables (factors) or contiuous variables (covariates)
Logistic regression in SPSS
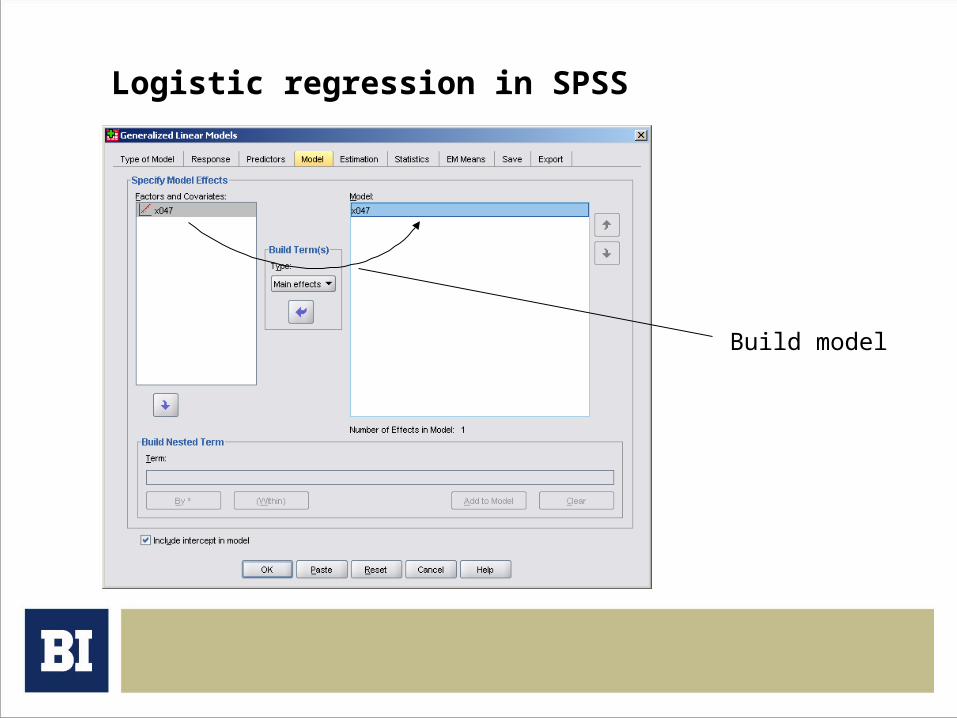
Build model
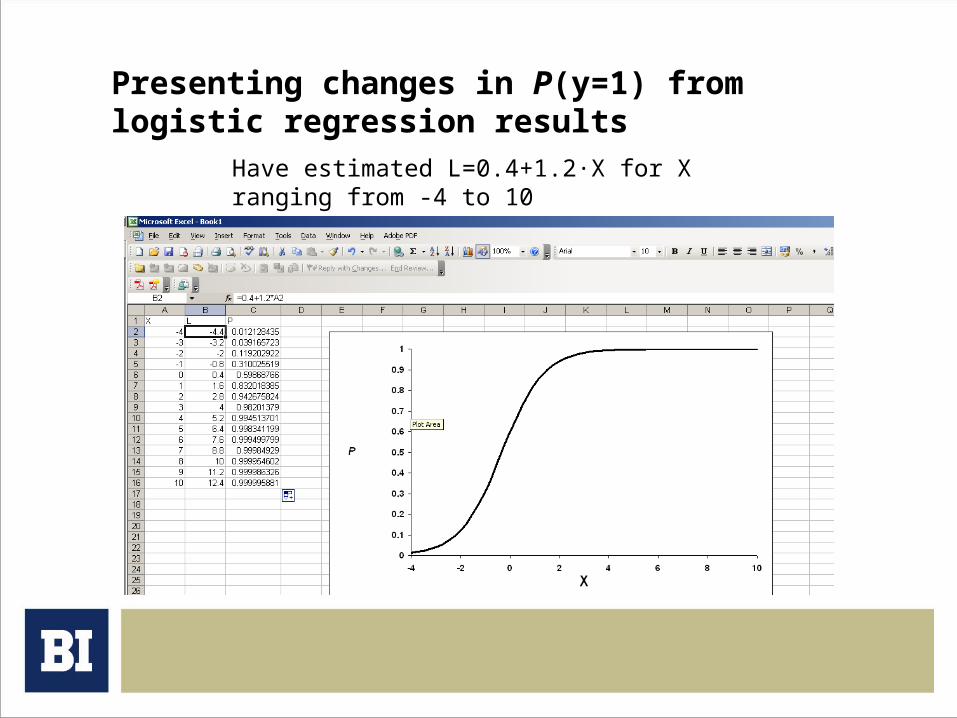
Presenting changes in P(y=1) from logistic regression results
Have estimated L=0.4+1.2·X for X ranging from -4 to 10

Presenting changes in P(y=1) from logistic regression results
Have estimated L=0.4+1.2·X for X ranging from -4 to 10
Recommended