Goncalves da silva, H. M., Matthews, J., Conceição, R., Wright, M., Pereira,S., Reis, A. H., & Shallcross, D. (2015). Modulation of urban atmosphericelectric field measurements with the wind direction in Lisbon (Portugal). InJ. Matthews (Ed.), Electrostatics 2015: 12–16 April 2015, Southampton, UK[012013] (Journal of Physics: Conference Series; Vol. 646, No. 1). IOPPublishing. https://doi.org/10.1088/1742-6596/646/1/012013
Publisher's PDF, also known as Version of record
License (if available):CC BY
Link to published version (if available):10.1088/1742-6596/646/1/012013
Link to publication record in Explore Bristol ResearchPDF-document
This is the final published version of the article (version of record). It first appeared online via IOP athttp://iopscience.iop.org/article/10.1088/1742-6596/646/1/012013/meta. Please refer to any applicable terms ofuse of the publisher.
University of Bristol - Explore Bristol ResearchGeneral rights
This document is made available in accordance with publisher policies. Please cite only the publishedversion using the reference above. Full terms of use are available:http://www.bristol.ac.uk/pure/about/ebr-terms
This content has been downloaded from IOPscience. Please scroll down to see the full text.
Download details:
IP Address: 137.222.138.50
This content was downloaded on 23/02/2017 at 08:54
Please note that terms and conditions apply.
Modulation of urban atmospheric electric field measurements with the wind direction in Lisbon
(Portugal)
View the table of contents for this issue, or go to the journal homepage for more
2015 J. Phys.: Conf. Ser. 646 012013
(http://iopscience.iop.org/1742-6596/646/1/012013)
Home Search Collections Journals About Contact us My IOPscience
Modulation of urban atmospheric electric field measurements
with the wind direction in Lisbon (Portugal)
H G Silva, 1,2
J C Matthews,1 R Conceição,
2 M D Wright,
1 S N Pereira,
2 A H
Reis,2 D E Shallcross
2
1Atmospheric Chemistry Research Group, University of Bristol, Cantock’s Close,
Bristol, BS8 1TS, UK 2Departamento de Física, ECT, Instituto de Ciências da Terra, IIFA, Universidade de
Évora, Rua Romão Ramalho 59, 7002-554 Évora, Portugal
Email: [email protected]
Abstract. Atmospheric electric field measurements (potential gradient, PG) were retrieved in
the urban environment of the city of Lisbon (Portugal). The measurements were performed
with a Benndorf electrograph at the Portela Meteorological station in the suburbs of the city
(NE from the centre). The period of 1980 to 1990 is considered here. According to wind
direction, different content and types of ions and aerosols arrive at the measurement site
causing significant variations to the PG. To the south there are significant pollution sources
while to the north such sources are scarcer . The Iberian Peninsula is found east of the station
and the Atlantic Ocean covers the western sector, Wind directions are divided in four sectors:
i) NW: 270º ≤ θ ≤ 360º; ii) NE: 0 ≤ θ ≤ 90º; iii) SE: 90 ≤ θ ≤ 180º; iv) SW: 180º ≤ θ ≤ 270º.
Analysis of weekly cycle, caused by anthropogenic pollution related with urban activity, was
undertaken for each wind sector. NW sector has been shown to be less affected by this cycle,
which is attributed to the effect of marine air. The daily variation of NE sector for weekends
reveals a similar behaviour to the Carnegie curve, which corresponds to a clean air daily
variation of PG, following universal time, independent of measurement site.
1. Introduction
Surface atmospheric electric field (potential gradient, PG) measurements in urban environments are
affected by anthropogenic action [1]. The main agents of these influences are pollutant aerosols from
traffic, heating and industrial activity. According to the geographical location of pollutant sources
around a measurement point, different winds bring different ion and aerosol contents; for that reason a
significant modulation of PG is expected according to wind direction. Such modulation has been
observed in different situations: high-voltage power-lines [2], traffic routes [3] and coastal regions [4].
The modulation caused by the wind direction can be of great importance as it varies the
measurement conditions, for example, in an urban environment air with different pollutant content can
reach the measurement site. The comprehension of such modulation can be achieved in long time
series of PG, as in the case of Portela-Lisbon historical records [5]. This is because it enables the
selection of a long time series measured with a characteristic pollution type, if the proper wind sectors
are selected. Obviously, such possibilities are of huge value, for instance, in studies related to the
Global Electric Circuit where pollution drastically perturbs any results and clean air is desirable.
Electrostatics 2015 IOP PublishingJournal of Physics: Conference Series 646 (2015) 012013 doi:10.1088/1742-6596/646/1/012013
Content from this work may be used under the terms of the Creative Commons Attribution 3.0 licence. Any further distributionof this work must maintain attribution to the author(s) and the title of the work, journal citation and DOI.
Published under licence by IOP Publishing Ltd 1
For that reason, in the present work the historical PG time series of Portela-Lisbon is divided in
four different wind sectors and the hypothesis of wind direction modulation is tested.
2. Data and methodology
PG was recorded with a Benndorf electrograph coupled to a radioactive probe installed at 1 m height
at Portela meteorological station (suburbs of Lisbon, Portugal); more details can be found in [1,5]. Due
to the nuclear fallout of the 1960’s and 1970’s, only the period from 1980 to 1990 is considered.
Moreover, only non-negative values of PG are selected as negative ones often correspond to
precipitation and cannot be considered. Otherwise, high positive PG values can occur as a
consequence of pollution, as in case of fire. This phenomenon occurred during the historical Chiado’s
fire in Lisbon downtown [6]. Lisbon is situated on the north margin of the Tagus River and Portela
station (close to Lisbon airport) is located to its northeast. Traffic and urban heating are the main
causes of pollution in the city. In the 1980’s the most significant pollution sources could be found in
the south margin of the river (Setubal region). At the east of Lisbon the Tagus river basin and the
Iberian Peninsula can be found, while the Atlantic Ocean is found to the west . Thus it is expected that
winds from different directions should modulate PG as they are expected to contain different air
contents. At Portela south winds bring pollution from the city mixed with the pollution from industry,
west winds transport some pollution from the city mixed with marine aerosols, north winds carry less
pollution mainly from the city activity and the east winds carry also continental aerosols.
To evaluate the effect of the anthropogenic pollution in each sector the procedure developed in [1]
is used. It is based on the signature left by the weekly cycle of urban activity in air pollution and hence
in PG. In [1] the PG was separated into workdays, Mondays to Fridays, PGworkdays (WD) and
weekends, Saturdays and Sundays, PGweekends (WK). It is expected that PG has higher values for
workdays if compared with PG for the weekends, because workdays have more pollution. Thus, to
evaluate the difference between workdays and weekends, the relative difference is used:
ΔPG (%) = (PGworkdays/PGweekends1) ×100.
(1)
The comparison of the daily cycle for workdays and weekends is also very informative and such
method is used here. Finally, the Lomb-Scargle Spectrum (LSS) technique is used to identify the
presence and importance of the weekly cycle in each wind sector. This technique was used in [1] and
described in detail there. The program used is an LSS implementation developed for MATLAB® [7].
3. Results and discussion
3.1. Boxplot analysis
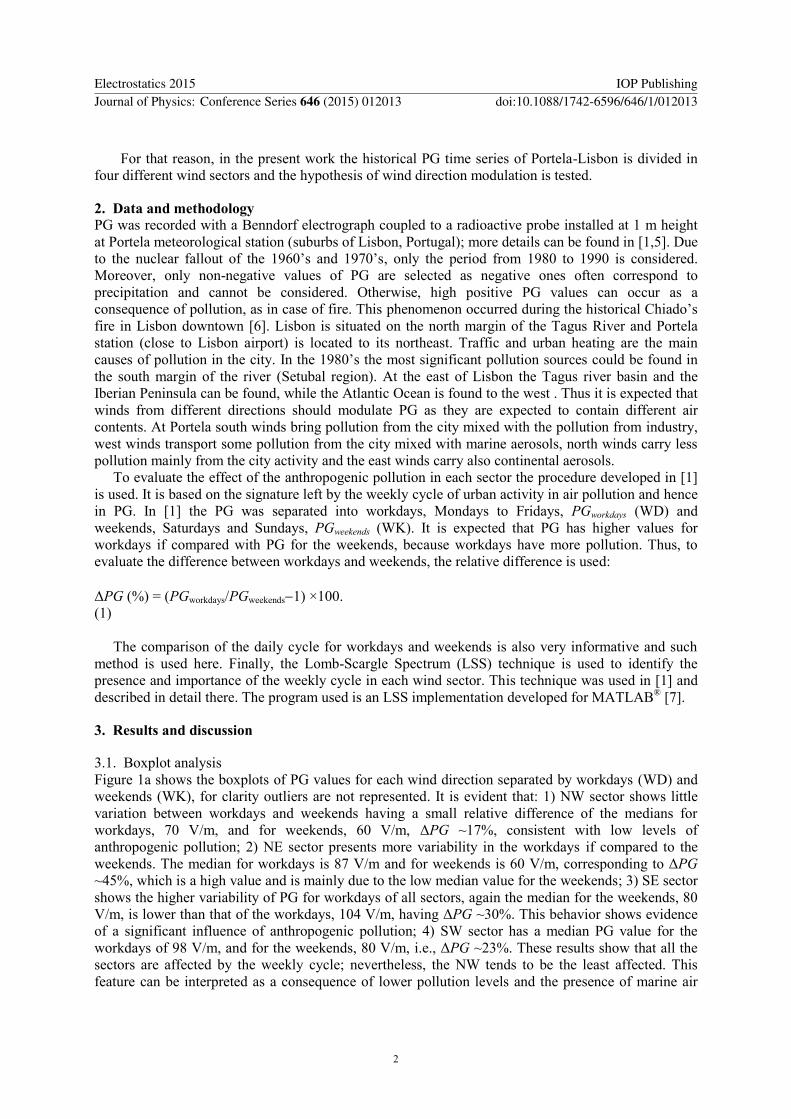
Figure 1a shows the boxplots of PG values for each wind direction separated by workdays (WD) and
weekends (WK), for clarity outliers are not represented. It is evident that: 1) NW sector shows little
variation between workdays and weekends having a small relative difference of the medians for
workdays, 70 V/m, and for weekends, 60 V/m, ΔPG ~17%, consistent with low levels of
anthropogenic pollution; 2) NE sector presents more variability in the workdays if compared to the
weekends. The median for workdays is 87 V/m and for weekends is 60 V/m, corresponding to ΔPG
~45%, which is a high value and is mainly due to the low median value for the weekends; 3) SE sector
shows the higher variability of PG for workdays of all sectors, again the median for the weekends, 80
V/m, is lower than that of the workdays, 104 V/m, having ΔPG ~30%. This behavior shows evidence
of a significant influence of anthropogenic pollution; 4) SW sector has a median PG value for the
workdays of 98 V/m, and for the weekends, 80 V/m, i.e., ΔPG ~23%. These results show that all the
sectors are affected by the weekly cycle; nevertheless, the NW tends to be the least affected. This
feature can be interpreted as a consequence of lower pollution levels and the presence of marine air
Electrostatics 2015 IOP PublishingJournal of Physics: Conference Series 646 (2015) 012013 doi:10.1088/1742-6596/646/1/012013
2
due to the western winds from the Atlantic Ocean. In fact, marine air is known to increase atmospheric
conductivity [4] with the consequently reduction PG.
Figure 1 a) Boxplots of the PG for the different wind sectors divided in workdays (WD) and weekends (WK);
b) Daily behaviour of the median PG values for 1980 to 1990 separated in workdays (WD) and weekends (WK).
3.2. Daily behaviour
Figure 1b presents the daily behaviour of the median PG values for the studied period and considering
workdays and weekends in separate. On the one hand the northern sectors, NW and NE, show little
difference between the daily behaviour of the workdays and the weekends. Actually, the NW sector
shows the lowest values of the sectors. On the other hand the southern sectors show the most
significant difference from the workdays to weekends, in particular, the SE and SW sectors show a
prominent disparity in the period 8.00 a.m. – 8.00 p.m., the period of greatest anthropogenic activity.
This aspect may be interpreted as the signature of pollution coming from industries south of Tagus
River, which are most active in that period. Lastly, the daily variation of NE sector for weekends
reveals a similar behavior to the Carnegie curve, the background 24 cycle of atmospheric electric field
caused by variations in global thunderstorm activity [8].
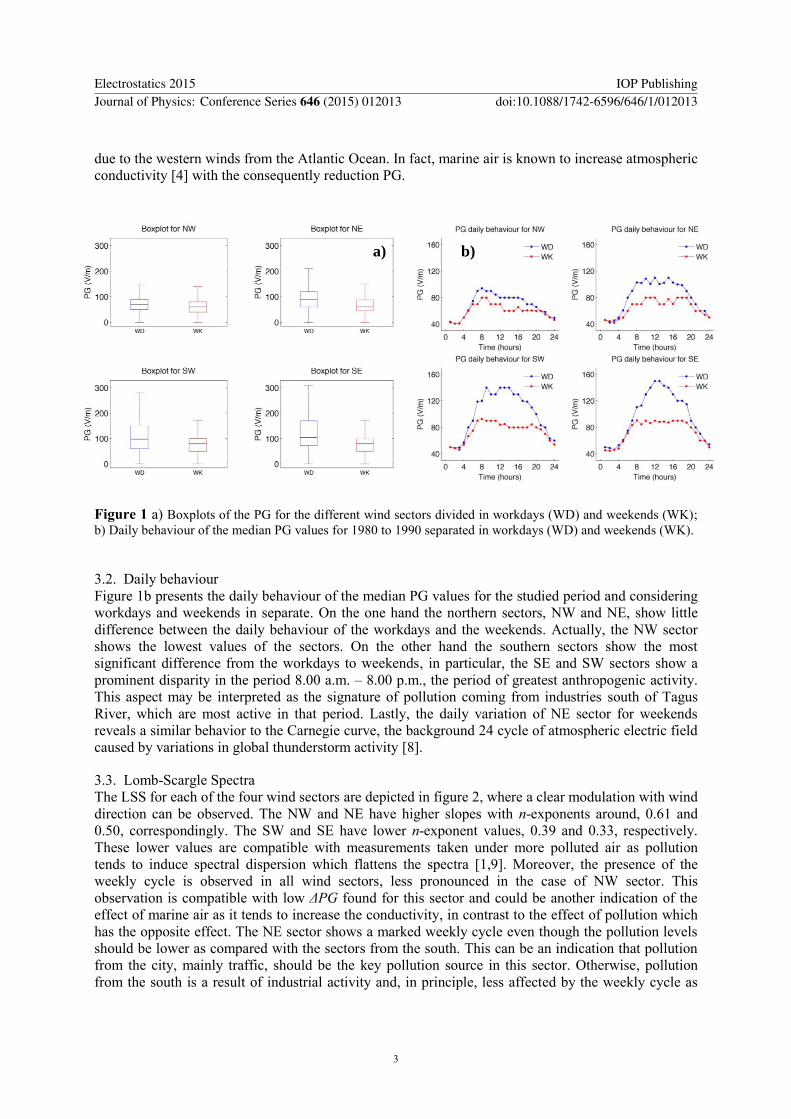
3.3. Lomb-Scargle Spectra
The LSS for each of the four wind sectors are depicted in figure 2, where a clear modulation with wind
direction can be observed. The NW and NE have higher slopes with n-exponents around, 0.61 and
0.50, correspondingly. The SW and SE have lower n-exponent values, 0.39 and 0.33, respectively.
These lower values are compatible with measurements taken under more polluted air as pollution
tends to induce spectral dispersion which flattens the spectra [1,9]. Moreover, the presence of the
weekly cycle is observed in all wind sectors, less pronounced in the case of NW sector. This
observation is compatible with low ΔPG found for this sector and could be another indication of the
effect of marine air as it tends to increase the conductivity, in contrast to the effect of pollution which
has the opposite effect. The NE sector shows a marked weekly cycle even though the pollution levels
should be lower as compared with the sectors from the south. This can be an indication that pollution
from the city, mainly traffic, should be the key pollution source in this sector. Otherwise, pollution
from the south is a result of industrial activity and, in principle, less affected by the weekly cycle as
a) b)
Electrostatics 2015 IOP PublishingJournal of Physics: Conference Series 646 (2015) 012013 doi:10.1088/1742-6596/646/1/012013
3
many industries continue in activity at the weekends. Finally, all sectors, except the SE, clearly show,
besides the daily cycle, a half-day cycle.
Figure 2. Lomb-Scargle Spectra
corresponding to the four wind
sectors. The following parameters
were used hifac=1 (that defines the
frequency limit as hifac times the
average Nyquist frequency), ofac=4
(oversampling factor). This exponent,
(n-exponent) is defined from the
asymptotic spectral amplitude, S, with
the frequency, f, usually written as
𝑆 ~ 𝑓−𝑛.
4. Conclusion
A clear modulation of atmospheric electric field measurements with wind sector/direction is observed
in the mean daily cycles. NW was found to be the sector less influenced, which has been attributed to
the effect of more conductive marine air. The daily variation of NE sector for weekends reveals a
similar behavior to the Carnegie curve. Finally, the effect of pollution of industries located to the south
of Lisbon on PG is found to be strong in the period 8.00 a.m. – 8.pm.
Acknowledgments
HGS and SNP acknowledge the support of Science and Technology Foundation (FCT) for the Post-
Doctoral fellowships, SFRH/BPD/63880/2009 and SFRH/BPD/81132/2011. The authors acknowledge
the support from the FCT/FEDER-COMPETE project EAC (PTDC/GEO-FIQ/4178/2012) FCOMP-
01-0124-FEDER-029197. The authors are grateful to Claudia Serrano, Samuel Bárias, and Doctor
Mário Figueira in recording and preparing the data.
References
[1] Silva H G, Conceição R, Melgão M, Nicoll K, Mendes P B, Tlemçani M, Reis A H, Harrison R
G 2014 Env. Res. Let. 9 114025
[2] Matthews J C, Ward J P, Keitch P A, Henshaw D L 2010 Atmos. Environ. 44 5093-100
[3] Israelsson S, Lelwala R 1999 Atmos. Res. 51 301–307
[4] Wilding R J, Harrison RG 2005 Atmos. Environ. 39 5876–5883
[5] Silva H G, Conceição R, Wright M D, Matthews J C, Pereira S N, Shallcross D E 2015 Jour.
Aero. Sci. 85 42
[6] Conceição R, Melgão M, Silva H G, Nicoll K, Harrison R G, Reis A H 2015 Air Qua. Atmos.
Health 8
[7] http://www.mathworks.com/matlabcentral/fileexchange/993-lombscargle-m [8] Harrison R G 2013 Surv. Geophys. 34 209–232
[9] Tchepel O, Borrego C 2010 Jour. Environ. Monit. 12 544–55
Electrostatics 2015 IOP PublishingJournal of Physics: Conference Series 646 (2015) 012013 doi:10.1088/1742-6596/646/1/012013
4
Recommended


![68 Tercyo Rinaldo Goncalves Pineo[1]](https://img.pdfslide.us/doc/110x75/55cf9db6550346d033aed592/68-tercyo-rinaldo-goncalves-pineo1.jpg)


![Agenda Teatro Ribeiro Conceição [2º trimestre 2012]](https://img.pdfslide.us/doc/110x75/568bd7261a28ab20349eae4e/agenda-teatro-ribeiro-conceicao-2o-trimestre-2012.jpg)