Goldman Sachs 2012
Mining Services Conference
Keith Gordon, Managing Director & Chief Executive Officer

� Business &
Operating Overview
� Financial Overview
� Strategy & Outlook
Presentation Overview
Business & Operating Overview
Kalgoorlie, Western Australia

Rental in the Mining Production PhaseCustomer requirements vary but Emeco’s solution is used at all
stages of mine life
Materials
Movement
Ramp-up: Ramp-down:Full Mine Production:
Equipment
Availability
Flexibility Mechanical
Availability
Capital
Management
Avoid Residual
Risk
Ramp up Full mine production Ramp down
Long OEM
lead times
push miners
to rent
Flexibility to
change fleet
mix quickly
Non-core
equipment
required
Capital
allocation
Short
mine
life
Service ramp
up in material
movement
Supplement
owned fleet
during
scheduled
maintenance
Avoid
BCM scope
variation
Access
external
maintenance
& tyre supply
Manage
residual
risk
Non-core
equipment
required
Avoid
investment
Customers
Needs:
Emeco’s
Mining cycle
leverage:
Percentage leverage to mining cycle indicative of FY13 plan and
comprises 95% of group rental revenue 4
Mine Development
7%
Overburden
20%
Production
73%

Geographic & Commodity DiversificationWell diversified revenue streams from multiple regions and commodities with fleet redeployment opportunities
Canada Australia Indonesia Chile
� Oil sands
� Coal
� Gold
� Thermal Coal
� Gold
� Metallurgical Coal
� Iron Ore
� Thermal Coal
� Gold
� Copper
� Gold

6
� Fleet reconfiguration complete with incremental fleet growth driven by mining customer needs
� Emeco’s large and small mining fleets commonly used across Emeco’s markets
� Historical profit on sale of sale of mining rental assets
Global Fleet ProfileProduction focused fleet, suitable for variety of customers across
markets
Notes:
Civil defined as <70 tn artic trucks and related small ancillary equipment;
Small mining defined as <150 tn trucks and related mining equipment;
Large mining defined as 190+ tn trucks and related mining equipment.
Fleet mix
proportions
by WDV:

Customer Strategy
Australia Canada Indonesia
Targeting customers in each market which align with Emeco’s
strategic objectives
� Targeting customers requiring
fleets on long-term fully
maintained basis (project
sites)
� Achieve mix of mid-tier &
large miners and contractors
across bulks and gold
� Direct relationship with oil
sands companies to improve
utilization visibility
� Grow on-site maintenance
services creating additional
rental opportunities
� Focus on miners with
advanced mining practices to
ensure high monthly hours
� Bring Emeco’s maintenance
expertise to enhance mine
productivity
Customer objectives by region:
Revenue by customer type:
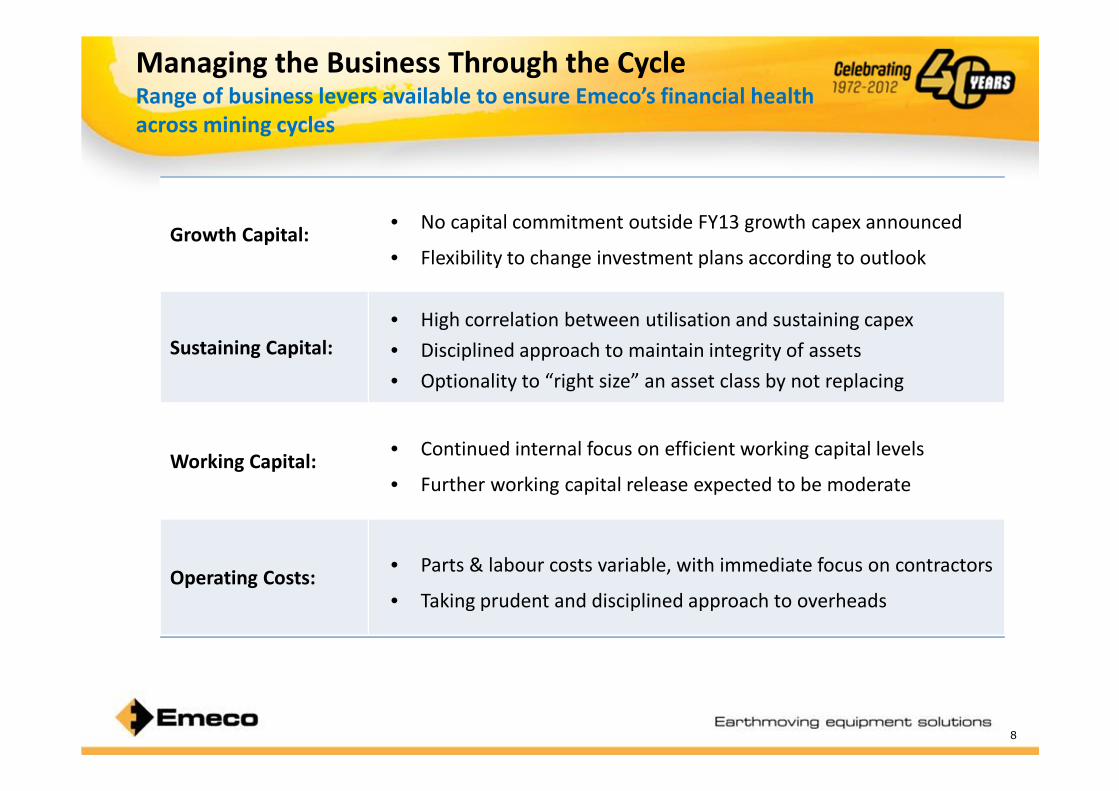
Managing the Business Through the Cycle
8
Range of business levers available to ensure Emeco’s financial health
across mining cycles
Growth Capital:• No capital commitment outside FY13 growth capex announced
• Flexibility to change investment plans according to outlook
Sustaining Capital:
• High correlation between utilisation and sustaining capex
• Disciplined approach to maintain integrity of assets
• Optionality to “right size” an asset class by not replacing
Working Capital:• Continued internal focus on efficient working capital levels
• Further working capital release expected to be moderate
Operating Costs:• Parts & labour costs variable, with immediate focus on contractors
• Taking prudent and disciplined approach to overheads

Global Business Snapshot
Australia:
� Customers focused on improving cost & productivity
� Shorter contract tenure
� Rate structure & maintenance responsibilities
� Increasingly competitive environment
� Emeco very active in pursuing new projects in
cautious environment
Canada:
� Significant improvement on Q1 utilization on
expanded asset base
� Customer strategy improving visibility
9
2H10 1H11 2H11 1H12 2H12 1H13
Global utilisation %
75%
Indonesia:
� Coal producers well placed on cost curve, but
monitoring global trends
� $30m growth capital deployed in Q1 with long
term contracts in place
Chile:
� Copper fundamentals intact, volume growth expected
� $55m of FY13 growth capital now under contract

Financial Overview

11
Financial summaryStrong performance in Australia with offshore businesses picking up steam
FY12 FY11 Var %
REVENUE 565.2 502.5 � 12.5%
EBITDA 261.7 223.3 � 17.2%
EBIT 126.0 101.2 � 24.5%
NPAT 71.1 56.0 � 27.0%
ROC % 13.2% 11.3% � 16.7%
OP. CASHFLOW 214.3 159.7 � 34.2%
GEARING 1.47 1.38 - 6.5%
DIVIDENDS 6.0 5.0 � 20.0%
Note: Gearing calculated as Normalised R12 EBITDA divided by Net Debt
12
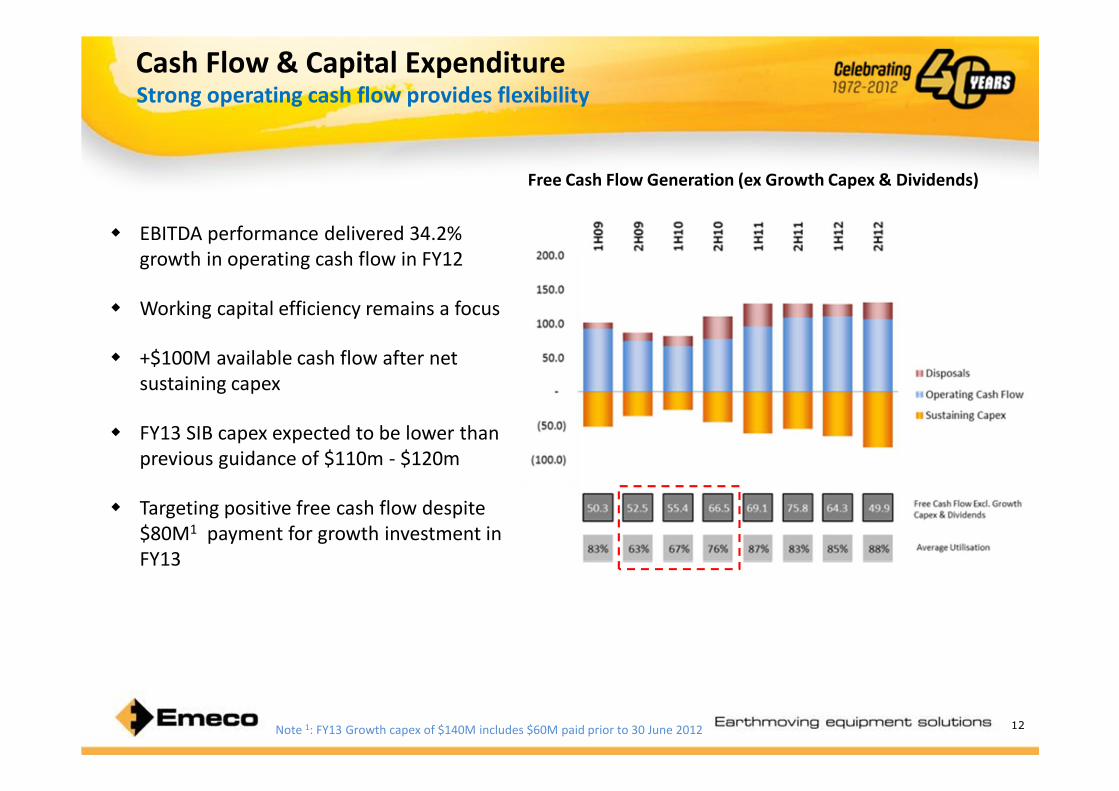
Cash Flow & Capital ExpenditureStrong operating cash flow provides flexibility
� EBITDA performance delivered 34.2%
growth in operating cash flow in FY12
� Working capital efficiency remains a focus
� +$100M available cash flow after net
sustaining capex
� FY13 SIB capex expected to be lower than
previous guidance of $110m - $120m
� Targeting positive free cash flow despite
$80M1 payment for growth investment in
FY13
Note 1: FY13 Growth capex of $140M includes $60M paid prior to 30 June 2012
Free Cash Flow Generation (ex Growth Capex & Dividends)

Note:
Facilities headroom comprises of Senior Debt, USPP notes, finance leases and
working capital facility; Net debt comprises drawn senior debt, USPP notes &
finance leases, less cash on hand
13
Balance Sheet & Capital ManagementBalance sheet provides certainty and flexibility
� Strong balance sheet with quality assets
and secure debt portfolio
� Bank debt refinancing and USPP provides
average maturity profile of ~5 years
� Gearing towards bottom of target range
� Cash flow levers ensures gearing can be
comfortably managed across the cycle
� Ongoing consideration of capital
management:
- Special dividend (5.0cps) in 1H11
- FY12 ordinary dividends up 20% yoy
- Executing share buy-back program
Gearing
Covenant 3.0x
Jun-08 Jun-09 Jun-10 Jun-11 Jun-12
Emeco’s Debt Maturity Profile

14
Return on Capital
ROC, ROFE & INVESTED CAPITAL
ROC calculated as R12 operating EBIT divide average Invested Capital
Invested capital = ‘Equity plus Net Debt’
EBIT PERFORMANCE
� Strategy has focused on:
� Exiting low returning assets/businesses
� Invest in production focused fleet
� Target highly productive customers
� Leverage fixed cost and goodwill
� Australia – incremental investments to
generate acceptable long term returns
� Canada & Indonesia - Foundations in place
for further improvements in returns
� Chile - Organic growth entry expected to
benefit ROC in the near term
Quality in the earnings growth
Strategy & Outlook

16
How has the business changed?Business now fitter, more sustainable and well positioned for the
future
Financial performance: Strategy translating to improved earnings and returns
Non-core businesses: Exited non-core businesses releasing underperforming capital & earnings drag
Fleet mix:Large mining fleet investment and civil earthmoving divestment positions business
to withstand volatility
Customers & Contracts:Targeting quality miners with high productivity
Improved contractual tenure and minimum hours
Offshore markets &
commodity diversification:
Building foundation of value adding businesses offshore
Each offshore business including Chile provides diversified exposure to growing
mining markets
Investment grade debt
facilitiesDiversified sources of funding in place with balanced maturity profile
Culture: Focussing on building a positively engaged workforce

17
Consistent Value Creation
for Shareholders
Strategic focus
Identify value creating opportunities aligned with strategy
� Maintain strong balance sheet including ongoing funding strategy
� Capital allocation continually reviewed based on shareholder returns
Improving our core businesses
� Contract renewals & project sites
a priority for Australia
� Build on new customer
relationships in Canada &
Indonesia
� Execute business improvement
initiatives
Executing on organic growth
� Securing contracts for new fleet into
Chile over FY13
� Consolidate contract wins in
Indonesia
� Grow maintenance opportunity in
Canada

Emeco Outlook
A diversified portfolio to provide benefits in the year ahead
18
� Changing environment in Australian market with focus on operating costs by customers
- Recent contract wins in gold and iron ore
- Renewed large contracts with coal customers late in 2H12
- Number of contracts with some coal customers concluding mid FY13 as expected,
but visibility on extension limited
� Expected to build on solid summer with strong winter in Canadian oil sands
� Low cost producers expected to provide further opportunities in Indonesian coal
� Copper expansion projects in Chile supportive of market entry strategy
� Emeco’s cost and capital continually being reviewed to ensure the business remains in
shape to manage volatility and capture opportunities

<INSERT PICTURE>
Questions
Hitachi EX3600, Queensland

emecogroup.com
Thank you for your interest in Emeco
Further investor enquiries should be directed to:
� Keith Gordon CEO
� Stephen Gobby CFO
Further Information

Appendix
Appendices
Hitachi EX3600, Queensland

Finance Facilities
22
Detailed Financials
Balance Sheet
Profit & LossCash flow
A$ Millions FY11 FY12
A$ m A$ m
Cash from operations 196.3 252.5
Interest & Borrowing costs (22.6) (24.3)
Income tax payments (14.0) (13.8)
Operating Cash flow 159.7 214.3
General Working Capita l 9.0 (9.8)
Sa les & Parts Inventory 37.6 13.5
Cash flow from Operating Activi ties 206.3 218.0
Susta ining Capex (87.5) (127.1)
Other Property, Plant & Equipment (27.9) (19.5)
Dispos al s 53.9 42.8
Susta ining Fleet Cas h Flow (61.5) (103.9)
Cash flow (pre investment) 144.8 114.1
Dividends (56.9) (34.7)
Growth Capex (105.8) (170.4)
Free Cash flow (post investment) (17.9) (91.0)
Facility limit Drawn Headroom Maturity
A$ Millions 30-Jun-12
Senior Debt (3-year) 300.0 242.6 57.4 Nov 2013
Senior Debt (5-year) 150.0 59.3 90.7 Nov 2015
USPP (7-year) 40.5 40.5 – May 2019
USPP (10-year) 101.3 101.3 – May 2022
Finance Lease 15.7 15.7 – Aug 2015
Working Capital 21.9 – 21.9 Range
Total Debt 629.4 459.5 169.9 –
Cash – (73.1) 73.1 –
Net Debt 629.4 386.4 243.0 –
A$ Millions Jun-10 Jun-11 Jun-12
A$ m A$ m A$ m
General working capital 85.9 59.2 69.0
Sales & Parts inventory 77.7 42.7 29.7
Rental plant 572.1 620.6 793.1
Intangibles 178.2 173.2 173.9
Other assets 96.3 81.8 56.7
Cash 5.2 5.0 73.1
Total debt (309.3) (298.8) (459.5)
Other l iabilities (83.3) (81.6) (22.6)
Net Assets 622.7 602.2 640.4
Facilities Headroom 328.4 198.9 169.9
Interest Cover 8.70 9.73 11.37
Net Debt: EBITDA 1.56 1.36 1.47
A$ Millions FY11 FY12 Var
Operating Operating %
Revenue 502.5 565.2 12.5
EBITDA 223.3 261.7 17.2
EBIT 101.2 126.0 24.5
Interest (23.0) (24.4) 6.1
Tax (22.2) (30.4) 36.9
NPAT 56.0 71.1 27.0
EPS (cps) 8.9 11.3 27.0
DPS (cps) 5.0 6.0 20.0
Invested Capital 896.9 955.6 6.5
R12 ROC (%) 11.3% 13.2% 1.9%

23
Geographic Segments
Operating Results
FY11 FY12 Var %
Revenue 327.2 383.3 17.1%
EBITDA 185.3 215.7 16.4%
EBIT 98.3 115.6 17.6%
Avg. Funds Employed 413.0 507.6 22.9%
ROFE % 23.8% 22.8% -4.4%
No. machines at 30 June 542.0 509.0 -6.1%
WDV machines at June 421.2 486.0 15.4%
No. workforce 576.0 580.0 0.7%
LTIFR 3.9 3.1 -19.6%
Australia Indonesia Canada
Operating Results
FY11 FY12 Var %
Revenue 44.6 49.9 12.0%
EBITDA 21.0 25.2 19.9%
EBIT 5.3 10.0 87.8%
Funds Employed 81.5 77.8 -4.6%
ROFE % 6.5% 12.8% 97.0%
No. machines at 30 June 182.0 229.0 25.8%
WDV machines at June 53.7 96.0 78.8%
No. workforce 293.0 356.0 21.5%
LTIFR – – 0.0%
Operating Results
FY11 FY12 Var %
Revenue 64.9 67.2 3.5%
EBITDA 32.6 35.9 10.1%
EBIT 14.0 16.2 15.4%
Funds Employed 123.9 160.4 29.4%
ROFE % 11.3% 10.1% -10.8%
No. machines at 30 June 148.0 169.0 14.2%
WDV machines at June 102.9 212.0 106.0%
No. workforce 71.0 93.0 31.0%
LTIFR – 5.6 100.0%
Note: Australia excludes Victoria (discontinued) and Sales & Parts

Reliance on third party information
The information and views expressed in this Presentation were prepared by Emeco Holdings Ltd (the Company) and may contain information that has been derived
from publicly available sources that have not been independently verified. No representation or warranty is made as to the accuracy, completeness or reliability of
the information. No responsibility or liability is accepted by the Company, its officers, employees, agents or contractors for any errors, misstatements in or omissions
from this Presentation.
Presentation is a summary only
This Presentation is information in a summary form only and does not purport to be complete. It should be read in conjunction with the Company’s 2011/12
financial report. Any information or opinions expressed in this Presentation are subject to change without notice and the Company is not under any obligation to
update or keep current the information contained within this Presentation.
Not investment advice
This Presentation is not intended and should not be considered to be the giving of investment advice by the Company or any of its shareholders, directors, officers,
agents, employees or advisers. The information provided in this Presentation has been prepared without taking into account the recipient’s investment objectives,
financial circumstances or particular needs. Each party to whom this Presentation is made available must make its own independent assessment of the Company
after making such investigations and taking such advice as may be deemed necessary.
No offer of securities
Nothing in this Presentation should be construed as either an offer to sell or a solicitation of an offer to buy or sell Company securities in any jurisdiction.
Forward looking statements
This Presentation may include forward-looking statements. Although the Company believes the expectations expressed in such forward-looking statements are
based on reasonable assumptions, these statements are not guarantees or predictions of future performance, and involve both known and unknown risks,
uncertainties and other factors, many of which are beyond the Company’s control. As a result, actual results or developments may differ materially from those
expressed in the statements contained in this Presentation. Investors are cautioned that statements contained in the Presentation are not guarantees or projections
of future performance and actual results or developments may differ materially from those projected in forward-looking statements.
No liability
To the maximum extent permitted by law, neither the Company nor its related bodies corporate, directors, employees or agents, nor any other person, accepts any
liability, including without limitation any liability arising from fault or negligence, for any direct, indirect or consequential loss arising from the use of this Presentation
or its contents or otherwise arising in connection with it.
24
Disclaimer
Recommended