www.reportocean.com
ABOUT REPORT OCEAN
Report Ocean provides a full scope of business intelligence solution for solving your toughest challenges. RO is an emerging global expert & pioneer in the market research and
provision of exclusive market INTEL. We optimize your decision making by equipping your industry with an accurate & better market research according to your industry
demands through our professionally designed qualitative & quantitative research methods
We believe in delivering strategic blueprint of success that will help our Clients to pave their paths of success. Industries we are catering to as below
Healthcare,Pharma
& Medical Devices
Information & Communication Technology (ICT)
Chemicals& Materials
Automotive& Transportation
Mining, Minerals& Metals
Supply Chain& Logistics
Consumer Goods & Packaging
Aerospace &Defense andAutomation
Construction Services
Electronics Services
Food & Beverage and Agriculture
Energy & Power
2

TABLE OF CONTENTS
3
3
www.reportocean.com
Chapter 1.Research Framework
1.1.Research Objective
1.2.Product Overview
1.3.Market Segmentation
Chapter 2.Research Methodology
2.1.Qualitative Research
2.1.1. Primary & Secondary Sources
2.2.Quantitative Research
2.2.1. Primary & Secondary Sources
2.3.Breakdown of Primary Research Respondents, By Region
2.4.Assumption for the Study
2.5.Market Size Estimation
2.6.Data Triangulation
Chapter 3.Executive Summary: Global Virtual Fitness Market
Chapter 4.Global Virtual Fitness Market Overview

TABLE OF CONTENTS
4
3
www.reportocean.com
4.1. Industry Value Chain Analysis
4.2.Porter's Five Forces Analysis
4.2.1. Bargaining Power of Suppliers
4.2.2. Bargaining Power of Buyers
4.2.3. Threat of Substitutes
4.2.4. Threat of New Entrants
4.2.5. Degree of Competition
4.3. Industry Ecosystem Analysis
4.3.1. Software developers
4.3.2. Technology providers
4.3.3. Cloud providers
4.3.4. Content providers
4.3.5. Service providers
4.3.6. Distribution channel analysis
4.3.7. Vendor matrix

TABLE OF CONTENTS
5
3
www.reportocean.com
4.4.Market Dynamics and Trends
4.4.1. Growth Drivers
4.4.2. Restraints
4.4.3. Challenges
4.4.4. Opportunity
4.5. Impact of coronavirus (COVID–19) pandemic
4.5.1. Impact on market size
4.5.2. Consumer trends, preferences, and budget impact
4.5.3. Regulatory framework
4.5.4. Economic impact
4.5.5. Key player strategies to tackle negative impact
4.5.6. Opportunity window
4.6.Technology & innovation landscape
4.6.1. Impact of IoT
4.6.2. AI & machine learning

TABLE OF CONTENTS
6
3
www.reportocean.com
4.6.3. Cloud computing
4.7.Competition Dashboard
4.7.1. Market Concentration Rate
4.7.2. Company Market Share Analysis (%), 2019
4.7.3. Competitor Mapping
4.8.Regulatory landscape
4.9.PESTEL analysis
4.10.Pricing Analysis
4.11.Recent Development
Chapter 5.Global Virtual Fitness Market Analysis, By Streaming Type
5.1.Key Insights
5.2.Market Size and Forecast, 2015 – 2025 (US$ Mn)
5.2.1. Live Streaming
5.2.2. On Demand Streaming
Chapter 6.Global Virtual Fitness Market Analysis, By Device Type
6.1.Key Insights

TABLE OF CONTENTS
7
3
www.reportocean.com
6.2.Market Size and Forecast, 2015 – 2025 (US$ Mn)
6.2.1. Smart TV
6.2.2. Smartphone
6.2.3. Laptops, Desktops, And Tablets
6.2.4. Others
Chapter 7.Global Virtual Fitness Market Analysis, By Session Type
7.1.Key Insights
7.2.Market Size and Forecast, 2015 – 2025 (US$ Mn)
7.2.1. Group
7.2.2. Solo
Chapter 8.Global Virtual Fitness Market Analysis, By Revenue Model
8.1.Key Insights
8.2.Market Size and Forecast, 2015 – 2025 (US$ Mn)
8.2.1. Subscription
8.2.2. Advertisement

TABLE OF CONTENTS
8
3
www.reportocean.com
8.2.3. Hybrid
Chapter 9.Global Virtual Fitness Market Analysis, By End-User Industry
9.1.Key Insights
9.2.Market Size and Forecast, 2015 – 2025 (US$ Mn)
9.2.1. Professional Gyms
9.2.2. Sports Institutes
9.2.3. Defense Institutes
9.2.4. Educational Institutes
9.2.5. Corporate Institution
9.2.6. Individuals
9.2.7. Others
Chapter 10.Global Virtual Fitness Market Analysis, By Geography
10.1.Key Insights
10.2.Market Size and Forecast, 2015 – 2025 (US$ Mn)
10.2.1. North America

TABLE OF CONTENTS
9
3
www.reportocean.com
10.2.1.1. United States
10.2.1.2. Canada
10.2.1.3. Mexico
10.2.2. Europe
10.2.2.1. Germany
10.2.2.2. UK
10.2.2.3. France
10.2.2.4. Italy
10.2.2.5. Spain
10.2.2.6. Russia
10.2.2.7. Poland
10.2.2.8. Rest of Europe
10.2.3. Asia Pacific
10.2.3.1. China
10.2.3.2. Japan

TABLE OF CONTENTS
10
3
www.reportocean.com
10.2.3.3. India
10.2.3.4. Australia
10.2.3.5. South Korea
10.2.3.6. Malaysia
10.2.3.7. Singapore
10.2.3.8. Philippines
10.2.3.9. Indonesia
10.2.3.10. Thailand
10.2.3.11. Vietnam
10.2.3.12. Rest of Asia Pacific
10.2.4. South America
10.2.4.1. Brazil
10.2.4.3. Colombia
10.2.4.4. Argentina
10.2.4.4. Rest of South America

TABLE OF CONTENTS
11
3
www.reportocean.com
10.2.5. Middle East and Africa
10.2.5.1. Saudi Arabia
10.2.5.2. United Arab Emirates
10.2.5.3. Turkey
10.2.5.4. Egypt
10.2.5.5. South Africa
10.2.5.6. Nigeria
10.2.5.7. Rest of Middle East & Africa
Chapter 11.North America Virtual Fitness Market Analysis
11.1.Key Insights
11.2.Market Size and Forecast, 2015 – 2025 (US$ Mn)
11.2.1. By Streaming Type
11.2.2. By Device Type
11.2.3. By Session Type
11.2.4. By Revenue Model
TABLE OF CONTENTS
12
3
www.reportocean.com
11.2.5. By End User
11.2.6. By Country/Region
Chapter 12.Europe Virtual Fitness Market Analysis
12.1.Key Insights
12.2.Market Size and Forecast, 2015 – 2025 (US$ Mn)
12.2.1. By Streaming Type
12.2.2. By Device Type
12.2.3. By Session Type
12.2.4. By Revenue Model
12.2.5. By End User
12.2.6. By Country/Region
Chapter 13.Asia Pacific Virtual Fitness Market Analysis
13.1.Key Insights
13.2.Market Size and Forecast, 2015 – 2025 (US$ Mn)
13.2.1. By Streaming Type

TABLE OF CONTENTS
13
3
www.reportocean.com
13.2.2. By Device Type
13.2.3. By Session Type
13.2.4. By Revenue Model
13.2.5. By End User
13.2.6. By Country/Region
Chapter 14.South America Virtual Fitness Market Analysis
14.1.Key Insights
14.2.Market Size and Forecast, 2015 – 2025 (US$ Mn)
14.2.1. By Streaming Type
14.2.2. By Device Type
14.2.3. By Session Type
14.2.4. By Revenue Model
14.2.5. By End User
14.2.6. By Country/Region
Chapter 15.Middle East & Africa Virtual Fitness Market Analysis

TABLE OF CONTENTS
14
3
www.reportocean.com
15.1.Key Insights
15.2.Market Size and Forecast, 2015 – 2025 (US$ Mn)
15.2.1. By Streaming Type
15.2.2. By Device Type
15.2.3. By Session Type
15.2.4. By Revenue Model
15.2.5. By End User
15.2.6. By Country/Region
Chapter 16.Company Profile (Company Overview, Financial Matrix, Key Product landscape, Key Personnel, Key Competitors, Contact Address, and Business Strategy Outlook) *
16.1.NRG Fitness
16.2.Gold's Gym International, Inc
16.3.Les Mills
16.4.F45
16.5.MOVE fitness club

TABLE OF CONTENTS
15
3
www.reportocean.com
16.6.ElCoach
16.7.Wexer
16.8.ClassPass Inc.
16.9.Fitbit, Inc.
16.10.FitnessOnDemand
16.11.Navigate Wellbeing Solutions
16.12.Peerfit, Inc.
16.13.Sworkit
16.14.Viva Leisure
16.15.Wellbeats
16.16.Other Prominent Players
* Financial information in case of non-listed companies will be provided as per availability
**The segmentation and the companies are subjected to modifications based on in-depth secondary for the final deliverable
1.1 Research Objective
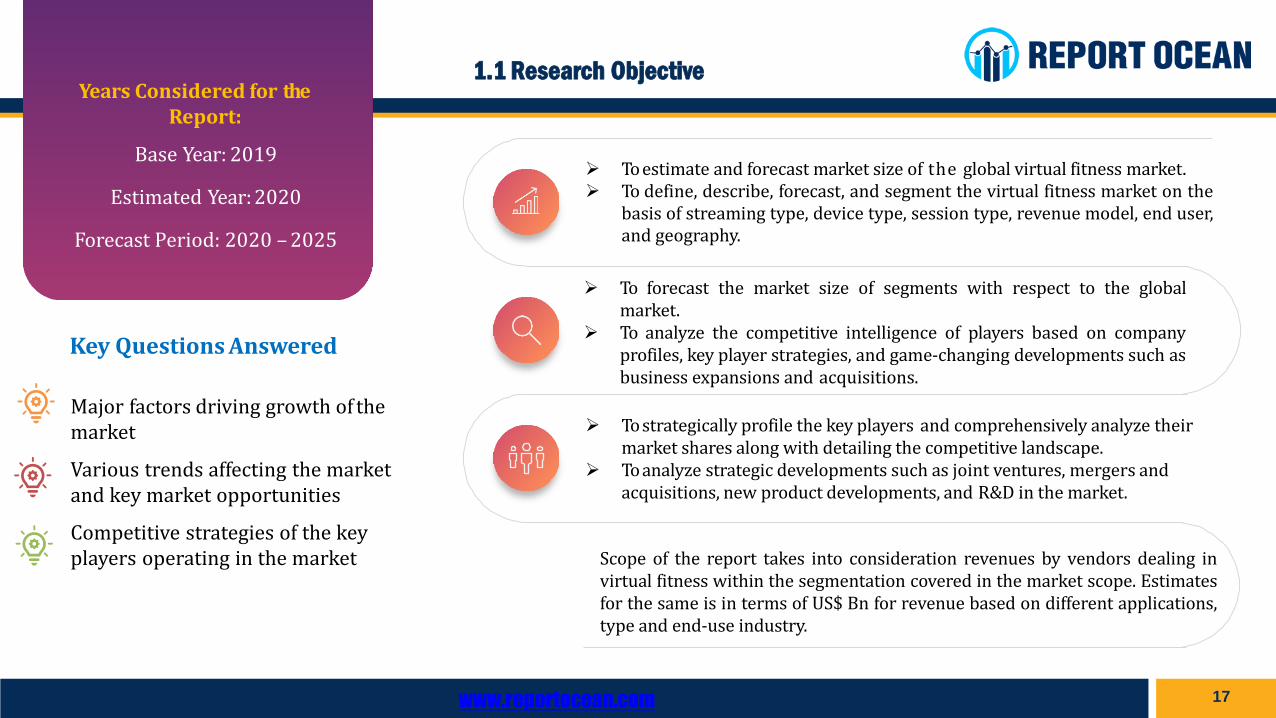
Scope of the report takes into consideration revenues by vendors dealing invirtual fitness within the segmentation covered in the market scope. Estimatesfor the same is in terms of US$ Bn for revenue based on different applications,type and end-use industry.
➢ To estimate and forecast market size of the global virtual fitness market.➢ To define, describe, forecast, and segment the virtual fitness market on the
basis of streaming type, device type, session type, revenue model, end user,and geography.
➢ To forecast the market size of segments with respect to the globalmarket.
➢ To analyze the competitive intelligence of players based on companyprofiles, key player strategies, and game-changing developments such asbusiness expansions and acquisitions.
➢ To strategically profile the key players and comprehensively analyze theirmarket shares along with detailing the competitive landscape.
➢ To analyze strategic developments such as joint ventures, mergers and acquisitions, new product developments, and R&D in the market.
Years Considered for theReport:
Base Year: 2019
Estimated Year: 2020
Forecast Period: 2020 – 2025
Major factors driving growth of the market
Various trends affecting the marketand key market opportunities
Competitive strategies of the key players operating in the market
Key Questions Answered
www.reportocean.com 17

18
1.3. Market Segmentation
Fig : Virtual Fitness Market Segmentation
❑ Live Streaming
❑ On Demand Streaming
By Streaming Type
❑ North America
❑ Europe
❑ Asia-Pacific
❑ Latin America
❑ Middle East & Africa
By Region
❑ Smart TV
❑ Smartphone
❑ Laptops, Desktops, And Tablets
❑ Others
By Device Type
❑ Group
❑ Solo
By Session Type❑ Subscription
❑ Advertisement
❑ Hybrid
By Revenue Model
❑ Professional Gyms
❑ Sports Institutes
❑ Defense Institutes
❑ Educational Institutes
❑ Corporate Institution
❑ Individuals
❑ Others
By End User

1.3. Market Segmentation
Fig : Global Virtual Fitness Market Segmentation, By Region
www.reportocean.com
BrazilColombiaArgentinaRest of South America
South AmericaSaudi ArabiaUnited Arab EmiratesTurkey Egypt South Africa NigeriaRest of Middle East & Africa
Middle East & Africa China Japan IndiaAustralia South Korea Malaysia
Singapore Philippines Indonesia Thailand VietnamRest of APAC
Asia Pacific
The United StatesCanadaMexico
North AmericaGermany UK France Italy Spain Russia PolandRest of Europe
Europe
19

2. RESEARCH METHODOLOGY (1/2)
Source: Secondary Research, Expert Interviews and Report Ocean Analysis
SYSTEMATIC RESEARCH
APPROACH
Market Profiling
Formulating DiscussionGuide
Developing List ofRespondents
Data Collection
Data Validation
Data Analysis
In-depth secondary research is used to
arrive at overall market size, top industry
players, top products, industry
associations, etc.
Formulates a detailed discussion guide in order
to conduct expert and industry interviews
List of industry players (manufacturers),
distributors, retailers, and industry experts
Conducts interviews with industry experts,
industry players, distributors, and retailers
Data is validated by triangulation method,
wherein primary, secondary, and analysis
contribute to the finaldata
The data is scrutinized using MS-Excel, to obtain
qualitative and quantitative insights about the
industry
DeliveryDelivers industry insights and information in
the required format (PDF)
1
2
3
4
5
6
7
Data
Collection
Data Filter
& Analysis
Research
&
Intelligence
Actionable
Insights
Business
Solution
Desk Research
Company Analysis
Primary Research
▪ Identifying keyopinion
leaders
▪ Questionnaire design
▪ In-depth interviews
▪ Coverage acrossvalue
chain
▪ Key Industry
Experts
▪ Channel Study
▪ Developments
▪ Market Changing
aspects/Dynamics
▪ Products
▪ Conclusion
▪ Market Participants
▪ Key Strengths
▪ Product Portfolio
▪ Mapping as per ValueChain
▪ Key Focus Segments
Primary Research
▪ Survey
▪ Zoominfo
▪ Salesforce
▪ OneSource
Secondary Research
▪ Company Websites
▪ Company Annual Reports
▪ White Papers
▪ Financial Reports
Paid Publications
www.reportocean.com
▪ Factiva
▪ Morningstar
▪ GBI
▪ Genios
▪ Meltwater
21

Data Validation:• Industry Expert Inputs• Primary Research
• Secondary Research• Discussion with Key Opinion Leaders• Response Analysis and Data Triangulation
Total Market Size
Vendor Portfolio Analysis
Market Share (%) ofKey Vendors
• Fitbit, Inc.
• Peerfit, Inc.
• Gold's Gym International, Inc
• Company 4
Total Market= x% of key vendors+ x% of other/remaining vendors
• Product offering • Annual Turnover
Key vendors comprising x% of totalglobal virtual fitness market
1
2
3
4
Key Vendors
www.reportocean.com
2. RESEARCH METHODOLOGY (2/2)
22
• Company 5
• Company 6
• Company 7
• Company 8

2. RESEARCH METHODOLOGY
✓ Company Annual Reports/ Press releases✓White Papers/Industry Publications
✓Online forums/blogs✓Online communities✓Online chat with KOLs/experts✓ Target Information: Insights on market trends, market impact
factors, marketing and awareness programs etc.
✓ Proprietary third party databases✓ In-house data repository✓ Company sites✓Annual Reports/SEC Filings✓ Investor presentations✓ Equity & Stock✓ (Security Insiders, Security Journals)
✓Online-web (CATI/CAWI/CAPI)✓ Telephonic and video conference✓ Interviewee Location: Multiple respondents across
the regions✓ Target Information: validation of secondary findings; cross-
verification of other primary interviews
SEC
ON
DA
RY
PR
IMA
RY
SEC
ON
DA
RY
PR
IMA
RY
2.1.QUALITATIVE RESEARCH
2.2.QUANTITATIVE RESEARCH
Source: Secondary Research, Expert Interviews and Report Ocean Analysis
www.reportocean.com 23

2. RESEARCH METHODOLOGY
Breakdown of Primary Research Respondents, By Region
Source: Secondary Research, Expert Interviews and Report Ocean Analysis
www.reportocean.com 24
NORTH AMERICAS
Vendors
Suppliers
End
Users
50%
10%
40%
EUROPE
45%
20%
35%
ASIA-PACIFIC
60%
15%
25%
MIDDLE EAST &
AFRICA
20%
45%
35%
SOUTH AMERICAS
45%
13%
42%

2.1.1. & 2.1.2. Primary Research (1/1)
Various industry experts including CEOs, presidents, vice presidents,
directors, regulatory departments, service managers, organization
executives and other key people of the global virtual fitness market were
interviewed. The third step involved validation of hypothesis through
segmented primary research with the key opinion leaders in the industry,
including the company representatives, experts service providers and
other industry experts. The primary research helped in assessing the
gathered and assumed data with the real-time experience of industry
representatives. This also led to modification in certain assumptions that
were taken during the process of preliminary research. The analysts
arrived at solid data points after the completion of primary research
process. In the fourth step, the market engineering was conducted, where
the data points collected through secondary and primary sources were
compiled to compute the final market sizes.
www.reportocean.com 25

2.1.1. & 2.1.2. Secondary Research (1/2)
www.reportocean.com
The research process began with obtaining historical market sizes of the
entire global virtual fitness market and the share of each type of
segmentation, through intensive secondary research to understand the
potential of the market under the prevailing market environment during the
past years. The growth rate of the market and its segments was studied with a
comparative approach to understand the impact of factors that shaped the
market during the recent past. The next step involved the study of present
market environment that is influencing the global virtual fitness market and
its expected long-term impact. Weightage was given to several forces that are
expected to affect the virtual fitness market, during the forecast period. Based
on the interim analysis, the market numbers were formulated for each of the
forecast years for every segment.
26

2.3. Market Breakdown & Data Triangulation
The research findings were corroborated and challenging areas in the data werecompensated by the strengths of other data, therebyincreasing the
validity and reliability of the results.
The existing findings from the secondary research were validated through connecting with exports ofthe industry
that helped in confirming and validating findingsin one study with findings from other sources.
Critical observation of the data available through desk research was helpful in devising data triangulation methodology that was
appropriate, relevant actionable and feasible for market study.
Complex topics concerning the quality, implementation, outcome andimpact of any trend or development were discussed with industryrespondents to deep dive at granule level and analyze themarket.
Extensive primary research was conducted to monitor and evaluate the dataandinformation gathered through secondary research.
Challenging areas of the study were identified where data was having dissimilarity, poor quality, insufficiency, complexity, trend and estimates to establish an approach for conducting primaryresearch.
Data gathered through various sources were correlated tocreate meaningful insights and prioritized the findings thatwere most relevant to the objective of thestudy.
Critical observations about the data were made to develop an understanding on the market dynamics and draw out a ground level hypothesis.
Mutually exclusive and collective exhaustive desk research wasperformed to collect data sets and gather information on all the pointers covered in the scope of the scope of the study.
The desk research activity was structured based on the scope of the study and the entire study was clustered into various datasets.
DataIdentification& Evolution
Data Collection
Identification ofTriangulationApproach
Data Analysis &Validation
Research Findings &Conclusion
The overall triangulation methodology supported in reinforcing the credibility of a finding, which helped explaining and justifying the research outcomes.
Data triangulation technique was used to showcase the process of using data from two or more sources. The approach was used to validate the data sets and information that were useful in the overall analysis and create actionableinsights.
DATA TRIANGULATION APPROACH
Seco
nd
ary
Re
sear
chA
pp
roac
h
Pri
mar
y R
ese
arch
Ap
pro
ach
www.reportocean.com
2. RESEARCH METHODOLOGY
27

2.4. Assumptions & Limitations
Currency Value
All the forecasts are done with
the revenue and volume
calculated under the standard
assumption that the globally
accepted currency - the U.S.
Dollar's value remains constant
over the next six years.
Exchange Rates And Currency
For conversion of various currencies to
USD, average historical exchange rates
were used according to the year specified.
For all historical and current exchange
rates required for calculations & currency
conversions - OANDA - website was used
in this research study.
Niche Market Segments
For niche market segments where
accurate data of the respective time line
was not available, the data was calculated
using trend line analysis. In some
instances, where mathematical and
statistical models could not be applied to
arrive at the number, generalization of
specific related trends to that particular
market was done.
Qualitative Analysis
The qualitative analysis done from
the quantitative data arrived at is
solely based on the understanding
of the market and its trends by the
team of experts involved in making
this report.
www.reportocean.com 28

29www.reportocean.com
CHAPTER 3: EXECUTIVE SUMMARY
GLOBAL VIRTUAL FITNESS MARKET

www.reportocean.com
3. Executive Summary
The global virtual fitness market is estimated to grow with more than 30% CAGR over the forecast
period 2020-2025, to reach USD XX billion by 2025. The market growth is majorly driven by increase in
need for advanced fitness sessions to achieve physical fitness, lack of timings to attend training sessions
at fitness clubs, growing interest of health insurance providers in virtual/online fitness services to
reduce health insurances costs, growing demand of AR or VR based fitness and others.
1On the basis of session type, the group segment acquire majority of the market share with XX%
during the forecast period. The group segment dominance is attributed to various factors such as
XXXXXX. Furthermore, the solo segment showing the significant growth during the forecast period.
With a CAGR of XX percent, the smartphone segment is projected to grow over the forecast period of 2020-
2025, to reach USD XX Bn by 2025. The segment growth is attributed to XXXXXXX.
2
330

Source: Secondary Research, Expert Interviews and Report OceanAnalysis
3. Executive Summary
DRIVERS
➢ Rising demand for advanced fitness sessions to achieve physical fitness
➢ Lack of time to attend training sessions at fitness institutes
➢ Shut down of gyms and studios due to ongoing COVID-19 Pandemic situation
➢ XXXXXXXX
RESTRAINTS
✓ No real interaction with the instructor
✓ XXXXXXXXXXXXX
Fig.: Global Virtual Fitness Market Size By Value, 2020-2025 (US $ Bn)
CAGR: 2020-2025By Value: XX%
www.reportocean.com
Source: Report Ocean Analysis
2020 2021 2022 2023 2024 2025
CAGR
31
Fig : Global Virtual Fitness Market, By Device Type, By Value (in %), 2019
Peerfit, Inc.
Gold's Gym International,
Inc
Fitbit, Inc
ClassPass Inc.
Viva Leisure
Key Players
Smart TV
Smartphone
Laptops, Desktops, And Tablets
Others

32www.reportocean.com
GLOBAL VIRTUAL FITNESS MARKET: INDUSTRY INSIGHTS
CHAPTER 4
GLOBAL VIRTUAL FITNESS MARKET: INDUSTRY INSIGHTS
CHAPTER 4

33
4.2. Porters Five Forces Analysis
Fig : Porters Five Forces Analysis
Bargaining Power of Suppliers
(LOW)
Bargaining Power of Buyers
(LOW)
Intensity of Rivalry
(MEDIUM)
Threat of Substitutes
(MEDIUM TO HIGH)
Threat of New Entrants
(MEDIUM)
Source: Report Ocean Analysis

34
Intensity of Rivalry
(MEDIUM)
Bargaining Power of
Suppliers (LOW)
Threat of New Entrants
(Medium)
Threat of Substitutes
(MEDIUM TO HIGH)
Bargaining Power of
Buyers (LOW)
XXXXXXXXXXXXXXXx
XXXXXXXXXXXXXXXx
XXXXXXXXXXXXXXXx
XXXXXXXXXXXXXXXx
XXXXXXXXXXXXXXXx
4.2. Porters Five Forces Analysis

35
4.4. Virtual Fitness market: Market Dynamic
RestraintDriver
Opportunity
➢ Interruptions in the flow of the
class due to tech glitches along with
the lack of real interaction with the
instructor hampering the growth.
➢ XXXXXXXXXXXXXXXXX
➢ XXXXXXXXXXXXXXXXXXXXX
➢ XXXXXXXXXXXXXXXXXXXXXX
➢ Growing popularity of virtual
fitness programs among older
adult age group owing to rising
focus on fitness is boosting the
growth of the virtual fitness
market in the upcoming years.
➢ XXXXXXXXXXXXXXXX
➢ XXXXXXXXXXXXXXXX Challenges
➢ XXXXXXXXXXXXXXXXXXXXX
➢ XXXXXXXXXXXXXXXXXXXXXXXXXX

36
4.5. Global Virtual Fitness Product Development Trends under COVID-19 Outbreak Analysis
Influence of COVID-19 Outbreak on Virtual Fitness Market
➢ The virtual fitness market has witnessed significant growth in past few years; however, due to the outbreak of the pandemic COVID-19,
the market has witnessed a sudden rise in 2020 because the larger number of the population is functioning out daily at their homes
using virtual fitness platforms. this is often attributed to the implementation of lockdown by governments in majority of the countries
and therefore the shutdown of gyms and fitness clubs across the globe to stop the transmission of virus. The virtual fitness market is
projected to prosper during the COVID-19 pandemic also as within the upcoming years post pandemic. for instance, in 2019, the
minority of Mindbody app users used live streams (7%) or pre-recorded videos (17%) to figure out. During the COVID-19 pandemic,
about 75% are using live stream video workouts and about 70% are exercising with pre-recorded workout videos.
➢ XXXXXXXXXXXXXXXXXXXXXXXXXXXXXXXXXXXXXXXXXXXXXXXXXXXXXXXXXXX
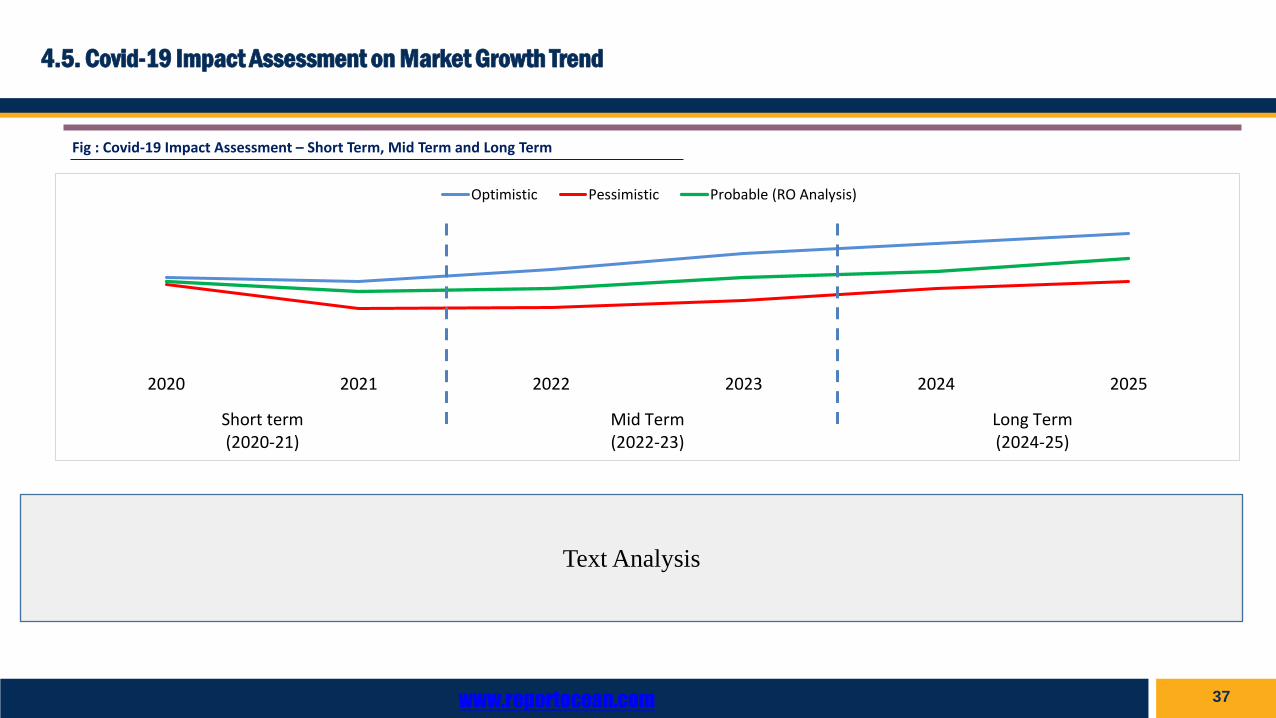
4.5. Covid-19 Impact Assessment on Market Growth Trend
Fig : Covid-19 Impact Assessment – Short Term, Mid Term and Long Term
It is expected to see a positive impact and response to after effects of Covid-19 impact. However, a large share of this depends on how local authorities
contain and roll-out economic stimulus. With possible vaccination still expected to be available only towards early of 2021, the region by it self would likely
see delayed availability due to …….
2020 2021 2022 2023 2024 2025
Short term(2020-21)
Mid Term(2022-23)
Long Term(2024-25)
Optimistic Pessimistic Probable (RO Analysis)
www.reportocean.com 37
Text Analysis

Leading Players
Fitbit, Inc.
Peerfit, Inc.
38
4.7. Competition Dashboard
Fig : Virtual Fitness market: Company Analysis, 2019
The Key players for Virtual Fitness Market are NRG Fitness, Gold's Gym
International, Inc, Les Mills, F45, MOVE fitness club, ElCoach, Wexer,
ClassPass Inc., Fitbit, Inc., FitnessOnDemand, Navigate Wellbeing Solutions,
Peerfit, Inc., Sworkit, Viva Leisure, Wellbeats, Others
Source: Report Ocean AnalysisOthers: XXXXXXXXXXXXXXXXXXXXXX

4.7. Competition Dashboard
www.reportocean.com
4.7.1. Market Concentration Rate
Competitive Composition
XXXX
XXXX
XXXX
XXXX
XXXX
XXXX
XXXX
XXXX
XXXX
Text Analysis
39

NRG Fitness, Gold's Gym International, Inc, Les Mills, F45, MOVE fitness club,
ElCoach, Wexer, ClassPass Inc., Fitbit, Inc., FitnessOnDemand, Navigate Wellbeing
Solutions, Peerfit, Inc., Sworkit, Viva Leisure, Wellbeats, Others other prominent
players included in the research study of the global virtual fitness market.
Fig: Company Market Share (%), 2019
4.7. Competition Dashboard
Source: Report Ocean Analysis
www.reportocean.com
Text Analysis
4.7.2 Company Market Share Analysis, 2019 in (%)
Fitbit, Inc.
Peerfit, Inc.
Gold's GymInternational, IncClassPass Inc.
Company 5
40

4.7. Competition Dashboard
www.reportocean.com
4.7.3. Competitor Mapping
41

42
4.11. Recent Development
➢ Rice prices rise as exporters grapple with floods, coronavirus XXXXXXXXXXXXXXXXXX
August 2020
➢ XXXXXXXXXXXXXXXXXXXXXXXXXXXXXXXXXXXXXXXXXXXXXXXXXXXXXXXXXX
May 2019
➢ XXXXXXXXXXXXXXXXXXXXXXXXXXXXXXXXXXXXXXXXXXXXXXXXXXXXXXXXXXXXXXXXXXXXXXXXXXXXXXXXXXXXXXXXX
2017

44
Fig : Virtual Fitness market Size, By Value (USD Million), 2015-2025
5.2. Global Virtual Fitness Market Size & Forecast
2015-2019 Actual market Growth 2020-2025 Actual market Growth
Virtual Fitness market has gained the momentum in recent years
with a CAGR of XX%, in value terms, over the forecast period
2020-2025. The rising consumer awareness regarding
XXXXXXXXXXXXXXXXXXXXXXXXXXXXXXXXXXXXXXXXXXXXXXXXX
XXXXXXXXXXXXXXXXXXXXXXXXXXXXXXXXXXXXXXXXXXXXXXXXX
XXXXXXXXXXXX
Source: Report Ocean
0.00
20.00
40.00
60.00
80.00
100.00
120.00
2015 2016 2017 2018 2019 2020 2021 2022 2023 2024 2025
CAGR -2020-2025By Value: XX%
CAGR -2015-2019By Value: XX%
USD XX Mn
USD XX Mn

45
5.2. Global Virtual Fitness Market Share & Forecast, By Streaming Type
0%
20%
40%
60%
80%
100%
2015 2016 2017 2018 2019 2020 2021 2022 2023 2024 2025
On DemandStreaming
Live Streaming
Source: Report Ocean Analysis
Fig : Virtual Fitness market Share (%), By Streaming Type, By Value, 2015-2025
Table: Virtual Fitness market Size (USD Million), By Streaming Type, By Value, 2015-2025
Streaming Type 2015 2016 2017 2018 2019 2020 2021 2022 2023 2024 2025 CAGR %
Live Streaming
On Demand Streaming
Total
Source: Report Ocean Analysis

46
5.2. Global Virtual Fitness market Share & Forecast, By Streaming Type
XXXX segment booming the demand of virtual fitness market
with the market share of XX% in 2019.
CAGR XX% (2020-2025)
XXXX segment booming the demand of virtual fitness market with the
market share of XX% in 2019.
CAGR XX% (2020-2025)
XXXXXXXXXXXXXXXXXXXXXXXXXXXXXXXXXXXXXXX
XXXXXXXXXXXXXXXXXXXXXXXXXXXXXXXXXXXXXXX
XXXXXXXXXXXXXXXXXXXXXXXXXXXXXXXXXXXXXXX
XXXXXXXXXXXXXXXXXXXXXXXXXXXXXXXXX
47
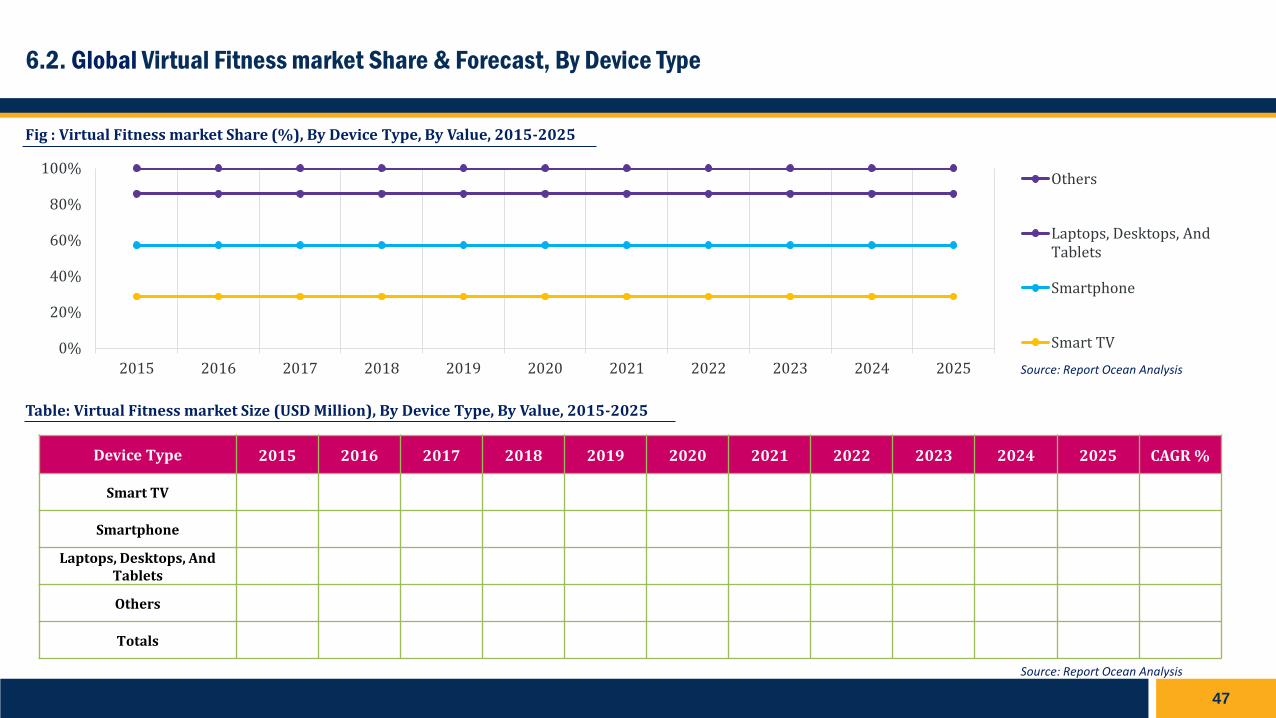
6.2. Global Virtual Fitness market Share & Forecast, By Device Type
0%
20%
40%
60%
80%
100%
2015 2016 2017 2018 2019 2020 2021 2022 2023 2024 2025
Others
Laptops, Desktops, AndTablets
Smartphone
Smart TV
Source: Report Ocean Analysis
Fig : Virtual Fitness market Share (%), By Device Type, By Value, 2015-2025
Table: Virtual Fitness market Size (USD Million), By Device Type, By Value, 2015-2025
Device Type 2015 2016 2017 2018 2019 2020 2021 2022 2023 2024 2025 CAGR %
Smart TV
Smartphone
Laptops, Desktops, And Tablets
Others
Totals
Source: Report Ocean Analysis

48
6.2. Global Virtual Fitness market Share & Forecast, By Device Type
XXXX segment booming the demand of virtual fitness market
with the market share of XX% in 2019.
CAGR XX% (2020-2025)
XXXX segment booming the demand of virtual fitness market with the
market share of XX% in 2019.
CAGR XX% (2020-2025)
XXXXXXXXXXXXXXXXXXXXXXXXXXXXXXXXXXXXXXX
XXXXXXXXXXXXXXXXXXXXXXXXXXXXXXXXXXXXXXX
XXXXXXXXXXXXXXXXXXXXXXXXXXXXXXXXXXXXXXX
XXXXXXXXXXXXXXXXXXXXXXXXXXXXXXXXX

49
7.2. Global Virtual Fitness market Share & Forecast, By Session Type
0.00% 10.00% 20.00% 30.00% 40.00% 50.00% 60.00% 70.00% 80.00% 90.00% 100.00%
2015
2017
2019
2021
2023
2025
Solo
Group
Source: Report Ocean Analysis
Fig : Virtual Fitness market Share (%), By Session Type, By Value, 2015-2025
Table: Virtual Fitness market Size (USD Million), By Session Type, By Value, 2015-2025
Session Type 2015 2016 2017 2018 2019 2020 2021 2022 2023 2024 2025 CAGR%
Group
Solo
Total
Source: Report Ocean Analysis

50
7.2. Global Virtual Fitness market Share & Forecast, By Session Type
XXXX segment booming the demand of virtual fitnesss market
with the market share of XX% in 2019.
CAGR XX% (2020-2025)
XXXX segment booming the demand of virtual fitnesss market with the
market share of XX% in 2019.
CAGR XX% (2020-2025)
XXXXXXXXXXXXXXXXXXXXXXXXXXXXXXXXXXXXXXX
XXXXXXXXXXXXXXXXXXXXXXXXXXXXXXXXXXXXXXX
XXXXXXXXXXXXXXXXXXXXXXXXXXXXXXXXXXXXXXX
XXXXXXXXXXXXXXXXXXXXXXXXXXXXXXXXX

51
8.2. Global Virtual Fitness market Share & Forecast, By Revenue Model
0.00%
10.00%
20.00%
30.00%
40.00%
50.00%
60.00%
2015 2016 2017 2018 2019 2020 2021 2022 2023 2024 2025
Subscription
Advertisement
Hybrid
Source: Report Ocean Analysis
Fig : Virtual Fitness market Share (%), By Revenue Model, By Value, 2015-2025
Table: Virtual Fitness market Size (USD Million), By Revenue Model, By Value, 2015-2025
Revenue Model 2015 2016 2017 2018 2019 2020 2021 2022 2023 2024 2025 CAGR%
Subscription
Advertisement
Hybrid
Total
Source: Report Ocean Analysis

52
8.2. Global Virtual Fitness market Share & Forecast, By Revenue Model
XXXX segment booming the demand of virtual fitnesss market
with the market share of XX% in 2019.
CAGR XX% (2020-2025)
XXXX segment booming the demand of virtual fitnesss market with the
market share of XX% in 2019.
CAGR XX% (2020-2025)
XXXXXXXXXXXXXXXXXXXXXXXXXXXXXXXXXXXXXXX
XXXXXXXXXXXXXXXXXXXXXXXXXXXXXXXXXXXXXXX
XXXXXXXXXXXXXXXXXXXXXXXXXXXXXXXXXXXXXXX
XXXXXXXXXXXXXXXXXXXXXXXXXXXXXXXXX

53
9.2. Global Virtual Fitness market Share & Forecast, By End User
0%
10%
20%
30%
40%
50%
60%
70%
80%
90%
100%
2015 2016 2017 2018 2019 2020 2021 2022 2023 2024 2025
Others
Individuals
Corporate Institution
Educational Institutes
Defense Institutes
Sports Institutes
Professional Gyms
Source: Report Ocean Analysis
Fig : Virtual Fitness market Share (%), By End User, By Value, 2015-2025
Source: Report Ocean Analysis

54
9.2. Global Virtual Fitness market Share & Forecast, By End User
Table: Virtual Fitness market Size (USD Million), By End User, By Value, 2015-2025
End User 2015 2016 2017 2018 2019 2020 2021 2022 2023 2024 2025 CAGR %
Professional Gyms
Sports Institutes
Defense Institutes
Educational Institutes
Corporate Institution
Individuals
Others
Total
Source: Report Ocean Analysis

55
9.2. Global Virtual Fitness market Share & Forecast, By End User
XXXX segment booming the demand of virtual fitness market
with the market share of XX% in 2019.
CAGR XX% (2020-2025)
XXXX segment booming the demand of virtual fitness market with the
market share of XX% in 2019.
CAGR XX% (2020-2025)
XXXXXXXXXXXXXXXXXXXXXXXXXXXXXXXXXXXXXXX
XXXXXXXXXXXXXXXXXXXXXXXXXXXXXXXXXXXXXXX
XXXXXXXXXXXXXXXXXXXXXXXXXXXXXXXXXXXXXXX
XXXXXXXXXXXXXXXXXXXXXXXXXXXXXXXXX

1.00%
6.00%
11.00%
16.00%
21.00%
26.00%
31.00%
36.00%
41.00%
2015 2016 2017 2018 2019 2020 2021 2022 2023 2024 2025
North America
Europe
Asia-Pacific
Latin America
Middle East & Africa
56
Key Takeaways:
By geography, the Virtual Fitness market segregated into North America, Europe, Asia Pacific, Middle East & Africa, and Latin America. XXXX regional
sector projected to dominate the global market with the market segmentation of XX% during the forecast period of 2020-2025. XXXXXXXXXXXXXXXXXX
XXXXXXXXXXXXXXXXXXXXXXXXXXXXXXXXXXXXXXXXXXXXXXXXXXXXXXXXXXXXXXXXXXXXXXXXXXXXXXXXXX
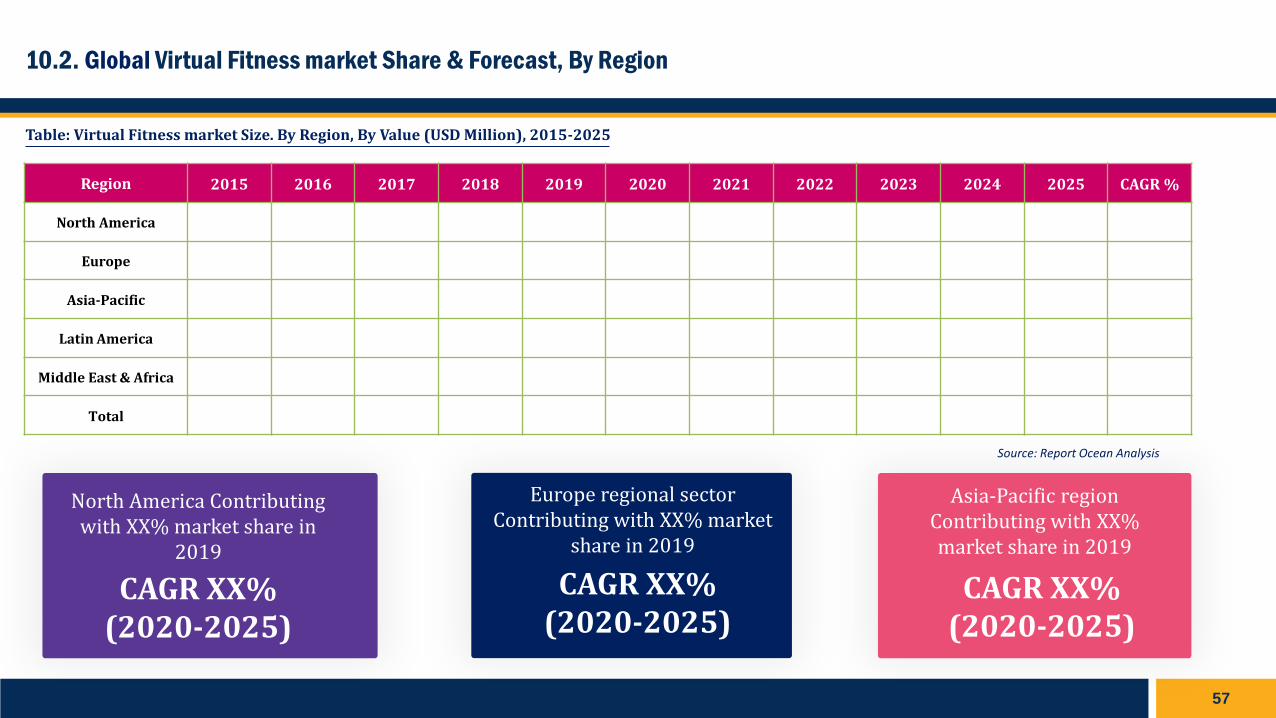
10.2. Global Virtual Fitness Market Share & Forecast, By Region
Source: Report Ocean Analysis
Fig: Virtual Fitness market Share (%), By Region, By Value, 2015-2025
57
10.2. Global Virtual Fitness market Share & Forecast, By Region
Table: Virtual Fitness market Size. By Region, By Value (USD Million), 2015-2025
Region 2015 2016 2017 2018 2019 2020 2021 2022 2023 2024 2025 CAGR %
North America
Europe
Asia-Pacific
Latin America
Middle East & Africa
Total
Source: Report Ocean Analysis
CAGR XX% (2020-2025)
North America Contributing with XX% market share in
2019
Europe regional sector Contributing with XX% market
share in 2019
Asia-Pacific region Contributing with XX% market share in 2019
CAGR XX% (2020-2025)
CAGR XX% (2020-2025)

EUROPE VIRTUAL FITNESS MARKET OVERVIEW
CHAPTER 12

59
Fig : Europe Virtual Fitness Market Size, By Value (USD Million), 2015-2025
12.1. Europe Virtual Fitness Market Size & Forecast
2015-2019 Actual market Growth 2020-2025 Actual market GrowthEurope Virtual Fitness Market has gained the
momentum in recent years with a CAGR of XX%, in
value terms, over the forecast period 2020-2025, and
expected to reach at USD XX Million by 2025.
XXXXXXXXXXXXXXXXXXXXXXXXXXXXXXXXXXXXXXXX
XXXXXXXXXXXXXXXXXXXXXXXXXXXXXXXXXXXXXXXX
XXXXXXXXXXXXXXXXXXXXXXXXXXXXXXXXXXXXXX
Source: Report Ocean
0.00
20.00
40.00
60.00
80.00
100.00
120.00
2015 2016 2017 2018 2019 2020 2021 2022 2023 2024 2025
CAGR -2020-2025By Value: XX%
CAGR -2015-2019By Value: XX%
USD XX Mn
USD XX Mn

60
12.2.1. Europe Virtual Fitness Market Share & Forecast, By Streaming Type
0%
20%
40%
60%
80%
100%
2015 2016 2017 2018 2019 2020 2021 2022 2023 2024 2025
On DemandStreaming
Live Streaming
Source: Report Ocean Analysis
Fig : Virtual Fitness market Share (%), By Streaming Type, By Value, 2015-2025
Table: Virtual Fitness market Size (USD Million), By Streaming Type, By Value, 2015-2025
Streaming Type 2015 2016 2017 2018 2019 2020 2021 2022 2023 2024 2025 CAGR %
Live Streaming
On Demand Streaming
Total
Source: Report Ocean Analysis

61
12.2.1. Europe Virtual Fitness market Share & Forecast, By Streaming Type
XXXX segment booming the demand of virtual fitness market
with the market share of XX% in 2019.
CAGR XX% (2020-2025)
XXXX segment booming the demand of virtual fitness market with the
market share of XX% in 2019.
CAGR XX% (2020-2025)
XXXXXXXXXXXXXXXXXXXXXXXXXXXXXXXXXXXXXXX
XXXXXXXXXXXXXXXXXXXXXXXXXXXXXXXXXXXXXXX
XXXXXXXXXXXXXXXXXXXXXXXXXXXXXXXXXXXXXXX
XXXXXXXXXXXXXXXXXXXXXXXXXXXXXXXXX

62
12.2.2. Europe Virtual Fitness market Share & Forecast, By Device Type
0%
20%
40%
60%
80%
100%
2015 2016 2017 2018 2019 2020 2021 2022 2023 2024 2025
Others
Laptops, Desktops, AndTablets
Smartphone
Smart TV
Source: Report Ocean Analysis
Fig : Virtual Fitness market Share (%), By Device Type, By Value, 2015-2025
Table: Virtual Fitness market Size (USD Million), By Device Type, By Value, 2015-2025
Device Type 2015 2016 2017 2018 2019 2020 2021 2022 2023 2024 2025 CAGR %
Smart TV
Smartphone
Laptops, Desktops, And Tablets
Others
Totals
Source: Report Ocean Analysis
63
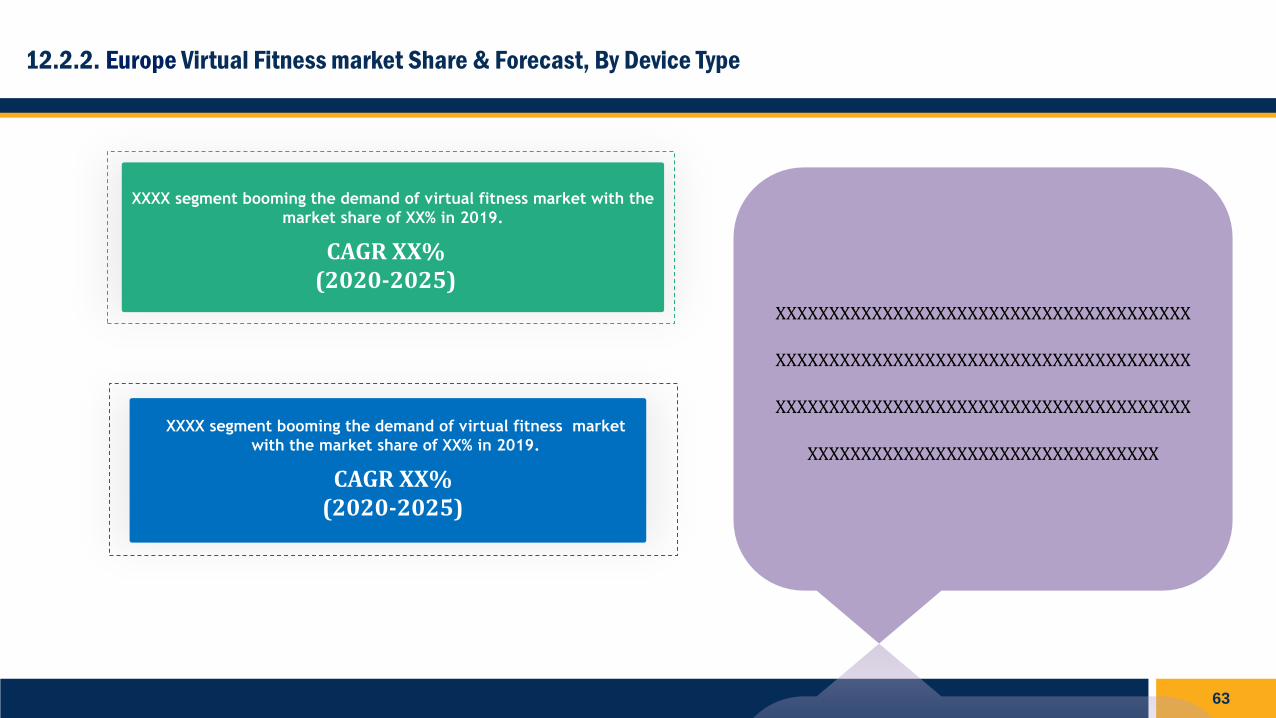
12.2.2. Europe Virtual Fitness market Share & Forecast, By Device Type
XXXX segment booming the demand of virtual fitness market
with the market share of XX% in 2019.
CAGR XX% (2020-2025)
XXXX segment booming the demand of virtual fitness market with the
market share of XX% in 2019.
CAGR XX% (2020-2025)
XXXXXXXXXXXXXXXXXXXXXXXXXXXXXXXXXXXXXXX
XXXXXXXXXXXXXXXXXXXXXXXXXXXXXXXXXXXXXXX
XXXXXXXXXXXXXXXXXXXXXXXXXXXXXXXXXXXXXXX
XXXXXXXXXXXXXXXXXXXXXXXXXXXXXXXXX
64
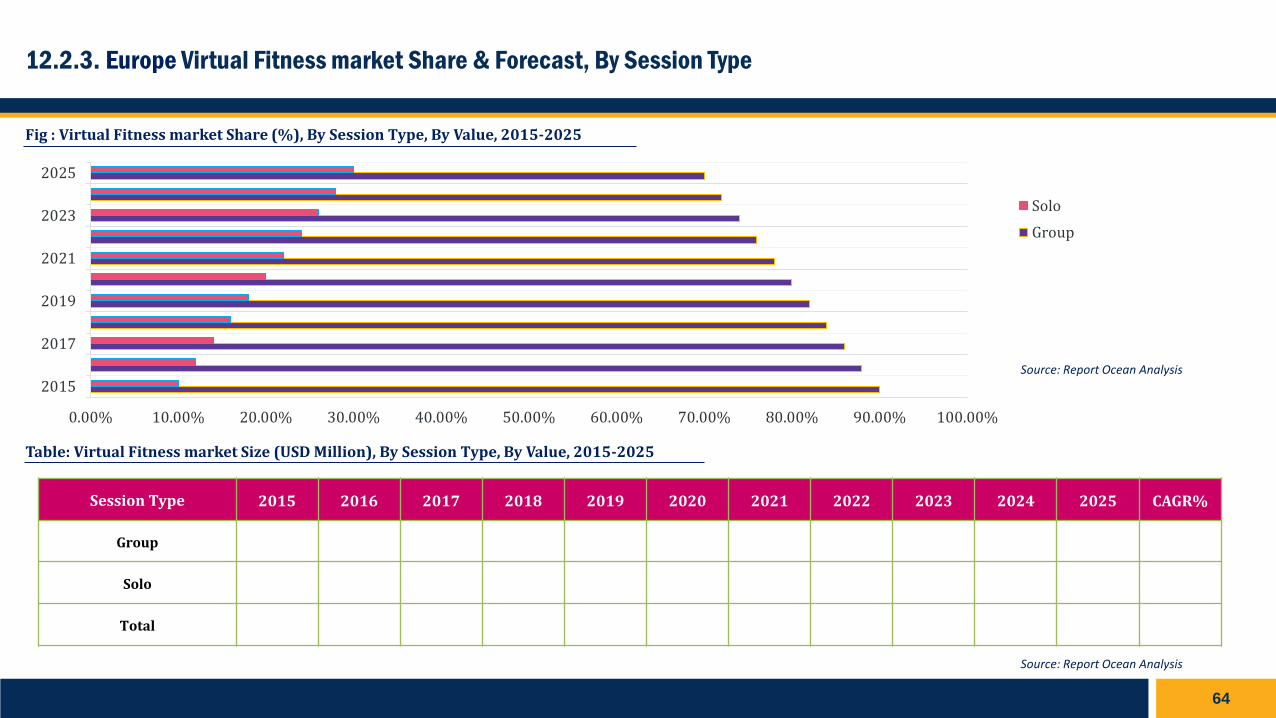
12.2.3. Europe Virtual Fitness market Share & Forecast, By Session Type
0.00% 10.00% 20.00% 30.00% 40.00% 50.00% 60.00% 70.00% 80.00% 90.00% 100.00%
2015
2017
2019
2021
2023
2025
Solo
Group
Source: Report Ocean Analysis
Fig : Virtual Fitness market Share (%), By Session Type, By Value, 2015-2025
Table: Virtual Fitness market Size (USD Million), By Session Type, By Value, 2015-2025
Session Type 2015 2016 2017 2018 2019 2020 2021 2022 2023 2024 2025 CAGR%
Group
Solo
Total
Source: Report Ocean Analysis

65
12.2.3. Europe Virtual Fitness market Share & Forecast, By Session Type
XXXX segment booming the demand of virtual fitnesss market
with the market share of XX% in 2019.
CAGR XX% (2020-2025)
XXXX segment booming the demand of virtual fitnesss market with the
market share of XX% in 2019.
CAGR XX% (2020-2025)
XXXXXXXXXXXXXXXXXXXXXXXXXXXXXXXXXXXXXXX
XXXXXXXXXXXXXXXXXXXXXXXXXXXXXXXXXXXXXXX
XXXXXXXXXXXXXXXXXXXXXXXXXXXXXXXXXXXXXXX
XXXXXXXXXXXXXXXXXXXXXXXXXXXXXXXXX

66
12.2.4. Europe Virtual Fitness market Share & Forecast, By Revenue Model
0.00%
10.00%
20.00%
30.00%
40.00%
50.00%
60.00%
2015 2016 2017 2018 2019 2020 2021 2022 2023 2024 2025
Subscription
Advertisement
Hybrid
Source: Report Ocean Analysis
Fig : Virtual Fitness market Share (%), By Revenue Model, By Value, 2015-2025
Table: Virtual Fitness market Size (USD Million), By Revenue Model, By Value, 2015-2025
Revenue Model 2015 2016 2017 2018 2019 2020 2021 2022 2023 2024 2025 CAGR%
Subscription
Advertisement
Hybrid
Total
Source: Report Ocean Analysis

67
12.2.4. Europe Virtual Fitness market Share & Forecast, By Revenue Model
XXXX segment booming the demand of virtual fitnesss market
with the market share of XX% in 2019.
CAGR XX% (2020-2025)
XXXX segment booming the demand of virtual fitnesss market with the
market share of XX% in 2019.
CAGR XX% (2020-2025)
XXXXXXXXXXXXXXXXXXXXXXXXXXXXXXXXXXXXXXX
XXXXXXXXXXXXXXXXXXXXXXXXXXXXXXXXXXXXXXX
XXXXXXXXXXXXXXXXXXXXXXXXXXXXXXXXXXXXXXX
XXXXXXXXXXXXXXXXXXXXXXXXXXXXXXXXX

68
12.2.5. Europe Virtual Fitness market Share & Forecast, By End User
0%
10%
20%
30%
40%
50%
60%
70%
80%
90%
100%
2015 2016 2017 2018 2019 2020 2021 2022 2023 2024 2025
Others
Individuals
Corporate Institution
Educational Institutes
Defense Institutes
Sports Institutes
Professional Gyms
Source: Report Ocean Analysis
Fig : Virtual Fitness market Share (%), By End User, By Value, 2015-2025
Source: Report Ocean Analysis

69
12.2.5. Europe Virtual Fitness market Share & Forecast, By End User
Table: Virtual Fitness market Size (USD Million), By End User, By Value, 2015-2025
End User 2015 2016 2017 2018 2019 2020 2021 2022 2023 2024 2025 CAGR %
Professional Gyms
Sports Institutes
Defense Institutes
Educational Institutes
Corporate Institution
Individuals
Others
Total
Source: Report Ocean Analysis

70
12.2.5. Europe Virtual Fitness market Share & Forecast, By End User
XXXX segment booming the demand of virtual fitness market
with the market share of XX% in 2019.
CAGR XX% (2020-2025)
XXXX segment booming the demand of virtual fitness market with the
market share of XX% in 2019.
CAGR XX% (2020-2025)
XXXXXXXXXXXXXXXXXXXXXXXXXXXXXXXXXXXXXXX
XXXXXXXXXXXXXXXXXXXXXXXXXXXXXXXXXXXXXXX
XXXXXXXXXXXXXXXXXXXXXXXXXXXXXXXXXXXXXXX
XXXXXXXXXXXXXXXXXXXXXXXXXXXXXXXXX

1.00%
6.00%
11.00%
16.00%
21.00%
26.00%
31.00%
36.00%
41.00%
2015 2016 2017 2018 2019 2020 2021 2022 2023 2024 2025
Germany
UK
France
Italy
Spain
Russia
Poland
Rest of Europe
71
Key Takeaways:
By geography, the Virtual Fitness market segregated into Germany, UK, France, Italy, Spain, Russia, Poland, and Rest of Europe. XXXX country projected
to dominate the Europe market with the market segmentation of XX% during the forecast period of 2020-2025. XXXXXXXXXXXXXXXXXX
XXXXXXXXXXXXXXXXXXXXXXXXXXXXXXXXXXXXXXXXXXXXXXXXXXXXXXXXXXXXXXXXXXXXXXXXXXXXXXXXXX
10.2. Europe Virtual Fitness Market Share & Forecast, By Country
Source: Report Ocean Analysis
Fig: Virtual Fitness market Share (%), By Country, By Value, 2015-2025

72
10.2. Europe Virtual Fitness market Share & Forecast, By Region
Table: Virtual Fitness market Size. By Region, By Value (USD Million), 2015-2025
Region 2015 2016 2017 2018 2019 2020 2021 2022 2023 2024 2025 CAGR %
Germany
U. K.
France
Italy
Spain
Russia
Poland
Rest of Europe
TotalSource: Report Ocean Analysis
CAGR XX% (2020-2025)
U. K. Contributing with XX% market share in 2019
Germany Contributing with XX% market share in 2019
Poland region Contributing with XX% market share in
2019
CAGR XX% (2020-2025)
CAGR XX% (2020-2025)

16.X
74
Company Profile

Fitbit Inc., Overview
➢ XXXXXXXXXXXXXXXXXXXXXXXXXXXXXXXXXXXX
➢ XXXXXXXXXXXXXXXXXXXXXXXXXXXXXXXXXXXX
➢ XXXXXXXXXXXXXXXXXXXXXXXXXXXXXXXXXXXX
➢ XXXXXXXXXXXXXXXXXXXXXXXXXXXXXXXXXXXX
Business Overview
Headquarter Dublin, Ireland
Founded 2007
Employee Strength XXX (2019)
Business Presence XXXX
Traded XXX
Website https://www.fitbit.com
Strategic Outlook
➢ XXXXXXXXXXXXXXXXXXXXXXXXXXXXXXXXXXXX
➢ XXXXXXXXXXXXXXXXXXXXXXXXXXXXXXXXXXXX
➢ XXXXXXXXXXXXXXXXXXXXXXXXXXXXXXXXXXXX
Key Personnel
➢ XXXX -Chief Executive Officer➢ XXXX - Chief Operating
Officer
Key Competitors
➢ XXXX➢ XXXX➢ XXXX➢ XXXX
Key Offerings
➢ XXXX
➢ XXXX
➢ XXXX
➢ XXXX
Table 29: Accenture plc, Overview
75
➢ XXXX
➢ XXXX
➢ XXXX
➢ XXXX

Source: Annual Reports
Source: Annual Reports
Particular 2016 2017 2018 2019
Revenue XXXX XXXX XXXX XXXX
Operating Income XXXX XXXX XXXX XXXX
Net income Attributable to
AccentureXXXX XXXX XXXX XXXX
Table 30: Accenture plc, Financial Analysis (USD Million)
Recent Developments
➢ On May 05, 2020 : Accenture Acquires Callisto Integration to Help Clients Make
Manufacturing More Efficient and Flexible-The acquisition includes Callisto’s MeasureTek
subsidiary, based in Albany, which uses IoT technology to provide precision farming services,
such as dynamic field monitoring and irrigation information.
➢ On May 05, 2020 : Accenture Collaborates with Corteva Agriscience on Pilot Program to
Bring Technology Skilling to Rural Iowa-a collaboration bringing together non-profit
groups, higher education organizations, and government leaders to help individuals and
educators in Jefferson, Iowa, acquire technology skills while remaining in their rural
communities.
Source: Annual Reports
Business Revenue Segmentation, 2019
Geographical Revenue Segmentation, 2019
76
Fitbit Inc., Financial Insights
Region 1
Region 2
Region 3
Region 4
Region 5
Region 1
Region 2
Region 3
Region 4
Region 5

77
➢ XXXXXXXXXX➢ XXXXXXXXXX➢ XXXXXXXXXX
Threat
➢ XXXXXXXXXX➢ XXXXXXXXXX➢ XXXXXXXXXX
Strength
➢ XXXXXXXXXX➢ XXXXXXXXXX➢ XXXXXXXXXX
Opportunity
➢ XXXXXXXXXX➢ XXXXXXXXXX➢ XXXXXXXXXX
Weakness
SWOT Analysis

The contents of this report are based on information generally available to the public from sources believed to be reliable. No representation is made that it is timely, accurate or complete.
Report Ocean Consulting has taken due care and caution in compilation of data as this has been obtained from various sources, including which it considers reliable and first hand. However,
Report Ocean Consulting does not guarantee the accuracy, adequacy or completeness of any information and it is not responsible for any errors or omissions or for the results obtained from
the use of such information and especially states that it has no financial liability whatsoever to the subscribers/users of this report. The information herein, together with all estimates and
forecasts, can change without notice. All the figures provided in this document are indicative of the relative market size and are strictly for client’s internal consumption. Usage of the same
for purpose other than internal will require prior approval of Report Ocean Consulting.
Copyright © 2020 Report Ocean Consulting
All Rights Reserved. This document contains highly confidential information and is the sole property of Report Ocean Consulting. No part of it may be circulated, copied, quoted, or otherwise
reproduced without the written approval of Report Ocean Consulting.
DISCLAIMER
www.reportocean.com 78

UNITED STATES
500 N Michigan Ave, Suite 600,Chicago, Illinois 60611Email: [email protected]: +1 888 212 3539
ASIA PACIFIC
Classic Tower, Rajnagar Extension,Ghaziabad, 201017 - IndiaEmail: [email protected]: +91-9997112116
Recommended