Global ESG The ROE of a Tree
Environmental, Social and Governance (ESG) Environmental, Social and Governance (ESG)
In The global food system, we showed that addressing climate change requires changes in
consumers’ dietary habits. This report argues that such a change could help accelerate
reforestation efforts and outlines that planting trees could be a profitable activity, not least for
farmers.
Forests are important: The FAO estimates that the total carbon stock in forests is
662GtCO2, which is more than all the carbon added by human activities since 1870. At
present, forests sequester 11GtCO2 per year, or 30% of emissions from human activities.
The need for an increase in reforestation to achieve a net-zero future is also
recognized by the IPCC, as its net-zero pathways call for decreases in pasture and
cropland. One extreme scenario requires a decline in land used for agriculture of more than
20 million km2.
Our estimates suggest that up to 27 million km2 of land could become available and
be used for reforestation if consumers change their dietary habits, alternative meat
products gain in popularity, and vertical farming is adopted. This could capture more than
80% of current anthropogenic emissions.
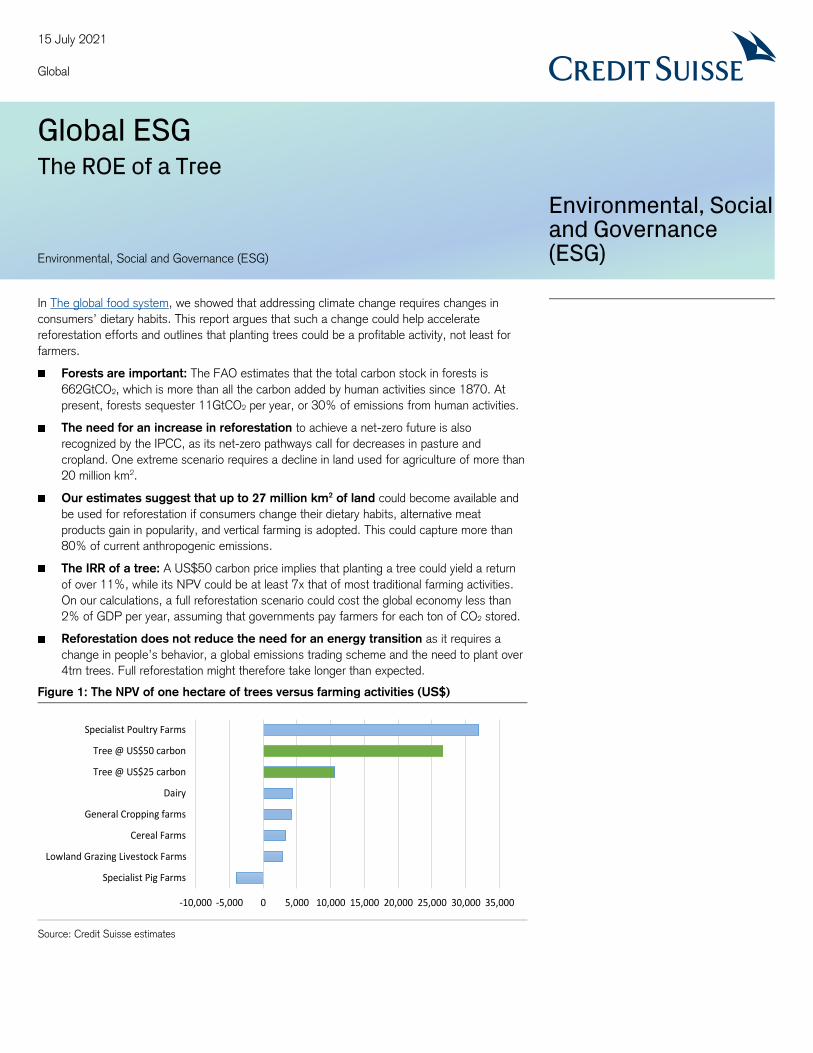
The IRR of a tree: A US$50 carbon price implies that planting a tree could yield a return
of over 11%, while its NPV could be at least 7x that of most traditional farming activities.
On our calculations, a full reforestation scenario could cost the global economy less than
2% of GDP per year, assuming that governments pay farmers for each ton of CO2 stored.
Reforestation does not reduce the need for an energy transition as it requires a
change in people’s behavior, a global emissions trading scheme and the need to plant over
4trn trees. Full reforestation might therefore take longer than expected.
Figure 1: The NPV of one hectare of trees versus farming activities (US$)
Source: Credit Suisse estimates
-10,000 -5,000 0 5,000 10,000 15,000 20,000 25,000 30,000 35,000
Specialist Pig Farms
Lowland Grazing Livestock Farms
Cereal Farms
General Cropping farms
Dairy
Tree @ US$25 carbon
Tree @ US$50 carbon
Specialist Poultry Farms
15 July 2021
Global
15 July 2021
Global ESG 2
Key charts
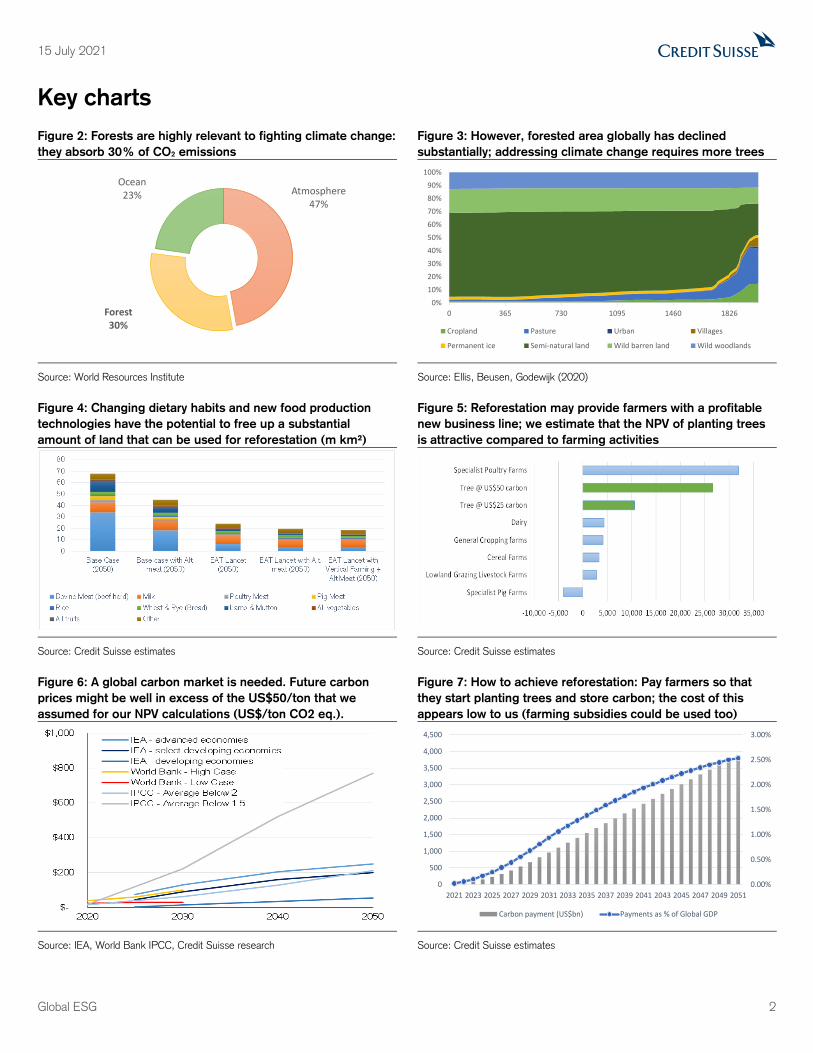
Figure 2: Forests are highly relevant to fighting climate change:
they absorb 30% of CO2 emissions
Figure 3: However, forested area globally has declined
substantially; addressing climate change requires more trees
Source: World Resources Institute Source: Ellis, Beusen, Godewijk (2020)
Figure 4: Changing dietary habits and new food production
technologies have the potential to free up a substantial
amount of land that can be used for reforestation (m km²)
Figure 5: Reforestation may provide farmers with a profitable
new business line; we estimate that the NPV of planting trees
is attractive compared to farming activities
Source: Credit Suisse estimates Source: Credit Suisse estimates
Figure 6: A global carbon market is needed. Future carbon
prices might be well in excess of the US$50/ton that we
assumed for our NPV calculations (US$/ton CO2 eq.).
Figure 7: How to achieve reforestation: Pay farmers so that
they start planting trees and store carbon; the cost of this
appears low to us (farming subsidies could be used too)
Source: IEA, World Bank IPCC, Credit Suisse research Source: Credit Suisse estimates
Atmosphere47%
Forest30%
Ocean23%
0%
10%
20%
30%
40%
50%
60%
70%
80%
90%
100%
0 365 730 1095 1460 1826
Cropland Pasture Urban Villages
Permanent ice Semi-natural land Wild barren land Wild woodlands
0.00%
0.50%
1.00%
1.50%
2.00%
2.50%
3.00%
0
500
1,000
1,500
2,000
2,500
3,000
3,500
4,000
4,500
2021 2023 2025 2027 2029 2031 2033 2035 2037 2039 2041 2043 2045 2047 2049 2051
Carbon payment (US$bn) Payments as % of Global GDP
15 July 2021
Global ESG 3
Table of Contents
Executive summary 4
Forests’ role in combatting climate change 5
The forest carbon cycle ................................................................................................. 5
Deforestation is a key challenge ..................................................................................... 7
Carbon consumption of a tree ........................................................................................ 9
Forests and current net zero pathways 13
Current land use and global emissions .......................................................................... 13
IPCC net zero scenarios and land use ........................................................................... 14
Changing land use aids carbon storage 17
The battle between forests and agriculture .................................................................... 17
Healthy food consumption and reforestation potential ..................................................... 19
How much carbon can be captured? ............................................................................. 22
The IRR of a tree 24
To tree or not to tree? 26
The NPV of a tree (and of a farm) ................................................................................ 27
A tree-transition might cost less than expected .............................................................. 29
A global carbon market is needed 31
15 July 2021
Global ESG 4
Executive summary
Forests play a key role in fighting climate change
Forests play a key role in addressing climate change, as typical mature trees can capture c22kg
of CO2 per year, according to sources such as the FAO. At present, the world’s forests absorb
c30% of CO2 emissions; however, deforestation activity since 1990 has resulted in the loss of
c420 million hectares of forest – an area equivalent to eight times the size of France or almost
half of the US.
The need to plant trees in order to help reduce emissions to net zero appears obvious, not just
to us but also to intergovernmental bodies. For example, UN Sustainable Development Goal 15
(‘Life on Land’) is focused purely on protecting and restoring terrestrial ecosystems, including
forests. Our review of work from the IPCC shows that reaching net zero by 2050 would require
3.3–6.2 million km2 of land for bio-energy, carbon capture and storage and forestry.
A change in lifestyle creates land needed for reforestation
Making land available for reforestation requires a rethink of the global food system given that
current food production and consumption accounts for more than 25% of GHG emissions and
c50% of habitable land. We calculate that a reduction in meat consumption and increased
intake of plant-based foods has the potential to make more than 20 million km² of land available
that can be used for reforestation.
The introduction of technologies such as cultivated meat and vertical farming could raise this to
27 million km², which could capture more than 80% of current anthropogenic emissions if it
were used for reforestation.
Planting trees might make economic sense, too
In this note we argue that a substantial change in consumers’ food consumption patterns does
not necessarily have to be detrimental for farmers. In fact, we show that farmers should
seriously consider a proactive approach to planting trees.
Based on a carbon price of US$50 for each ton of CO2 stored, we calculate that planting a tree
could yield an internal rate of return of over 11%. Assuming that governments pay farmers for
planting trees, we show that these payments are not excessive and would even after 30 years
still only amount to c2.5% of GDP. If governments were to redirect current farming subsidies to
help pay for this, the net cost could be even less than 2% of GDP by 2051.
A global carbon market remains a key hurdle
Currently, more than 20% of global emissions are covered by emissions trading schemes
across a range of countries (see Figure 50 on page 31). The total traded value of these
schemes increased by c20% in 2020 to a record €229bn. We believe that a more globally
integrated carbon market might act as a catalyst for a shift towards reforestation. The need for
more coordinated carbon policies has also been recognized by the G20 recently (G20
recognizes carbon pricing as climate change tool for first time). At present, these do not exist;
however, the rapidly developing voluntary carbon market might help. A recent report by UCL
and Trove Research, covered in our Global Weekly Report, suggested that the carbon price in
the voluntary market may reach $20-50/tCO2e by 2030, from up to US$3 currently, and could
go as high as $100/tCO2e in certain scenarios. These prices do not seem out of line with
modelling done by the IPCC and IEA, which suggest that carbon prices could reach well over
$200 by 2050. Such prices would provide strong support for our claim that planting trees has
the potential to be a very profitable exercise for farmers and one that helps achieve long-term
emissions targets.

15 July 2021
Global ESG 5
Forests’ role in combatting climate change
Forests play a key role when it comes to addressing climate change given that they currently
absorb c30% of CO2 emissions. However, deforestation activity since 1990 has resulted in the
loss of c420 million hectares of forest. In this chapter, we outline how the forest carbon cycle
works and highlight that tropical rain forests are key (particularly in countries such as Brazil, the
Democratic Republic of the Congo and Indonesia). We also estimate the carbon storage
potential of a large-scale reforestation program.
Figure 8: Forests are key to addressing climate change as they
absorb 30% of CO2 emissions currently
Figure 9: Global forest area by region: 10 countries contain
around two-thirds of all forests globally
Source: World Resources Institute Source: FAO
The forest carbon cycle
Forests and trees play a critical role in combatting climate change as they are natural “capturers”
of carbon dioxide (CO2), which is the primary culprit behind rising greenhouse gas (GHG)
emissions. Trees are able to absorb carbon through photosynthesis: the process of using a
combination of energy from sunlight, water from roots, and CO2 from the air to create sugar
that is used to fuel the tree (i.e., build wood, branches, leaves, roots, etc.). While some of that
carbon is used and returned to the atmosphere rather quickly (a process known as “respiration”),
the carbon that is not respired gets stored throughout the tree, often for a long time, and thus
keeps it out of the atmosphere.
In fact, aside from water, wood is composed almost entirely of carbon and oxygen, making it an
ideal “sink” for storing CO2, which can continue even for years after the tree dies. Leaves, on the
other hand, release CO2 more quickly after they have fallen off a tree. However, in both cases,
the carbon ultimately breaks down and returns to the air as CO2 (through a process known as
“decomposition”).
It is also worth noting that trees are not the only way forests capture and store CO2. As carbon
is found in all living organisms, CO2 is also stored in soil, primarily through the remains of
decomposing plant and animal tissue and other dissolved organic material – see Figure 10.
Atmosphere47%
Forest30%
Ocean23%
Russian Federation
20%
Brazil12%
Canada9%
USA8%
China5%
Australia3%
DR of the Congo3%
Indonesia2%
Peru2%
India2%
RoW34%
15 July 2021
Global ESG 6
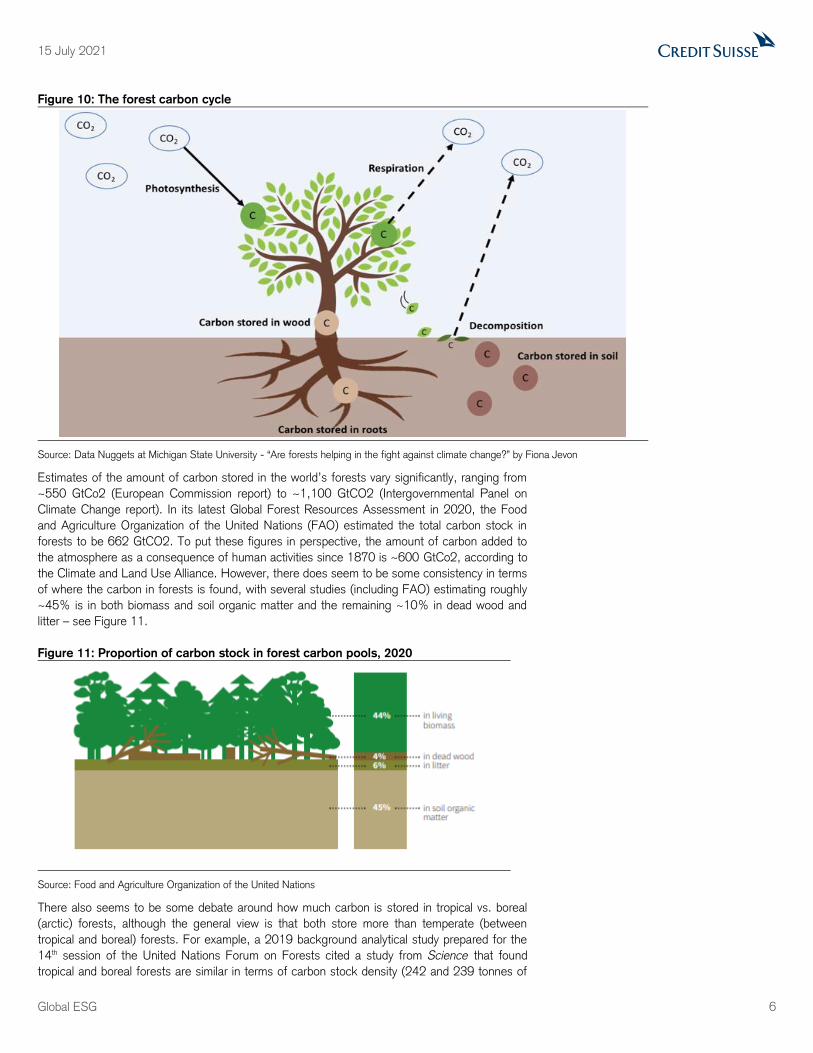
Figure 10: The forest carbon cycle
Source: Data Nuggets at Michigan State University - “Are forests helping in the fight against climate change?” by Fiona Jevon
Estimates of the amount of carbon stored in the world’s forests vary significantly, ranging from
~550 GtCo2 (European Commission report) to ~1,100 GtCO2 (Intergovernmental Panel on
Climate Change report). In its latest Global Forest Resources Assessment in 2020, the Food
and Agriculture Organization of the United Nations (FAO) estimated the total carbon stock in
forests to be 662 GtCO2. To put these figures in perspective, the amount of carbon added to
the atmosphere as a consequence of human activities since 1870 is ~600 GtCo2, according to
the Climate and Land Use Alliance. However, there does seem to be some consistency in terms
of where the carbon in forests is found, with several studies (including FAO) estimating roughly
~45% is in both biomass and soil organic matter and the remaining ~10% in dead wood and
litter – see Figure 11.
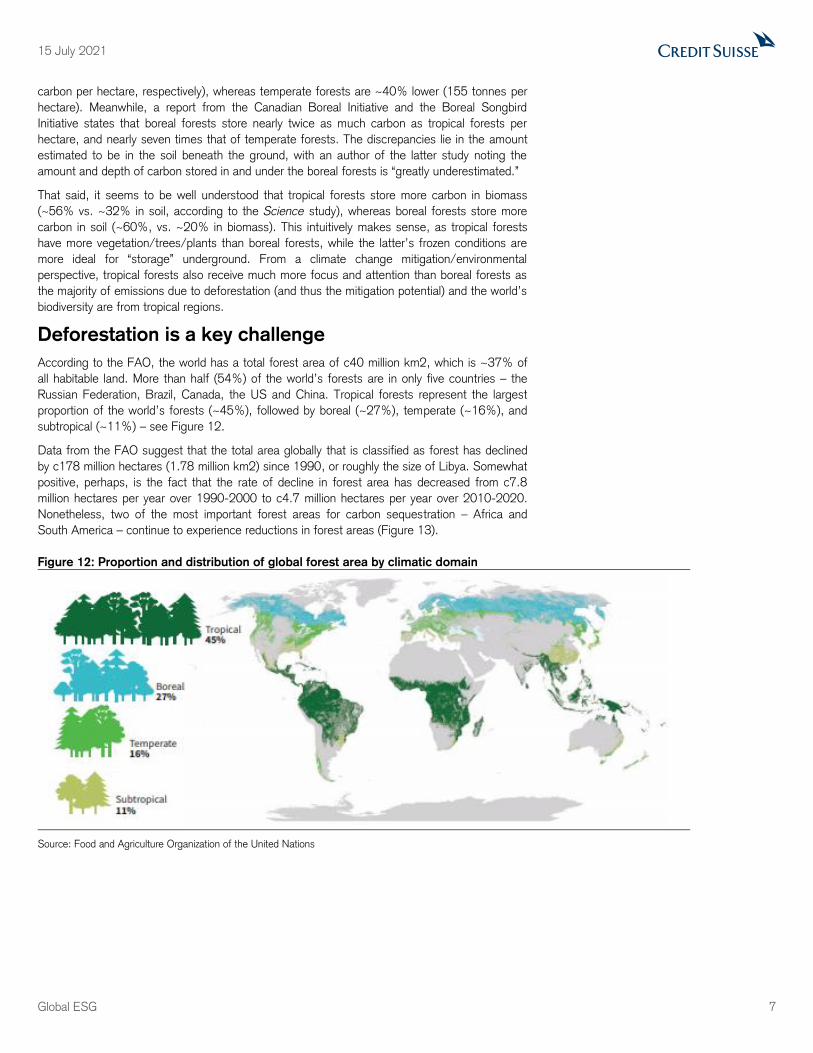
Figure 11: Proportion of carbon stock in forest carbon pools, 2020
Source: Food and Agriculture Organization of the United Nations
There also seems to be some debate around how much carbon is stored in tropical vs. boreal
(arctic) forests, although the general view is that both store more than temperate (between
tropical and boreal) forests. For example, a 2019 background analytical study prepared for the
14th session of the United Nations Forum on Forests cited a study from Science that found
tropical and boreal forests are similar in terms of carbon stock density (242 and 239 tonnes of
15 July 2021
Global ESG 7
carbon per hectare, respectively), whereas temperate forests are ~40% lower (155 tonnes per
hectare). Meanwhile, a report from the Canadian Boreal Initiative and the Boreal Songbird
Initiative states that boreal forests store nearly twice as much carbon as tropical forests per
hectare, and nearly seven times that of temperate forests. The discrepancies lie in the amount
estimated to be in the soil beneath the ground, with an author of the latter study noting the
amount and depth of carbon stored in and under the boreal forests is “greatly underestimated.”
That said, it seems to be well understood that tropical forests store more carbon in biomass
(~56% vs. ~32% in soil, according to the Science study), whereas boreal forests store more
carbon in soil (~60%, vs. ~20% in biomass). This intuitively makes sense, as tropical forests
have more vegetation/trees/plants than boreal forests, while the latter’s frozen conditions are
more ideal for “storage” underground. From a climate change mitigation/environmental
perspective, tropical forests also receive much more focus and attention than boreal forests as
the majority of emissions due to deforestation (and thus the mitigation potential) and the world’s
biodiversity are from tropical regions.
Deforestation is a key challenge
According to the FAO, the world has a total forest area of c40 million km2, which is ~37% of
all habitable land. More than half (54%) of the world’s forests are in only five countries – the
Russian Federation, Brazil, Canada, the US and China. Tropical forests represent the largest
proportion of the world’s forests (~45%), followed by boreal (~27%), temperate (~16%), and
subtropical (~11%) – see Figure 12.
Data from the FAO suggest that the total area globally that is classified as forest has declined
by c178 million hectares (1.78 million km2) since 1990, or roughly the size of Libya. Somewhat
positive, perhaps, is the fact that the rate of decline in forest area has decreased from c7.8
million hectares per year over 1990-2000 to c4.7 million hectares per year over 2010-2020.
Nonetheless, two of the most important forest areas for carbon sequestration – Africa and
South America – continue to experience reductions in forest areas (Figure 13).
Figure 12: Proportion and distribution of global forest area by climatic domain
Source: Food and Agriculture Organization of the United Nations
15 July 2021
Global ESG 8
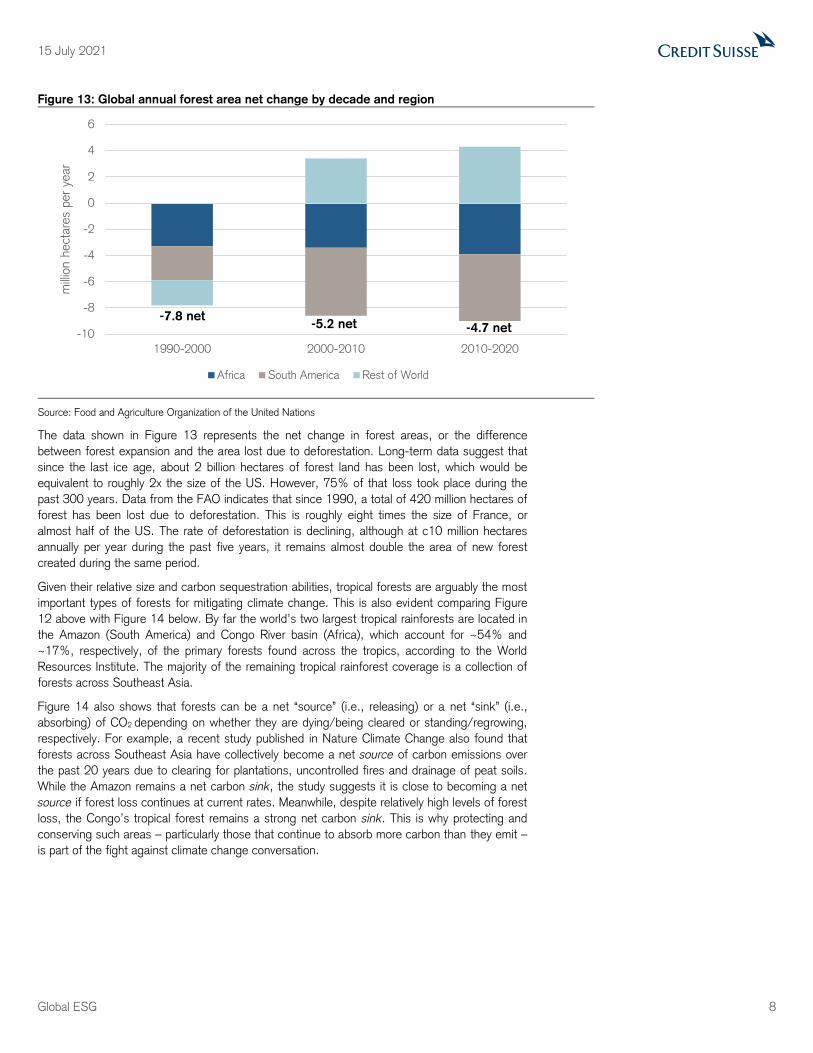
Figure 13: Global annual forest area net change by decade and region
Source: Food and Agriculture Organization of the United Nations
The data shown in Figure 13 represents the net change in forest areas, or the difference
between forest expansion and the area lost due to deforestation. Long-term data suggest that
since the last ice age, about 2 billion hectares of forest land has been lost, which would be
equivalent to roughly 2x the size of the US. However, 75% of that loss took place during the
past 300 years. Data from the FAO indicates that since 1990, a total of 420 million hectares of
forest has been lost due to deforestation. This is roughly eight times the size of France, or
almost half of the US. The rate of deforestation is declining, although at c10 million hectares
annually per year during the past five years, it remains almost double the area of new forest
created during the same period.
Given their relative size and carbon sequestration abilities, tropical forests are arguably the most
important types of forests for mitigating climate change. This is also evident comparing Figure
12 above with Figure 14 below. By far the world’s two largest tropical rainforests are located in
the Amazon (South America) and Congo River basin (Africa), which account for ~54% and
~17%, respectively, of the primary forests found across the tropics, according to the World
Resources Institute. The majority of the remaining tropical rainforest coverage is a collection of
forests across Southeast Asia.
Figure 14 also shows that forests can be a net “source” (i.e., releasing) or a net “sink” (i.e.,
absorbing) of CO2 depending on whether they are dying/being cleared or standing/regrowing,
respectively. For example, a recent study published in Nature Climate Change also found that
forests across Southeast Asia have collectively become a net source of carbon emissions over
the past 20 years due to clearing for plantations, uncontrolled fires and drainage of peat soils.
While the Amazon remains a net carbon sink, the study suggests it is close to becoming a net
source if forest loss continues at current rates. Meanwhile, despite relatively high levels of forest
loss, the Congo’s tropical forest remains a strong net carbon sink. This is why protecting and
conserving such areas – particularly those that continue to absorb more carbon than they emit –
is part of the fight against climate change conversation.
-10
-8
-6
-4
-2
0
2
4
6
1990-2000 2000-2010 2010-2020
millio
n h
ect
ares
per
year
Africa South America Rest of World
-7.8 net-5.2 net -4.7 net

15 July 2021
Global ESG 9
Figure 14: Net greenhouse gas fluxes from forests per year (2001-2019)
Source: Harris et al. 2021 / Global Forest Watch / Nature Climate Change / World Resources Institute
Carbon consumption of a tree
Typically when talking about emissions, investors are referring to greenhouse gas emissions,
which are quoted in tons of CO2 equivalent. While carbon dioxide makes up the majority of GHG
emissions, we note that other gasses such as methane and nitrous oxide typically are included
as well. In this note, we focus primarily on the carbon element, as this is what trees store.
According to the Global Carbon Budget 2020, forests and trees currently sequester over 11
gigatonnes of carbon dioxide per year (GtCO2/year) which is equivalent to ~30% of
anthropogenic (i.e., human-induced) global CO2 emissions; this absorption process is known as
the “land sink.” Forests can also release CO2 into the atmosphere when a tree dies and
decomposes. This occurs naturally over time and as part of deforestation (i.e., “land-use
change”). Overall, forests tend to absorb nearly twice the amount of carbon they emit, according
to a study published in Nature Climate Change. Oceans also play a key role, absorbing on
average ~20% of human-induced global CO2 emissions – i.e., the “ocean sink”. Combined,
these two natural sinks currently absorb roughly half of anthropogenic CO2 emissions,
underscoring the critical role of nature in curbing climate change.
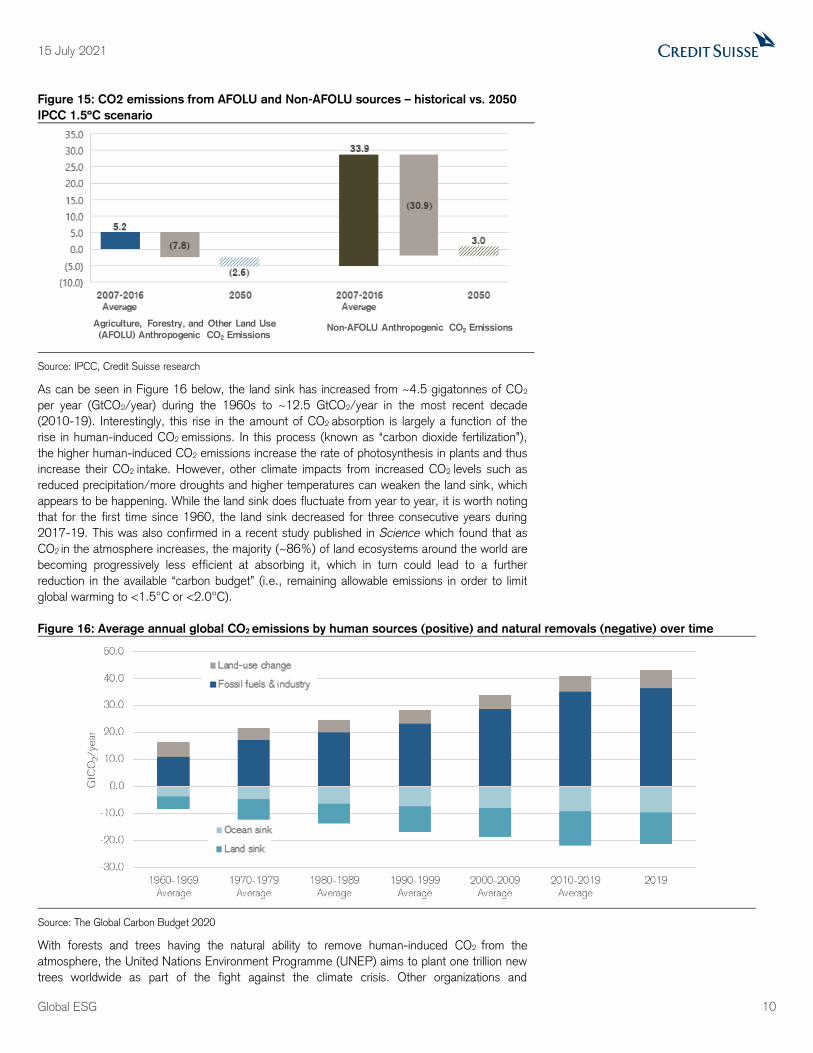
We would note that the focus of the Paris Agreement is only on anthropogenic emissions and
removals. As such, ocean sinks and unmanaged lands are excluded from measures of
anthropogenic removals, though they are still important in global climate balances. From
anthropogenic sources, absolute emissions (e.g., fossil fuels and deforestation) are far greater
than anthropogenic removals (e.g., planting trees). A report from the Intergovernmental Panel
on Climate Change (IPCC) estimated that anthropogenic CO2 emissions averaged 39.1
GtCO2/year in 2007-2016, of which agriculture, forestry and other land use (AFOLU)
contributed a positive 5.2 GtCO2/year. Under the 1.5ºC Paris-aligned scenario, AFOLU would
need to reach a negative 2.6 GtCO2/year from mitigation measures such as livestock
management, reduction of deforestation, afforestation and reforestation efforts.
15 July 2021
Global ESG 10
Figure 15: CO2 emissions from AFOLU and Non-AFOLU sources – historical vs. 2050
IPCC 1.5ºC scenario
Source: IPCC, Credit Suisse research
As can be seen in Figure 16 below, the land sink has increased from ~4.5 gigatonnes of CO2
per year (GtCO2/year) during the 1960s to ~12.5 GtCO2/year in the most recent decade
(2010-19). Interestingly, this rise in the amount of CO2 absorption is largely a function of the
rise in human-induced CO2 emissions. In this process (known as “carbon dioxide fertilization”),
the higher human-induced CO2 emissions increase the rate of photosynthesis in plants and thus
increase their CO2 intake. However, other climate impacts from increased CO2 levels such as
reduced precipitation/more droughts and higher temperatures can weaken the land sink, which
appears to be happening. While the land sink does fluctuate from year to year, it is worth noting
that for the first time since 1960, the land sink decreased for three consecutive years during
2017-19. This was also confirmed in a recent study published in Science which found that as
CO2 in the atmosphere increases, the majority (~86%) of land ecosystems around the world are
becoming progressively less efficient at absorbing it, which in turn could lead to a further
reduction in the available “carbon budget” (i.e., remaining allowable emissions in order to limit
global warming to <1.5°C or <2.0°C).
Figure 16: Average annual global CO2 emissions by human sources (positive) and natural removals (negative) over time
Source: The Global Carbon Budget 2020
With forests and trees having the natural ability to remove human-induced CO2 from the
atmosphere, the United Nations Environment Programme (UNEP) aims to plant one trillion new
trees worldwide as part of the fight against the climate crisis. Other organizations and
Agriculture, Forestry, and Other Land Use
(AFOLU) Anthropogenic CO2 EmissionsNon-AFOLU Anthropogenic CO2 Emissions
15 July 2021
Global ESG 11
corporations have also committed to planting new trees as a way to “offset” their own carbon
footprints. Thus, as part of our work, we sought out to better understand the impact that
planting new trees could have on mitigating additional carbon emissions and thus climate
change.
On average, a “typical” young and mature (at 10 years old) tree can absorb CO2 at a rate of ~13
pounds (or ~5.9 kg) and ~48 pounds (or ~22 kg), respectively, per year. This is consistent with
studies from the US Geological Survey (USGS) and University of Hamburg (UH), which have
shown that in general the older the tree, the greater its potential to store CO2. Notably, the
latter study suggests that ~70% of all the CO2 stored in trees is accumulated in the back half of
their lives. This could be because trees grow more quickly as they age and thus a far greater
number of leaves to absorb CO2 (USGS study), and/or older trees are taller and reach the top
of the canopy, thereby absorbing more sun/CO2 from the atmosphere (UH study). Moreover,
the UH study suggests younger trees are more sensitive to variations in rainfall and sunlight
than older trees.
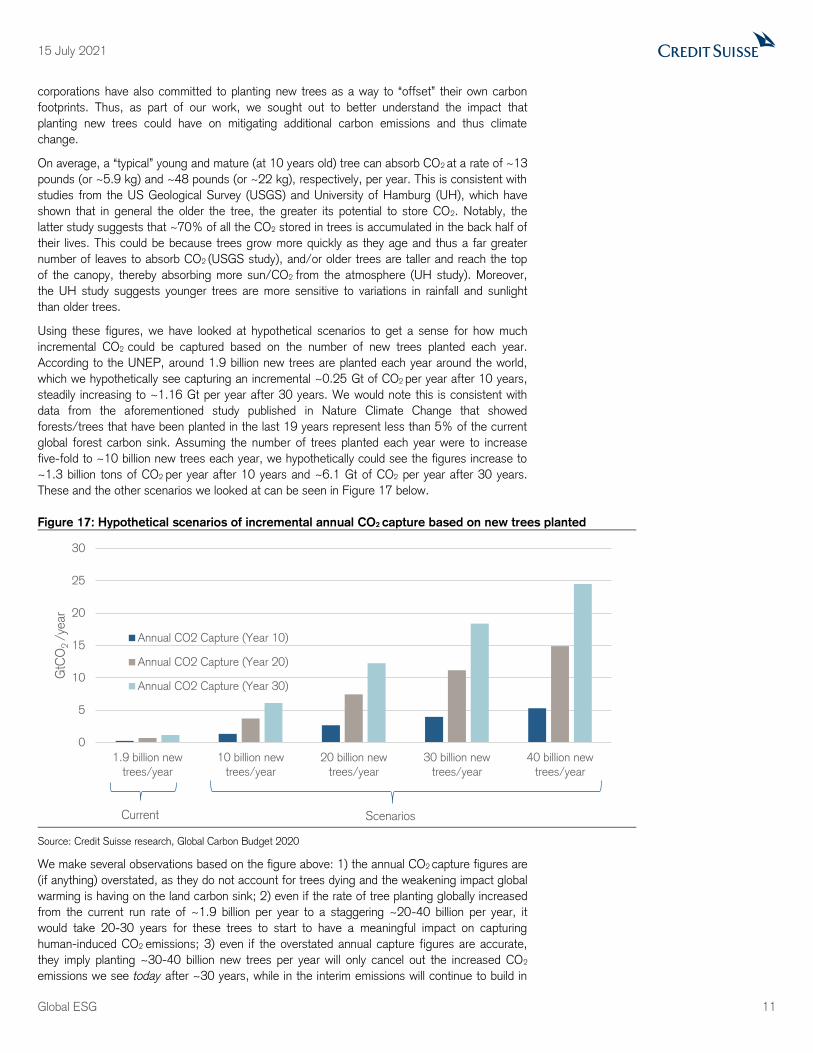
Using these figures, we have looked at hypothetical scenarios to get a sense for how much
incremental CO2 could be captured based on the number of new trees planted each year.
According to the UNEP, around 1.9 billion new trees are planted each year around the world,
which we hypothetically see capturing an incremental ~0.25 Gt of CO2 per year after 10 years,
steadily increasing to ~1.16 Gt per year after 30 years. We would note this is consistent with
data from the aforementioned study published in Nature Climate Change that showed
forests/trees that have been planted in the last 19 years represent less than 5% of the current
global forest carbon sink. Assuming the number of trees planted each year were to increase
five-fold to ~10 billion new trees each year, we hypothetically could see the figures increase to
~1.3 billion tons of CO2 per year after 10 years and ~6.1 Gt of CO2 per year after 30 years.
These and the other scenarios we looked at can be seen in Figure 17 below.
Figure 17: Hypothetical scenarios of incremental annual CO2 capture based on new trees planted
Source: Credit Suisse research, Global Carbon Budget 2020
We make several observations based on the figure above: 1) the annual CO2 capture figures are
(if anything) overstated, as they do not account for trees dying and the weakening impact global
warming is having on the land carbon sink; 2) even if the rate of tree planting globally increased
from the current run rate of ~1.9 billion per year to a staggering ~20-40 billion per year, it
would take 20-30 years for these trees to start to have a meaningful impact on capturing
human-induced CO2 emissions; 3) even if the overstated annual capture figures are accurate,
they imply planting ~30-40 billion new trees per year will only cancel out the increased CO2
emissions we see today after ~30 years, while in the interim emissions will continue to build in
0
5
10
15
20
25
30
1.9 billion new
trees/year
10 billion new
trees/year
20 billion new
trees/year
30 billion new
trees/year
40 billion new
trees/year
GtC
O2 /
year
Annual CO2 Capture (Year 10)
Annual CO2 Capture (Year 20)
Annual CO2 Capture (Year 30)
Current Scenarios

15 July 2021
Global ESG 12
the atmosphere (all else equal). For example, despite GHG emissions falling YoY in 2020 due
to pandemic-driven shutdowns, atmospheric CO2 levels (which ultimately need to fall to halt the
rise in global temperatures) continue to rise, reaching their highest level in >4 million years
during May at ~419 CO2 molecules for every million molecules (i.e., parts per million), according
to the Scripps Institution of Oceanography.
Thus, we come to the realization that while planting new trees is an important endeavor to
protect the environment/biodiversity and help mitigate climate change (particularly in the long
term), the urgency of reducing global emissions (which by some estimates need to halve this
decade to be on a ~1.5-2.0ºC pathway) requires a focus on reducing fossil fuel consumption
and maintaining existing forests that are already maximizing the amount of carbon being
sequestered. If the latter continues to deteriorate, it will simply accelerate the rise in global
temperatures as atmospheric CO2 levels continue to build (all else equal).
15 July 2021
Global ESG 13
Forests and current net zero pathways
The previous chapter showed that forests play a vital role in decarbonizing the world to net zero
emissions so as to mitigate the effects of climate change. In order to help guide policymakers in
developing regulation aimed at achieving net zero emissions, so-called global emission pathways
have been developed. These pathways reflect the fact that we are unable to reach absolute zero
emissions. Therefore, forests and other carbon dioxide removal technologies are required to
offset remaining anthropogenic emissions.
In this chapter we review how official bodies such as the IPCC incorporate the role of forests in
their net zero pathways. Specifically this section looks at the volume of forests relied upon for
carbon dioxide removal in IPCC net zero scenarios and in so doing raises questions as to the
implications of the land use change.
Current land use and global emissions
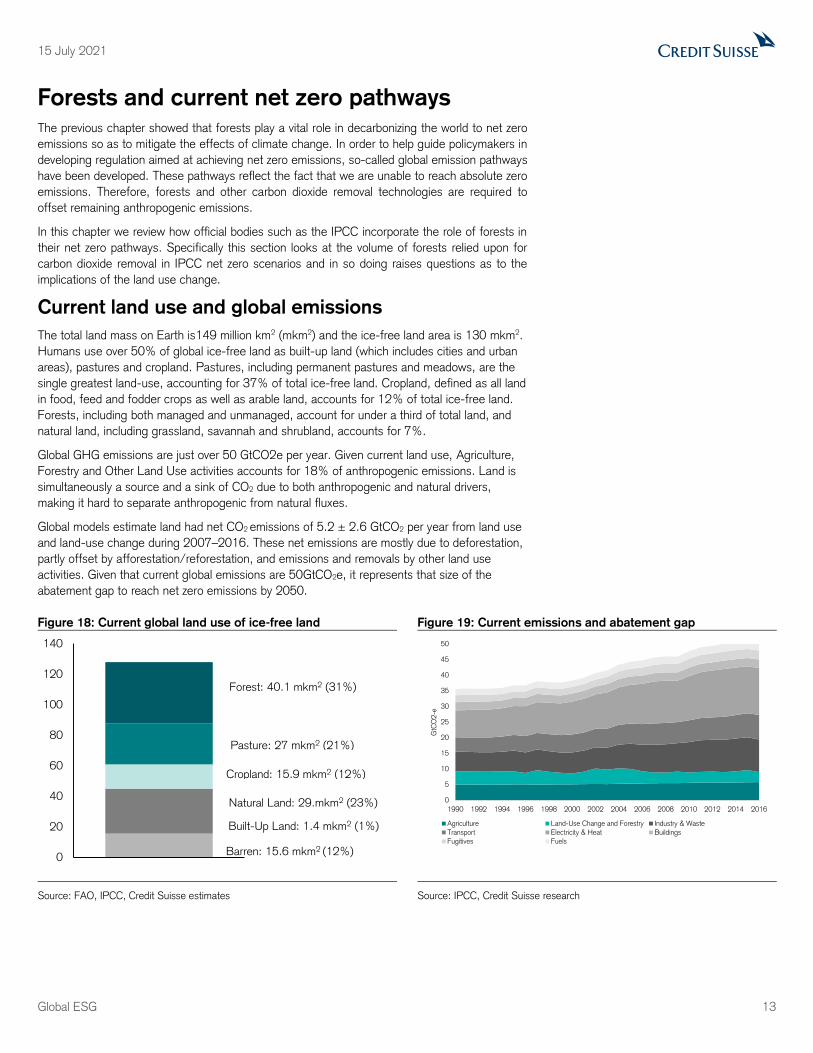
The total land mass on Earth is149 million km2 (mkm2) and the ice-free land area is 130 mkm2.
Humans use over 50% of global ice-free land as built-up land (which includes cities and urban
areas), pastures and cropland. Pastures, including permanent pastures and meadows, are the
single greatest land-use, accounting for 37% of total ice-free land. Cropland, defined as all land
in food, feed and fodder crops as well as arable land, accounts for 12% of total ice-free land.
Forests, including both managed and unmanaged, account for under a third of total land, and
natural land, including grassland, savannah and shrubland, accounts for 7%.
Global GHG emissions are just over 50 GtCO2e per year. Given current land use, Agriculture,
Forestry and Other Land Use activities accounts for 18% of anthropogenic emissions. Land is
simultaneously a source and a sink of CO2 due to both anthropogenic and natural drivers,
making it hard to separate anthropogenic from natural fluxes.
Global models estimate land had net CO2 emissions of 5.2 ± 2.6 GtCO2 per year from land use
and land-use change during 2007–2016. These net emissions are mostly due to deforestation,
partly offset by afforestation/reforestation, and emissions and removals by other land use
activities. Given that current global emissions are 50GtCO2e, it represents that size of the
abatement gap to reach net zero emissions by 2050.
Figure 18: Current global land use of ice-free land Figure 19: Current emissions and abatement gap
Source: FAO, IPCC, Credit Suisse estimates Source: IPCC, Credit Suisse research
0
20
40
60
80
100
120
140
Pasture: 27 mkm2 (21%)
Cropland: 15.9 mkm2 (12%)
Forest: 40.1 mkm2 (31%)
Natural Land: 29.mkm2 (23%)
Barren: 15.6 mkm2 (12%)
Built-Up Land: 1.4 mkm2 (1%)
0
5
10
15
20
25
30
35
40
45
50
1990 1992 1994 1996 1998 2000 2002 2004 2006 2008 2010 2012 2014 2016
GtC
O2-e
Agriculture Land-Use Change and Forestry Industry & Waste
Transport Electricity & Heat Buildings
Fugitives Fuels
15 July 2021
Global ESG 14
IPCC net zero scenarios and land use
The IPCC is the United Nations body for assessing climate-related science and its research is
the most authoritative for climate futures, mitigation, adaption and policies including carbon
prices. In its assessment reports, the IPCC uses representative concentration pathways (RCPs)
to describe different climate futures.
Each RCP represents a GHG concentration trajectory and each Assessment Report details the
impacts, and required adaptation and mitigation for each RCP. Only two of the RCPs reach net
zero by 2050. RCP2.6 provides a 66% chance of limiting global mean temperature rise to
below 2°C and RCP1.9 provides a 50-66% chance of limiting rise to 1.5°C. We have chosen
to demonstrate how land use changes under the RCP1.9.
In addition to its Assessment Reports, in 2019 the IPCC released a special report on Climate
Change and Land, addressing both how land use needs to change to mitigate climate change
under some scenarios and how it will be affected under different climate futures. We use the
modelling completed as part of the special report into land to understand the implications of how
land use needs to change by applying the modelled growth rates for emissions and land use
change between 2020 and 2050 in each scenario to current actuals.
Using the IPCC land use report, we analyse how land use and emissions change under the
IPCC RCP1.9 net zero pathway. One of the new frameworks used in conjunction with the
RCPs in the IPCC Integrated Assessment Models are the Shared Socio-economic Pathways
(SSPs). In scenarios under the SSP framework, each RCP can be modelled with the five SSPs,
with each SSP describing distinct narratives about how societal choices, demographics,
ideologies and economics will affect emissions and climate action. There are over 100 climate
models using the SSPs, so to illustrate how land use and emissions change under the different
scenarios, we have selected two of the SSPs under the 1.5°C scenario.
1. SSP1 is Sustainability – Taking the Green Road describes a world that shifts towards
sustainable practices, reducing inequality and respecting environmental boundaries, which
is reached through global cooperation reducing challenges to mitigation and adaption.
2. SSP5 is Fossil-fueled Development – Taking the Highway is a resource-intensive
pathway for economic and social development with a heavy-reliance on geo-engineering for
climate action creating high challenges to mitigation but low challenges to adaptation.
Land Use
IPCC includes Bioenergy Cropland in its definition of land. Bioenergy Cropland refers to land
dedicated to bioenergy crops including switchgrass, miscanthus and fast-growing wood species.
Traditional bioenergy crops like corn and sugarcane are included under Cropland.
To reach a net zero future under a 1.5°C pathway requires a decrease in anthropogenic usage
of land and changing the use of natural land to make way for specific sequestration activities.
The degree of land use change differs between the two SSP scenarios, with greater changes
required under the resource-driven SSP5 compared with the SSP1.
Under the SSP1, a 3% decrease in cropland and 12% decrease in pasture is required to
account for increases in forest cover and bioenergy cropland. Under SSP5, decreases are even
greater, on top of an 8% reduction in cropland, a 21% reduction in pasture land is required to
account for increases in bioenergy sequestration. In total, reaching net zero requires an
additional 3.3 million km2 of land for Bioenergy, with carbon capture and storage (BECCS) and
Forestry under SSP1 and 6.2 million km2 under SSP5. The difference in the magnitude of
required land change is related to the overreliance on fossil fuels under SSP5, which relies on
measures to offset and sequester emissions rather than completely abate through low-carbon
technologies.
15 July 2021
Global ESG 15
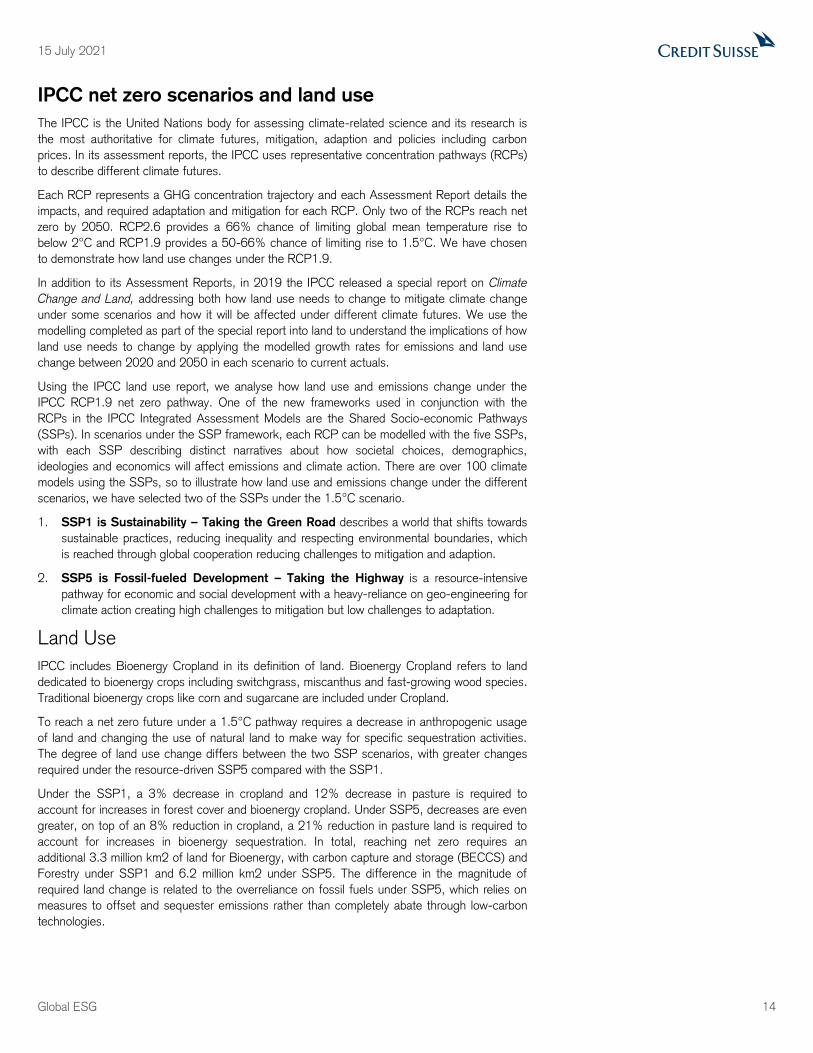
Figure 20: IPCC land use mix Figure 21: Change in land use types
Source: FAO, IPCC, Credit Suisse estimates Source: FAO, IPCC, Credit Suisse estimates
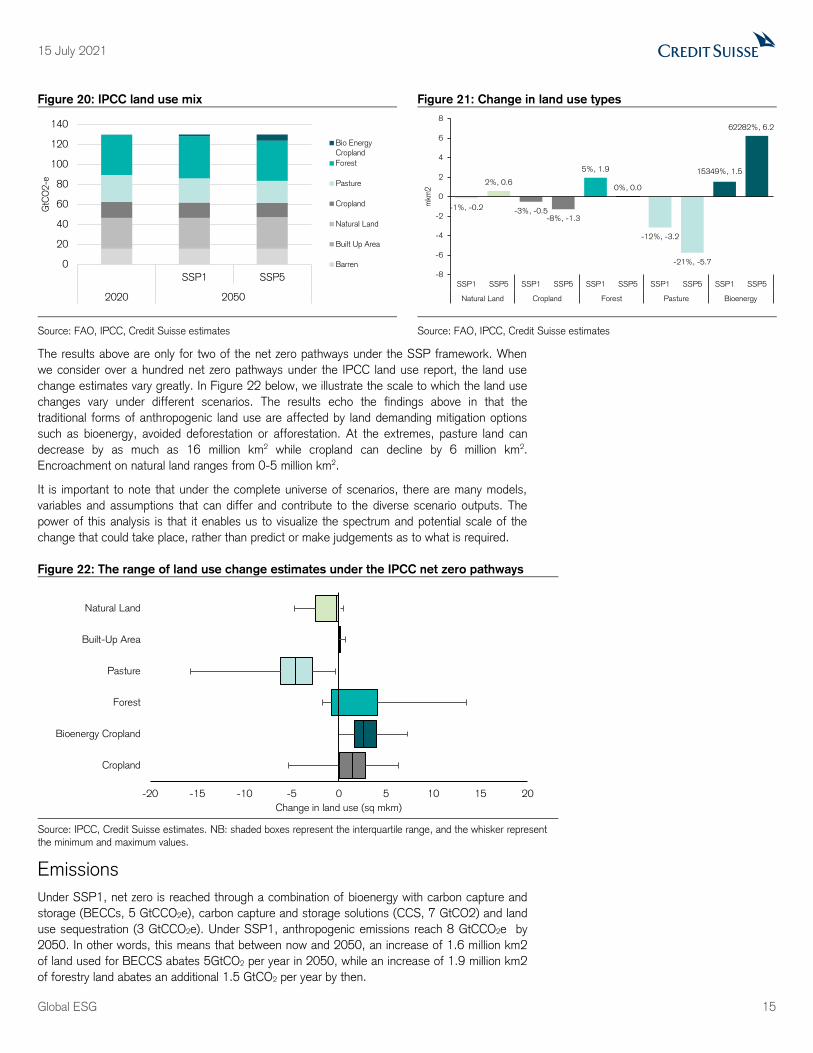
The results above are only for two of the net zero pathways under the SSP framework. When
we consider over a hundred net zero pathways under the IPCC land use report, the land use
change estimates vary greatly. In Figure 22 below, we illustrate the scale to which the land use
changes vary under different scenarios. The results echo the findings above in that the
traditional forms of anthropogenic land use are affected by land demanding mitigation options
such as bioenergy, avoided deforestation or afforestation. At the extremes, pasture land can
decrease by as much as 16 million km2 while cropland can decline by 6 million km2.
Encroachment on natural land ranges from 0-5 million km2.
It is important to note that under the complete universe of scenarios, there are many models,
variables and assumptions that can differ and contribute to the diverse scenario outputs. The
power of this analysis is that it enables us to visualize the spectrum and potential scale of the
change that could take place, rather than predict or make judgements as to what is required.
Figure 22: The range of land use change estimates under the IPCC net zero pathways
Source: IPCC, Credit Suisse estimates. NB: shaded boxes represent the interquartile range, and the whisker represent the minimum and maximum values.
Emissions
Under SSP1, net zero is reached through a combination of bioenergy with carbon capture and
storage (BECCs, 5 GtCCO2e), carbon capture and storage solutions (CCS, 7 GtCO2) and land
use sequestration (3 GtCCO2e). Under SSP1, anthropogenic emissions reach 8 GtCCO2e by
2050. In other words, this means that between now and 2050, an increase of 1.6 million km2
of land used for BECCS abates 5GtCO2 per year in 2050, while an increase of 1.9 million km2
of forestry land abates an additional 1.5 GtCO2 per year by then.
0
20
40
60
80
100
120
140
SSP1 SSP5
2020 2050
GtC
O2-e
Bio Energy
Cropland
Forest
Pasture
Cropland
Natural Land
Built Up Area
Barren
-1%, -0.2
2%, 0.6
-3%, -0.5-8%, -1.3
5%, 1.9
0%, 0.0
-12%, -3.2
-21%, -5.7
15349%, 1.5
62282%, 6.2
-8
-6
-4
-2
0
2
4
6
8
SSP1 SSP5 SSP1 SSP5 SSP1 SSP5 SSP1 SSP5 SSP1 SSP5
Natural Land Cropland Forest Pasture Bioenergy
mkm
2
-20 -15 -10 -5 0 5 10 15 20
Cropland
Bioenergy Cropland
Forest
Pasture
Built-Up Area
Natural Land
Change in land use (sq mkm)
15 July 2021
Global ESG 16
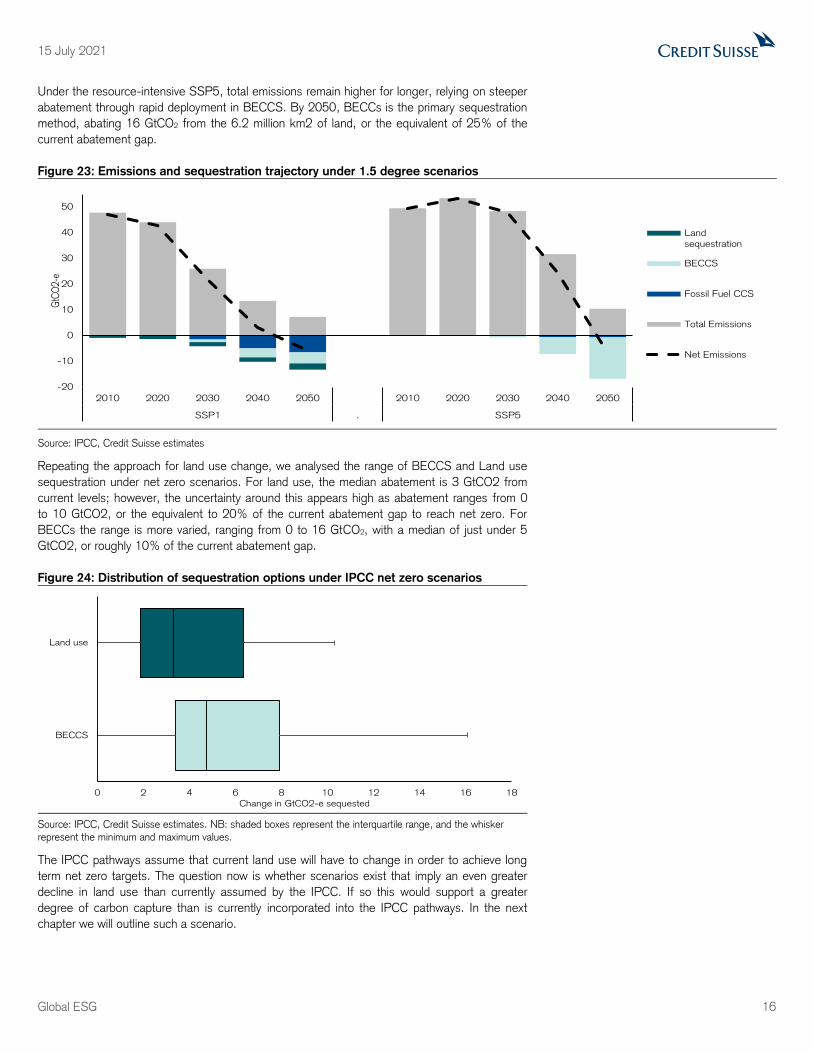
Under the resource-intensive SSP5, total emissions remain higher for longer, relying on steeper
abatement through rapid deployment in BECCS. By 2050, BECCs is the primary sequestration
method, abating 16 GtCO2 from the 6.2 million km2 of land, or the equivalent of 25% of the
current abatement gap.
Figure 23: Emissions and sequestration trajectory under 1.5 degree scenarios
Source: IPCC, Credit Suisse estimates
Repeating the approach for land use change, we analysed the range of BECCS and Land use
sequestration under net zero scenarios. For land use, the median abatement is 3 GtCO2 from
current levels; however, the uncertainty around this appears high as abatement ranges from 0
to 10 GtCO2, or the equivalent to 20% of the current abatement gap to reach net zero. For
BECCs the range is more varied, ranging from 0 to 16 GtCO2, with a median of just under 5
GtCO2, or roughly 10% of the current abatement gap.
Figure 24: Distribution of sequestration options under IPCC net zero scenarios
Source: IPCC, Credit Suisse estimates. NB: shaded boxes represent the interquartile range, and the whisker represent the minimum and maximum values.
The IPCC pathways assume that current land use will have to change in order to achieve long
term net zero targets. The question now is whether scenarios exist that imply an even greater
decline in land use than currently assumed by the IPCC. If so this would support a greater
degree of carbon capture than is currently incorporated into the IPCC pathways. In the next
chapter we will outline such a scenario.
-20
-10
0
10
20
30
40
50
2010 2020 2030 2040 2050 2010 2020 2030 2040 2050
SSP1 . SSP5
GtC
O2-
e
Landsequestration
BECCS
Fossil Fuel CCS
Total Emissions
Net Emissions
0 2 4 6 8 10 12 14 16 18
BECCS
Land use
Change in GtCO2-e sequested

15 July 2021
Global ESG 17
Changing land use aids carbon storage
In the previous chapters, we outlined that forests play a key role in the quest for carbon storage
and reaching longer-term climate change targets. Although reforestation and change in land use
is incorporated into existing net zero pathways such as those developed by the IPCC, it remains
unclear whether and how the size of forests can be increased going forward in order to help
increase carbon storage and meet long-term climate change targets.
The role that the global food system plays is key in this regard, given that current food
production and consumption accounts for more than 20% of GHG emissions and c50% of
habitable land. However, the world faces a number of existential challenges that increase the
relevance of the food system for the topic of reforestation even more. These challenges include
the prospect of having to substantially increase food production in order to eliminate
undernourishment, which currently affects c700 million people, and feed a population that looks
set to grow to c10bn by 2050 from fewer than 8bn currently. In this chapter we review the
interplay between land-use, agriculture and the potential for carbon sequestration.
The battle between forests and agriculture
The outlook for natural carbon sequestration looks challenging if history is to be a guide. Data
from Ellis et al (2020) shows the impact that the growth in agricultural land has had on the land
mass available for natural areas. Figure 26 shows that total agricultural land use has grown
exponentially during the past 150 years. In fact, since 1900 the expansion of agricultural land
has been particularly strong in Asia (+167%) and Latin America (+210%). The combination of
population growth and increased spending power suggest that agricultural land demand is
unlikely to slow down unless changes are made to food consumption and production. Until then,
further growth is likely to come at the expense of land mass occupied by forests and other
nature-based carbon removing solutions.
Figure 25: Agriculture Makes up 50% of All Habitable Land Figure 26: The Share of Forests has Declined Through Time
Source: FAO Source: Ellis, Beusen, Godewijk (2020)
0%
10%
20%
30%
40%
50%
60%
70%
80%
90%
100%
0 365 730 1095 1460 1826
Cropland Pasture Urban Villages
Permanent ice Semi-natural land Wild barren land Wild woodlands
15 July 2021
Global ESG 18
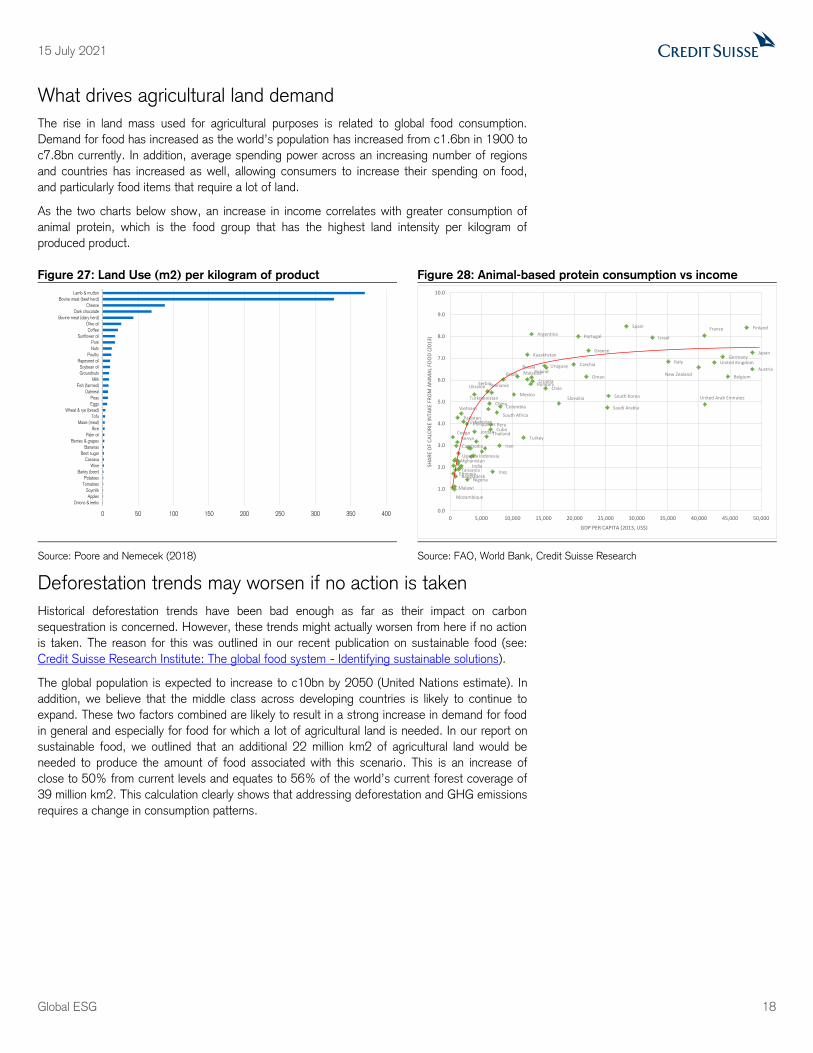
What drives agricultural land demand
The rise in land mass used for agricultural purposes is related to global food consumption.
Demand for food has increased as the world’s population has increased from c1.6bn in 1900 to
c7.8bn currently. In addition, average spending power across an increasing number of regions
and countries has increased as well, allowing consumers to increase their spending on food,
and particularly food items that require a lot of land.
As the two charts below show, an increase in income correlates with greater consumption of
animal protein, which is the food group that has the highest land intensity per kilogram of
produced product.
Figure 27: Land Use (m2) per kilogram of product Figure 28: Animal-based protein consumption vs income
Source: Poore and Nemecek (2018) Source: FAO, World Bank, Credit Suisse Research
Deforestation trends may worsen if no action is taken
Historical deforestation trends have been bad enough as far as their impact on carbon
sequestration is concerned. However, these trends might actually worsen from here if no action
is taken. The reason for this was outlined in our recent publication on sustainable food (see:
Credit Suisse Research Institute: The global food system - Identifying sustainable solutions).
The global population is expected to increase to c10bn by 2050 (United Nations estimate). In
addition, we believe that the middle class across developing countries is likely to continue to
expand. These two factors combined are likely to result in a strong increase in demand for food
in general and especially for food for which a lot of agricultural land is needed. In our report on
sustainable food, we outlined that an additional 22 million km2 of agricultural land would be
needed to produce the amount of food associated with this scenario. This is an increase of
close to 50% from current levels and equates to 56% of the world’s current forest coverage of
39 million km2. This calculation clearly shows that addressing deforestation and GHG emissions
requires a change in consumption patterns.
0 50 100 150 200 250 300 350 400
Onions & leeks
Apples
Soymilk
Tomatoes
Potatoes
Barley (beer)
Wine
Cassava
Beet sugar
Bananas
Berries & grapes
Palm oil
Rice
Maize (meal)
Tofu
Wheat & rye (bread)
Eggs
Peas
Oatmeal
Fish (farmed)
Milk
Groundnuts
Soybean oil
Rapeseed oil
Poultry
Nuts
Pork
Sunflower oil
Coffee
Olive oil
Bovine meat (dairy herd)
Dark chocolate
Cheese
Bovine meat (beef herd)
Lamb & mutton
Malawi
Afghanistan
Mozambique
India
Congo
Uganda
EthiopiaTanzania
Pakistan
Cambodia
Uzbekistan
Bangladesh
Kenya
Nigeria
Vietnam
Ukraine
Philippines
Indonesia
Jordan
Iran
Iraq
South Africa
Colombia
Peru
Turkmenistan
Serbia
ThailandCuba
Brazil
Turkey
Mexico
Kazakhstan
China
RussiaMalaysia
Argentina
RomaniaCroatia
Poland
ChileHungary
Oman
Uruguay
Slovakia
Greece
Saudi Arabia
Czechia
Portugal
Spain
South Korea
Italy
Japan
France
Israel
New Zealand
United Kingdom
United Arab Emirates
Belgium
Germany
Finland
Austria
0.0
1.0
2.0
3.0
4.0
5.0
6.0
7.0
8.0
9.0
10.0
0 5,000 10,000 15,000 20,000 25,000 30,000 35,000 40,000 45,000 50,000
SHA
RE
OF
CA
LOR
IE IN
TAK
E FR
OM
AN
IMA
L FO
OD
(2
01
3)
GDP PER CAPITA (2013, US$)

15 July 2021
Global ESG 19
Figure 29: Land demand to feed the global population (m km2) Figure 30: Per capita consumption (kg) of certain food items
grouped by average GDP/Capita (USD)
Source: Credit Suisse research Source: World Bank, Poore and Nemecek (2018), Credit Suisse estimates
Healthy food consumption and reforestation potential
If increased consumption of land-intense food is likely to put more pressure on deforestation,
then it stands to reason that a reduction in consumption of these items would help reduce that
same pressure. In our report on sustainable food, we outlined that there is a significant need for
the world’s population to shift from a meat-based to a plant-based diet. This need is not only
driven by the ecological footprint of a diet that is meat-rich, but also because current dietary
patterns globally are unhealthy. Reducing the consumption of meat, processed food and
saturated fat and increasing the intake of fruit, vegetables, whole grains and nuts and seeds
would help lower the environmental burden of the global food system as well as the growth in
the number of people who are overweight or obese.
Figure 31: Emissions intensity (kg CO2
equivalent/person/year)
Figure 32: The health and environmental benefits of moving to
a plant-based diet
Source: Clark et al: “Multiple health and environmental impacts of foods” Source: Clark et al (2019), EAT: “Diets for a better future”
With the above in mind, we wanted to know whether increased consumption of plant-based
food would meaningfully reduce total agricultural land demand going forward. If so, this would
free up land that can be used for reforestation and help reduce carbon emissions. In order to
assess the impact of a change in diets on land demand, we ran the following scenarios:
1. Consumers adopt healthy diets: In 2019, the EAT-Lancet Commission published a diet
that provides a healthy balance of macro and micro nutrients, limits calorie intake to 2,500
kcal per day and is sustainable from an ecological perspective. In our report on sustainable
0.0
10.0
20.0
30.0
40.0
50.0
60.0
70.0
2020 2030 2050
Bovine meat (beef herd) Lamb & mutton MilkWheat & rye (bread) Poultry PorkRice Other
0
20
40
60
80
100
120
140
160
180
Pork Beef Milk Wheat Potatoes Sugar Rice Fruit
<2,500 2,500-5,000 5,000-10,000 10,000-20,000 >20,000
0 500 1,000 1,500 2,000 2,500
Vegan*
Two-thirds
vegan*
Vegetarian*
No dairy*
Reduced diet*
Average diet
Dairy Eggs Fish Meat Plant matter Sugar & oils
Fish
NutsLegumes
Whole grains
Refined grainsFruits
Vegetables
Unprocessed meat
Processed meat
Added sugar
Olive Oil
Potatoes
Chicken
Dairy
Eggs
Envi
ronm
enta
l im
pac
t
Health impact
Low
Low
High
High
15 July 2021
Global ESG 20
food, we outlined the structure of this diet and showed that if adopted it would result in a
substantial reduction in meat consumption, while the consumption of healthier (and
environmentally friendlier) products such as fruits and vegetables would rise. Figure 27
suggests that such a shift would reduce total land demand.
Our first scenario assumes that the global population adopts the EAT-Lancet diet. In order
to assess the potential impact of this on land demand, we incorporate footprint data for the
relevant food groups that make up the EAT-Lancet diet. This, together with estimates on
population sizes and average income for over 150 countries globally, allows us to calculate
total land demand through time. We then compare these calculations with total land
demand currently, as well as potential land demand going forward if dietary habits do not
change. Data on the latter was included in our sustainable food report.
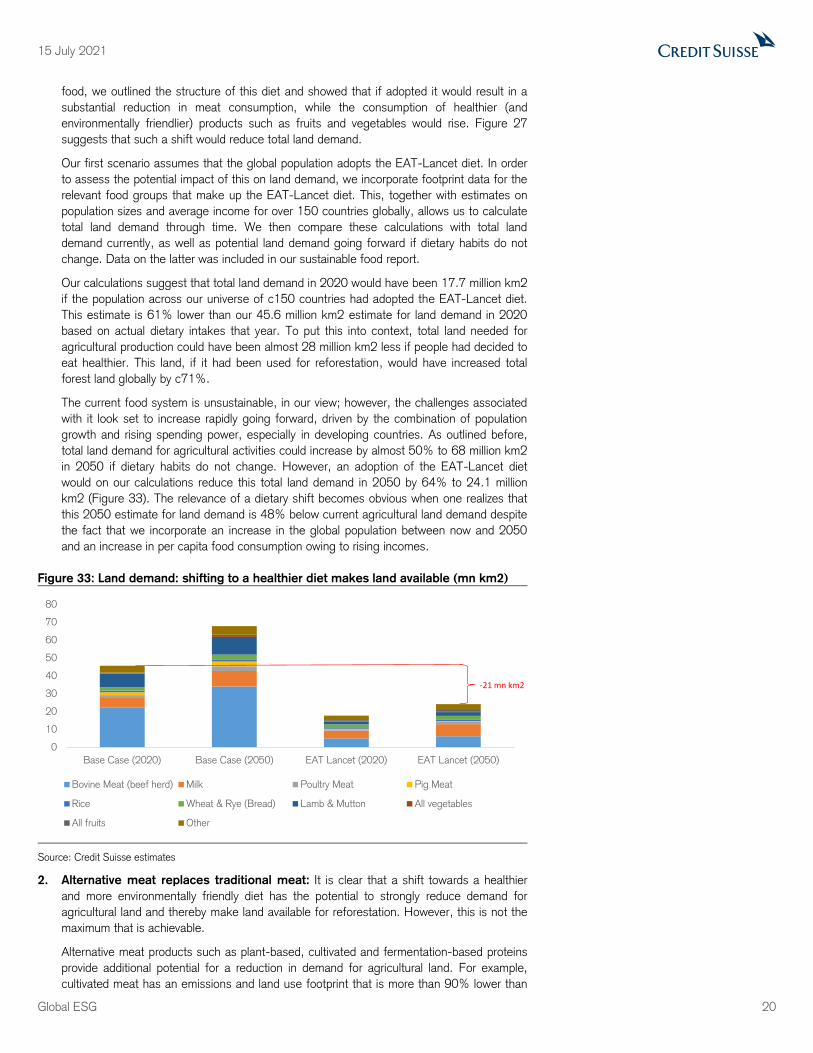
Our calculations suggest that total land demand in 2020 would have been 17.7 million km2
if the population across our universe of c150 countries had adopted the EAT-Lancet diet.
This estimate is 61% lower than our 45.6 million km2 estimate for land demand in 2020
based on actual dietary intakes that year. To put this into context, total land needed for
agricultural production could have been almost 28 million km2 less if people had decided to
eat healthier. This land, if it had been used for reforestation, would have increased total
forest land globally by c71%.
The current food system is unsustainable, in our view; however, the challenges associated
with it look set to increase rapidly going forward, driven by the combination of population
growth and rising spending power, especially in developing countries. As outlined before,
total land demand for agricultural activities could increase by almost 50% to 68 million km2
in 2050 if dietary habits do not change. However, an adoption of the EAT-Lancet diet
would on our calculations reduce this total land demand in 2050 by 64% to 24.1 million
km2 (Figure 33). The relevance of a dietary shift becomes obvious when one realizes that
this 2050 estimate for land demand is 48% below current agricultural land demand despite
the fact that we incorporate an increase in the global population between now and 2050
and an increase in per capita food consumption owing to rising incomes.
Figure 33: Land demand: shifting to a healthier diet makes land available (mn km2)
Source: Credit Suisse estimates
2. Alternative meat replaces traditional meat: It is clear that a shift towards a healthier
and more environmentally friendly diet has the potential to strongly reduce demand for
agricultural land and thereby make land available for reforestation. However, this is not the
maximum that is achievable.
Alternative meat products such as plant-based, cultivated and fermentation-based proteins
provide additional potential for a reduction in demand for agricultural land. For example,
cultivated meat has an emissions and land use footprint that is more than 90% lower than
0
10
20
30
40
50
60
70
80
Base Case (2020) Base Case (2050) EAT Lancet (2020) EAT Lancet (2050)
Bovine Meat (beef herd) Milk Poultry Meat Pig Meat
Rice Wheat & Rye (Bread) Lamb & Mutton All vegetables
All fruits Other
-21 mn km2
15 July 2021
Global ESG 21
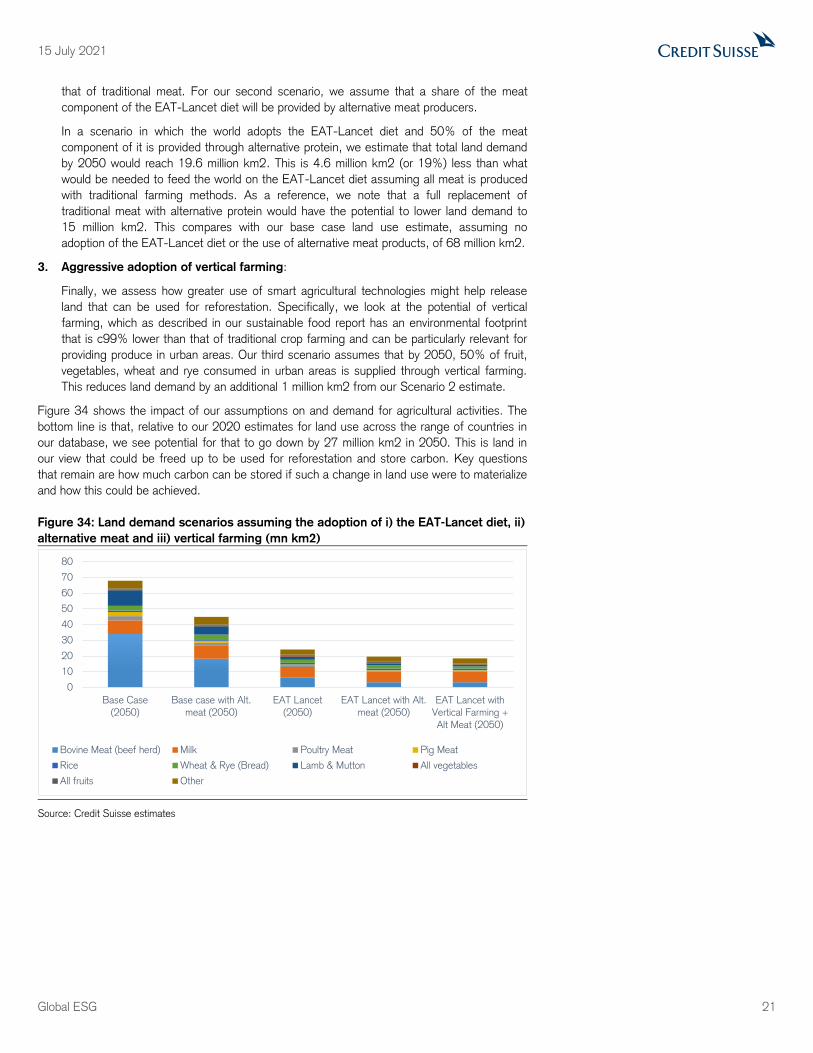
that of traditional meat. For our second scenario, we assume that a share of the meat
component of the EAT-Lancet diet will be provided by alternative meat producers.
In a scenario in which the world adopts the EAT-Lancet diet and 50% of the meat
component of it is provided through alternative protein, we estimate that total land demand
by 2050 would reach 19.6 million km2. This is 4.6 million km2 (or 19%) less than what
would be needed to feed the world on the EAT-Lancet diet assuming all meat is produced
with traditional farming methods. As a reference, we note that a full replacement of
traditional meat with alternative protein would have the potential to lower land demand to
15 million km2. This compares with our base case land use estimate, assuming no
adoption of the EAT-Lancet diet or the use of alternative meat products, of 68 million km2.
3. Aggressive adoption of vertical farming:
Finally, we assess how greater use of smart agricultural technologies might help release
land that can be used for reforestation. Specifically, we look at the potential of vertical
farming, which as described in our sustainable food report has an environmental footprint
that is c99% lower than that of traditional crop farming and can be particularly relevant for
providing produce in urban areas. Our third scenario assumes that by 2050, 50% of fruit,
vegetables, wheat and rye consumed in urban areas is supplied through vertical farming.
This reduces land demand by an additional 1 million km2 from our Scenario 2 estimate.
Figure 34 shows the impact of our assumptions on and demand for agricultural activities. The
bottom line is that, relative to our 2020 estimates for land use across the range of countries in
our database, we see potential for that to go down by 27 million km2 in 2050. This is land in
our view that could be freed up to be used for reforestation and store carbon. Key questions
that remain are how much carbon can be stored if such a change in land use were to materialize
and how this could be achieved.
Figure 34: Land demand scenarios assuming the adoption of i) the EAT-Lancet diet, ii)
alternative meat and iii) vertical farming (mn km2)
Source: Credit Suisse estimates
0
10
20
30
40
50
60
70
80
Base Case
(2050)
Base case with Alt.
meat (2050)
EAT Lancet
(2050)
EAT Lancet with Alt.
meat (2050)
EAT Lancet with
Vertical Farming +
Alt Meat (2050)
Bovine Meat (beef herd) Milk Poultry Meat Pig Meat
Rice Wheat & Rye (Bread) Lamb & Mutton All vegetables
All fruits Other
15 July 2021
Global ESG 22
How much carbon can be captured?
In order to estimate the carbon storage potential that reforestation of agricultural land may
provide, we have reviewed the following questions:
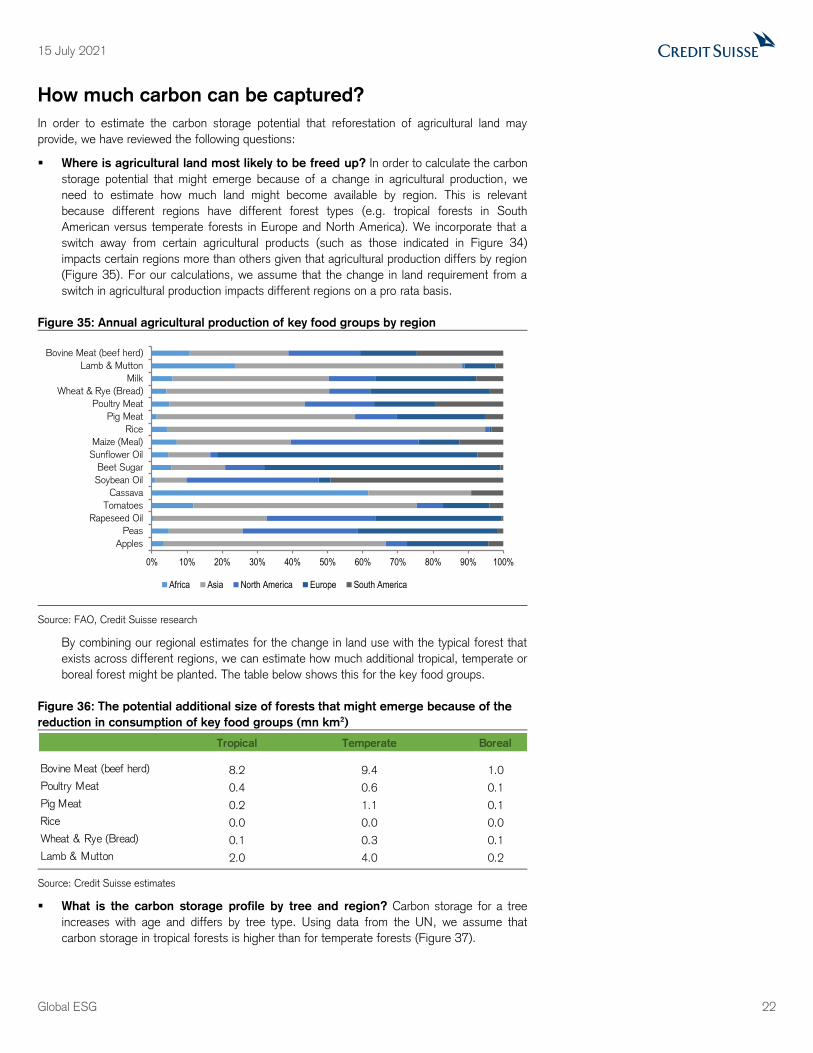
Where is agricultural land most likely to be freed up? In order to calculate the carbon
storage potential that might emerge because of a change in agricultural production, we
need to estimate how much land might become available by region. This is relevant
because different regions have different forest types (e.g. tropical forests in South
American versus temperate forests in Europe and North America). We incorporate that a
switch away from certain agricultural products (such as those indicated in Figure 34)
impacts certain regions more than others given that agricultural production differs by region
(Figure 35). For our calculations, we assume that the change in land requirement from a
switch in agricultural production impacts different regions on a pro rata basis.
Figure 35: Annual agricultural production of key food groups by region
Source: FAO, Credit Suisse research
By combining our regional estimates for the change in land use with the typical forest that
exists across different regions, we can estimate how much additional tropical, temperate or
boreal forest might be planted. The table below shows this for the key food groups.
Figure 36: The potential additional size of forests that might emerge because of the
reduction in consumption of key food groups (mn km2)
Source: Credit Suisse estimates
What is the carbon storage profile by tree and region? Carbon storage for a tree
increases with age and differs by tree type. Using data from the UN, we assume that
carbon storage in tropical forests is higher than for temperate forests (Figure 37).
0% 10% 20% 30% 40% 50% 60% 70% 80% 90% 100%
Bovine Meat (beef herd)
Lamb & Mutton
Milk
Wheat & Rye (Bread)
Poultry Meat
Pig Meat
Rice
Maize (Meal)
Sunflower Oil
Beet Sugar
Soybean Oil
Cassava
Tomatoes
Rapeseed Oil
Peas
Apples
Africa Asia North America Europe South America
Tropical Temperate Boreal
Bovine Meat (beef herd) 8.2 9.4 1.0
Poultry Meat 0.4 0.6 0.1
Pig Meat 0.2 1.1 0.1
Rice 0.0 0.0 0.0
Wheat & Rye (Bread) 0.1 0.3 0.1
Lamb & Mutton 2.0 4.0 0.2
15 July 2021
Global ESG 23
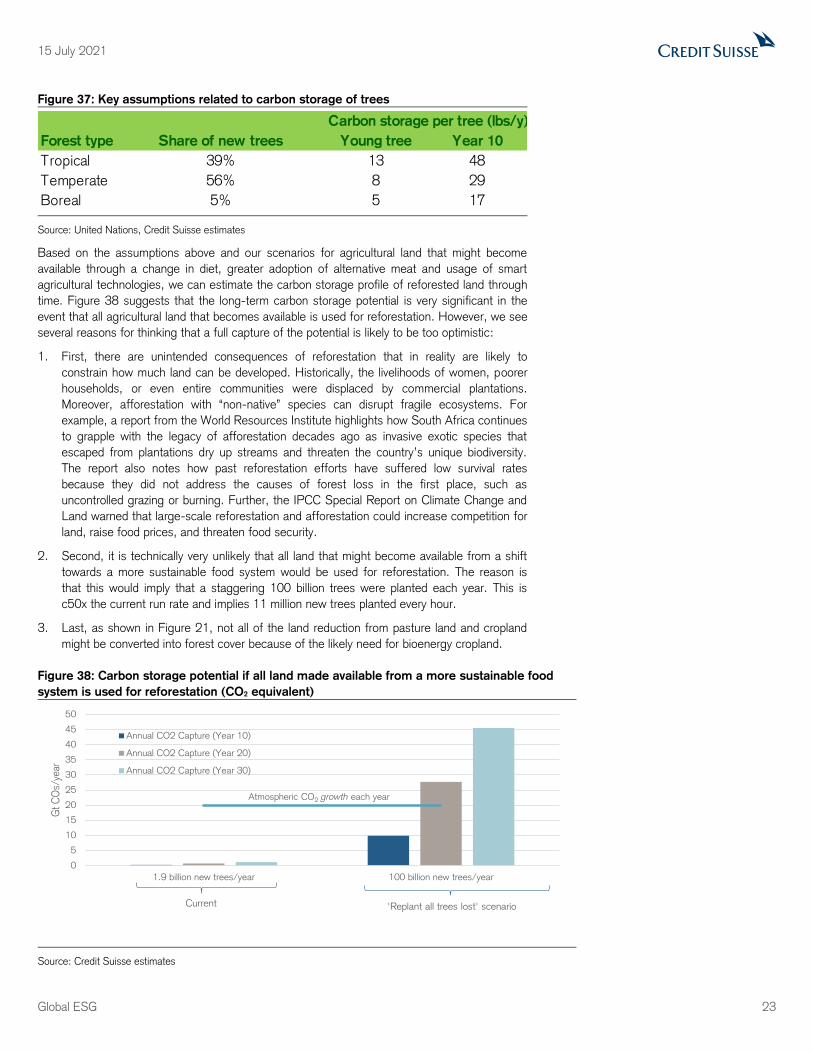
Figure 37: Key assumptions related to carbon storage of trees
Source: United Nations, Credit Suisse estimates
Based on the assumptions above and our scenarios for agricultural land that might become
available through a change in diet, greater adoption of alternative meat and usage of smart
agricultural technologies, we can estimate the carbon storage profile of reforested land through
time. Figure 38 suggests that the long-term carbon storage potential is very significant in the
event that all agricultural land that becomes available is used for reforestation. However, we see
several reasons for thinking that a full capture of the potential is likely to be too optimistic:
1. First, there are unintended consequences of reforestation that in reality are likely to
constrain how much land can be developed. Historically, the livelihoods of women, poorer
households, or even entire communities were displaced by commercial plantations.
Moreover, afforestation with “non-native” species can disrupt fragile ecosystems. For
example, a report from the World Resources Institute highlights how South Africa continues
to grapple with the legacy of afforestation decades ago as invasive exotic species that
escaped from plantations dry up streams and threaten the country’s unique biodiversity.
The report also notes how past reforestation efforts have suffered low survival rates
because they did not address the causes of forest loss in the first place, such as
uncontrolled grazing or burning. Further, the IPCC Special Report on Climate Change and
Land warned that large-scale reforestation and afforestation could increase competition for
land, raise food prices, and threaten food security.
2. Second, it is technically very unlikely that all land that might become available from a shift
towards a more sustainable food system would be used for reforestation. The reason is
that this would imply that a staggering 100 billion trees were planted each year. This is
c50x the current run rate and implies 11 million new trees planted every hour.
3. Last, as shown in Figure 21, not all of the land reduction from pasture land and cropland
might be converted into forest cover because of the likely need for bioenergy cropland.
Figure 38: Carbon storage potential if all land made available from a more sustainable food
system is used for reforestation (CO2 equivalent)
Source: Credit Suisse estimates
Carbon storage per tree (lbs/y)
Forest type Share of new trees Young tree Year 10
Tropical 39% 13 48
Temperate 56% 8 29
Boreal 5% 5 17
0
5
10
15
20
25
30
35
40
45
50
1.9 billion new trees/year 100 billion new trees/year
Gt C
Os/
year
Annual CO2 Capture (Year 10)
Annual CO2 Capture (Year 20)
Annual CO2 Capture (Year 30)
Current 'Replant all trees lost' scenario
Atmospheric CO2 growth each year
15 July 2021
Global ESG 24
The IRR of a tree
Our previous analysis shows that a shift towards a less environmentally intense diet would free
up land that could be used for reforestation. In our sustainable food report, we outlined that the
need to improve health conditions, the development of alternative meat products, greater use of
smart-agriculture technologies and tighter regulation were some of the drivers that might bring
about this dietary shift. These drivers, however, largely depend on consumers’ willingness to
change their behavior, which may not necessarily be easy to achieve in the short term.
Another potential driver that might accelerate the change in land use and make land available
for reforestation relates to the food producers. Farmers might proactively decide to switch from
farming to forestry if financial conditions for the latter were superior to those associated with
their current operations. In other words, if financial returns related to planting trees were better
than those from farming animals, farmers might decide to switch and thereby help achieve
climate change related targets. The key question, therefore, is: “What is the return of a tree?”
Cost of planting and managing trees
Cost estimates for planting and managing trees or forests are not easy to find; however, work
done in relation to the Woodland Carbon Code in the UK provides some insight (see:
woodlandcarboncode). The cost of developing forests varies significantly and depends on the
type of woodland, its location, and the operations needed to establish and manage it. Based on
data from the Forestry Commission, the Woodland Carbon Code estimates that the initial
investment cost related to the establishment of a new forest ranges between US$7,250 per
hectare and US$10,780 per hectare, depending on the type of forest. These costs are typically
incurred during the establishment phase, which can run for 15 years. In addition, the
maintenance or operating costs associated with running the forests across the entire lifespan of
the forest are estimated at between US$9,660 and US$19,460 per hectare. This period can
run for 55 years or more. The cost estimates include operations related to drainage, fencing,
insurance, planning, planting, ground preparation, weeding and general maintenance. For our
calculations, we use the average of Woodland’s estimates for lowland conifer and broadleaved
woodland. This suggests that initial investments are US$8,600 per hectare, whereas lifetime
costs (incurred over 55 years) are US$16,170 per hectare. This implies annual operating and
depreciation costs of US$867 per hectare during the first 15 years of operation.
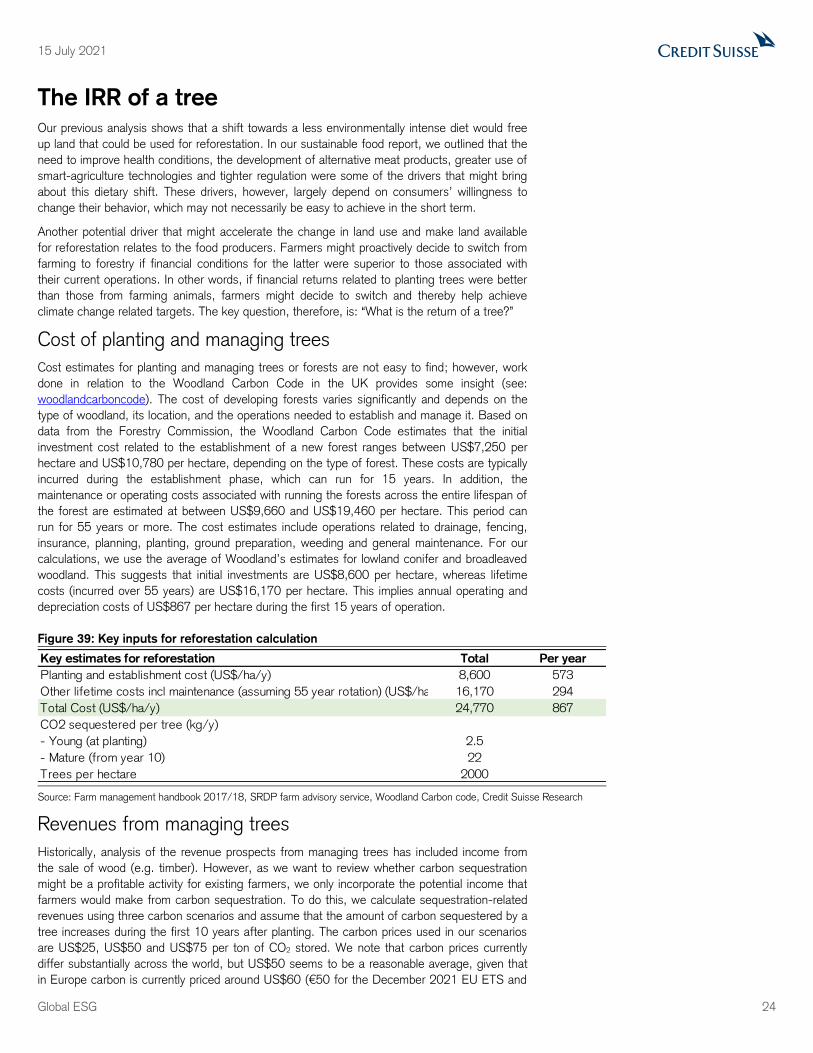
Figure 39: Key inputs for reforestation calculation
Source: Farm management handbook 2017/18, SRDP farm advisory service, Woodland Carbon code, Credit Suisse Research
Revenues from managing trees
Historically, analysis of the revenue prospects from managing trees has included income from
the sale of wood (e.g. timber). However, as we want to review whether carbon sequestration
might be a profitable activity for existing farmers, we only incorporate the potential income that
farmers would make from carbon sequestration. To do this, we calculate sequestration-related
revenues using three carbon scenarios and assume that the amount of carbon sequestered by a
tree increases during the first 10 years after planting. The carbon prices used in our scenarios
are US$25, US$50 and US$75 per ton of CO2 stored. We note that carbon prices currently
differ substantially across the world, but US$50 seems to be a reasonable average, given that
in Europe carbon is currently priced around US$60 (€50 for the December 2021 EU ETS and
Key estimates for reforestation Total Per year
Planting and establishment cost (US$/ha/y) 8,600 573
Other lifetime costs incl maintenance (assuming 55 year rotation) (US$/ha/y) 16,170 294
Total Cost (US$/ha/y) 24,770 867
CO2 sequestered per tree (kg/y)
- Young (at planting) 2.5
- Mature (from year 10) 22
Trees per hectare 2000
15 July 2021
Global ESG 25
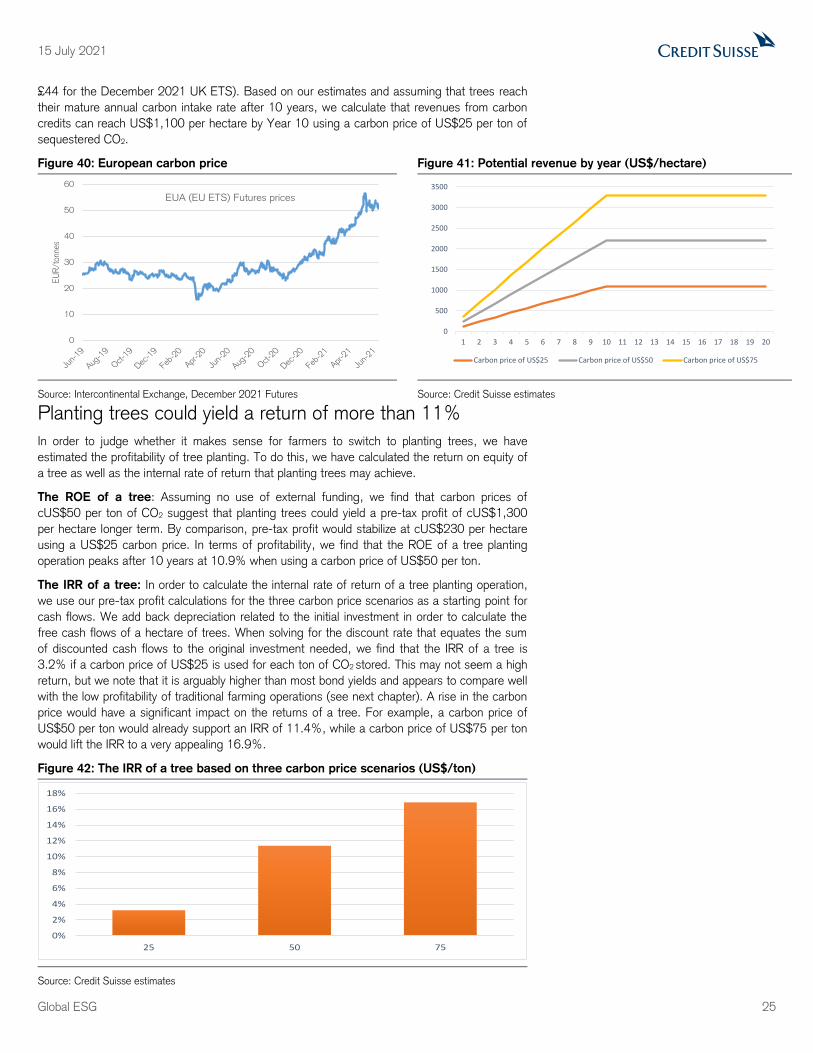
£44 for the December 2021 UK ETS). Based on our estimates and assuming that trees reach
their mature annual carbon intake rate after 10 years, we calculate that revenues from carbon
credits can reach US$1,100 per hectare by Year 10 using a carbon price of US$25 per ton of
sequestered CO2.
Figure 40: European carbon price Figure 41: Potential revenue by year (US$/hectare)
Source: Intercontinental Exchange, December 2021 Futures Source: Credit Suisse estimates
Planting trees could yield a return of more than 11%
In order to judge whether it makes sense for farmers to switch to planting trees, we have
estimated the profitability of tree planting. To do this, we have calculated the return on equity of
a tree as well as the internal rate of return that planting trees may achieve.
The ROE of a tree: Assuming no use of external funding, we find that carbon prices of
cUS$50 per ton of CO2 suggest that planting trees could yield a pre-tax profit of cUS$1,300
per hectare longer term. By comparison, pre-tax profit would stabilize at cUS$230 per hectare
using a US$25 carbon price. In terms of profitability, we find that the ROE of a tree planting
operation peaks after 10 years at 10.9% when using a carbon price of US$50 per ton.
The IRR of a tree: In order to calculate the internal rate of return of a tree planting operation,
we use our pre-tax profit calculations for the three carbon price scenarios as a starting point for
cash flows. We add back depreciation related to the initial investment in order to calculate the
free cash flows of a hectare of trees. When solving for the discount rate that equates the sum
of discounted cash flows to the original investment needed, we find that the IRR of a tree is
3.2% if a carbon price of US$25 is used for each ton of CO2 stored. This may not seem a high
return, but we note that it is arguably higher than most bond yields and appears to compare well
with the low profitability of traditional farming operations (see next chapter). A rise in the carbon
price would have a significant impact on the returns of a tree. For example, a carbon price of
US$50 per ton would already support an IRR of 11.4%, while a carbon price of US$75 per ton
would lift the IRR to a very appealing 16.9%.
Figure 42: The IRR of a tree based on three carbon price scenarios (US$/ton)
Source: Credit Suisse estimates
0
10
20
30
40
50
60
EU
R/t
onne
s
EUA (EU ETS) Futures prices
0
500
1000
1500
2000
2500
3000
3500
1 2 3 4 5 6 7 8 9 10 11 12 13 14 15 16 17 18 19 20
Carbon price of US$25 Carbon price of US$50 Carbon price of US$75
0%
2%
4%
6%
8%
10%
12%
14%
16%
18%
25 50 75

15 July 2021
Global ESG 26
To tree or not to tree?
The previous chapter showed that with some, in our view, moderate assumptions on future
carbon prices, one finds that planting trees could yield appealing returns. The question that is
relevant now is whether this return is attractive enough for farmers to change (some of) their
activities. In this chapter, we argue that it does make sense for farmers to seriously consider
shifting at least some of their focus from agricultural activities to planting trees.
Revenues and costs: farming vs planting trees
There are obviously many reasons why a farmer might be engaged in keeping animals or
growing crops. For the purposes of this note, we assume that only commercial reasons matter
and we therefore look at the question of whether, or rather when, it would make commercial
sense for farmers to switch from growing crops or keeping animals to planting trees. To do this,
we use farming income for UK farmers. We know that regional differences exist and are
therefore reluctant to extrapolate too much; however, it may serve as an interesting discussion
point.
Figure 43: Income and cost estimates for farms in the UK (£/farm)
Source: Department for Environment, Food & Rural Affairs, Credit Suisse research
Figure 43 shows gross income, costs and pre-tax income for different types of farming in the
UK. The first observation we make is that farming income excluding the so-called Basic
Payment Scheme (a subsidy scheme) and the so-called diversification surplus allowance is
actually negative for all types of farming excluding the specialty poultry farms. In other words,
farming in the UK currently would be a loss-making enterprise were it not for government
support programs.
In order to arrive at a more conservative estimate for the carbon breakeven point at which it
makes commercial sense for farmers to switch to planting trees, we use farming income
including government subsidies as a starting point. We note that even this is a negative number
for specialist pig farms. Coupled with the fact that for health and environmental reasons moving
away from meat-based diets is required, we would argue that specialist pig farmers stand to
benefit from switching to planting trees irrespective of the carbon price we use in our analysis.
In Figure 44, we show what revenues from carbon sequestration are required for different
farmers to generate a pre-tax income per hectare that is equal to what they currently make. We
can then calculate the carbon price that drives such a revenue number, which gives us the
carbon breakeven price above which it makes sense for farmers to start planting trees.
Average (£/farm)
Lowland
Grazing
Livestock
Farms Dairy Cereal Farms
General Cropping
farms
Specialist Pig
Farms
Specialist Poultry
Farms
OUTPUT 65,000 474,400 217,819 347,900 605,016 868,600
Livestock 48,100 428,800 12,200 13,600 543,000 819,100
Crops 8,300 33,200 176,600 305,100 50,400 39,300
Agri-environment 4,700 5,000 7,800 5,600 4,200 2,100
Other 3,900 7,400 21,219 23,600 7,416 8,100
Variable costs 32,079 281,784 106,500 155,193 436,176 560,819
Livestock specific costs 19,800 206,800 6,600 7,300 391,600 525,300
Crop specific costs 6,700 37,700 82,900 117,500 21,800 18,500
Contract costs 4,600 29,500 14,200 17,800 19,000 13,700
Casual labour 800 7,500 1,800 11,400 3,700 3,300
Sundry costs 179 284 1,000 1,193 76 19
Gross margin 32,921 192,616 111,319 192,707 168,840 307,781
Fixed Costs 38,831 193,025 128,476 205,431 201,517 291,284
Labour 3,217 42,633 16,600 47,500 66,900 76,600
Power and machinery 14,217 59,217 48,300 67,231 52,717 63,508
Overheads 21,397 91,175 63,576 90,700 81,900 151,176
Farm Business Income incl BPS and diversifivation surplus 9,690 28,091 28,443 35,076 -13,377 73,697
Farm Business Income excl BPS and diversifivation surplus -5,910 -409 -17,157 -12,724 -32,677 16,497
BPS 11,700 23,400 32,400 31,100 12,400 7,600
Diversification surplus 3,900 5,100 13,200 16,700 6,900 49,600
Farm Business Income per ha 111 170 131 162 -157 1,249
Number of farms in a sample 133 123 183 79 35 41
Average farm size (ha) 87 165 217 216 85 59
15 July 2021
Global ESG 27
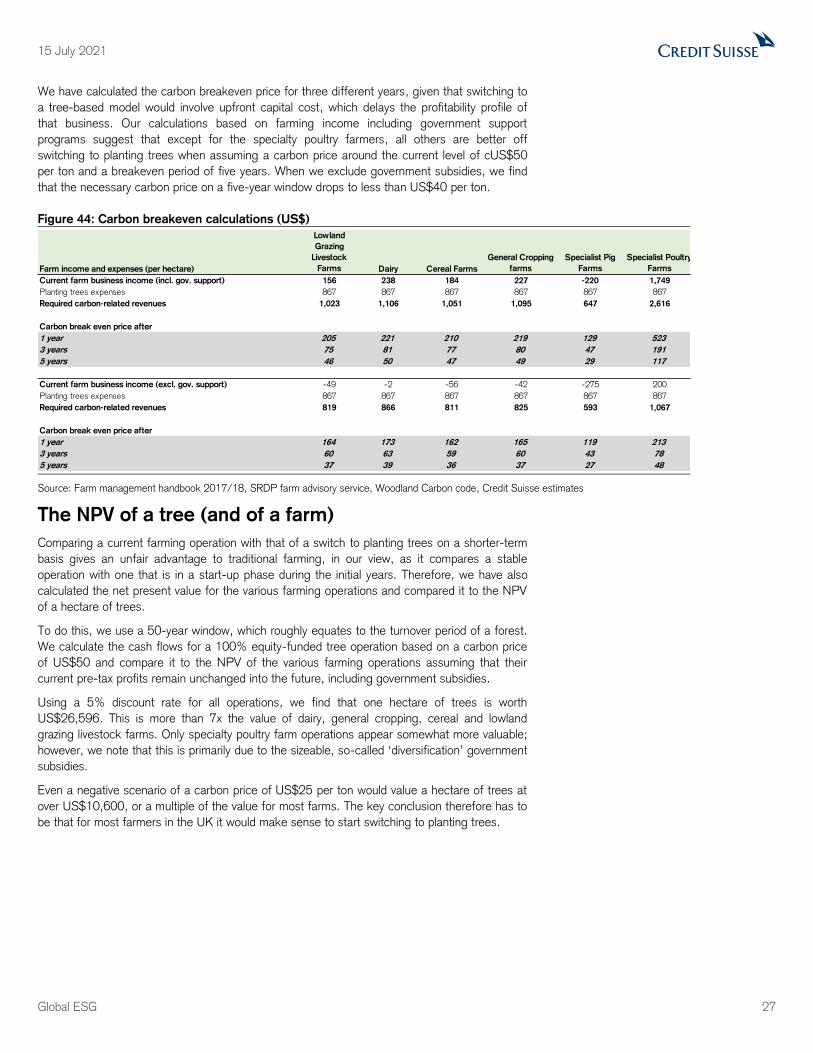
We have calculated the carbon breakeven price for three different years, given that switching to
a tree-based model would involve upfront capital cost, which delays the profitability profile of
that business. Our calculations based on farming income including government support
programs suggest that except for the specialty poultry farmers, all others are better off
switching to planting trees when assuming a carbon price around the current level of cUS$50
per ton and a breakeven period of five years. When we exclude government subsidies, we find
that the necessary carbon price on a five-year window drops to less than US$40 per ton.
Figure 44: Carbon breakeven calculations (US$)
Source: Farm management handbook 2017/18, SRDP farm advisory service, Woodland Carbon code, Credit Suisse estimates
The NPV of a tree (and of a farm)
Comparing a current farming operation with that of a switch to planting trees on a shorter-term
basis gives an unfair advantage to traditional farming, in our view, as it compares a stable
operation with one that is in a start-up phase during the initial years. Therefore, we have also
calculated the net present value for the various farming operations and compared it to the NPV
of a hectare of trees.
To do this, we use a 50-year window, which roughly equates to the turnover period of a forest.
We calculate the cash flows for a 100% equity-funded tree operation based on a carbon price
of US$50 and compare it to the NPV of the various farming operations assuming that their
current pre-tax profits remain unchanged into the future, including government subsidies.
Using a 5% discount rate for all operations, we find that one hectare of trees is worth
US$26,596. This is more than 7x the value of dairy, general cropping, cereal and lowland
grazing livestock farms. Only specialty poultry farm operations appear somewhat more valuable;
however, we note that this is primarily due to the sizeable, so-called ‘diversification’ government
subsidies.
Even a negative scenario of a carbon price of US$25 per ton would value a hectare of trees at
over US$10,600, or a multiple of the value for most farms. The key conclusion therefore has to
be that for most farmers in the UK it would make sense to start switching to planting trees.
Farm income and expenses (per hectare)
Lowland
Grazing
Livestock
Farms Dairy Cereal Farms
General Cropping
farms
Specialist Pig
Farms
Specialist Poultry
Farms
Current farm business income (incl. gov. support) 156 238 184 227 -220 1,749
Planting trees expenses 867 867 867 867 867 867
Required carbon-related revenues 1,023 1,106 1,051 1,095 647 2,616
Carbon break even price after
1 year 205 221 210 219 129 523
3 years 75 81 77 80 47 191
5 years 46 50 47 49 29 117
Current farm business income (excl. gov. support) -49 -2 -56 -42 -275 200
Planting trees expenses 867 867 867 867 867 867
Required carbon-related revenues 819 866 811 825 593 1,067
Carbon break even price after
1 year 164 173 162 165 119 213
3 years 60 63 59 60 43 78
5 years 37 39 36 37 27 48

15 July 2021
Global ESG 28
Figure 45: The NPV of one hectare of trees and different farms (US$)
Source: Credit Suisse estimates
What about farming elsewhere?
Our ROE and NPV calculations were based on data for the UK and suggest that there is a
convincing case for farmers to switch from traditional agriculture to planting trees. It is clearly
possible that the financial conditions elsewhere may be very different, which could result in
different conclusions. With that in mind, we provide in the table below an overview of revenues
per hectare for a range of farming activities in different countries. For each of these, we then
calculate the breakeven period using a US$50 carbon price in order for carbon sequestered
revenue to be equal to that of traditional farming activities.
Data for European farmers (excluding the UK) suggest that revenues, including government
support, ranges from US$1,164 per hectare to almost US$4,000 per hectare in the case of
dairy farmers. Using a carbon price of US$50 would imply that dairy farmers, on revenue alone,
are unlikely to switch to planting trees as carbon credits per hectare of planted trees are only
ever going to reach US$2,200 per hectare. The breakeven period for the other activities is
between six and seven years.
US farming activities generate revenues of between US$179 and US$600 per hectare. Figure
47 suggests that farmers in the US should definitely consider switching to planting trees if they
can secure carbon credits at US$50 per ton of stored carbon on forested land. Revenues from
managing trees would be higher than current activities within three years. We have used data
for Indonesia as indication for farming activities in emerging countries. On average, the
conclusion appears to be similar to that for US farmers. With a relatively short revenue-based
breakeven period, farmers in Indonesia may want to switch to planting trees.
-10,000 -5,000 0 5,000 10,000 15,000 20,000 25,000 30,000 35,000
Specialist Pig Farms
Lowland Grazing Livestock Farms
Cereal Farms
General Cropping farms
Dairy
Tree @ US$25 carbon
Tree @ US$50 carbon
Specialist Poultry Farms
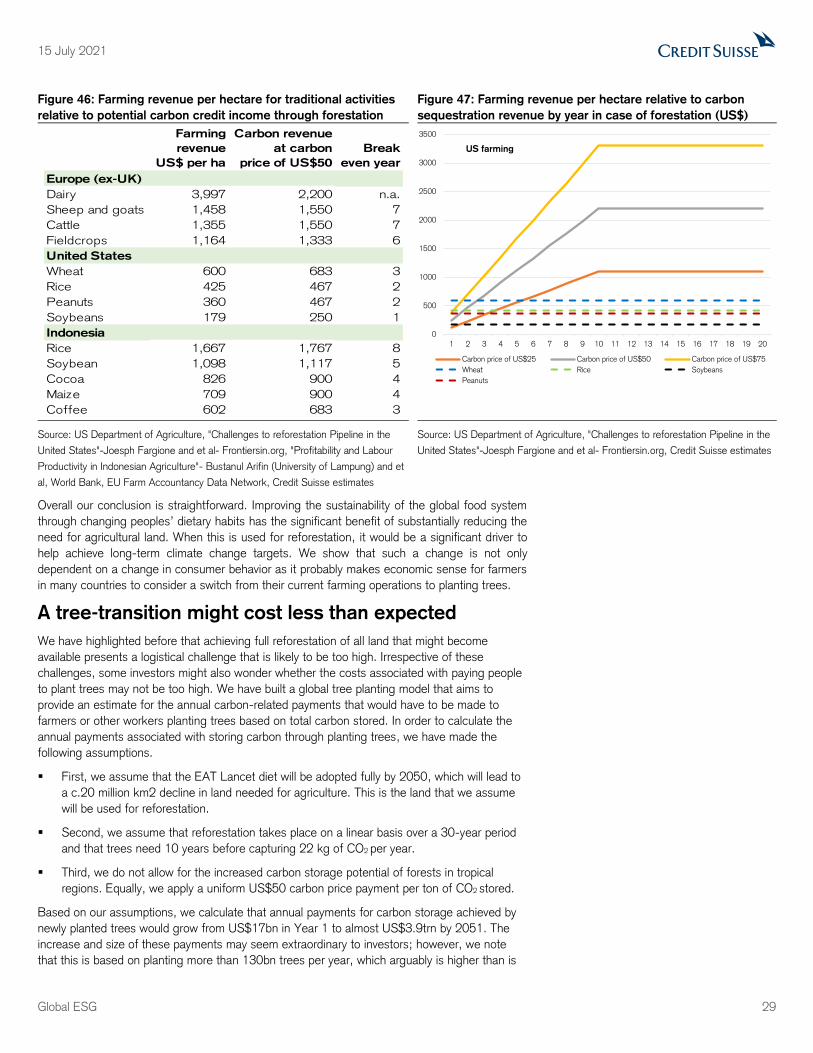
15 July 2021
Global ESG 29
Figure 46: Farming revenue per hectare for traditional activities
relative to potential carbon credit income through forestation
Figure 47: Farming revenue per hectare relative to carbon
sequestration revenue by year in case of forestation (US$)
Source: US Department of Agriculture, "Challenges to reforestation Pipeline in the
United States"-Joesph Fargione and et al- Frontiersin.org, "Profitability and Labour
Productivity in Indonesian Agriculture"- Bustanul Arifin (University of Lampung) and et
al, World Bank, EU Farm Accountancy Data Network, Credit Suisse estimates
Source: US Department of Agriculture, "Challenges to reforestation Pipeline in the
United States"-Joesph Fargione and et al- Frontiersin.org, Credit Suisse estimates
Overall our conclusion is straightforward. Improving the sustainability of the global food system
through changing peoples’ dietary habits has the significant benefit of substantially reducing the
need for agricultural land. When this is used for reforestation, it would be a significant driver to
help achieve long-term climate change targets. We show that such a change is not only
dependent on a change in consumer behavior as it probably makes economic sense for farmers
in many countries to consider a switch from their current farming operations to planting trees.
A tree-transition might cost less than expected
We have highlighted before that achieving full reforestation of all land that might become
available presents a logistical challenge that is likely to be too high. Irrespective of these
challenges, some investors might also wonder whether the costs associated with paying people
to plant trees may not be too high. We have built a global tree planting model that aims to
provide an estimate for the annual carbon-related payments that would have to be made to
farmers or other workers planting trees based on total carbon stored. In order to calculate the
annual payments associated with storing carbon through planting trees, we have made the
following assumptions.
First, we assume that the EAT Lancet diet will be adopted fully by 2050, which will lead to
a c.20 million km2 decline in land needed for agriculture. This is the land that we assume
will be used for reforestation.
Second, we assume that reforestation takes place on a linear basis over a 30-year period
and that trees need 10 years before capturing 22 kg of CO2 per year.
Third, we do not allow for the increased carbon storage potential of forests in tropical
regions. Equally, we apply a uniform US$50 carbon price payment per ton of CO2 stored.
Based on our assumptions, we calculate that annual payments for carbon storage achieved by
newly planted trees would grow from US$17bn in Year 1 to almost US$3.9trn by 2051. The
increase and size of these payments may seem extraordinary to investors; however, we note
that this is based on planting more than 130bn trees per year, which arguably is higher than is
Farming
revenue
US$ per ha
Carbon revenue
at carbon
price of US$50
Break
even year
Europe (ex-UK)
Dairy 3,997 2,200 n.a.
Sheep and goats 1,458 1,550 7
Cattle 1,355 1,550 7
Fieldcrops 1,164 1,333 6
United States
Wheat 600 683 3
Rice 425 467 2
Peanuts 360 467 2
Soybeans 179 250 1
Indonesia
Rice 1,667 1,767 8
Soybean 1,098 1,117 5
Cocoa 826 900 4
Maize 709 900 4
Coffee 602 683 3
0
500
1000
1500
2000
2500
3000
3500
1 2 3 4 5 6 7 8 9 10 11 12 13 14 15 16 17 18 19 20
US farming
Carbon price of US$25 Carbon price of US$50 Carbon price of US$75
Wheat Rice Soybeans
Peanuts
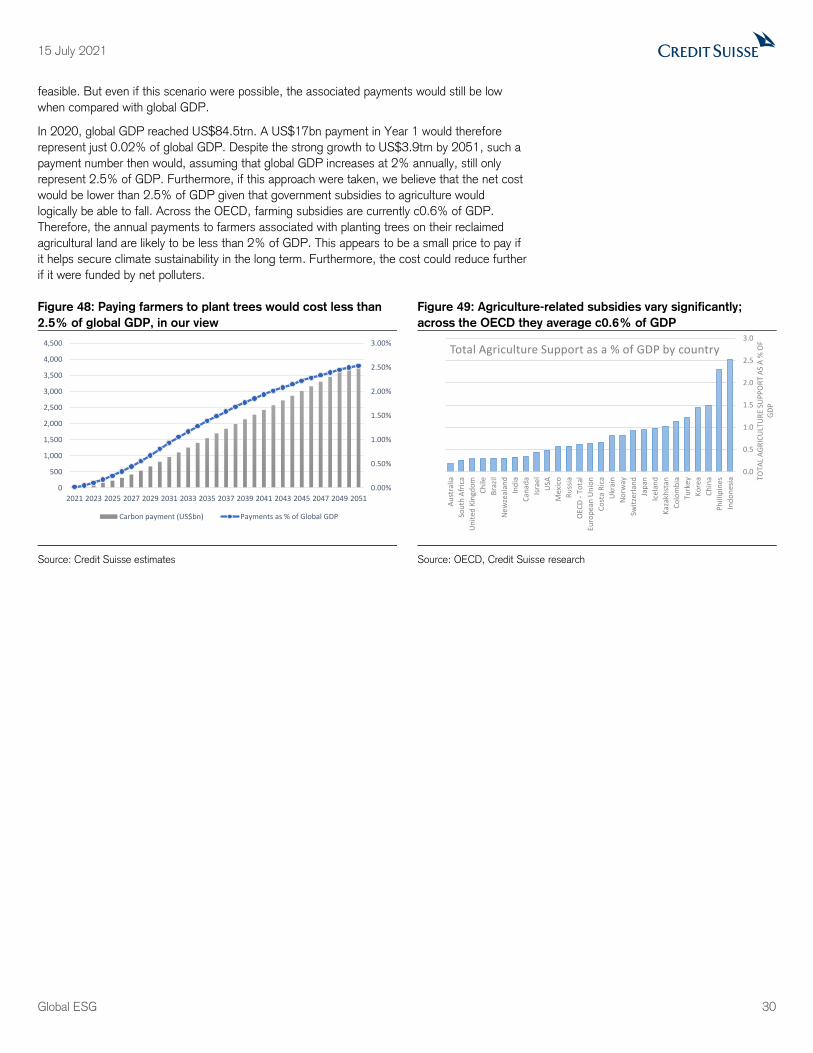
15 July 2021
Global ESG 30
feasible. But even if this scenario were possible, the associated payments would still be low
when compared with global GDP.
In 2020, global GDP reached US$84.5trn. A US$17bn payment in Year 1 would therefore
represent just 0.02% of global GDP. Despite the strong growth to US$3.9trn by 2051, such a
payment number then would, assuming that global GDP increases at 2% annually, still only
represent 2.5% of GDP. Furthermore, if this approach were taken, we believe that the net cost
would be lower than 2.5% of GDP given that government subsidies to agriculture would
logically be able to fall. Across the OECD, farming subsidies are currently c0.6% of GDP.
Therefore, the annual payments to farmers associated with planting trees on their reclaimed
agricultural land are likely to be less than 2% of GDP. This appears to be a small price to pay if
it helps secure climate sustainability in the long term. Furthermore, the cost could reduce further
if it were funded by net polluters.
Figure 48: Paying farmers to plant trees would cost less than
2.5% of global GDP, in our view
Figure 49: Agriculture-related subsidies vary significantly;
across the OECD they average c0.6% of GDP
Source: Credit Suisse estimates Source: OECD, Credit Suisse research
0.00%
0.50%
1.00%
1.50%
2.00%
2.50%
3.00%
0
500
1,000
1,500
2,000
2,500
3,000
3,500
4,000
4,500
2021 2023 2025 2027 2029 2031 2033 2035 2037 2039 2041 2043 2045 2047 2049 2051
Carbon payment (US$bn) Payments as % of Global GDP
0.0
0.5
1.0
1.5
2.0
2.5
3.0
Ind
on
esia
Ph
illip
ines
Ch
ina
Ko
rea
Turk
ey
Co
lom
bia
Kaz
akh
stan
Icel
and
Jap
an
Swit
zerl
and
No
rway
Ukr
ain
Co
sta
Ric
a
Euro
pe
an U
nio
n
OEC
D -
To
tal
Ru
ssia
Mex
ico
USA
Isra
el
Can
ada
Ind
ia
Ne
wze
alan
d
Bra
zil
Ch
ile
Un
ited
Kin
gdo
m
Sou
th A
fric
a
Au
stra
lia
TOTA
L A
GR
ICU
LTU
RE
SUP
PO
RT
AS
A %
OF
GD
P
Total Agriculture Support as a % of GDP by country
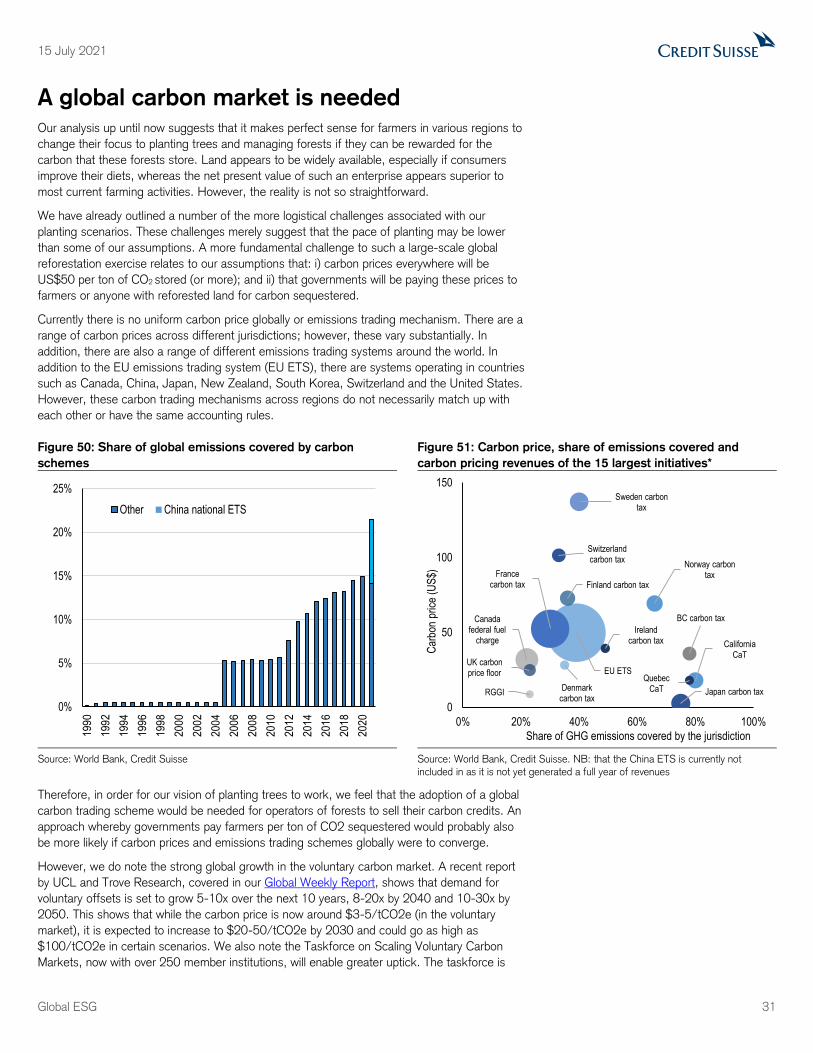
15 July 2021
Global ESG 31
A global carbon market is needed
Our analysis up until now suggests that it makes perfect sense for farmers in various regions to
change their focus to planting trees and managing forests if they can be rewarded for the
carbon that these forests store. Land appears to be widely available, especially if consumers
improve their diets, whereas the net present value of such an enterprise appears superior to
most current farming activities. However, the reality is not so straightforward.
We have already outlined a number of the more logistical challenges associated with our
planting scenarios. These challenges merely suggest that the pace of planting may be lower
than some of our assumptions. A more fundamental challenge to such a large-scale global
reforestation exercise relates to our assumptions that: i) carbon prices everywhere will be
US$50 per ton of CO2 stored (or more); and ii) that governments will be paying these prices to
farmers or anyone with reforested land for carbon sequestered.
Currently there is no uniform carbon price globally or emissions trading mechanism. There are a
range of carbon prices across different jurisdictions; however, these vary substantially. In
addition, there are also a range of different emissions trading systems around the world. In
addition to the EU emissions trading system (EU ETS), there are systems operating in countries
such as Canada, China, Japan, New Zealand, South Korea, Switzerland and the United States.
However, these carbon trading mechanisms across regions do not necessarily match up with
each other or have the same accounting rules.
Figure 50: Share of global emissions covered by carbon
schemes
Figure 51: Carbon price, share of emissions covered and
carbon pricing revenues of the 15 largest initiatives*
Source: World Bank, Credit Suisse Source: World Bank, Credit Suisse. NB: that the China ETS is currently not included in as it is not yet generated a full year of revenues
Therefore, in order for our vision of planting trees to work, we feel that the adoption of a global
carbon trading scheme would be needed for operators of forests to sell their carbon credits. An
approach whereby governments pay farmers per ton of CO2 sequestered would probably also
be more likely if carbon prices and emissions trading schemes globally were to converge.
However, we do note the strong global growth in the voluntary carbon market. A recent report
by UCL and Trove Research, covered in our Global Weekly Report, shows that demand for
voluntary offsets is set to grow 5-10x over the next 10 years, 8-20x by 2040 and 10-30x by
2050. This shows that while the carbon price is now around $3-5/tCO2e (in the voluntary
market), it is expected to increase to $20-50/tCO2e by 2030 and could go as high as
$100/tCO2e in certain scenarios. We also note the Taskforce on Scaling Voluntary Carbon
Markets, now with over 250 member institutions, will enable greater uptick. The taskforce is
0%
5%
10%
15%
20%
25%
199
0
199
2
199
4
199
6
199
8
200
0
200
2
200
4
200
6
200
8
201
0
201
2
201
4
201
6
201
8
202
0
Other China national ETS
EU ETS
France carbon tax
Canada federal fuel
charge
Japan carbon tax
Sweden carbon tax
California CaT
Finland carbon tax
Norway carbon tax
BC carbon tax
Switzerland carbon tax
UK carbon price floor
Ireland carbon tax
Denmark carbon tax
Quebec CaTRGGI
0
50
100
150
0% 20% 40% 60% 80% 100%
Car
bon
pric
e (U
S$)
Share of GHG emissions covered by the jurisdiction

15 July 2021
Global ESG 32
working to establish the infrastructure for a scaled and high-integrity voluntary market for the
trading and exchange of carbon credits.
Notwithstanding these potential market development hurdles, the steps taken by the EU and
US to set-up a Carbon Border Adjustment Mechanism will in effect set a global carbon price for
all exporters, so we see this as the first step in the creation of a global carbon price mechanism,
whether formally or informally through the voluntary market. Modelling by the IPCC to estimate
the necessary carbon prices to reach Net Zero are even starker. According to both the IPCC
and IEA, between now and 2030, carbon prices under a 1.5 scenario could rise to a minimum
of US$100, and could reach over $200 by 2050.
Figure 52: IPCC range of carbon prices Figure 53: Key average carbon prices
Source: IPCC, Credit Suisse research Source: IEA, World Bank IPCC, Credit Suisse research
In conclusion we would argue that governments should draw up plans that reward farmers for
planting trees and storing carbon. This requires the implementation of more unified carbon
trading schemes or carbon price-based subsidy schemes for farmers, something that we think
is not impossible. Not only would this make farming a more profitable activity but it would also
help achieve longer term climate change targets. In order to achieve this we also argue that
much greater focus needs to be placed on persuading consumers to shift dietary habits towards
plant-based food consumption. This not only helps to address overweight and obesity,
something that we argued in our recent report on the global food system, but importantly it will
naturally free up land that can be used by farmers for reforestation. Planting trees is clearly a
TREEmendous opportunity.
$-
$200
$400
$600
$800
$1,000
2010 2020 2030 2040 2050
Above 3
Below 3
Below 2.5
Below 2
Below 1.5
$-
$200
$400
$600
$800
$1,000
2020 2030 2040 2050
IEA - advanced economies
IEA - select developing economies
IEA - developing economies
World Bank - High Case
World Bank - Low Case
IPCC - Average Below 2
IPCC - Average Below 1.5

15 July 2021
Global ESG 33
While this post has been prepared by the Securities Research business of Credit Suisse AG, its subsidiary or affiliate (“CS”) and may contain references to Securities Research reports and/or Securities Research analysts, it is for information only and does not constitute research by CS. Furthermore, this post is not to be regarded as a sales prospectus or an offer or solicitation of an offer to enter in any investment activity. This post does not take into account your specific investment objectives and needs nor your financial situation. No representation or warranty, either expressed or implied is provided in relation to the accuracy, completeness or reliability of the information contained herein, nor is it intended to be a complete statement or summary of the developments referred to in this post and any liability therefore (including in respect of direct, indirect or consequential loss or damage) is expressly disclaimed. The information and any opinions expressed in this post are subject to change without notice and may differ or be contrary to opinions expressed by other business areas or groups of CS as a result of using different assumptions and criteria. CS is not providing any financial, economic, legal, accounting, or tax advice or recommendations in this post. In addition, the receipt of this post alone by you is not to be taken to constitute you as a client of any CS entity. CS is under no obligation to update or keep current the information contained in this material. Please consult with your client advisor before taking any investment decision.
This material is issued and distributed in the United States by CSSU, a member of NYSE, FINRA, SIPC and the NFA, which accepts responsibility for its content. Clients should execute transactions through a Credit Suisse entity in their home jurisdiction unless governing law permits otherwise.
Recommended