GRANT THORNTON INTERNATIONAL BUSINESS REPORT
Global economy in 2013: uncertainty weighing on growth

Contents
01 Foreword
02 The past 12 months
04 The year ahead
06 Business confidence
08 Business operations
13 Investment
15 Inflation
18 Employment
22 Access to finance
24 Topical issues
32 Methodology & IBR participants
Grant Thornton IBR 1
Foreword
ED NUSBAUM CHIEF EXECUTIVE OFFICERGRANT THORNTON INTERNATIONAL LTD
economy has slipped back intorecession.
Emerging economies are growingfaster, but challenges remain. InChina, the new leadership isexpected to focus on avoiding themiddle income trap which will meansacrificing faster for more sustainablegrowth. Reforms to open up theIndian economy to foreign directinvestment have met with stiffresistance and the high inflation ratepersists. Signs of reform in Russia aretepid and the government budgetremains highly reliant on the price ofoil and gas. Brazil has barely grownover the past 24 months, althoughinterest and unemployment rateshave dropped to record lows. Thenew administration in Mexico hastargeted higher growth and greatersecurity. Maritime disputes arethreatening to upset relations inSoutheast Asia, whilst the legacy ofthe Arab Spring is still reverberatingacross the Middle East and NorthAfrica.
We have seen significant politicalchange over the course of 2012, withpresidential elections taking place insome of the largest economies in theworld such as China, Egypt, France,Mexico, Russia and the United States.These leaders and their peers acrossthe globe face a number of keychallenges in the face of continuingeconomic uncertainty. Uncertaintycontinues to hamper business growthprospects.
Agreement on a series of tax rises in the United States pulled theeconomy back from the brink of the‘fiscal cliff’, but tough negotiations onthe debt ceiling and spending cutsremain. Deliberations also continue inthe eurozone with the sovereign debtcrisis still far from resolved and splitsdeveloping between northern andsouthern states, and between thosewithin and outside the single currency.Political deadlock and another roundof elections in Japan is not helpingrecovery from the devastating tsunamiand earthquake in 2011, and the
With uncertainty prevailing, reasonmight well tell business leaders to buildcash levels and wait for a sustainedrecovery before investing. However wealso encourage our clients to listen totheir instinct: with interest rates low andtalent plentiful in mature economies, thisis the perfect time to invest in both theirpeople and their operations. Investingnow could help them to get ahead of thecompetition when the global economyis on a surer footing. Meanwhile,business leaders in emerging economiesshould consider their internationalexpansion strategy – picking updistressed assets at low cost in matureeconomies could offer technology andskills transfers, allowing them to moveonto a higher growth plain by offeringhigher value-add products and services.
Conditions are tough, but byapplying both reason and instinct totheir decision making, dynamicbusinesses can navigate through thesestrong economic headwinds in 2013.The growth prospects of those thatdo, look very healthy indeed.
2010
2 Grant Thornton IBR
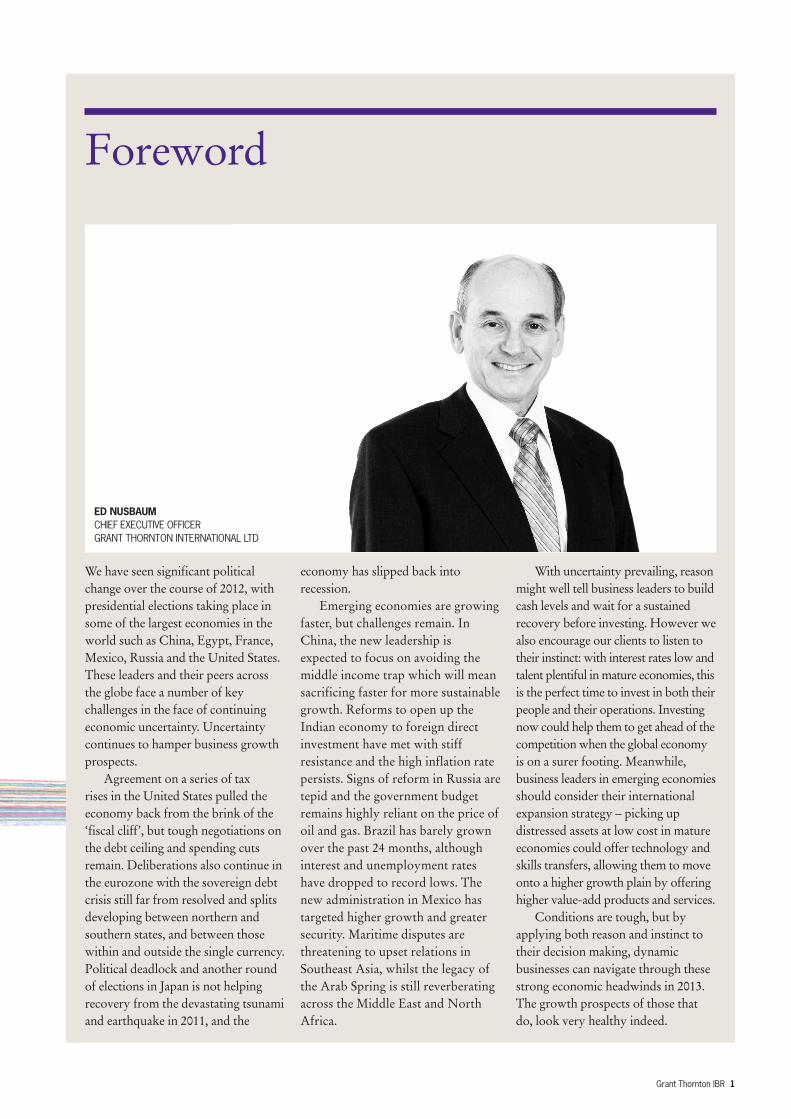
The past 12 months
Businessconfidence ona knife edgeheading into20123
Jan20
12
Single currency receives welcome boostfrom eurozonebusiness leaders 7
Feb20
12
Businessesincreasinglylooking tooverseas M&A in hunt for growth 9
May
2012
8 Mar
2012
Women in seniormanagement onthe rise in Europeas peers inemerging marketsfall away 16
May
2012
High price of oildriving businessconsideration ofalternative fuelvehicles
Improvingbusiness optimismin matureeconomies offershope for globalrecovery 2
Apr20
12
EU places furthersanctions ontrade with Iran
23 Jan
2012
Elizabeth IIcelebrates 60 years ashead of the UK and theCommonwealth
2 Feb20
12
2 Mar
2012
21 Feb
2012
Aung San SuuKyi elected toParliament asMyanmaropens up tooutside world
31 Mar
2012
Facebook IPO is hitby technical problemsand stock loses 25%over next six months
18 May
2012
5 May
2012
Mohamed Morsiof the MuslimBrotherhoodelected Presidentof Egypt24 Jun
2012
Kim Yong Kimchosen asPresident ofWorld Bank
16 Apr
2012
5 Mar
2011 Vladimir Putin
elected for athird presidentialterm
0%
30 Jan
2012
19%
World events
IBR releases
Eurozone financeministers reachagreement onsecond Greek bailout worth €130-billion
25 of the 27 members of the European Union(excluding UK, CzechRepublic) sign a new “fiscal compact”
The SocialistFrancois Hollandewins the FrenchPresidentialelection andpromises a 75% top rate of income tax 9
Jun20
12 Spain requests loanof up to €100bnfrom EuropeanFinancial StabilityFacility to recapitaliseits banks
Slowdown inworkplace stress, as businesses adjustto more realisticperformance goals

2011
Grant Thornton IBR 3
Glimmer of hope forglobal economy asbusiness investmentpicks up3
Jul2
012
Strong supportfor greatershareholderinvolvement insetting CEOcompensation8
Aug20
12
Support for fiscal measuresgrows amongst businessesas confidence andinvestment drop sharply23
Oct
2012
Red tape threatens toobstruct globalisationopportunities fordynamic companies10
Dec
2012
26 Ju1
2012
23 Nov
2012
6 Nov
2012 EU business survey
reveals majoritysupport for a morediverse audit market
Spain win the2012 Europeanfootballchampionships1
Jul2
012
2012Olympic andParalympicGamesopens inLondon
27 Jul
2012
19 Sep
2012
BAE-EADS mergercancelled with German,French and UKgovernments unable to reach agreement on ownership
10 Oct
2012
6 Nov
2012Apple
launchesthe iPhone5
15 Nov
2012 18th Party
Congress endswith President-electXi Jingping raisedto GeneralSecretary andCommander-in-Chief
21 Dec
2012 Korean rap video
‘Gangnam Style’becomes first toreach 1 billion viewson YouTube
23% 8%
2 Jul2
012
Russia joins World TradeOrganisation, 19 yearsafter talks began
22 Aug
2012
Barack Obama reelected asPresident of the UnitedStates and promises to workwith Republicans to pull backfrom the looming ‘fiscal cliff’
2 Jan20
13 AmericanTaxpayer ReliefAct of 2012signed inUnited States
Enrique Pena Nietowins the MexicoPresidential electionpromising greatersecurity and growth
Big sporting eventskey to attractinginvestment, sayemerging economies 3
Sep20
12 Performance ofcleantech sectorshining through bleakeconomic outlook
Four in tenbusinesses globallysee revenue hit byeurozone crisis

4 Grant Thornton IBR
The global economic outlook remains highlyuncertain. The eurozone sovereign debt crisis isperhaps the key challenge, and not just for businessleaders in Europe. The European Union (EU) isChina’s largest trading partner, and China is theEU’s second largest trade partner after the UnitedStates. China remains the world’s largest exporter,but the slowdown in Europe has weighed oneconomic growth.
Growth rates in and around Europe look set to disappoint over the next 12 months. Havingcontracted by 0.4% in 2012, the eurozone isexpected to expand by just 0.2% in 2013. Despitebeing outside of the single currency, the UnitedKingdom is expected to post growth of just 1.1% in 2013, following a forecast contraction of 0.4% in 2012. The emerging economies of central andeastern Europe are expected to grow faster in 2013 (2.6%) but their rates of expansion remaindepressed by a slowdown in foreign directinvestment (FDI) inflows.
Across the Atlantic, economic growth in theUnited States remains weak and unemploymenthigh. Democrats and Republicans eventuallyreached a deal to avert the so-called fiscal cliff, butthis focused only on the tax side of the equation.Tough negotiations on spending cuts and raising thedebt ceiling have been deferred, meaning moreuncertainty for businesses in early 2013. Theeconomy is expected to expand by just 2.1% in2013, marginally ahead of Canada (2.0%). Havingfallen back into recession in the last six months of2012, Japan’s economy is expected to expand byjust 1.2% in 2013.
1 Financial Times (2012) – Peña Nieto sets out reform agenda viahttp://www.ft.com/cms/s/0/46d86a20-3e57-11e2-91cb-00144feabdc0.html
Growth rates in emerging economies look veryhealthy by comparison. China’s growth rate isexpected to pick up to 8.2% in 2013, from 7.8% in2012, even as the new leadership tries to moveeconomic drivers away from exports andinvestment towards consumption. Growth in Indiaslipped to a nine-year low in 2012 as persistent highinflation cut into consumer spending power andpolitical gridlock hampered meaningful economicreforms. However there are signs of change, withthe lower house of Parliament recently voting toallow FDI in the retail sector and growth isexpected to quicken to 6.0% in 2013. With unrest in the Middle East persisting, growth of 3.8% inRussia in 2013 will be underpinned by high oil and gas prices.
Growth prospects in Latin America are alsostrong. The Brazilian economy has endured adifficult past 24 months of little growth, but isforecast to expand by 4.0% in 2013. Mexico, whichbounced back strongly from the recession north ofits border is expected to grow by 3.5% in 2013,following expansion of 3.8% in 2012, although theambitious reform agenda set out by the newadministration could see growth push up towards5% by 2020. The region as a whole is forecast togrow at 3.9%. Forecast growth expansion rates inSoutheast Asia (5.8%) and Sub-Saharan Africa(5.7%) for 2013 are even more impressive, andunderline the continuing development of emergingeconomies.
The year ahead
2.2 2.1
United States
1.9 2.0
Canada

Grant Thornton IBR 5
FIGURE 1: FORECAST ECONOMIC GROWTH RATESPERCENTAGE GROWTH IN GDP AT CONSTANT PRICES
2012 2013
SOURCE: IMF 2012
1.5 4.0
Brazil
3.7 3.8
Russia
2.2 1.2
Japan
3.3 3.0
Australia
4.9 6.0
India
-0.4 1.1
United Kingdom
0.4 0.2
Eurozone
7.8 8.2
China
3.8 3.5
Mexico
2.0 2.6
Central andEastern Europe
4.0 4.1
Commonwealthof IndependentStates
5.4 5.8
ASEAN-5
5.0 5.7
Sub-SaharanAfrica
5.3 3.6
Middle East and North Africa
3.2 3.9
Latin America and the Caribbean
2.2 3.0
New Zealand

Business optimism for the year ahead has fluctuatedwith the strength of the recovery. At the back endof 2011, global confidence was at its lowest pointsince the global crisis began in 2009, and onlyremained neutral (net 0%) due to the strongoptimism of Latin American businesses (net 61%).
Mature economies started to show signs ofimprovement in the first half of 2012 as theEuropean Central Bank (ECB) made some positivestatements about the level of support it wouldprovide for the euro. Global optimism rose to net19% in Q1-2012 and again to net 23% in Q2.However optimism fell to just net 8% in Q3 ashopes for a swift end to the eurozone crisis fadedand commentators started to speculate about theimpact of the United States falling off the ‘fiscalcliff’. In Q4, optimism dipped even lower to justnet 4%.
Business optimism amongst G7 businessesturned negative in Q3 (net -4%), indicating thatmore business leaders were pessimistic than wereoptimistic about the next 12 months. This trendcontinued in Q4 with net -16% optimistic for theyear ahead, below the level seen 12 monthspreviously.
Although businesses in emerging economieshave remained more confident about the prospectsfor their economies over the next 12 months, theytoo have been impacted by the slowdown in theglobal economy. The optimism of businesses in theBRIC economies climbed to net 41% in Q1 andQ2 but then dropped back to net 29% in Q3.However, optimism bounced back to 39% in Q4.
2 Net figures indicate the proportion of businesses indicating optimism (or anincrease) less the proportion indicating pessimism (or a decrease)
Business confidence
FIGURE 2: MID-YEAR OPTIMISM DISSIPATES ACROSS THE GLOBE NET BUSINESS OPTIMISM (NEXT 12 MONTHS)
50
40
30
20
10
0
-10
-20
Q4 2011 Q1 2012 Q2 2012 Q3 2012 Q4 2012BRIC 34 41 41 29 39
G7 -12 16 21 -4 -16
Global 0 19 23 8 4
SOURCE: GRANT THORNTON IBR 2012
6 Grant Thornton IBR
AVERAGE G7 BUSINESS OPTIMISM, 2012
4%AVERAGE BRIC BUSINESS OPTIMISM, 2012
34%
Grant Thornton IBR 7
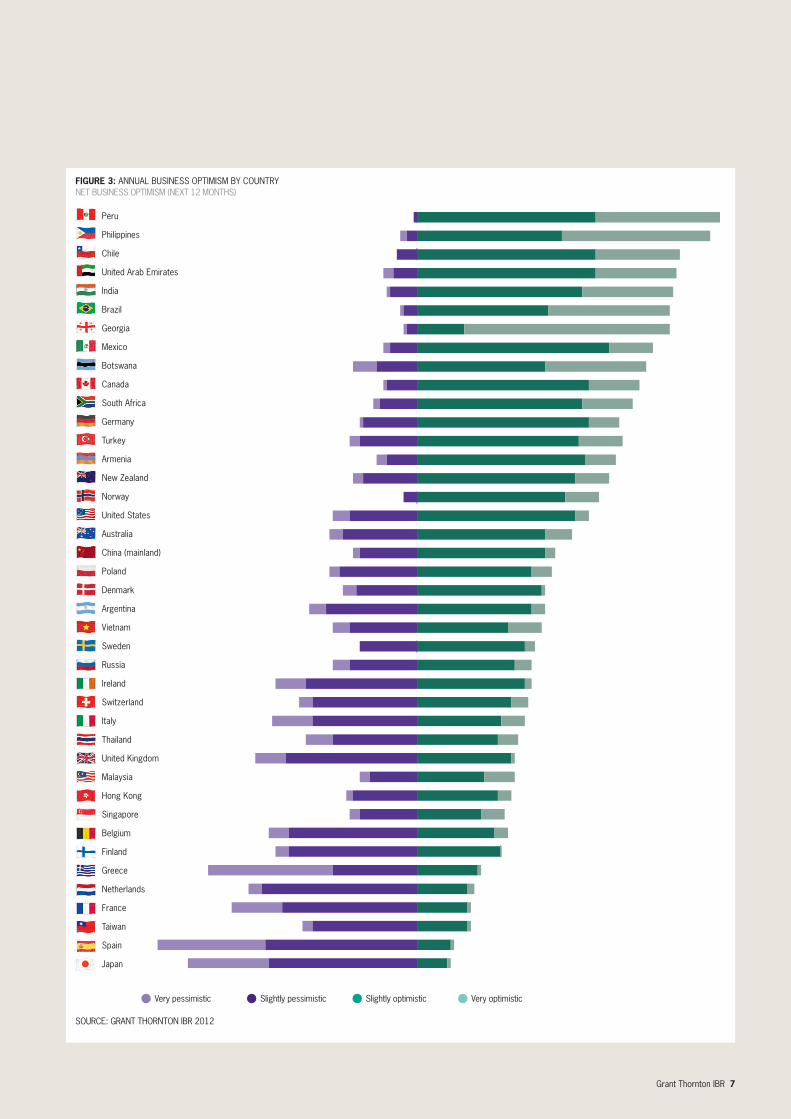
FIGURE 3: ANNUAL BUSINESS OPTIMISM BY COUNTRY NET BUSINESS OPTIMISM (NEXT 12 MONTHS)
Peru
Philippines
Chile
United Arab Emirates
India
Brazil
Georgia
Mexico
Botswana
Canada
South Africa
Germany
Turkey
Armenia
New Zealand
Norway
United States
Australia
China (mainland)
Poland
Denmark
Argentina
Vietnam
Sweden
Russia
Ireland
Switzerland
Italy
Thailand
United Kingdom
Malaysia
Hong Kong
Singapore
Belgium
Finland
Greece
Netherlands
France
Taiwan
Spain
Japan
Very pessimistic Slightly pessimistic Slightly optimistic Very optimistic
SOURCE: GRANT THORNTON IBR 2012

“The uncertainty in the global economy hasdampened business growth prospects not just in mature economies, but across the world.However, the sheer size and internal demand of economies such as Brazil, point to a muchbrighter 2013.”
MADELEINE BLANKENSTEINGRANT THORNTON BRAZIL
8 Grant Thornton IBR
Business growthBusiness leaders’ expectations for the performanceof their own operations have fluctuated along withwider economic expectations, indicating how globaleconomic uncertainty is damaging growthprospects. From Q2-2012 to Q3, global businessexpectations for revenue, profit and export growthall slid by 5 percentage points.
Indeed business leaders showed less confidencein their business growth prospects across 2012,compared with 2011. Global expectations forincreasing revenue and profitability over the next 12 months are both still positive, but remain belowlevels seen before the global financial crisis of2008/9.
The proportion of business leaders expecting toincrease revenues over the next 12 months is downin more than half of the economies we surveycompared with 2011. The most notable decline inrevenue confidence is observed in Hong Kong(down 35 percentage points), followed bySwitzerland (down 30), the Philippines, Italy (bothdown 21), France and Spain (both down 20). Themost optimistic business communities in terms ofgrowing revenues are Vietnam (net 92%), India (net82%), mainland China and Georgia (both at net78%). Expectations are far less buoyant in Europe.Its economies occupy the bottom eight places ofour 44 economies surveyed, although onlybusinesses in Greece are expecting to see revenuesdecline (net -3%) with those in Spain expectingrevenues to be flat.
Business operations
FIGURE 4: PERFORMANCE INDICATORS – REVENUE, PROFITS AND EXPORTSNET PERCENTAGE OF BUSINESSES GLOBALLY EXPECTING AN INCREASE (NEXT 12 MONTHS)
80
70
60
50
40
30
20
10
0
-10
2003 2004 2005 2006 2007 2008 2009 2010 2011 2012Turnover 44 58 63 61 70 63 11 40 50 48
Exports 15 18 18 20 20 18 4 16 19 18
Profitability 31 42 45 46 52 41 -5 29 39 35
SOURCE: GRANT THORNTON IBR 2012
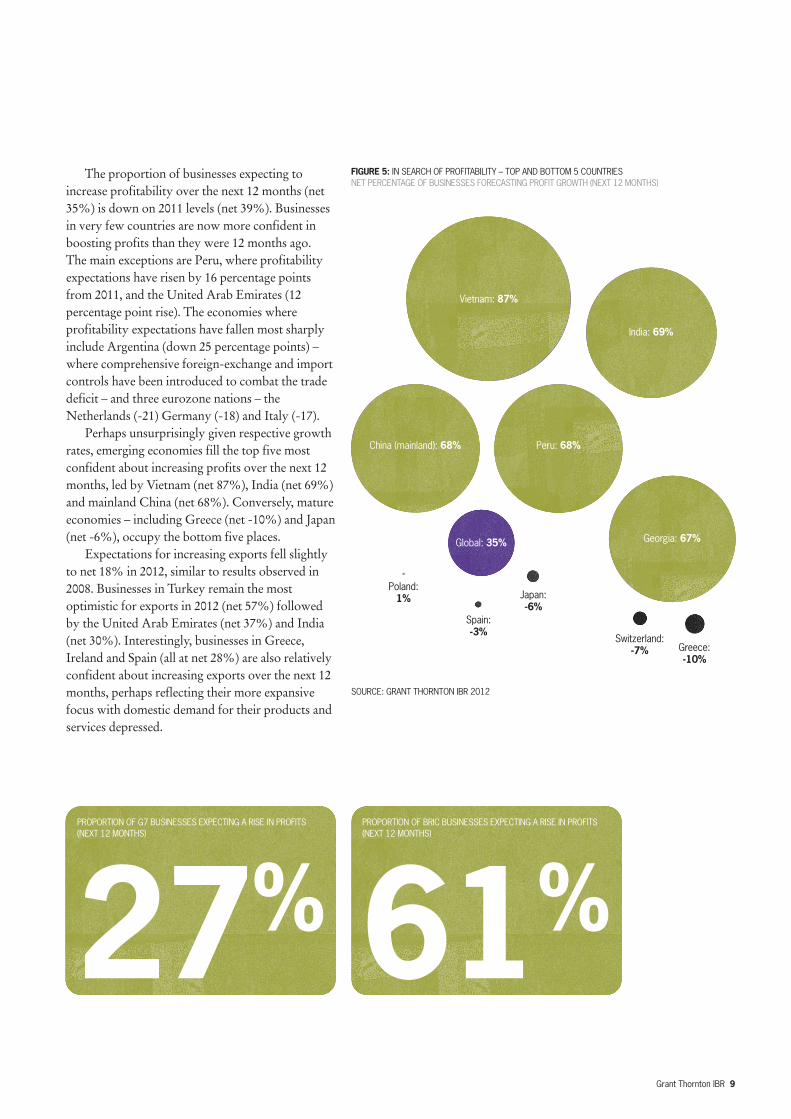
FIGURE 5: IN SEARCH OF PROFITABILITY – TOP AND BOTTOM 5 COUNTRIESNET PERCENTAGE OF BUSINESSES FORECASTING PROFIT GROWTH (NEXT 12 MONTHS)
SOURCE: GRANT THORNTON IBR 2012
Grant Thornton IBR 9
The proportion of businesses expecting toincrease profitability over the next 12 months (net35%) is down on 2011 levels (net 39%). Businessesin very few countries are now more confident inboosting profits than they were 12 months ago. The main exceptions are Peru, where profitabilityexpectations have risen by 16 percentage pointsfrom 2011, and the United Arab Emirates (12percentage point rise). The economies whereprofitability expectations have fallen most sharplyinclude Argentina (down 25 percentage points) –where comprehensive foreign-exchange and importcontrols have been introduced to combat the tradedeficit – and three eurozone nations – theNetherlands (-21) Germany (-18) and Italy (-17).
Perhaps unsurprisingly given respective growthrates, emerging economies fill the top five mostconfident about increasing profits over the next 12months, led by Vietnam (net 87%), India (net 69%)and mainland China (net 68%). Conversely, matureeconomies – including Greece (net -10%) and Japan(net -6%), occupy the bottom five places.
Expectations for increasing exports fell slightlyto net 18% in 2012, similar to results observed in2008. Businesses in Turkey remain the mostoptimistic for exports in 2012 (net 57%) followedby the United Arab Emirates (net 37%) and India(net 30%). Interestingly, businesses in Greece,Ireland and Spain (all at net 28%) are also relativelyconfident about increasing exports over the next 12months, perhaps reflecting their more expansivefocus with domestic demand for their products andservices depressed.
Vietnam: 87%
India: 69%
China (mainland): 68% Peru: 68%
Georgia: 67%Global: 35%
Poland: 1% Japan:
-6%Spain: -3%
Switzerland: -7% Greece:
-10%
PROPORTION OF BRIC BUSINESSES EXPECTING A RISE IN PROFITS(NEXT 12 MONTHS)
61%PROPORTION OF G7 BUSINESSES EXPECTING A RISE IN PROFITS(NEXT 12 MONTHS)
27%

DemandA fall in prospects for profits and revenues comeson the back of more businesses citing a shortage oforders/reduced demand as a constraint in 2012(34%) compared with 2011 (31%). Perhapsunsurprisingly as unemployment persists andgovernments and consumers continue to tightenbelts, it is businesses in troubled Southern Europe –Italy, Greece and Spain – which are suffering mostfrom a lack of demand (49%, compared with 32%in 2011). However, this issue is also cited by 39% of businesses in the emerging and largely export-driven economies of Asia Pacific (excl, Japan),indicating how general economic uncertainty isaffecting businesses globally. Conversely, businessesin North (21%) and Latin America (19%) appearrelatively untroubled by levels of demand.
Businesses in three Asia Pacific economies –Japan (68%), Vietnam (60%) and Thailand (54%) – are most concerned with a lack of demand. Allthree are heavily dependent on exports and thecontraction of European and North Americanmarkets is clearly impacting on business growthprospects. Three Southern European economieswhich are in the eye of the eurozone storm – Italy,Spain (both 50%) and Greece (48%) – are next.That the world’s two largest emerging economies –India (46%) and mainland China (42%) – alsomake the top ten, is a worrying sign for globaleconomic growth.
FIGURE 6: SLOWDOWN IN GLOBAL TRADEPERCENTAGE OF BUSINESSES CITING A SHORTAGE OF ORDERS/REDUCED DEMAND TO CONSTRAINGROWTH (NEXT 12 MONTHS)
* ITALY, GREECE AND SPAINSOURCE: GRANT THORNTON IBR 2012
Southern Europe*: 49% Asia Pacific (excl. Japan): 39%
BRIC: 37%
G7: 33%
Global: 34%
ASEAN: 34%
EU: 33%
North America: 21%
Latin America: 19%
10 Grant Thornton IBR
“Growth in Europe remains tied to the fate ofthe single currency and contracting markets areclearly not good for business. However weremain hopeful of a swift resolution that willhelp both France and the wider continent regainlost competitiveness.”
JEAN-JACQUES PICHON GRANT THORNTON FRANCE
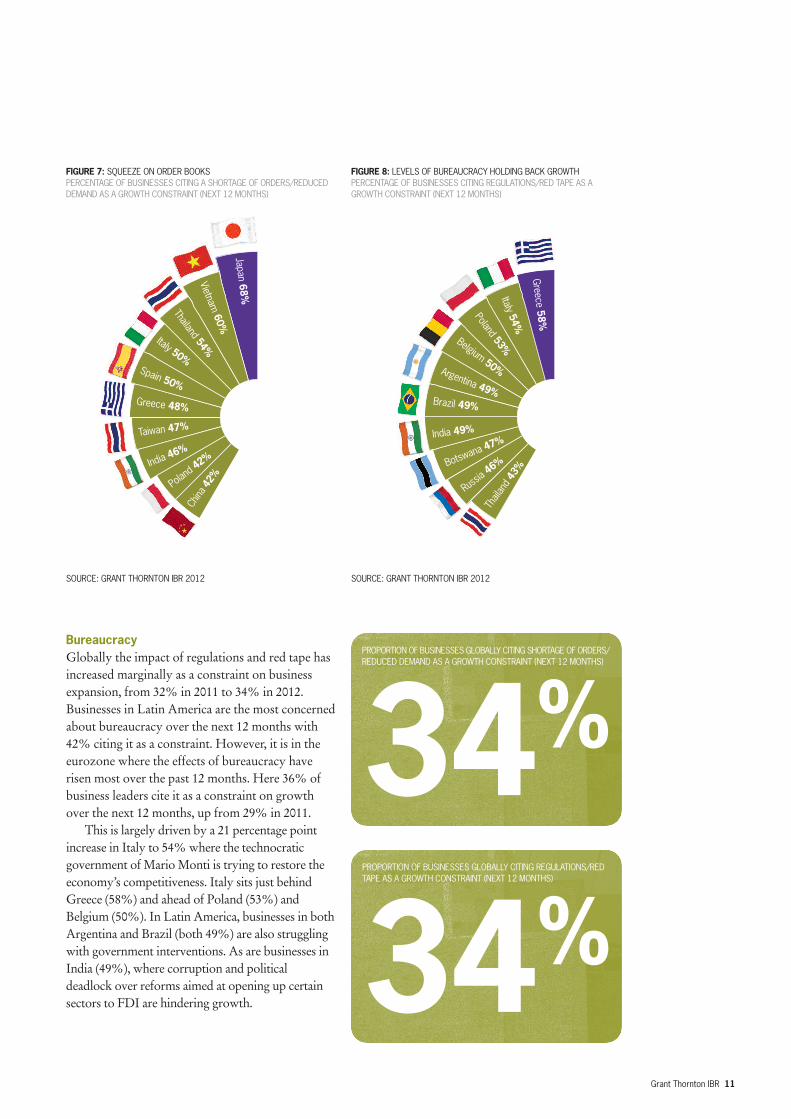
FIGURE 8: LEVELS OF BUREAUCRACY HOLDING BACK GROWTHPERCENTAGE OF BUSINESSES CITING REGULATIONS/RED TAPE AS AGROWTH CONSTRAINT (NEXT 12 MONTHS)
SOURCE: GRANT THORNTON IBR 2012
BureaucracyGlobally the impact of regulations and red tape hasincreased marginally as a constraint on businessexpansion, from 32% in 2011 to 34% in 2012.Businesses in Latin America are the most concernedabout bureaucracy over the next 12 months with42% citing it as a constraint. However, it is in theeurozone where the effects of bureaucracy haverisen most over the past 12 months. Here 36% ofbusiness leaders cite it as a constraint on growthover the next 12 months, up from 29% in 2011.
This is largely driven by a 21 percentage pointincrease in Italy to 54% where the technocraticgovernment of Mario Monti is trying to restore theeconomy’s competitiveness. Italy sits just behindGreece (58%) and ahead of Poland (53%) andBelgium (50%). In Latin America, businesses in bothArgentina and Brazil (both 49%) are also strugglingwith government interventions. As are businesses inIndia (49%), where corruption and politicaldeadlock over reforms aimed at opening up certainsectors to FDI are hindering growth.
Grant Thornton IBR 11
FIGURE 7: SQUEEZE ON ORDER BOOKS PERCENTAGE OF BUSINESSES CITING A SHORTAGE OF ORDERS/REDUCEDDEMAND AS A GROWTH CONSTRAINT (NEXT 12 MONTHS)
SOURCE: GRANT THORNTON IBR 2012
Japan68%
Vietnam60%
Thailand54%
Italy 50%Spain 50%
Greece 48%
Taiwan 47%
India46%
Poland 42%
China42%
Greece
58%
Italy54%
Poland53%
Belgium50%Argentina 49%
Brazil 49%
India 49%
Botswan
a 47%
Russia 46%
Thailand43%
PROPORTION OF BUSINESSES GLOBALLY CITING SHORTAGE OF ORDERS/REDUCED DEMAND AS A GROWTH CONSTRAINT (NEXT 12 MONTHS)
34%PROPORTION OF BUSINESSES GLOBALLY CITING REGULATIONS/REDTAPE AS A GROWTH CONSTRAINT (NEXT 12 MONTHS)
34%

12 Grant Thornton IBR
recovering from the devastating earthquake andtsunami of 2011, complete the bottom leftquadrant.
Businesses in the lower right quadrant areconfident about revenue growth prospects in2013 but less so about orders. They includethose in some of the large, rapidly expandingemerging economies such as mainland China,India, Russia and Turkey which could have animpact for longer term global economic growth.
Meanwhile those in the upper left handquadrant seem to be suffering from increasedcompetition with strong order books nottranslating into higher revenues. This quadrantincludes economies at a variety of maturitylevels – Hong Kong, Finland, the NetherlandsSingapore, Switzerland and the United Kingdom.
Growth prospects for 2013Businesses in the Latin American economies ofBrazil, Peru and Mexico as well as in SouthAfrica appear well placed for growth movinginto 2013 with both strong order books andhigher revenue expectations (the upper rightquadrant). Growth prospects for otheremerging economies such as Georgia,Argentina, Chile and the Philippines also lookfairly healthy. They are joined by businesses inmature economies such as Canada, Germanyand the United States.
By contrast, businesses in the eurozoneeconomies of Belgium, France, Greece, Ireland,Italy and Spain expect another tough year in2013. They are all forecasting low demand andlow revenues. Poland, which is suffering fromthe regional slowdown, and Japan, which is still
FIGURE 9: EXPECTATIONS FOR ORDERS AGAINST REVENUE
Lower revenuesStronger order books
Higher revenuesStronger order books
Lower revenuesWeaker order books
Higher revenuesWeaker order books
SOURCE: GRANT THORNTON IBR 2012
Thailand
Switzerland
Japan
Greece
France
Vietnam
Belgium
Italy
IndiaPoland
Spain
China (mainland)
TurkeyIreland
Netherlands
Hong Kong
Singapore US
GermanyMalaysia
Taiwan
Argentina
Brazil
MexicoSweden South Africa
Philippines
Finland
Canada
Peru
Norway
Russia
AustraliaUK
Botswana
Denmark
Armenia
Chile Georgia
UAE
New Zealand
Global

Grant Thornton IBR 13
Business investmentWith the global economic outlook so uncertain,businesses are disappointingly, but understandably,cautious about investing in the future growth oftheir operations. In fact, business expectations forfuture investment have barely moved over the past12 months. The proportion of businesses expectingto boost investment in new buildings or R&D areunchanged from 2011, and have risen by just onepercentage point for new plant and machinery. Withlarge corporates already sitting on over US$4trillionof cash reserves, the concern is that a huge source ofpotential private sector growth is lying dormant.
Investment sentiment is more buoyant in thehigher growth emerging economies. In LatinAmerica, net 50% of businesses expect to increaseinvestment in plant and machinery over the next 12months, net 35% in R&D and net 28% in newbuildings. Businesses in Asia Pacific (excl. Japan)are equally as bullish with net 45% planning toincrease investment in R&D, net 40% in new plantand machinery and net 19% in new buildings.
3 Hogan Lovells research into total cash on the balance sheets of the world’stop 500 non-financial companies:http://www.hoganlovellsevolution.com/evolution-heatmaps-cash-on-balance-sheet
Almost a third of G7 businesses (net 32%) areplanning to increase investment in plant andmachinery over the next 12 months, and net 17% innew buildings but the divergence in priorities ofemerging and mature economy businesses ishighlighted by R&D plans. Net 44% of BRICbusinesses plan to increase R&D investment overthe next 12 months, compared with just 16% of G7businesses. Interestingly, mainland China leads theR&D charge with net 55% of businesses planningto increase investment in R&D over the next 12months, ahead of its fellow BRICs Brazil and India(both 38%).
Investment
FIGURE 10: 2013 INVESTMENT PLANSPERCENTAGE OF BUSINESSES EXPECTING TO INCREASE INVESTMENT (NEXT 12 MONTHS)
Latin America BRIC APAC (excl. Japan) ASEAN Global North America G7 EU
Plant & machinery 50 44 40 33 35 38 32 26
New building 28 22 19 22 18 22 17 10
R&D 35 44 45 26 23 13 16 18
SOURCE: GRANT THORNTON IBR 2012
NET PROPORTION OF BUSINESSES GLOBALLY PLANNING TOINCREASE INVESTMENT IN R&D (NEXT 12 MONTHS)
23%

Latin American businesses are particularlydissatisfied with the quality of local transportinfrastructure. 26% of businesses in Brazil, whichwill host both the next FIFA World Cup andSummer Olympic Games, cite transportinfrastructure as a growth constraint, up marginallyfrom 25% in 2011. Elsewhere in Latin America,businesses in Mexico (19%) and Chile (18%) alsocite this factor.
14 Grant Thornton IBR
InfrastructureEmerging economies are to some degree playingcatch up with investment as strong existinginfrastructure in mature economies gives theirbusinesses a huge advantage in terms of drivingefficiencies in their operations. More than a fifth ofBRIC businesses cite the poor quality of localtransport (21%) and information andcommunications technology (ICT, 21%)infrastructure as likely growth constraints in 2013.This compares to just 9% and 11% respectively inthe G7 economies.
Businesses in India and Vietnam are particularlyconcerned with the quality of local infrastucture.Around two in five business leaders in eacheconomy cite transport and ICT infrastructure asan impediment to growing their operations over thenext 12 months. In both economies, this representsa large increase from 2011 suggesting connectivityissues are getting worse. Over a third of businessesin Thailand, and over a quarter in Turkey also express dissatisfaction with local infrastructure.
FIGURE 11: POOR CONNECTIVITY CONSTRAINING GROWTH IN EMERGING ECONOMIESPERCENTAGE OF BUSINESSES CITING INFRASTRUCTURE AS A CONSTRAINT ON GROWTH
TRANSPORT INFORMATION AND COMMUNICATIONS TECHNOLOGY
SOURCE: GRANT THORNTON IBR 2012
Vietnam42%
India39%Thailand
36%
Brazil 26%Botswana 22%
Turkey 22%
Mexico 19%
Russia 19
%
Philippines18%
Chile18%
India41%
Vietnam39%
Thailand38%
Turkey 29%Philippines 27%UAE 22%
Taiwan 21%
Botswan
a 21%
Japan20%
Chile19%
PROPORTION OF BRIC BUSINESSES CITING ICT INFRASTRUCTURE ASA CONSTRAINT (NEXT 12 MONTHS)
21%

Grant Thornton IBR 15
PricesInflationary pressures have eased in 2012 comparedto 2011. However if prices rise quicker than salaries,real incomes decline thus reducing spending powerand depriving economies of consumer demand.Inflation is not high on the agenda of most matureeconomy central banks, many of which havelaunched vast quantitative easing programmeswhich pump money into their economies in aneffort to boost growth through raising liquidity.However some higher growth emerging economiessuch as Argentina, Brazil, India, Russia and Turkeyare grappling with much higher inflation rates,although the rate in China has continued to ease.
Business expectations for increasing sellingprices have fallen by three percentage pointsglobally from 2011. Only seven economies –including Peru (up 24 percentage points), UnitedStates and India (both up four) – are more bullishabout increasing selling prices over the next 12months. Globally, net 22% of businesses expect toincrease selling prices over the next 12 months, with businesses in the BRIC economies (net 38%)far more likely to boost prices than peers in the G7 (net 16%).
Some of the biggest drops in selling priceexpectations are apparent in Asia Pacific. Theproportion of businesses in Southeast Asia planningto increase selling prices declined from net 38% in2011 to net 23% in 2012. In mainland China theproportion dropped from net 43% to net 29% and in Hong Kong from net 40% to net 16%.
Inflation
FIGURE 12: PRICE RISES SLOWING NET PERCENTAGE OF BUSINESSES EXPECTING TO RAISE SELLING PRICES (NEXT 12 MONTHS)
50
45
40
35
30
25
20
15
10
5
0
2007 2008 2009 2010 2011 2012BRIC 43 27 21 26 52 38
G7 22 27 9 1 19 16
Global 32 30 14 11 27 22
SOURCE: GRANT THORNTON IBR 2012
PROPORTION OF G7 BUSINESSES PLANNING REAL SALARYINCREASES (NEXT 12 MONTHS)
12%PROPORTION OF BRIC BUSINESSES PLANNING REAL SALARYINCREASES (NEXT 12 MONTHS)
17%

FIGURE 14: PRICE WAR – TOP AND BOTTOM 5 COUNTRIESNET PERCENTAGE OF BUSINESSES EXPECTING TO RAISE SELLING PRICES (NEXT 12 MONTHS)
SOURCE: GRANT THORNTON IBR 2012
(56%), especially in Southern Europe (35%), areleast likely to get a raise.
At the country level, employees in businesses in Sweden (94%), South Africa (93%), Brazil andNorway (both at 90%) look set to benefit fromhigher wages over the next 12 months. Those inGreece (3%), Ireland (17%) and Japan (25%) areunlikely to be as fortunate. In fact, 31% ofbusinesses in Greece and 10% in Spain plan toreduce salaries over the next 12 months, which willfurther squeeze consumer demand.
In terms of real salary increases (those above therate of inflation), businesses in Latin America(25%) are expected to be the most generous, led byPeru and Brazil (both 29%). Thailand tops therankings with 42% of businesses planning to offersuch increases. Conversely just 9% of EUbusinesses expect to offer real salary increases overthe next 12 months, although this rises to 23% inGermany which points towards a rebalancing ofcompetitiveness inside the single currency.
At the country level, businesses in Argentina(67%), India (61%), Botswana (58%), South Africa(51%) and Russia (49%) are most likely to raiseprices over the next 12 months. At the other end ofthe scale, Japan (-32%) – where deflation remains amajor concern despite interest rates being near zero– expect selling prices to fall. Businesses in Greece(-16%), Switzerland (-14%), Spain (-8%) andIreland (-2%) are also looking to reduce prices asEuropean markets continue to contract.
SalariesWith consumer price inflationary pressures apparentlyeasing, the good news for the global economy is thattwo-thirds of businesses (66%) are planning to offerworkers a pay rise at least in line with inflation, wellabove the 2010 level (51%) and up slightly from2011 (64%). Employees in Latin America (86%),the Nordic region (84%), North America (79%)and Southeast Asia (75%) appear the most likely toget a pay rise in 2013. Workers in the eurozone
16 Grant Thornton IBR
FIGURE 13: WHERE TO GO FOR A PAY RISENET PERCENTAGE OF BUSINESSES EXPECTING TO OFFER EMPLOYEES AREAL PAY RISE (NEXT 12 MONTHS)
SOURCE: GRANT THORNTON IBR 2012
Thailand42%Peru
29%
Brazil 29%India 28%Chile 28%
Turkey 26%
South Africa26%
Germany
23%
Australia
22%
NewZealand21%
Argentina: 67%
India: 61%
Botswana: 58%
South Africa: 51%
Russia: 49%
Global:22%
Ireland: -2%
Switzerland: -14%
Spain: -8%
Greece: -16%
Japan: -32%
Grant Thornton IBR 17
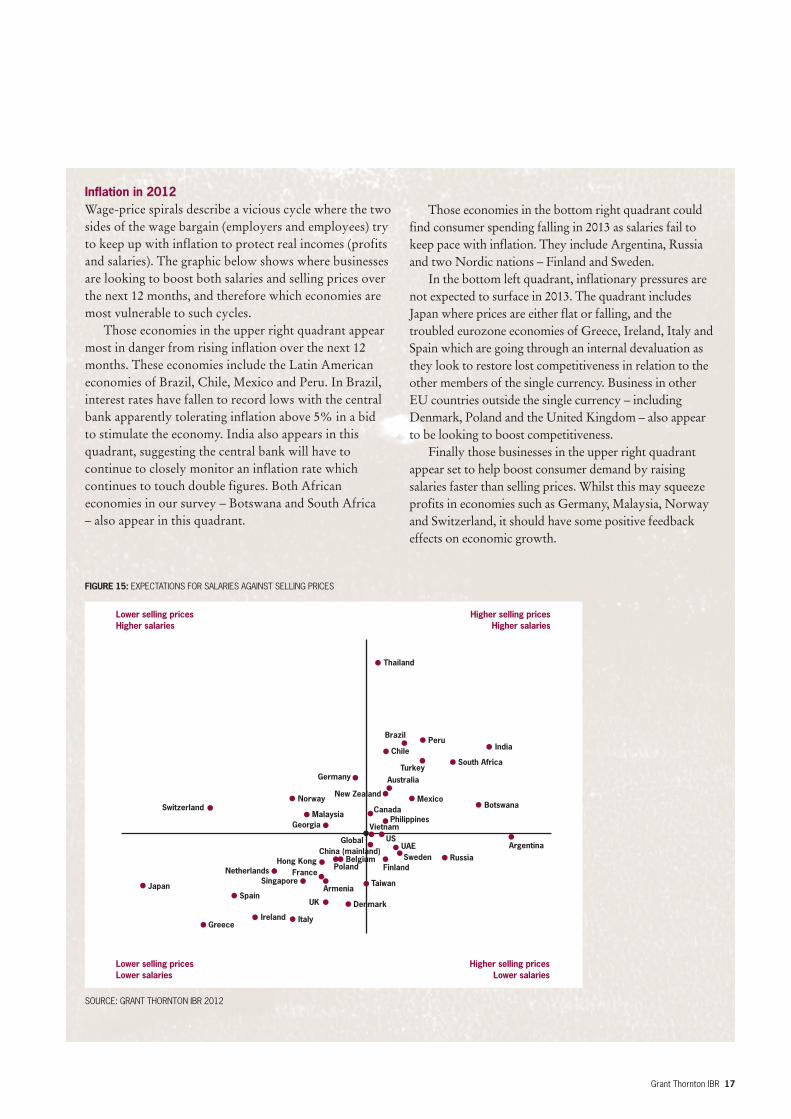
Those economies in the bottom right quadrant couldfind consumer spending falling in 2013 as salaries fail tokeep pace with inflation. They include Argentina, Russiaand two Nordic nations – Finland and Sweden.
In the bottom left quadrant, inflationary pressures arenot expected to surface in 2013. The quadrant includesJapan where prices are either flat or falling, and thetroubled eurozone economies of Greece, Ireland, Italy andSpain which are going through an internal devaluation asthey look to restore lost competitiveness in relation to theother members of the single currency. Business in otherEU countries outside the single currency – includingDenmark, Poland and the United Kingdom – also appearto be looking to boost competitiveness.
Finally those businesses in the upper right quadrantappear set to help boost consumer demand by raisingsalaries faster than selling prices. Whilst this may squeezeprofits in economies such as Germany, Malaysia, Norwayand Switzerland, it should have some positive feedbackeffects on economic growth.
Inflation in 2012 Wage-price spirals describe a vicious cycle where the twosides of the wage bargain (employers and employees) tryto keep up with inflation to protect real incomes (profitsand salaries). The graphic below shows where businessesare looking to boost both salaries and selling prices overthe next 12 months, and therefore which economies aremost vulnerable to such cycles.
Those economies in the upper right quadrant appearmost in danger from rising inflation over the next 12months. These economies include the Latin Americaneconomies of Brazil, Chile, Mexico and Peru. In Brazil,interest rates have fallen to record lows with the centralbank apparently tolerating inflation above 5% in a bid to stimulate the economy. India also appears in thisquadrant, suggesting the central bank will have tocontinue to closely monitor an inflation rate whichcontinues to touch double figures. Both Africaneconomies in our survey – Botswana and South Africa – also appear in this quadrant.
FIGURE 15: EXPECTATIONS FOR SALARIES AGAINST SELLING PRICES
Lower selling pricesHigher salaries
Higher selling pricesHigher salaries
Lower selling pricesLower salaries
Higher selling pricesLower salaries
SOURCE: GRANT THORNTON IBR 2012
Thailand
South Africa
IndiaPeru
Global
TaiwanSingapore
Ireland
Japan
UK
Greece
FranceNetherlands
Italy
Sweden
DenmarkSpain
Hong Kong
Armenia
Finland
China (mainland)
US
TurkeyGermany
MalaysiaSwitzerland
Russia
Australia
Argentina
Vietnam
Botswana
Belgium
Mexico
Philippines
Poland
Georgia
UAE
New ZealandNorway
Chile
Canada
Brazil

18 Grant Thornton IBR
Hiring The public sector in many mature economies has,and in some cases is continuing to, shed workers asgovernments try to tackle huge deficits and levels ofpublic debt. Unfortunately, with the economicclimate so uncertain, job creation in the privatesector has largely been unable to keep up. In Greeceand Spain the unemployment rate now tops 25%.In France and Italy it is close to 11%. In the UnitedKingdom and the United States the proportion ofthe workforce looking for employment remainsstubbornly just below 8%.
Unemployment rates in emerging economiesare generally lower, with Brazil, China, Russia andMexico all around the 5% mark (the exception isIndia where unemployment is running at 9.8%).Businesses in these economies are more concernedwith finding workers with the right skills to helpthem grow their businesses, potentially throughoffering higher value-add products and services.
The stickiness of the labour market globally isevidenced by the IBR figures. Net 26% ofbusinesses hired staff over the past 12 months, a riseof just one percentage point from the previous 12month period. Hiring was strongest in highergrowth emerging economies of Latin America (net38%), the BRIC economies (net 35%) and AsiaPacific (excl. Japan, net 32%), although net 33% ofbusinesses in North America also boostedworkforce numbers over the past 12 months, aseven percentage point increase from 2011.
Hiring has been weakest in Europe – just net16% of EU businesses hired workers over the past12 months, rising to net 40% in Germany whichcontinues to outperform its eurozone partners. TheEU average is dragged down by Greece (net -33%),Spain (net -22%) and Ireland (net -3%) whereworkforces contracted on average in 2012.
Employment
FIGURE 16: HOW EMPLOYMENT EXPECTATIONS TRACK RECORDED CHANGES (2002-2012)NET PERCENTAGE OF BUSINESSES WHO HIRED/PLAN TO HIRE WORKERS (LAST/NEXT 12 MONTHS)
50
40
30
20
10
0
-10
-20
2002 2003 2004 2005 2006 2007 2008 2009 2010 2011 2012Actual 11 8 26 31 44 41 21 -8 25 26 –
Expected – 14 25 34 35 45 33 -4 20 28 27
SOURCE: GRANT THORNTON IBR 2011
PROPORTION OF BUSINESSES GLOBALLY WHICH HIRED WORKERSOVER PAST 12 MONTHS
26%PROPORTION OF BUSINESSES GLOBALLY PLANNING TO HIREWORKERS OVER NEXT 12 MONTHS
27%

Grant Thornton IBR 19
India (net 62%) tops the ranking of economieslooking to expand their workforces in 2013,followed by Georgia (net 59%) and Peru (net58%). At least 50% of businesses in Turkey, Chileand Brazil also plan to hire more workers over thenext 12 months. The highest ranked matureeconomy is the United States (net 34%) in 15thplace, slightly behind mainland China and Mexico(both net 38%).
In yet more evidence of how the sovereign debtcrisis is damaging business and economic growthprospects, the bottom 11 places are taken byEuropean countries. Indeed, the majority ofbusinesses in Greece (net -21%) Spain (net -16%),Ireland (net -5%) and Italy (net -3%), Poland andSwitzerland (both net -1%) plan to lose workers in 2013.
Looking ahead, global economic uncertaintycontinues to depress business hiring plans. Net27% of businesses globally expect to increaseemployment in 2013, down one percentage pointfrom 2011 and below the pre-crisis level of 33%.Higher growth rates in emerging economies areallowing businesses to consider expanding theirworkforces to a much greater extent than peers inmature economies: net 41% of BRIC businesses areplanning to hire more workers over the next 12months, with the Latin America average evenhigher at net 45%, and Asia Pacific (excl. Japan) notfar behind (38%). This compares to just net 24% ofG7 businesses, and just net 5% in the eurozone.The North America average remains fairly buoyantby contrast at net 33%.
FIGURE 17: HIRING PLANS – PAST AND FUTURE NET PERCENTAGE OF BUSINESSES WHO HIRED/PLAN TO HIRE WORKERS (LAST/NEXT 12 MONTHS)
PAST 12 MONTHS NEXT 12 MONTHS
SOURCE: GRANT THORNTON IBR 2012
India62%Peru
52%Turkey 48%Brazil 46%Chile 43%
Georgia 40%
Germany 40%
Canada 3
7%
UAE 3
5%
Botsw
ana 34%
India63%
Georgia59%
Peru 59%Turkey 55%Chile 51%
Brazil 50%
Vietnam 44%
Botswan
a 43%
Armenia 42%
Thailand41%

FIGURE 18: CALLING FOR SKILLED WORKERS PERCENTAGE OF BUSINESSES CITING A LACK OF SKILLED WORKERS AS A CONSTRAINT ON GROWTH (NEXT12 MONTHS)
SOURCE: GRANT THORNTON IBR 2012
20 Grant Thornton IBR
The relative decline over the past 12 months isalso most pronounced in European economies,with 10% fewer businesses in the eurozoneplanning to hire workers in 2013 compared with 12 months previously. Expectations in Belgium,France, Finland, Italy, the Netherlands and Spainhave all declined by at least 10 percentage points.However the biggest falls are observed inSwitzerland (down 23 percentage points),Argentina (down 21) and Vietnam (down 20).
Finding skilled workersWith unemployment rates high, talent is largelyplentiful in mature economies. However a lack of skilled workers is the key issue constrainingbusiness growth in higher growth emergingeconomies.
Nearly two in five businesses (37%) in theBRIC economies believe an inability to get the rightworkers will dampen growth in 2013. Although thisis a slight fall from 2011 (39%), it is well above theG7 business average (24%). Businesses in theemerging economies of Southeast Asia (42%), AsiaPacific (excl. Japan, 36%) and Latin America (35%)are dealing with similar talent shortages.
The rise of this issue has been notable inSoutheast Asia. The proportion of businesses citingtalent scarcity as a constraint on growth has risenby seven percentage points over the past 12 months,led by Singapore (up 17 percentage points),Vietnam (up 10) and the Philippines (up nine).Elsewhere Chile and Germany (both up eight) arealso reporting skills shortages.
The top six economies reporting skills shortagesare all emerging economies, led by Botswana (56%)– which is struggling more than neighbour SouthAfrica (38%) on this measure – India (53%) andThailand (51%). Brazil (44%), where theunemployment stands at just 5.3%, is top in LatinAmerica. Singapore is the top mature economy(43%) and is joined in the top ten by Australia andNew Zealand (both 40%). Interestingly a lack ofskilled workers is far more of an issue in Canada,Japan (both 38%) and Germany (37%) than inFrance (26%), the United Kingdom (19%) or theUnited States (14%). Almost a third of businessesin China (32%), where unemployment is running atjust 4.1%, cite it as a constraint.
Nordic: 16%
Asia Pacific (excl. Japan): 36%
BRIC: 37%
G7: 24%
Global: 27%
ASEAN: 42%
EU: 23%
North America: 16%
Latin America: 35%
FIGURE 19: GLOBAL RACE FOR TALENTPERCENTAGE OF BUSINESSES CITING A LACK OF SKILLED WORKERS AS A CONSTRAINT ON GROWTH (NEXT12 MONTHS)
Botswana 56
India 53
Thailand 51
Brazil 44
Vietnam 44
Malaysia 43
Singapore 43
Belgium 41
Australia 40
New Zealand 40
SOURCE: GRANT THORNTON IBR 2012
Grant Thornton IBR 21
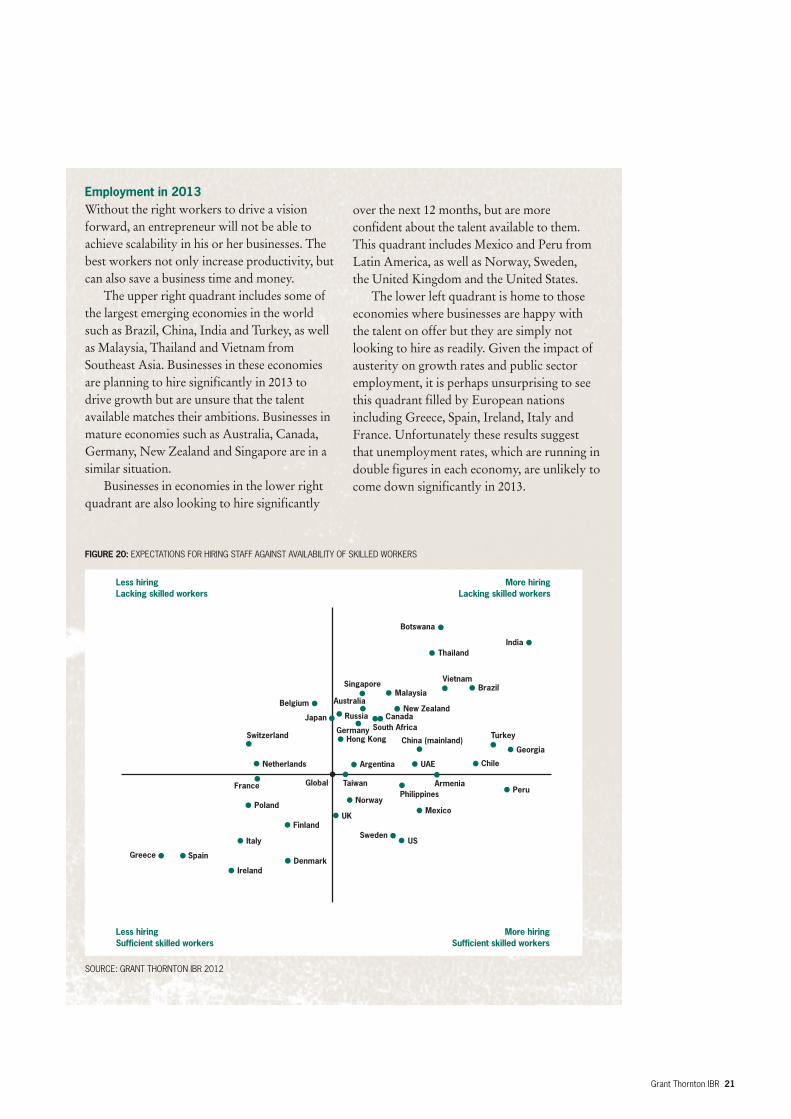
over the next 12 months, but are moreconfident about the talent available to them.This quadrant includes Mexico and Peru fromLatin America, as well as Norway, Sweden, the United Kingdom and the United States.
The lower left quadrant is home to thoseeconomies where businesses are happy withthe talent on offer but they are simply notlooking to hire as readily. Given the impact ofausterity on growth rates and public sectoremployment, it is perhaps unsurprising to seethis quadrant filled by European nationsincluding Greece, Spain, Ireland, Italy andFrance. Unfortunately these results suggestthat unemployment rates, which are running indouble figures in each economy, are unlikely tocome down significantly in 2013.
Employment in 2013 Without the right workers to drive a visionforward, an entrepreneur will not be able toachieve scalability in his or her businesses. Thebest workers not only increase productivity, butcan also save a business time and money.
The upper right quadrant includes some ofthe largest emerging economies in the worldsuch as Brazil, China, India and Turkey, as wellas Malaysia, Thailand and Vietnam fromSoutheast Asia. Businesses in these economiesare planning to hire significantly in 2013 todrive growth but are unsure that the talentavailable matches their ambitions. Businesses inmature economies such as Australia, Canada,Germany, New Zealand and Singapore are in asimilar situation.
Businesses in economies in the lower rightquadrant are also looking to hire significantly
FIGURE 20: EXPECTATIONS FOR HIRING STAFF AGAINST AVAILABILITY OF SKILLED WORKERS
Less hiringLacking skilled workers
More hiringLacking skilled workers
Less hiringSufficient skilled workers
More hiringSufficient skilled workers
SOURCE: GRANT THORNTON IBR 2012
India
Ireland
Italy
Spain
Finland
Global
Switzerland
Netherlands
Belgium
South AfricaHong Kong China (mainland)
Canada
US
Taiwan
UK
Argentina
Mexico
PhilippinesArmenia
Chile
PeruNorway
Thailand
MalaysiaSingapore
Japan
VietnamBrazil
Georgia
UAE
New Zealand
Poland
Denmark
Sweden
Botswana
Australia
Russia
Germany
France
Greece
Turkey
22 Grant Thornton IBR
Funding constraintsFinance plays a key role in bringing the ambitiousgrowth plans of dynamic businesses to life. Centralbanks across the globe from the ECB to the UnitedStates Federal Reserve to the Bank of Japan havebeen required to pump liquidity into their economiesto keep them afloat since the collapse of LehmanBrothers and the ensuing global financial crisis.
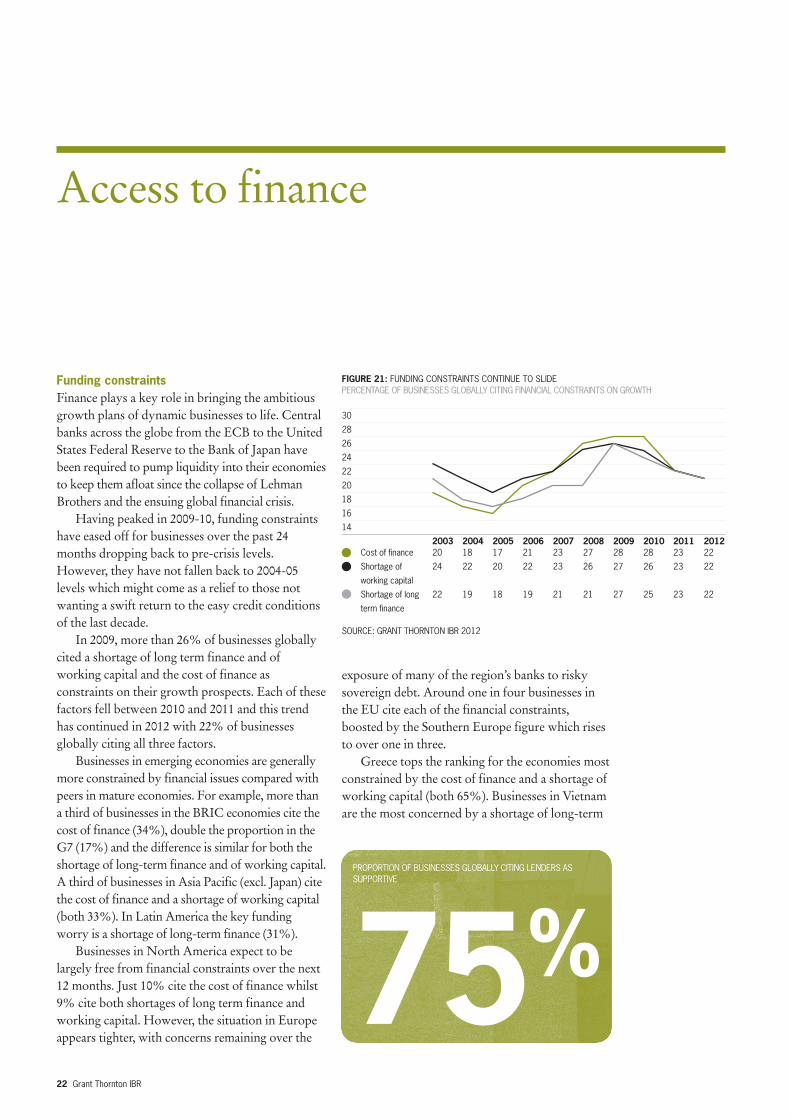
Having peaked in 2009-10, funding constraintshave eased off for businesses over the past 24months dropping back to pre-crisis levels.However, they have not fallen back to 2004-05levels which might come as a relief to those notwanting a swift return to the easy credit conditionsof the last decade.
In 2009, more than 26% of businesses globallycited a shortage of long term finance and ofworking capital and the cost of finance asconstraints on their growth prospects. Each of thesefactors fell between 2010 and 2011 and this trendhas continued in 2012 with 22% of businessesglobally citing all three factors.
Businesses in emerging economies are generallymore constrained by financial issues compared withpeers in mature economies. For example, more thana third of businesses in the BRIC economies cite thecost of finance (34%), double the proportion in theG7 (17%) and the difference is similar for both theshortage of long-term finance and of working capital.A third of businesses in Asia Pacific (excl. Japan) citethe cost of finance and a shortage of working capital(both 33%). In Latin America the key fundingworry is a shortage of long-term finance (31%).
Businesses in North America expect to belargely free from financial constraints over the next12 months. Just 10% cite the cost of finance whilst9% cite both shortages of long term finance andworking capital. However, the situation in Europeappears tighter, with concerns remaining over the
exposure of many of the region’s banks to riskysovereign debt. Around one in four businesses inthe EU cite each of the financial constraints,boosted by the Southern Europe figure which risesto over one in three.
Greece tops the ranking for the economies mostconstrained by the cost of finance and a shortage ofworking capital (both 65%). Businesses in Vietnamare the most concerned by a shortage of long-term
Access to finance
FIGURE 21: FUNDING CONSTRAINTS CONTINUE TO SLIDEPERCENTAGE OF BUSINESSES GLOBALLY CITING FINANCIAL CONSTRAINTS ON GROWTH
30
28
26
24
22
20
18
16
14
2003 2004 2005 2006 2007 2008 2009 2010 2011 2012Cost of finance 20 18 17 21 23 27 28 28 23 22
Shortage of 24 22 20 22 23 26 27 26 23 22
working capital
Shortage of long 22 19 18 19 21 21 27 25 23 22
term finance
SOURCE: GRANT THORNTON IBR 2012
PROPORTION OF BUSINESSES GLOBALLY CITING LENDERS ASSUPPORTIVE
75%

Grant Thornton IBR 23
FIGURE 22: STRUGGLING FOR FUNDSAVERAGE PERCENTAGE OF BUSINESSES CITING THREE FINANCIAL CONSTRAINTS ON GROWTH
Greece 59
Vietnam 59
India 54
Spain 45
Italy 42
Argentina 40
Thailand 37
Turkey 35
Russia 32
Georgia 31
Ireland 31
SOURCE: GRANT THORNTON IBR 2012
PROPORTION OF BUSINESSES GLOBALLY CITING LENDERS ASUNSUPPORTIVE
7%
FIGURE 23: FUNDING TO GROWPERCENTAGE OF BUSINESSES CITING LENDERS AS SUPPORTIVE
SOURCE: GRANT THORNTON IBR 2012
Nordic: 64%
APAC: 75%
BRIC: 64%
G7: 81%
Global: 75%
ASEAN: 67%
EU: 64%
North America: 90%
Latin America: 69%
finance (57%). Other economies with highproportions of businesses constrained by fundingissues include India, Thailand and Vietnam in Asia;Ireland, Italy and Spain from the eurozone;Argentina in Latin America and Georgia, Russia and Turkey from wider Europe.
Lender supportIn times of economic uncertainty, it is even moreimportant that business leaders stay close tolenders, keeping them informed of how theirfunding needs change. Globally, the proportion ofbusinesses citing lenders as supportive of theirbusiness has increased marginally from 74% in2011, to 75% this year. The proportion identifyinglenders as unsupportive remains unchanged at 7%.
The support of lenders in North America hasimproved most significantly over the past 12months, rising from 83% in 2011 to 90% this year.This is by far the highest level of lender support,well ahead of Asia Pacific (75%), Latin America(69%) and the EU (64%). Indeed, 14% of EUbusinesses express dissatisfaction with the supportprovided by lenders.
Businesses in the Philippines and the UnitedStates (both 91%) are the most satisfied with lendersupport, ahead of India, New Zealand (both 87%)and Japan (86%). Those most dissatisfied are splitbetween the eurozone – Greece (24%), France andItaly (both 21%) – and Latin America – Mexico(23%) and Argentina (21%).
The biggest falls in lender supportiveness areobserved in Singapore (down 15 percentage points),Switzerland (down 12) and Argentina (down 11).Conversely the biggest rises are seen in Hong Kong(up 17) and Turkey (up 12).

24 Grant Thornton IBR
management positions globally, marginally upfrom 20% in 2011 but barely higher than thelevel reported in 2004 (19%). The results alsofound that the percentage of businesses that haveno women in their senior management has fallento 31% compared, to 38% in 2011. This isconcerning, with a growing body of researchsuggesting that such imbalance in the boardroomcan be detrimental to business growth prospects4.
Despite rising unemployment, theproportion of women in senior management inEurope has continued to rise steadily from 17% in 2004 to 20% in 2009 to 24% in 2012,catching up with peers in emerging economies.Of course, getting more women into seniormanagement positions has been high on theEuropean political agenda for quite some time.
Women in businessThe past 12 months have seen women take thelead in some of the toughest economic andpolitical environments: Christine Lagardebecame the first female to head the InternationalMonetary Fund, Angela Merkel, the GermanChancellor, has emerged as the key figure insolving the eurozone sovereign debt crisis andMaria das Gracas Foster has taken over atPetrobras, becoming the first woman to run oneof the world’s top five oil companies. Womenalso head governments in countries such asArgentina, Australia, Brazil and Thailand.
In our annual look at the proportion ofwomen in senior management we found littlechange from previous years. The IBR indicatesthat women currently hold 21% of senior
Topical issues
4 ‘Women in senior management: still not enough’ – Grant ThorntonInternational via http://www.internationalbusinessreport.com/Reports/2012/women.asp
FIGURE 24 : DECLINE TO MEDIOCRITY?PROPORTION OF WOMEN IN SENIOR MANAGEMENT
40
36
32
28
24
20
16
12
8
4
0
Asia Pacific ASEAN BRIC Latin America Europe
20092012
SOURCE: GRANT THORNTON IBR 2012
25
19
36
3028
20
32
26
2224

Grant Thornton IBR 25
Governments have been vocal about addressing theimbalance – with France, Italy, Spain and Norway evenadopting quotas – and as a result business practices havebeen under intense scrutiny.
However, we found that the reverse was true inemerging economies, where businesses have historicallyemployed more females in senior roles. Just over one infive (22%) senior management positions in Latin Americaare held by women, down from 28% in 2009. Similar fallswere recorded in the Asia Pacific economies (25% in 2009,down to 19% in 2012), South East Asia (36% in 2009,down to 32% in 2012) and the BRIC economies (30% in2009, down to 26% in 2012).
Of course, there are a myriad of cultural, economic andsocial barriers which prevent women from reaching the topjobs, but rapid urbanisation, which has accompanied rapideconomic growth in emerging economies, could helpexplain why the proportion of women in seniormanagement is falling away. Since 1978, China hasexperienced the largest internal migration in humanhistory, with nearly 160m people moving from thecountryside into cities5. The proportion of people living inurban areas passed 50% in 2011, and is projected to hit55% by 2020. Similarly in Mexico, the proportion of thepopulation living in urban areas is projected to rise from74% in 2000 to 80% by 20206. This is putting a huge strainon traditional family models in which strong supportnetworks allowed women to work whilst children werelooked after by relatives.
Across the world, businesses in Russia employ the mostwomen in senior management (46%), ahead of Botswana,Thailand and the Philippines (all 39%), whilst Italy rankshighest in Europe (36%). Bottom of the table is Japan, whereonly 5% of senior management positions are filled by women,below Germany (13%), India (14%) and Denmark (15%).
The biggest risers over the past 12 months includeTurkey (25% to 31%), and the United Arab Emirates (8% to 15%), results that suggest that the wave ofeconomic liberalisation in the Middle East as a result of the Arab Spring could have boosted the chances of womenin the region reaching the top.
Of those businesses in which women occupy seniormanagement positions, they are most likely to be head of human resources (21%), Chief Financial Officer orCorporate Controller both 13%). Just 9% of businessesare run by a woman.
5 The Economist; from 25 February 2012 edition6 United Nations’ Population Division
FIGURE 25: RUSSIA LEADING THE WAYPERCENTAGE OF WOMEN IN SENIOR MANAGEMENT
Russia 46
Botswana 39
Thailand 39
Philippines 39
Georgia 38
Italy 36
Hong Kong 33
Turkey 31
Poland 30
Malaysia 28
New Zealand 28
South Africa 28
Finland 27
Armenia 27
Taiwan 27
Vietnam 27
Peru 27
Brazil 27
China (mainland) 25
Canada 25
Australia 24
Spain 24
France 24
Singapore 23
Sweden 23
Switzerland 22
Chile 21
Ireland 21
Greece 21
Belgium 21
United Kingdom 20
Argentina 20
Mexico 18
Netherlands 18
United States 17
United Arab Emirates 15
Denmark 15
India 14
Germany 13
Japan 5
SOURCE: GRANT THORNTON IBR 2012

26 Grant Thornton IBR
Despite the ongoing problems, we foundthat businesses remain very supportive of thesingle currency. Almost four in five (78%)businesses in the eurozone believe joining theeuro has had a positive impact on theirbusiness. The main positive impacts cited werethe boost to trade with other euro countries(23%), the elimination of exchange rate risk(15%) and greater transparency on prices (12%).
However, it has not all been positive withbusinesses indicating that there have been somedrawbacks associated with adopting the euro –57% cited a rise in costs and prices – but whenasked if they would like to see the euro survive,an overwhelming 92% agreed. Businesses inFinland (90%) and Belgium (84%) are the mostpositive about the impact of the single currency,with those in Italy (48%) the least. The tworegional economic heavyweights, Germany(79%) and France (71%), remain solidlysupportive.
Future of EuropeIn 1951, in the aftermath of the Second WorldWar, Belgium, France, Germany, Italy,Luxembourg and the Netherlands cametogether to found the European Union. Overthe ensuing years, the EU has grown both inmembership, and in economic and politicalinfluence to become the largest single market inthe world. On 1 Jan 1999 the single currency –the euro – was launched and has now beenadopted by 17 of the 27 EU member states7.
However, cracks started to appear in ‘theEuropean project’ in 2010, driven by thesovereign debt crisis. In 2011, these crackswidened, clouding the future of the region inuncertainty, so we asked business leaders fromin and around Europe for their views on thesingle currency and future integration.
7 ‘The future of Europe: clouded by uncertainty’ – Grant Thornton Internationalvia http://www.internationalbusinessreport.com/eports/2012/Future_of_Europe.asp
FIGURE 26: WOULD YOU LIKE TO SEE THE EURO SURVIVE?PERCENTAGE OF BUSINESSES, BY GROUP
Yes, and continue to expand Yes, but with some Yes, but with no more countries No, it should break upcountries dropping out joining in the near future
Euro 31 24 37 5
EU only 15 28 36 13
Neighbours 35 25 30 6
SOURCE: GRANT THORNTON IBR 2012

Grant Thornton IBR 27
Views on further European integration aremore mixed. Fewer than one in three eurozonebusinesses indicated they would like to see thesingle currency expand (31%), althoughinterestingly, those in the troubled economiesof Greece (62%) and Spain (53%) were mostkeen to welcome new entrants.
Meanwhile, almost a quarter of eurozonebusinesses (24%) said they would like to seesome countries drop out of the single currency.This was a popular option in the onlyremaining eurozone members with AAA-ratedsovereign debt: Finland (50%), Germany (40%)and the Netherlands (24%).
Outside the eurozone the picture was alsovaried; the majority of business leaders inPoland (64%) and Denmark (62%) would liketheir country to join the single currency. Butfew of their peers in the UK (12%) and Sweden(28%) agree. Outside the EU, 88% ofbusinesses in Turkey would like their economyto integrate further with Europe, but just 32%would like to join the euro.
FIGURE 27: POSITIVE IMPACT OF ENTRY TO EUROZONEPERCENTAGE OF BUSINESSES
SOURCE: GRANT THORNTON IBR 2012
FIGURE 28: WOULD YOU LIKE YOUR COUNTRY TO ADOPT THE EURO?PERCENTAGE OF BUSINESSES
Poland 64
Denmark 62
Turkey 32
Sweden 28
Armenia 28
Georgia 18
United Kingdom 12
Switzerland 8
SOURCE: GRANT THORNTON IBR 2012
Finland90%
Belgium84%
Greece 82%Spain 81%
Germany 79%
eurozone 78%
France 71%
Ireland 7
0%
Netherlands
68%
Italy48%

StressLevels of stress felt by business leaders showedtheir lowest annual increase since 2005 when wesurveyed in early 2012. With economiesdepressed and the outlook for many stilluncertain, this raised the question of whetherbusiness leaders are managing their goals toalleviate stress, adding a further brake togrowth, or whether they have learnt to bettermanage the challenges they are facing.
In 2010, net 45% of business leadersreported an increase in stress levels over the past12 months, but this fell to just 28% in 2011.And the pattern is consistent around the world;net 21% of business leaders in North Americacite an increase in stress in the last 12 months,compared with 35% in 2010. Asia Pacific is themost stressed region with net 44% reporting anincrease in stress over the past 12 months, butthis too is down from 58% in 2010. Even introubled Europe the net increase in stressdeclined from 40% in 2010 to 22% this year.
FIGURE 29: HOLIDAYS TAKEN VS LEVELS OF STRESS
Less stressedFewer holidays
More stressedFewer holidays
Less stressedMore holidays
More stressedMore holidays
SOURCE: GRANT THORNTON IBR 2012
United States
Turkey
Germany
Malaysia
Taiwan
Canada
Ireland
Russia
Japan
United Kingdom
Greece
France
Argentina
Vietnam
Netherlands Belgium
Brazil
Mexico
Italy
Sweden
South Africa PhilippinesPeru
Denmark
India
Poland
Spain
Hong Kong
Armenia
Finland
Chile
China (mainland)
Georgia
United Arab Emirates
New Zealand
Switzerland
Global
Australia
BotswanaThailand
The results indicated that reachingperformance targets is by far the biggest headachefor businesses; globally 30% of business leaderscite it as the major cause of workplace stress, asdo 37 of the 40 economies surveyed on this topic.The volume of communications, office politics(both 11%) and work/life balance (9%) are muchsmaller contributors.
However, just 42% of business leaders take aholiday to relieve stress, behind exercise/playingsports (62%) and entertainment in home (54%).This is despite a clear correlation between thenumber of holidays taken by business leadersand their levels of stress. Those countries wherebusinesses take the fewest holidays – such asJapan, mainland China and Thailand – reportedthe biggest increases in stress. Conversely,business leaders in the Netherlands, Russia andDenmark took the most days off in 2011 andreported the lowest increases in stress.
28 Grant Thornton IBR
Singapore

Grant Thornton IBR 29
Moreover, developed economies willnormally have the venues, transport andtechnology infrastructure already in place forany major event. Capital investment to buildnew infrastructure is therefore much morelimited in these economies, compared with thelevel of investment required in emergingeconomies such as China and Brazil.
The results also indicate that businesses inthose economies which have recently held, orare soon to hold, major sporting events aremore bullish about the investment they bring(the exception is mainland China, where thelegacy of the 2008 Olympic Games in Beijingremains unclear). Businesses in Brazil – which isgearing up to host the 2014 FIFA World Cupand 2016 Olympic Games – show the greatestfaith in sport’s ability to deliver investment(83%). Businesses in Poland (82%) – host ofthe 2011 European Championships – and SouthAfrica (78%) – FIFA World Cup 2010 are alsopositive in this regard.
Sport in BusinessAhead of the 2012 Olympic Games in London,we asked businesses about the prospects oftheir economies bidding for and holding majorsporting events. Interestingly, businesses inemerging economies most value the ability ofbig sporting events to attract investment to theireconomies, whilst counterparts in developedeconomies view them as less important.
In Latin America, almost three quarters(74%) of businesses believe major sportingevents are important in attracting investment totheir economy and across the BRIC nationsover half (54%) hold this view. By contrast, farfewer businesses in the EU (42%) and NorthAmerica (44%) believe in the ability of bigsporting events to attract investment, droppingto just over one in three (36%) in the G7.
Holding a major sporting event gives anemerging economy a global shop window,allowing it to present and market what it has tooffer to a massive worldwide audience. Formore established economies, internationalsporting competitions are still a greatopportunity, but appear to be just one elementof a much bigger offensive to attract investment.
FIGURE 30: HOW IMPORTANT DO YOU BELIEVE HOSTING MAJOR SPORTING EVENTS ARE IN TERMS OF ATTRACTING INVESTMENT TO YOUR ECONOMY? PERCENTAGE OF BUSINESSES ANSWERING 4 OR 5 (WHERE 5 IS VERY IMPORTANT AND 1 IS NOT AT ALL IMPORTANT)
90
80
70
60
50
40
30
20
10
0
Brazil Poland South Africa New Zealand India Australia Russia UK Global China (mainland)
FIFA World Cup 2014 European FIFA World Rugby World Commonwealth Olympic FIFA World Olympic – Olympic
Olympic Games 2016 Championships Cup 2010 Cup 2011 Games 2010 Games 2000 Cup 2018 Games 2012 Games
2012 2008
SOURCE: GRANT THORNTON IBR 2012
83 82
56
7874
63 62 62 61
4338

Meanwhile, businesses around Europe,including those in Italy (90%), Switzerland(88%) and the United Kingdom (78%), aremost likely to think that senior executives atlarge public companies are paid too much. Theyare joined by peers from Australia (79%), India(78%) and Hong Kong (78%).
More than three-quarters globally (77%) say that public companies should disclose theremuneration policy and individual remunerationof executive and non-executive directors and80% believe that the roles of CEO andChairman of the Board should be held bydifferent people to ensure greater oversight. Afurther 90% of business leaders think executiveremunerations at public companies should beclosely linked to performance targets.
Executive compensationThe salaries of executives at large corporatesaround the world has been the subject of muchdebate so we asked business leaders for theirviews on compensation and shareholder action.
Two-thirds (67%) of business leadersaround the world say that shareholders shouldhave greater involvement in establishingremuneration policy for senior executives atlarge public companies and 66% believe thatsenior executives are paid too much.
Those businesses most keen to increase therole of shareholders in setting executive pay arefound in emerging economies such as mainlandChina (89%), Vietnam (88%), South Africa(85%) and Brazil (85%).
FIGURE 31: EXECUTIVE COMPENSATION PERCENTAGE OF BUSINESSES WHO BELIEVE THAT AT LARGE PUBLIC COMPANIES
SENIOR EXECUTIVES ARE PAID TOO MUCH SHAREHOLDERS SHOULD HAVE GREATER INVOLVEMENT IN ESTABLISHING REMUNERATION POLICY FOR SENIOR EXECUTIVES
SOURCE: GRANT THORNTON IBR 2012
Italy90%
Switzerland88%
Australia 79%
India 78%Hong Kong 78%
UK 78%
Brazil 76%
Turkey 76%
Mexico 74%
Spain
74%
China(m
ainland) 89%
Vietnam88%
South Africa 85%
Brazil 84%Thailand 84%
Singapore 82%
Argentina 82%
Hong Kong
80%
Turkey
80%
Chile
78%
30 Grant Thornton IBR

The key issue preventing businesses fromexpanding internationally is regulations andlegislation, cited by 45% of businesses globally.It was cited as the key challenge for businessesin North America (50%) and the EU (39%) aswell as in Latin America (50%) and the BRICeconomies (35%). With the global economicrecovery still tepid at best, lowering barriers totrade and foreign direct investment (FDI) couldprovide a boost to business growth prospectsand help the global economy get back on asurer footing.
International expansionIn an ever more globalised world, dynamicbusinesses are increasingly looking to boosttheir growth prospects by expandinginternationally. And globalisation is no longer aone-way street with business leaders in matureeconomies looking to access low-cost inputssuch as labour and land, and vast consumermarkets in emerging economies. Increasinglycash-rich businesses in emerging economies arelooking for expansion opportunities in maturemarkets, whether through opening premises orbuying distressed assets, to access strategicmarkets, skills or technologies. These transferscan move businesses onto higher growth plains,allowing them to produce higher value-addproducts and services.
Our survey results reveal that, globally,57% of those business leaders consideringinternational expansion are looking at the fivebiggest emerging economies – China, India,Russia, Brazil and Mexico – compared with38% looking at Western Europe and 33% atNorth America.
This interest in higher growth economies isparticularly apparent amongst businesses inmature economies: 63% of Japanese businessesand 45% of those in the G7 are looking atopportunities in China; 59% of Germanbusinesses are looking at Russia and 57% ofNorth American businesses are looking at LatinAmerica. However, businesses in Turkey(59%), Russia (37%), India (33%) and China(27%) are all looking at opportunities inWestern Europe. And 33% of Latin Americanbusinesses, rising to 58% in Mexico, arelooking at North America.
FIGURE 32: INTERNATIONAL INVESTMENT HOTSPOTSPERCENTAGE OF BUSINESSES CONSIDERING INTERNATIONAL EXPANSION IN REGIONS/AREAS
Top 5 emerging economies* 57
Western Europe 38
United States or Canada 33
Other Asia 33
China 31
Eastern Europe 26
India 24
Other Latin America 22
Middle East 21
Brazil 21
Russia 18
Mexico 15
Australia or New Zealand 14
Other Africa 13
South Africa 12
*PERCENTAGE OF BUSINESSES CONSIDERING EXPANSION TO AT LEAST ONE OF BRAZIL, CHINA,INDIA, MEXICO, RUSSIA
SOURCE: GRANT THORNTON IBR 2012
Grant Thornton IBR 31

32 Grant Thornton IBR
Methodology & IBR participants
*Armenia, Georgia, Norway, Russia, Switzerland, Turkey
The International Business Report (IBR) is aquarterly survey of the views and expectations ofboth public and privately-held businesses.Launched in 1992 in nine European countries, IBRnow interviews 3,200 businesses in 44 economiesevery quarter. The total number of individualbusiness leaders interviewed per year is over 12,000.
Data collection is managed by Grant ThorntonInternational’s core research partner – Experian.Questionnaires are translated into local languageswith each participating country having the optionto ask a small number of country specific questionsin addition to the core questionnaire. The researchis carried out primarily by telephone. Responses areweighted by economy GDP figures.
The data for this report are principally drawnfrom interviews conducted between December 2011and September 2012. The Q4-2012 businessoptimism figures (p.6) come from interviewsconducted in November/December 2012, but arenot included in the totals above. The targetrespondents are chief executive officers, chieffinancial officers, managing directors and chairmen.Business leaders are drawn from all industry sectors.
More information• Website:
www.internationalbusinessreport.com• Data visualisation tool:
dataviztool.internationalbusinessreport.com• IBR project manager:
Dominic King – [email protected]
North America: 1205
Latin America: 1058
EU neighbours*: 1255 European Union: 4173
Africa and Middle East: 1020
Asia Pacific: 3150
FIGURE 33: IBR PARTICIPANT ECONOMIES AND TOTAL NUMBER OF INTERVIEWS COMPLETED

IBR contacts ArgentinaArnaldo HasencleverT +54 11 4105 0000E [email protected] www.gtar.com.ar
ArmeniaGurgen HakobyanT +374 (0) 10 276 569E [email protected] www.gta.am
AustraliaRobert QuantT +61 (0)2 8297 2525E [email protected] www.grantthornton.com.au
BelgiumDominic KingT +44 207 391 9537E [email protected] www.gti.org
BotswanaJay RameshT +267 3914465E [email protected] www.gt.co.bw
BrazilPaulo Sergio DortasT +55 11 3886 5105E [email protected] www.grantthornton.com.br
CanadaBill BrushettT +1 416 369 6445E [email protected] www.grantthornton.ca
Benoit EganT +1 514 878 2691E [email protected] www.rcgt.com
ChileAlfonso IbañezT +56 (0)2 6513000E [email protected] www.gtchile.cl
China (mainland)Xu HuaT +86 10 8566 5978E [email protected] www.grantthornton.cn/sc/
DenmarkJorgen NielsenT +4533454212E [email protected] www.grantthornton.dk
EstoniaMati NõmmisteT +372 6264 500E [email protected] www.grantthornton.ee
FinlandJoakim RehnT +358 (0)9 5123 3344E [email protected] www.gtfinland.com
FranceJean-Jacques PichonT +33 (0) 381 883 987E [email protected] www.grant-thornton.fr
GeorgiaNelson Petrosyan T +995 (322) 604 406E [email protected] www.grantthornton.ge
GermanyKlaus-Guenter KleinT +49 211 9524 140E [email protected] www.wkgt.com
GreeceVassilis KazasT +30 210 7280000E [email protected] www.grant-thornton.gr
Hong KongDaniel LinT +852 3987 1300E [email protected] www.grantthornton.cn
IndiaVishesh Chandiok T +91 11 4278 7070 E [email protected] W www.grantthornton.in
IrelandPatrick BurkeT +353 (0)1 6805 650E [email protected] www.grantthornton.ie
ItalyGiuseppe BernoniT +39 02 76008751E [email protected] www.gtbernoni.it
Giancarlo PizzocaroT +39 02 331 4809E [email protected] www.ria.it
JapanHiroyuki HamamuraT +81 3 5770 8855E [email protected] www.grantthornton.jp
LatviaJelena ŽovnikovaT +371 6721 7569E [email protected] www.grantthornton.lv
LithuaniaGenadijus MakuševasT +370 5212 7856E [email protected] W www.grantthornton.lt
MalaysiaDato’ Narendra JasaniT +60 (0) 3 2692 4022E [email protected] www.gt.com.my
MexicoHéctor PérezT +52 55 5424 6500E [email protected] www.ssgt.com.mx
NetherlandsFrank PonsioenT +31 (0) 172 42 38 70 E [email protected] www.gt.nl
New ZealandPeter SherwinT +64 (0)4 474 8500E [email protected] www.grantthornton.co.nz
NorwayJan Møller T +47 22 200 400 E [email protected] W www.grant.thornton.no
PeruJose Luis SarrioT +511 6156868 E [email protected] W www.grantthornton.com.pe
PhilippinesMarivic EspañoT +632 (0) 886 5579E [email protected] www.punongbayan-araullo.com
PolandTomasz WroblewskiT +48 61 625 1133E [email protected] www.grantthornton.pl
RussiaSergey TishakovT +7(495)775 0050E [email protected] www.gtrus.com
SingaporeAw Eng Hai T +65 6303 9508E [email protected] www.gt.com.sg
South AfricaDeepak NagarT +27315765502E [email protected] www.gt.co.za
SpainJose Maria FernandezT +34 91 576 39 99E [email protected] www.grantthornton.es
SwedenPeter BodinT +46 (0) 8 563 071 69E [email protected] www.grantthornton.se
SwitzerlandCarolyne Pillard T +41 22 799 47 99 E [email protected] W www.grant-thornton.ch
TaiwanJay Lo T +886 2 2758 2688E [email protected] www.gti.com.tw
ThailandIan Pascoe T +66 (0)22 05 8100 E [email protected] W www.grantthornton.co.th
TurkeyAykut Halit T +90 (0) 212 373 0000E [email protected] www.gtturkey.com
United Arab EmiratesHisham FaroukT +971 42688070E [email protected] www.gtuae.net
United KingdomScott BarnesT +44 (0)20 7728 2428E [email protected] www.grantthornton.co.uk
United StatesStephen ChipmanT +1 312 602 8200E [email protected] www.grantthornton.com
VietnamKen AtkinsonT +84 8 3910 9108E [email protected] www.gt.com.vn

www.gti.orgwww.internationalbusinessreport.com
© 2013 Grant Thornton International Ltd. All rights reserved.References to “Grant Thornton” are to the brand under which the GrantThornton member firms operate and refer to one or more member firms, as the context requires. Grant Thornton International and the member firmsare not a worldwide partnership. Services are delivered independently bymember firms, which are not responsible for the services or activities of oneanother. Grant Thornton International does not provide services to clients.
Recommended