GLOBAL DEMOGRAPHICS:GLOBAL DEMOGRAPHICS:SHAPING REAL ESTATE’S FUTURESHAPING REAL ESTATE’S FUTURE
GLOBAL DEMOGRAPHICS:GLOBAL DEMOGRAPHICS:SHAPING REAL ESTATE’S FUTURESHAPING REAL ESTATE’S FUTURE
M. Leanne LachmanLachman Associates
May 5, 2010
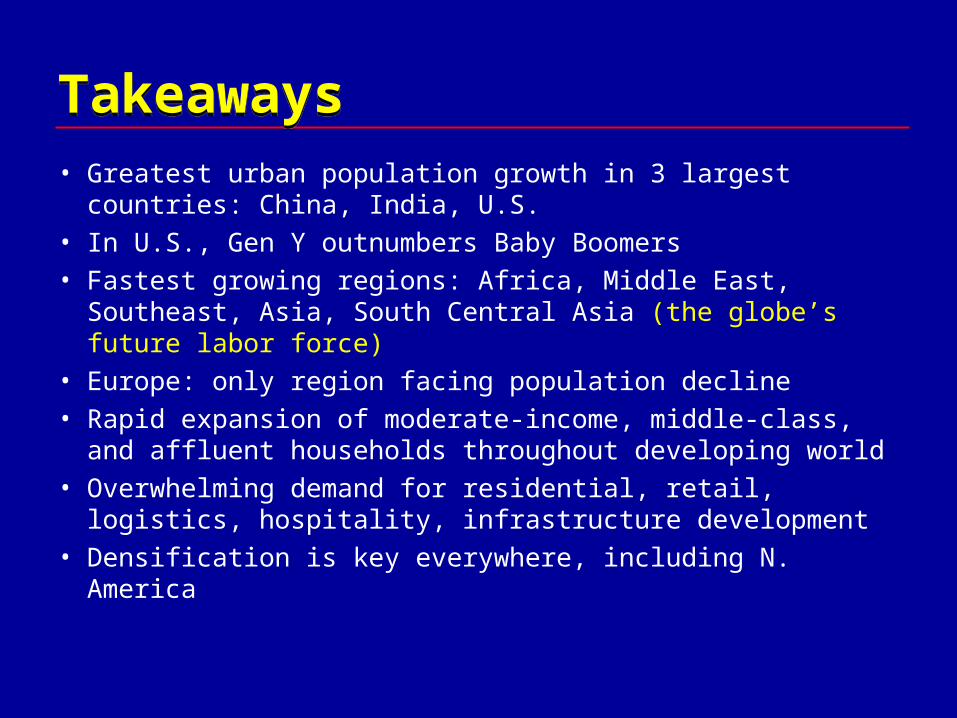
TakeawaysTakeaways• Greatest urban population growth in 3 largest countries:
China, India, U.S.• In U.S., Gen Y outnumbers Baby Boomers• Fastest growing regions: Africa, Middle East, Southeast,
Asia, South Central Asia (the globe’s future labor force)• Europe: only region facing population decline• Rapid expansion of moderate-income, middle-class, and
affluent households throughout developing world• Overwhelming demand for residential, retail, logistics,
hospitality, infrastructure development• Densification is key everywhere, including N. America
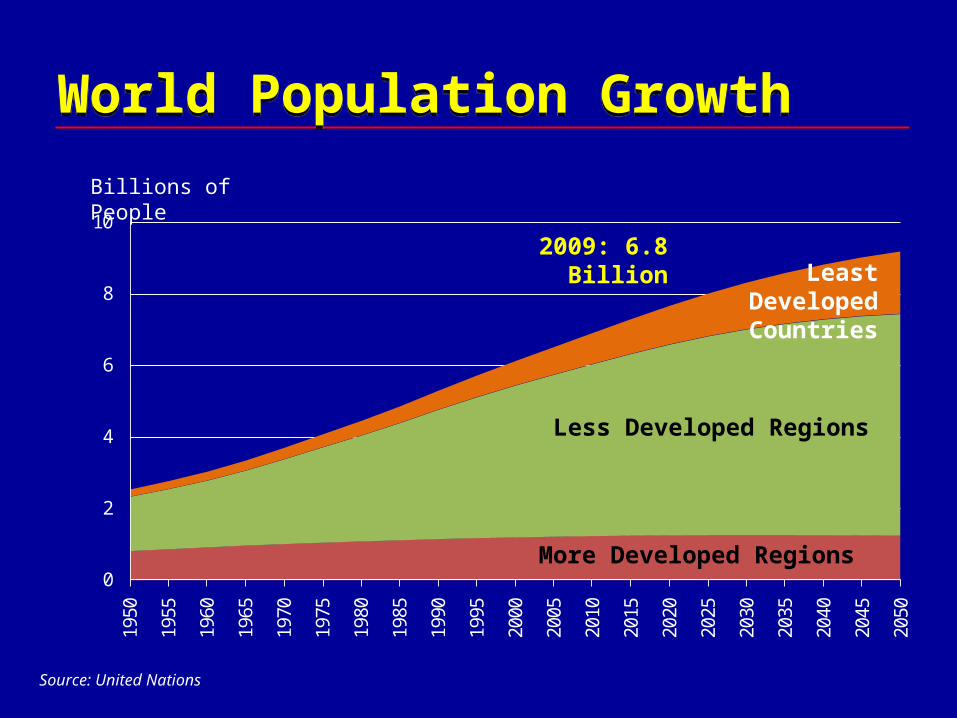
World Population GrowthWorld Population Growth
0
2
4
6
8
10
1950
1955
1960
1965
1970
1975
1980
1985
1990
1995
2000
2005
2010
2015
2020
2025
2030
2035
2040
2045
2050
Billions of People
Less Developed Regions
More Developed Regions
Source: United Nations
Least DevelopedCountries
2009: 6.8 Billion
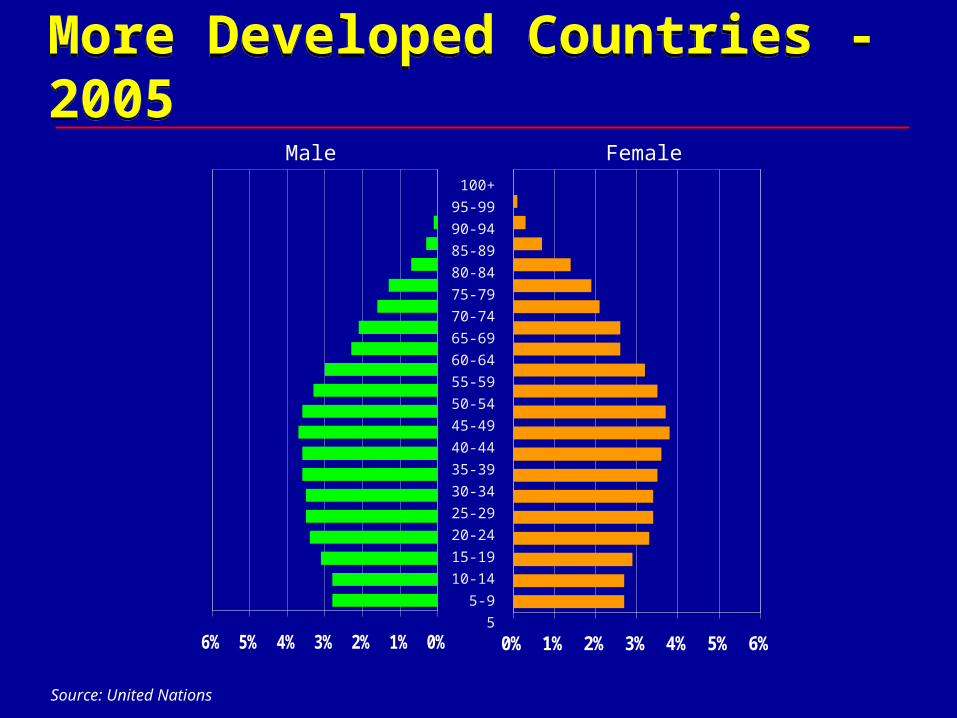
More Developed Countries - 2005More Developed Countries - 2005100+
95-99
90-94
85-89
80-84
75-79
70-74
65-69
60-64
55-59
50-54
45-49
40-44
35-39
30-34
25-29
20-24
15-19
10-14
5-9
5
Male Female
0% 1% 2% 3% 4% 5% 6%
Source: United Nations
0%1%2%3%4%5%6%

Less Developed Countries - 2005Less Developed Countries - 2005
Source: United Nations
100+
95-99
90-94
85-89
80-84
75-79
70-74
65-69
60-64
55-59
50-54
45-49
40-44
35-39
30-34
25-29
20-24
15-19
10-14
5-9
5
Male Female
0% 1% 2% 3% 4% 5% 6%0%1%2%3%4%5%6%

Maturity & Youth Maturity & Youth
Source: United Nations
100+
95-99
90-94
85-89
80-84
75-79
70-74
65-69
60-64
55-59
50-54
45-49
40-44
35-39
30-34
25-29
20-24
15-19
10-14
5-9
5
Male Female0% 1% 2% 3% 4% 5% 6%0%1%2%3%4%5%6%
Less Developed Countries – 5.3 billionMore Developed Countries – 1.2 billion100+
95-99
90-94
85-89
80-84
75-79
70-74
65-69
60-64
55-59
50-54
45-49
40-44
35-39
30-34
25-29
20-24
15-19
10-14
5-9
5
Male Female0% 1% 2% 3% 4% 5% 6%0%1%2%3%4%5%6%

Urban/Rural MixUrban/Rural Mix
0
1
2
3
4
5
6
7
Rural Urban
Source: United Nations
Billion

Working-Age Population ChangeWorking-Age Population Change
2005-30 ChangeNumber (Mil) Percent
Sub-Saharan Africa 372.7 90.6
MENA 119.7 52.2
Latin America and Caribbean 116.0 32.5
Asia 647.0 26.4
Oceania 5.5 25.2
Northern America 29.5 13.2
Europe -52.8 -10.6
World 1,237.6 29.5
Source: United Nations
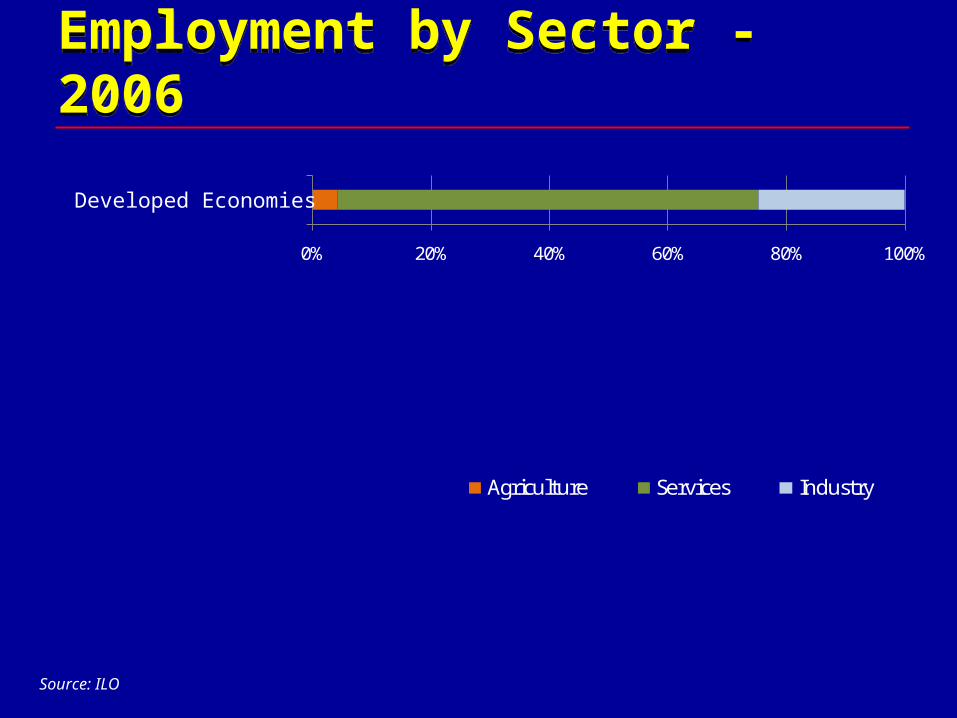
Employment by Sector - 2006Employment by Sector - 2006
0% 20% 40% 60% 80% 100%
Agriculture Services Industry
Source: ILO
Developed Economies

Employment by Sector - 2006Employment by Sector - 2006
0% 20% 40% 60% 80% 100%
Agriculture Services Industry
Source: ILO
Developed Economies
Latin America & Caribbean
Middle East
Central & Southeast Europe
North Africa
World
East Asia
Southeast Asia & Pacific
South Asia
Sub-Saharan Africa
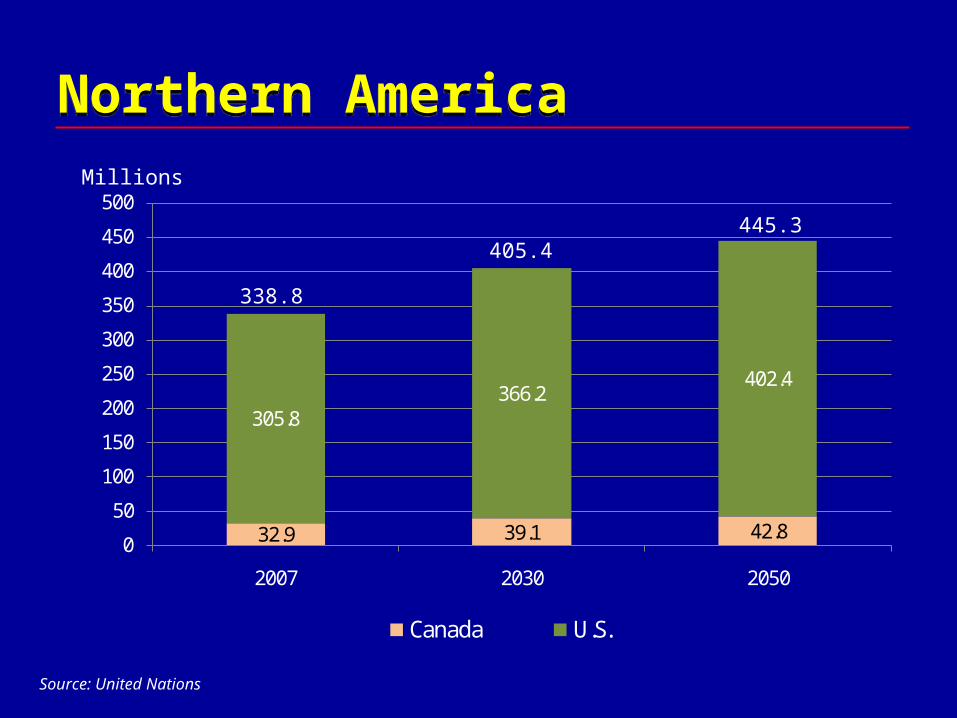
Northern AmericaNorthern America
32.9 39.1 42.8
305.8366.2
402.4
0
50
100
150
200
250
300
350
400
450
500
2007 2030 2050
Canada U.S.
Source: United Nations
Millions
338.8
405.4445.3
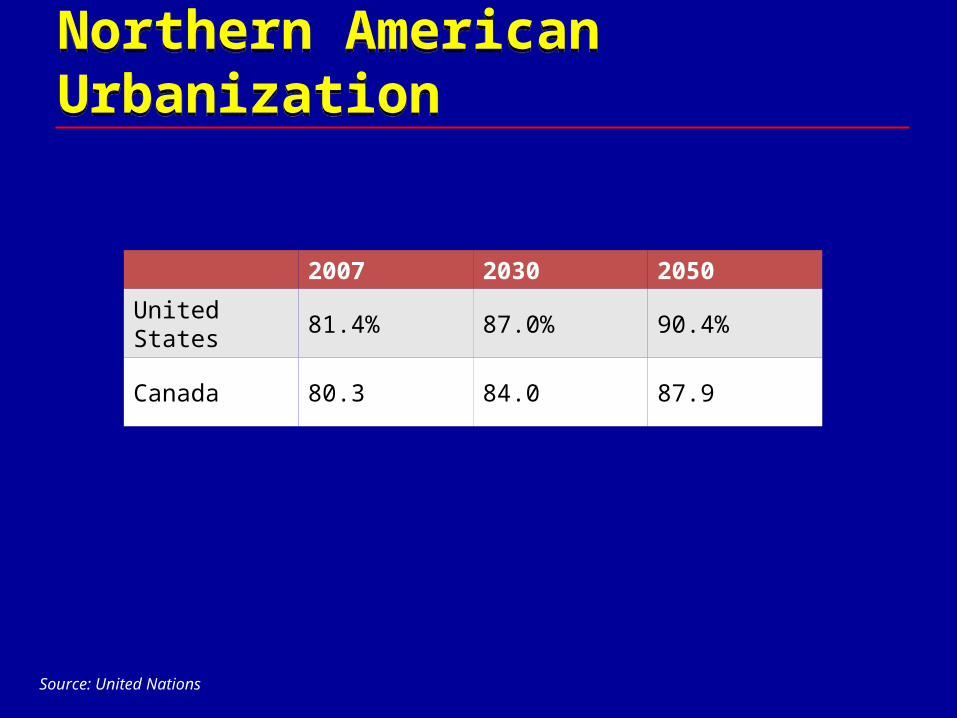
Northern American UrbanizationNorthern American Urbanization
2007 2030 2050
United States 81.4% 87.0% 90.4%
Canada 80.3 84.0 87.9
Source: United Nations

Latin America & CaribbeanLatin America & Caribbean
41.2 48.4 50.4
147.6 187.2 202.0
383.4
477.3516.3
0
100
200
300
400
500
600
700
800
2007 2030 2050
Caribbean Central America South America
Source: United Nations
Millions
572.2
712.8769.2
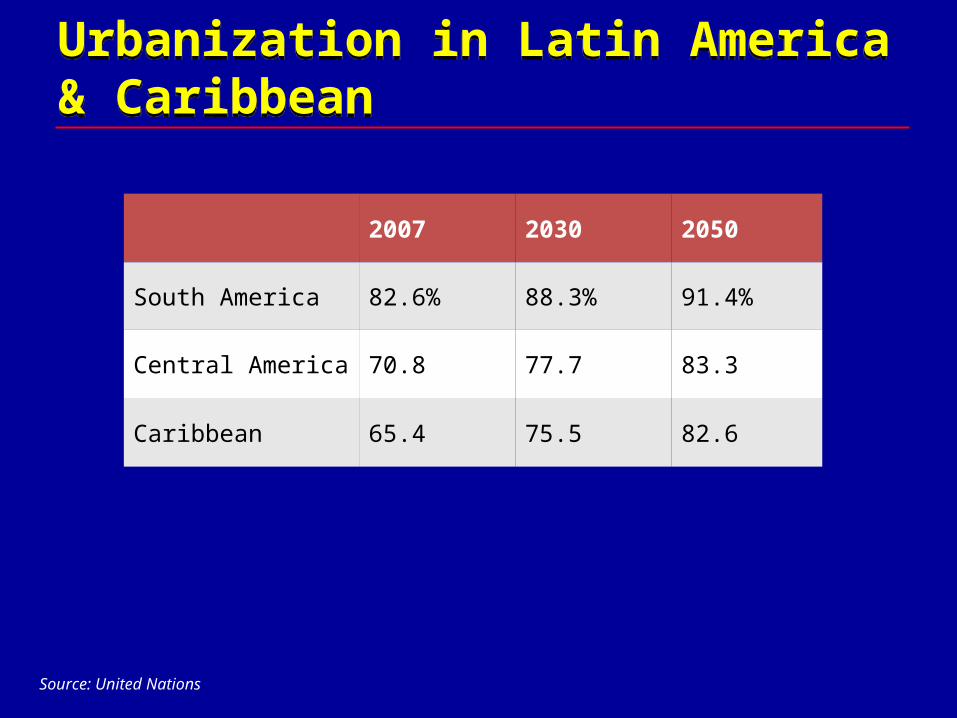
Urbanization in Latin America & CaribbeanUrbanization in Latin America & Caribbean
2007 2030 2050
South America 82.6% 88.3% 91.4%
Central America 70.8 77.7 83.3
Caribbean 65.4 75.5 82.6
Source: United Nations

AsiaAsia
Source: United Nations
EastAsia
Southeast Southeast AsiaAsia
South Central Asia
1.5 1.7 1.6
1.72.2 2.5
0.6
0.70.8
0
1
2
3
4
5
2007 2030 2050
Billion
3.8
4.64.9
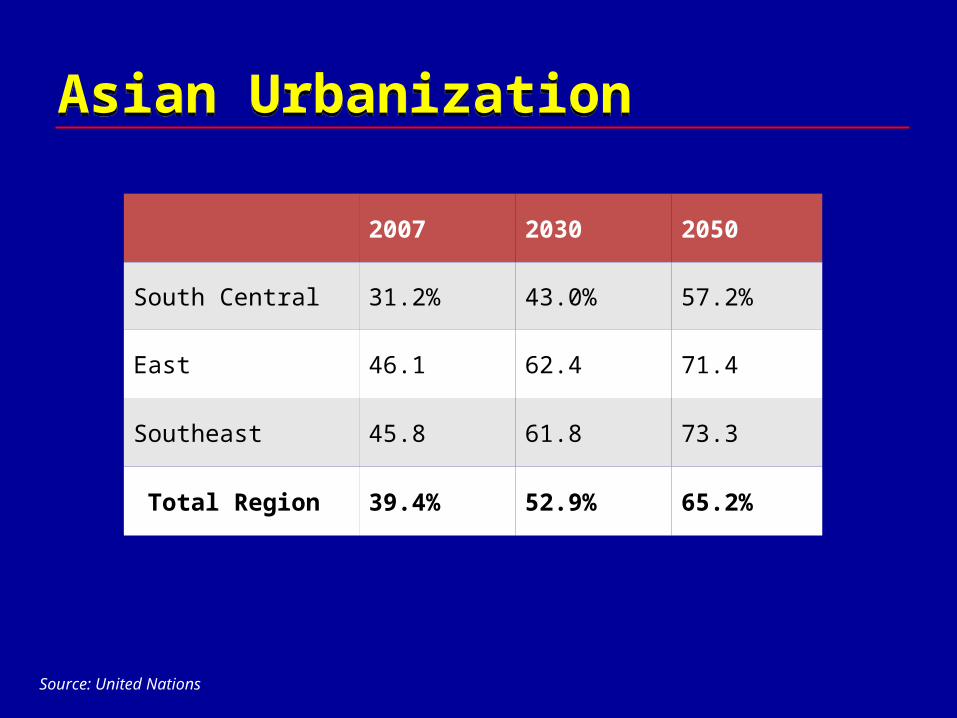
Asian UrbanizationAsian Urbanization
2007 2030 2050
South Central 31.2% 43.0% 57.2%
East 46.1 62.4 71.4
Southeast 45.8 61.8 73.3
Total Region 39.4% 52.9% 65.2%
Source: United Nations
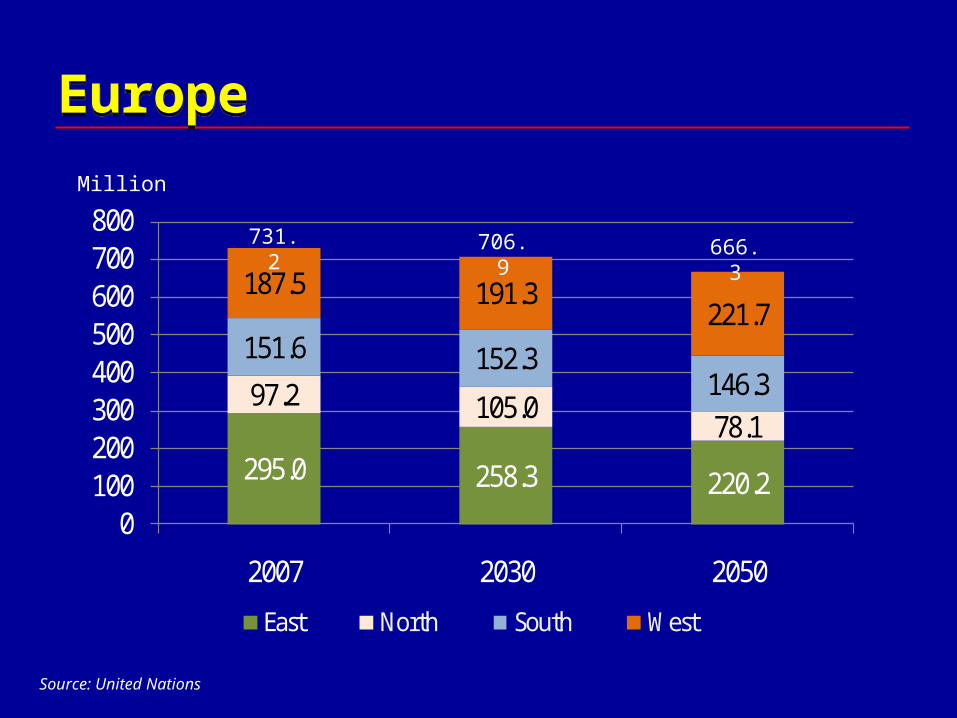
EuropeEurope
295.0 258.3 220.2
97.2 105.078.1
151.6 152.3146.3
187.5 191.3221.7
0100200300400500600700800
2007 2030 2050
East North South West
Source: United Nations
731.2 706.9 666.3
Million
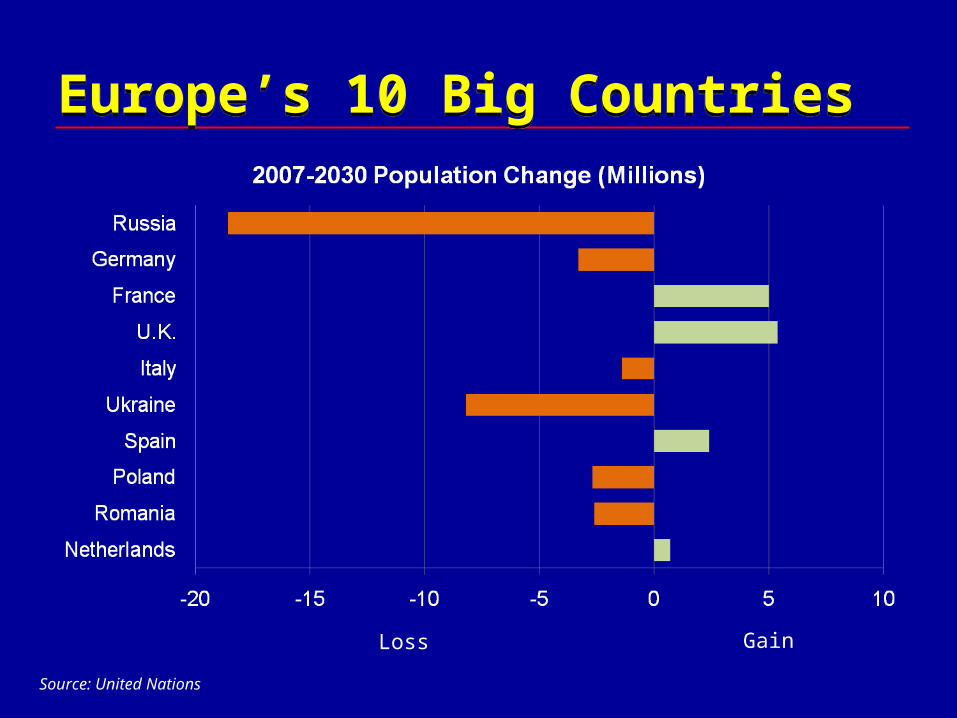
Europe’s 10 Big CountriesEurope’s 10 Big Countries
Loss Gain
Source: United Nations

Selected EuropeanFertility Rates - 2008Selected EuropeanFertility Rates - 2008
North East
Ireland 1.90 Poland 1.28
Norway 1.90 Russia 1.31
Sweden 1.85 Ukraine 1.25
South West
Greece 1.40 France 1.98
Italy 1.35 Germany 1.40
Spain 1.37 Netherlands 1.73
Source: Population Reference Bureau
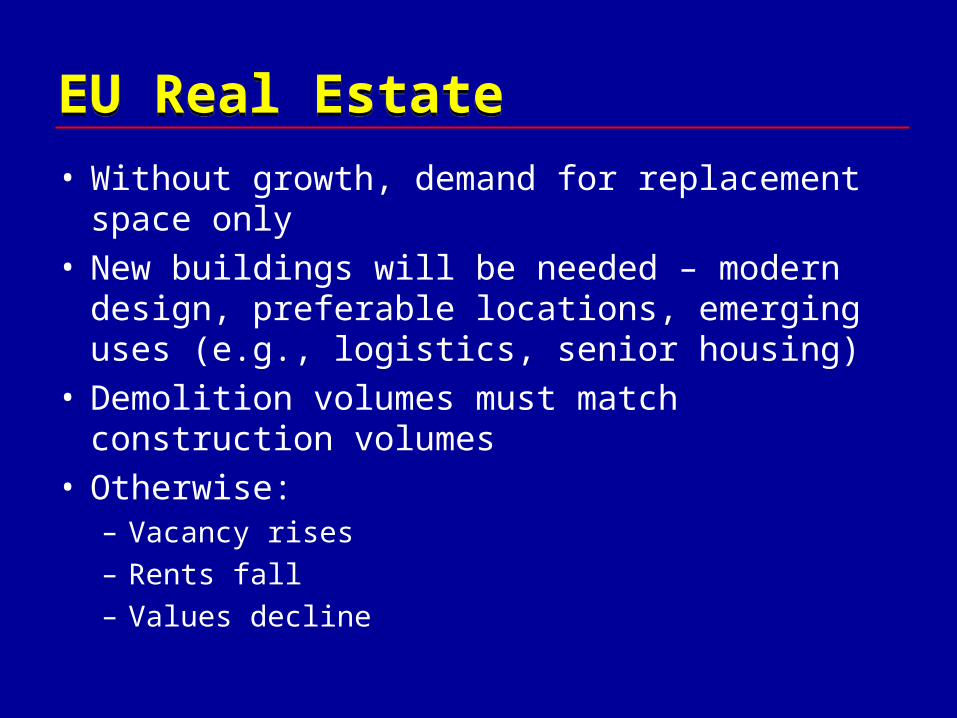
EU Real EstateEU Real Estate
• Without growth, demand for replacement space only
• New buildings will be needed – modern design, preferable locations, emerging uses (e.g., logistics, senior housing)
• Demolition volumes must match construction volumes
• Otherwise:– Vacancy rises– Rents fall– Values decline
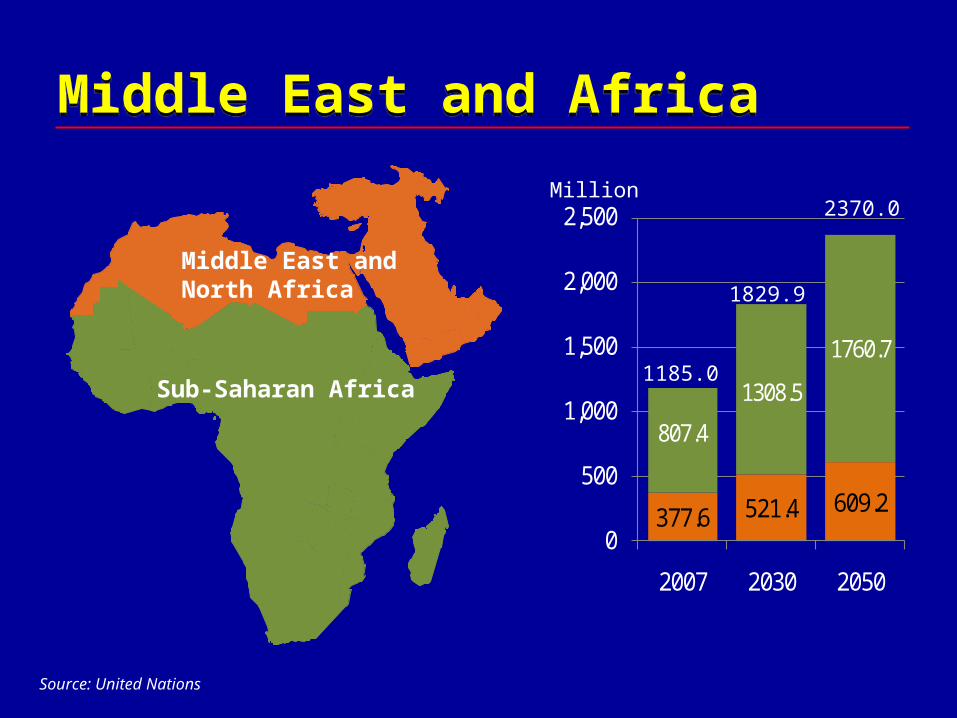
Middle East and AfricaMiddle East and Africa
Source: United Nations
377.6 521.4 609.2
807.4
1308.5
1760.7
0
500
1,000
1,500
2,000
2,500
2007 2030 2050
Million
1185.0
1829.9
2370.0
Sub-Saharan Africa
Middle East andNorth Africa

Middle Eastern/African UrbanizationMiddle Eastern/African Urbanization
2007 2030 2050
Western Asia 65.5% 72.5% 79.3%
Northern Africa 52.9 61.5 71.4
MENA Total 60.2% 68.1% 76.2%
Sub-Saharan Africa 35.9% 48.2% 60.5%
Source: United Nations

MENA and Sub-Saharan AfricaMENA and Sub-Saharan Africa
MENASub-Saharan
Africa World
2007 Population (mil) 338 807 6,700
Annual Growth 1.8% 2.5% 1.2%
Growth in working-age population 2005-2030
52% 91% 30%
Life expectancy (years) 70 50 68
Fertility rate 2.9 5.2 2.5
Primary school completion 91% 60% 86%
Secondary school enrollment, relevant ages
74% 31% 65%
2007 Per capita income, (PPP) $7,385 $1,870 $9,852
Source: World Bank, United Nations

Global Real Estate ImplicationsGlobal Real Estate Implications• Strong demand in the Americas
• Only replacement demand in Europe: exercise caution
• Increasingly global retail branding and chain store expansion:think emerging markets
• Urbanization (and urban movement) generate massive real estate needs
• Overwhelming moderate- and middle-income residential demand in emerging markets
• Global production, commodity trading, and distribution require sophisticated logistics
• Stimulus funds = infrastructure
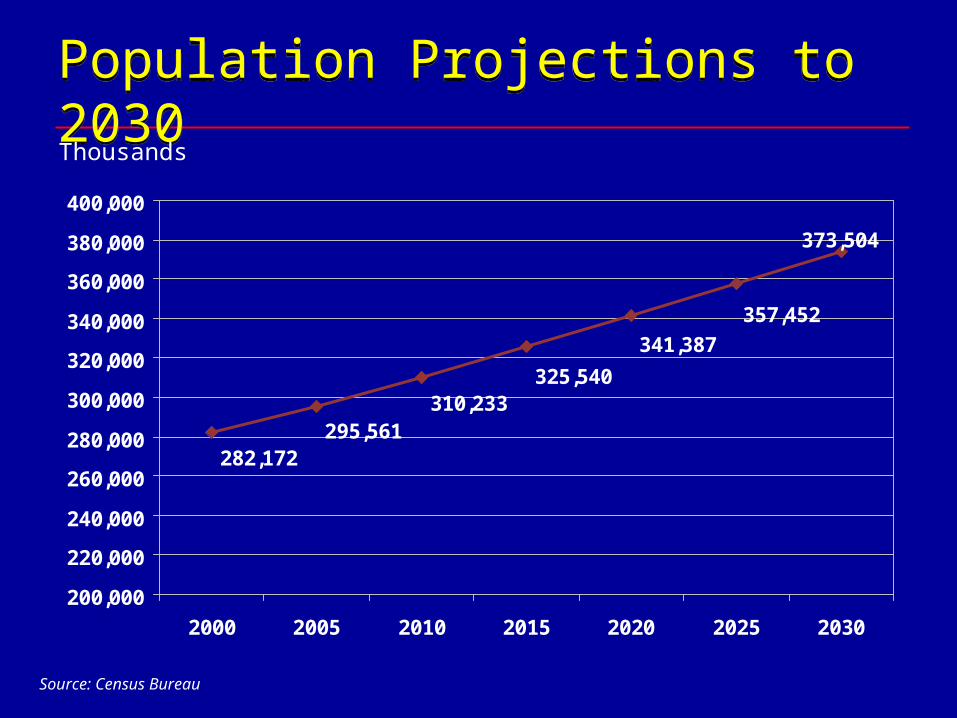
Population Projections to 2030Population Projections to 2030
373,504
357,452
341,387
325,540310,233
295,561282,172
200,000
220,000
240,000
260,000
280,000
300,000
320,000
340,000
360,000
380,000
400,000
2000 2005 2010 2015 2020 2025 2030
Thousands
Source: Census Bureau
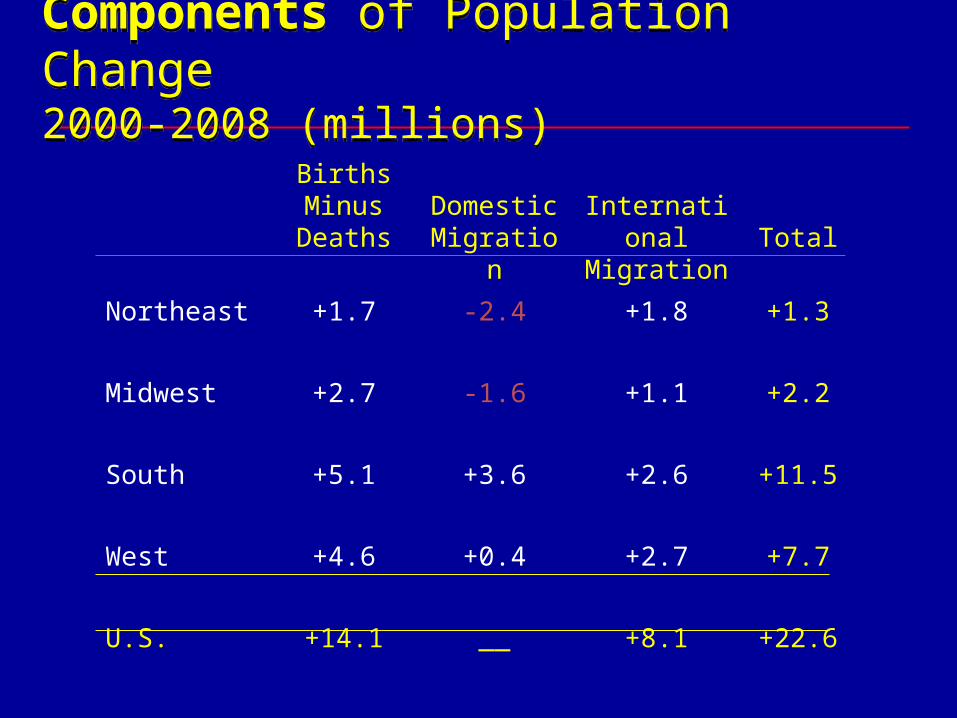
Components of Population Change2000-2008 (millions)Components of Population Change2000-2008 (millions)
Births Minus Deaths
Domestic Migration
International Migration Total
Northeast +1.7 -2.4 +1.8 +1.3
Midwest +2.7 -1.6 +1.1 +2.2
South +5.1 +3.6 +2.6 +11.5
West +4.6 +0.4 +2.7 +7.7
U.S. +14.1 __ +8.1 +22.6
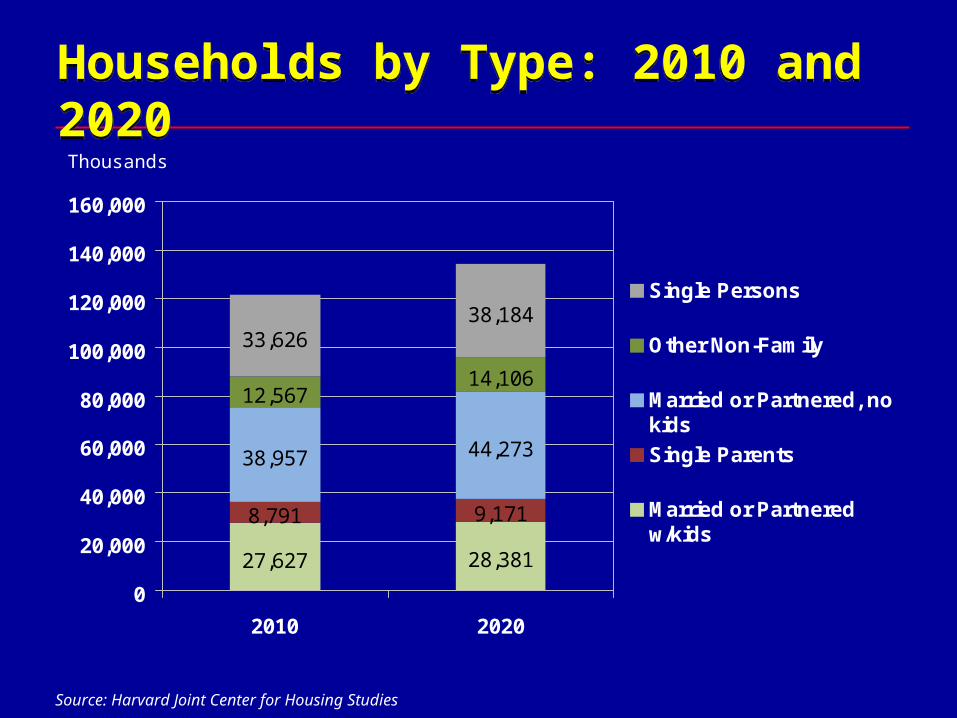
Households by Type: 2010 and 2020Households by Type: 2010 and 2020
27,627 28,381
8,791 9,171
38,957 44,273
12,56714,106
33,62638,184
0
20,000
40,000
60,000
80,000
100,000
120,000
140,000
160,000
2010 2020
Single Persons
Other Non-Family
Married or Partnered, nokids
Single Parents
Married or Partneredw/kids
Thousands
Source: Harvard Joint Center for Housing Studies

Two Big GenerationsTwo Big Generations
Gen Y Boomers
2010 Size 74.8 million 74.6 million
Birth Years 1977-1994 1946-1964
Age Now 16-33 46-64
Hispanic 19% 10%
Black 15% 12%
Asian 6% 5%
Housing Tenure Renters Owners
NeighborhoodPreference
Urban/Walkable
Suburban/Auto-Oriented
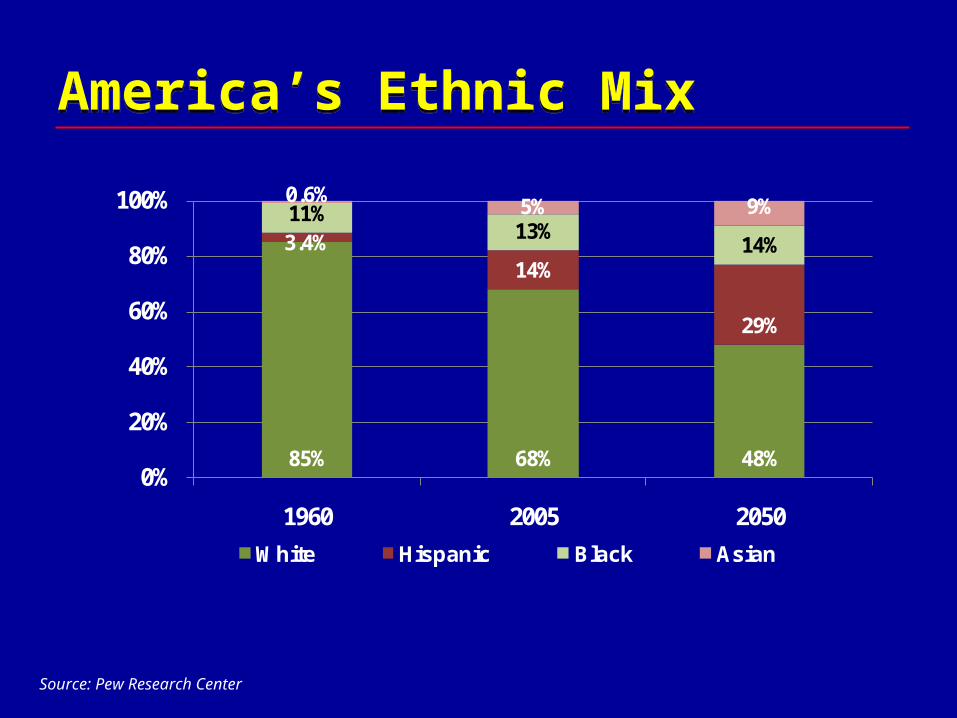
America’s Ethnic MixAmerica’s Ethnic Mix
85% 68% 48%
3.4%14%
29%
11%13%
14%
0.6% 5% 9%
0%
20%
40%
60%
80%
100%
1960 2005 2050White Hispanic Black Asian
Source: Pew Research Center

GLOBAL DEMOGRAPHICS:GLOBAL DEMOGRAPHICS:SHAPING REAL ESTATE’S FUTURESHAPING REAL ESTATE’S FUTURE
GLOBAL DEMOGRAPHICS:GLOBAL DEMOGRAPHICS:SHAPING REAL ESTATE’S FUTURESHAPING REAL ESTATE’S FUTURE
M. Leanne LachmanLachman Associates
May 5, 2010
Recommended


![[Leon Lachman] the Theory and Practice of Industrial Pharmacy](https://img.pdfslide.us/doc/110x75/56d6bda21a28ab30168ebbde/leon-lachman-the-theory-and-practice-of-industrial-pharmacy.jpg)