Global analysis of food and
nutrition security situation in food crisis hotspots
March 2016
EUR 27879 EN


Global analysis of food and nutrition security situation
in food crisis hotspots
Tharcisse NKUNZIMANA Estefania CUSTODIO
Anne-Claire THOMAS Nigussie TEFERA
Ana PEREZ HOYOS
François KAYITAKIRE
Report prepared in collaboration with
the FAO and the WFP

This publication is a Science for Policy report by the Joint Research Centre, the European Commission’s in-house
science service. It aims to provide evidence-based scientific support to the European policy-making process.
The scientific output expressed does not imply a policy position of the European Commission. Neither the
European Commission nor any person acting on behalf of the Commission is responsible for the use which might
be made of this publication.
Contact information
Address: Joint Research Centre,
Via Fermi, 2749 / TP266
21027 Ispra (VA), Italy
E-mail: [email protected]
Tel.: +39 0332786580
JRC Science Hub
https://ec.europa.eu/jrc
JRC100754
EUR 27879 EN
Print ISBN 978-92-79-57891-5 ISSN 1018-5593 doi:10.2788/234643 LB-NA-27879-EN-C
PDF ISBN 978-92-79-57814-4 ISSN 1831-9424 doi:10.2788/669159 LB-NA-27879-EN-N
© European Union, 2016
Reproduction is authorised provided the source is acknowledged.
Printed in Belgium
How to cite: Nkunzimana T., Custodio E., Thomas A.C., Tefera N., Perez Hoyos A., Kayitakire F. (2016). Global
analysis of food and nutrition security situation in food crisis hotspots; EUR 27879; doi:10.2788/669159
All images © European Union 2016
Abstract
Title: Global analysis of food and nutrition security situation in food crisis hotspots
This report provides a global overview of the food insecurity situation due to different crises and natural
disasters, to support the programming of the Pro-resilience Action (PRO-ACT) funding mechanism, a component
of the Global Public Goods and Challenges (GPGC) thematic programme of the European Union. The analysis
covers the period January 2015 to January 2016, which has been marked by food crises in several countries
because of extreme weather events due the El Niño phenomenon, conflict and political crises. In a number of
countries, in particular in West Africa, food insecurity remains a major concern because of chronic vulnerability
despite good crop production in 2015.

5
Table of contents
ABBREVIATIONS --------------------------------------------------------------------------------------------------------------7
Executive summary ----------------------------------------------------------------------------------------------------------9
1 Background ----------------------------------------------------------------------------------------------------------- 12
2 Methodology --------------------------------------------------------------------------------------------------------- 13
3 Global overview of food crises ---------------------------------------------------------------------------------- 16
4 Horn of Africa -------------------------------------------------------------------------------------------------------- 19
4.1 Somalia ------------------------------------------------------------------------------------------------------------- 19 4.1.1 Food security situation --------------------------------------------------------------------------------- 19 4.1.2 Nutrition security situation --------------------------------------------------------------------------- 21 4.1.3 Main factors in food and nutrition insecurity ---------------------------------------------------- 23
4.2 Ethiopia ------------------------------------------------------------------------------------------------------------ 24 4.2.1 Food security situation --------------------------------------------------------------------------------- 25 4.2.2 Nutrition security situation --------------------------------------------------------------------------- 27 4.2.3 Main factors in food and nutrition insecurity ---------------------------------------------------- 28
4.3 Eritrea -------------------------------------------------------------------------------------------------------------- 30 4.3.1 Food security situation --------------------------------------------------------------------------------- 30 4.3.2 Nutrition security situation --------------------------------------------------------------------------- 31 4.3.3 Main factors in food and nutrition insecurity ---------------------------------------------------- 31
5 West Africa ----------------------------------------------------------------------------------------------------------- 32
5.1 Countries affected by Ebola in 2014 and 2015: Liberia, Guinea, Sierra Leone. ------------------ 32 5.1.1 Food security situation --------------------------------------------------------------------------------- 32 5.1.2 Nutrition security situation --------------------------------------------------------------------------- 33 5.1.3 Main factors in food and nutrition insecurity ---------------------------------------------------- 34
5.2 Gambia ------------------------------------------------------------------------------------------------------------- 35 5.2.1 Food security situation --------------------------------------------------------------------------------- 35 5.2.2 Nutrition security situation --------------------------------------------------------------------------- 36 5.2.3 Main factors of food and nutrition insecurity ---------------------------------------------------- 37
6 Asia and Pacific ------------------------------------------------------------------------------------------------------ 38
6.1 Democratic People’s Republic of Korea -------------------------------------------------------------------- 38 6.1.1 Food security situation --------------------------------------------------------------------------------- 38 6.1.2 Nutrition security situation --------------------------------------------------------------------------- 40 6.1.3 Main factors in food and nutrition insecurity ---------------------------------------------------- 40
6.2 Nepal ---------------------------------------------------------------------------------------------------------------- 42 6.2.1 Food security situation --------------------------------------------------------------------------------- 42 6.2.2 Nutrition security situation --------------------------------------------------------------------------- 43 6.2.3 Main factors in food and nutrition insecurity ---------------------------------------------------- 43
6.3 Papua New Guinea ---------------------------------------------------------------------------------------------- 45

6
6.3.1 Food security situation --------------------------------------------------------------------------------- 45 6.3.2 Nutrition situation --------------------------------------------------------------------------------------- 47 6.3.3 Main factors in food and nutrition insecurity ---------------------------------------------------- 47
7 Central America and the Caribbean --------------------------------------------------------------------------- 48
7.1 Central American Dry Corridor (Guatemala, El Salvador, Nicaragua and Honduras) ----------- 48 7.1.1 Food security situation --------------------------------------------------------------------------------- 48 7.1.2 Main factors in food and nutrition insecurity ---------------------------------------------------- 49
7.2 Haiti ----------------------------------------------------------------------------------------------------------------- 51 7.2.1 Food security situation --------------------------------------------------------------------------------- 51 7.2.2 Nutrition situation --------------------------------------------------------------------------------------- 54 7.2.3 Main factors of food and nutrition insecurity ---------------------------------------------------- 54
8 Countries with conflict areas ------------------------------------------------------------------------------------ 56
8.1 South Sudan ------------------------------------------------------------------------------------------------------- 56 8.1.1 Food security situation --------------------------------------------------------------------------------- 56 8.1.2 Nutrition security situation --------------------------------------------------------------------------- 59 8.1.3 Main factors of food and nutrition insecurity ---------------------------------------------------- 60
8.2 Sudan --------------------------------------------------------------------------------------------------------------- 62 8.2.1 Food security situation --------------------------------------------------------------------------------- 62 8.2.2 Nutrition security situation --------------------------------------------------------------------------- 63 8.2.3 Main factors of food and nutrition insecurity ---------------------------------------------------- 64
8.3 Central African Republic (CAR) ------------------------------------------------------------------------------- 65 8.3.1 Food security situation --------------------------------------------------------------------------------- 65 8.3.2 Nutrition security situation --------------------------------------------------------------------------- 68 8.3.3 Main factors in food and nutrition insecurity ---------------------------------------------------- 69
8.4 Yemen -------------------------------------------------------------------------------------------------------------- 70 8.4.1 Food security situation --------------------------------------------------------------------------------- 70 8.4.2 Nutrition security situation --------------------------------------------------------------------------- 74 8.4.3 Main factors in food and nutrition insecurity ---------------------------------------------------- 74
8.5 Syria ----------------------------------------------------------------------------------------------------------------- 76 8.5.1 Food security situation --------------------------------------------------------------------------------- 76 8.5.2 Nutrition security situation --------------------------------------------------------------------------- 77 8.5.3 Main factors in food and nutrition insecurity ---------------------------------------------------- 78
9 Food insecurity implications of the 2015 El Niño event -------------------------------------------------- 80
10 BIBLIOGRAPHY------------------------------------------------------------------------------------------------------- 90

7
ABBREVIATIONS
ACTED Agency for Technical Cooperation and Development
CAADP Comprehensive Africa Agriculture Development Programme
CADC Central American Dry Corridor
CAR Central African Republic
CDR Crude Death Rate
CFSS Comprehensive Food Security Survey
CFSAM Crop and Food Security Assessment Mission
CFSME Comprehensive Food Security Monitoring Exercise
CFSVA Comprehensive Food Security and Vulnerability Assessment
CH Cadre Harmonisé
CILSS Comité permanent Inter-Etats de Lutte contre la Sécheresse dans le Sahel (Permanent
Interstate Committee for Drought Control in the Sahel)
DG DEVCO Directorate-General for International Cooperation and Development - EuropeAid
DHS Demographic and Health Survey
DPRK Democratic People´s Republic of Korea
ECDC European Centre for Disease Prevention and Control
EC-JRC European Commission - Joint Research Centre
ECMWF European Centre for Medium-Range Weather Forecasts
EFSA Emergency Food Security Assessment
EMDHS Ethiopia Mini Demographic and Health Survey
EPHS Eritrea Population and Health Survey
EU European Union
EVD Ebola Virus Disease
FAO Food and Agriculture Organization of the United Nations
FCS Food Consumption Score
FEWS NET Famine Early Warning System NETwork
FSNAU Food Security and Nutrition Analysis Unit (Somalia)
FSNMS Food Security and Nutrition Monitoring Survey
FSSA Food Security and Sustainable Agriculture
GAM Global Acute Malnutrition
GDP Gross Domestic Product
GIEWS Global Information and Early Warning Systems
GNAIP Gambia National Agricultural Investment Plan
GPGC Global Public Goods and Challenges Programme
GTP Growth and Transformation Plan
8
HABP Household Asset Building Programme
HNO Humanitarian Needs Overview
IDPs Internally Displaced Peoples
IGC International Growth Centre
IMF International Monetary Fund
IPC Integrated Food Security Phase Classification
MAM Moderate Acute Malnutrition
MDGs Millennium Development Goals
MICS Multiple Indicator Cluster Surveys
MIRA Multi-Cluster/Sector Initial Rapid Assessment
NDVI Normalized Differentiated Vegetation Index
NEPAD New Partnership for Africa’s Development
OCHA United Nations Office for the Coordination of Humanitarian Affairs
PSNP Productive Safety Net Programme
RRM Rapid Response Mechanism
SAF Sudanese Armed Forces
SAM Severe Acute Malnutrition
SHARE Supporting the Horn of Africa’s Resilience
SLA-AW Sudan Liberation Army - Abdul Wahid
SLA-MM Sudan Liberation Army - Minni Minnawi
SLDHS Sierra Leone Demographic and Health Survey
SMART Standardized Monitoring & Assessment of Relief and Transition
SMS Security Monitoring Survey
SNNPR Southern Nations, Nationalities and Peoples’ Region
SPLM-N Sudanese People’s Liberation Movement - North
SSHHS South Sudan Household Health Survey
U5DR Under-Five Death Rate
UN United Nations
UNCHR United Nations High Commissioner for Refugees
UNDP United Nations Development Programme
UNICEF United Nations International Children's Emergency Fund
USAID United States Agency for International Development
VDCs Village Development Committees
WASH Water, Sanitation and Hygiene
WFP World Food Programme
WHO World Health Organization

9
Executive summary
This report provides a global overview of the food insecurity situation in global food crisis hotspots
due to different crises and natural disasters, to support the programming of the Pro-resilience Action
(PRO-ACT) 2016 funding mechanism, a component of the Global Public Goods and Challenges
(GPGC) thematic programme of the European Union. The needs assessment consists of estimating the
number of food-insecure people in countries that have been affected by a food crisis in 2015 based
mainly on publicly released reports. The table below summarises the available data as in January 2016
in 70 countries analysed for this report. In a few cases (Democratic Republic of the Congo, Nigeria
and Cameroon), the numbers only relate to particular areas within the country, and are therefore not
representative of the national level. Great efforts have been made to harmonise the approaches across
countries. However, as the input from the data sources may differ significantly across countries, the
final figures may not correctly represent the current situation in the field.
Country
Population in food crisis (IPC1 Phase 3 or higher)
Population in stressed situation (IPC1 Phase 2)
Total food-insecure population (IPC1 Phase 2 or higher)
Dominant risk factor in 2015
Number (million)
% of total population
Number (million)
% of total population
Number (million)
% of total population
Afghanistan 2.500 7.7 7.800 24.0 10.300 31.6 Conflict
Angola 1.169 6.0 0.252 1.3 1.421 7.2 Drought - El Niño
Bangladesh 1.200 0.7 30.592 18.0 31.792 18.7 Socioeconomic
Benin 0.115 1.1 1.703 16.3 1.818 17.4 Socioeconomic
Bolivia 0.300 2.8 0.700 6.5 1.000 9.3 Drought - El Niño
Burkina Faso 0.126 0.7 1.640 8.7 1.765 9.3 Socioeconomic
Burundi 0.460 4.3 3.540 33.0 4.000 37.2 Conflict
Cameroon* 0.329 5.0 1.186 18.0 1.515 23.0 Conflict and Refugees
Cape Verde 0.012 2.1 0.063 11.5 0.074 13.6 Socioeconomic
Central African Republic
1.538 28.5 0.780 14.5 2.318 43.0 Conflict
Chad 0.461 4.0 2.366 20.3 2.827 24.3 Conflict
Colombia Drought - El Niño
Congo 0.086 1.8 0.437 9.2 0.523 11.0 Socioeconomic
Côte d'Ivoire 0.218 0.9 2.023 8.7 2.241 9.6 Socioeconomic
Cuba Drought - El Niño
Democratic Republic of Congo*
4.456 9.4 6.500 13.7 10.956 23.1 Conflict
Djibouti 0.227 27.5 0.082 9.8 0.309 37.3 Drought - El Niño
DPRK 4.747 19.0 5.996 24.0 10.743 43.0 Drought - El Niño
1 The reference to the IPC Phase is indicative of the food insecurity severity. IPC Phase descriptions can be found here:
http://www.ipcinfo.org/fileadmin/user_upload/ipcinfo/docs/IPC-Manual-2-Interactive.pdf. Many of the countries included in the table
do not conduct IPC analyses. When IPC analyses are available, the numbers are used. When IPC analyses are not available, the
numbers of people in each column of the table are derived from the available information, taking into account the IPC Phase
descriptions and thresholds defined in the IPC reference table for food security indicators.

10
Country Population in food crisis (IPC Phase 3 or higher)
Population in stressed situation (IPC1 Phase 2)
Total food-insecure population (IPC1 Phase 2 or higher)
Dominant risk factor in 2015
Number (million)
% of total population
Number (million)
% of total population
Number (million)
% of total population
Ecuador Floods - El Niño
Egypt 14.300 16.2 14.300 16.2 Conflict
El Salvador 1.400 22.8 0.100 1.6 1.500 24.4 Drought - El Niño
Eritrea Drought - El Niño
Ethiopia 10.200 10.3 10.200 10.3 Drought - El Niño
Gambia 0.054 2.7 0.373 19.0 0.427 21.7 Socio-economic
Ghana 0.333 1.3 4.724 17.9 5.058 19.2 Socio-economic
Guatemala 2.000 13.4 0.100 0.7 2.100 14.1 Drought - El Niño
Guinea Bissau 0.003 0.2 0.072 4.2 0.075 4.3 Socioeconomic
Guinée Conakry
0.041 0.3 1.312 11.1 1.353 11.5 Ebola
Haiti 1.000 9.9 2.500 24.7 3.500 34.6 Drought - El Niño
Honduras 0.720 8.2 1.000 11.4 1.720 19.7 Drought - El Niño
Iraq 2.400 6.5 2.680 7.2 5.080 13.7 Conflict
Jordan 0.159 2.0 0.534 6.6 0.692 8.5 Refugees
Kenya 0.475 1.0 0.625 1.4 1.100 2.4 Floods - El Niño
Lebanon 0.259 4.2 0.715 11.6 0.974 15.7 Refugees
Lesotho 0.650 33.4 0.650 33.4 Drought - El Niño
Liberia 0.017 0.4 0.156 3.7 0.173 4.1 Ebola
Lybia 0.170 2.7 1.200 18.7 1.370 21.4 Conflict
Madagascar 0.500 2.1 1.400 5.9 1.900 8.0 Drought - El Niño
Malawi 2.833 15.8 2.833 15.8 Drought - El Niño
Mali 0.119 0.7 1.760 10.4 1.878 11.1 Socioeconomic
Mauritania 0.149 4.1 0.626 17.4 0.775 21.5 Socioeconomic
Mozambique 0.176 0.7 0.575 2.3 0.751 3.0 El Niño
Myanmar 1.700 3.2 1.700 3.2 Floods - El Niño
Namibia 0.370 16.7 0.370 16.7 Drought - El Niño
Nepal 0.529 1.7 1.400 4.4 1.929 6.1 Earthquake
Nicaragua 0.500 8.5 0.500 8.5 1.000 16.9 Drought - El Niño
Niger 0.656 3.6 4.792 26.6 5.448 30.2 Socioeconomic
Nigeria* 5.260 10.8 9.832 20.3 15.092 31.1 Conflict
Pakistan 1.500 0.8 3.600 1.8 5.100 2.6 Socioeconomic
Palestinian territories
0.0 1.600 37.2 1.600 37.2 Conflict
Papua New Guinea
1.750 26.2 0.750 11.2 2.500 37.5 Drought - El Niño
Peru Drought - El Niño

11
Country Population in food crisis (IPC Phase 3 or higher)
Population in stressed situation (IPC1 Phase 2)
Total food-insecure population (IPC1 Phase 2 or higher)
Dominant risk factor in 2015
Number (million)
% of total population
Number (million)
% of total population
Number (million)
% of total population
Senegal 0.031 0.2 1.558 11.1 1.589 11.4 Socioeconomic
Sierra Leone 0.421 7.2 1.571 26.7 1.991 33.9 Ebola
Somalia 0.855 8.1 2.300 21.7 3.155 29.7 Conflict
South Africa 13.500 25.2 13.500 25.2 Drought - El Niño
South Sudan 2.835 23.5 4.135 34.3 6.970 57.9 Conflict
Sudan 4.000 10.5 12.480 32.7 16.480 43.2 Conflict
Swaziland 0.201 14.0 0.201 14.0 Drought - El Niño
Syria 6.300 36.9 2.400 14.1 8.700 51.0 Conflict
Tajikistan 0.659 8.0 2.300 28.1 2.959 36.1 Socioeconomic
Tanzania 0.424 0.8 0.424 0.8 Drought - El Niño
Timor Leste 0.220 17.9 0.272 22.1 0.492 40.0 Drought - El Niño
Togo 0.066 0.9 1.140 15.1 1.206 16.0 Socioeconomic
Uganda 0.295 0.8 0.470 1.3 0.765 2.1 Socioeconomic
Vanuatu 0.166 61.0 0.166 61.0 Floods - El Niño
Venezuela Drought - El Niño
Yemen 7.600 25.6 6.800 22.9 14.400 48.4 Conflict
Zambia 0.799 5.3 0.799 5.3 Drought - El Niño
Zimbabwe 2.800 19.7 2.800 19.7 Drought - El Niño
*: Not representative of the national level

12
1 Background
In 2012, the EU made a policy commitment2 to focus interventions on building the resilience of
vulnerable communities by better targeting the root causes of food insecurity both in the geographical
and thematic instruments of the new Multi-annual Financial Framework. This includes component 3
“Supporting the poor and food insecure to react to crises and strengthen resilience” of the Food
Security and Sustainable Agriculture (FSSA) thematic instrument under the Global Public Goods and
Challenges Programme (GPGC). This FSSA resilience-building thematic mechanism aims to ensure
the complementarity of instruments for high-impact aid. It has an indicative budget of €525 million
over the 2014-2020 period. The specific actions and the list of countries that would receive support
are decided every year based on the following criteria: i) evidenced-based needs assessment (number
of food-insecure people); ii) nature of the food and nutrition crisis; iii) capacity and complementarity
of instruments; iv) other factors of vulnerability, including political considerations.
This report addresses the two first criteria (needs assessment and nature of the crises) in the
framework of the 2016 financial programming of the Pro-resilience Action (PRO-ACT). The principle
is to evaluate the number of people who were in a food insecurity situation in the previous year (2015
for this exercise), i.e. in Phase 2 and above of the Integrated Food Security Phase Classification (IPC),
and to identify as far as possible the main causes of food insecurity in selected countries. The PRO-
ACT interventions complement the humanitarian interventions of the previous year to help the
community rebuild their livelihoods and improve their resilience to future shocks.
The needs assessment is conducted in two phases: (i) identification of the main areas of concern
(countries and regions) based on a rapid review of known crises; and (ii) detailed analysis of each
selected country. The needs assessment is global and aims to include all countries that have been
affected by a food crisis in 2015. The origin of the food crisis may be a particular shock or disaster
such as an earthquake, cyclone, drought, etc. and/or protracted crises, namely prolonged armed
conflicts. Countries that are chronically vulnerable to food crises and have large populations of food-
insecure people are included. A total of 70 countries were identified, estimating the number of food-
insecure populations classified (wherever possible) according to two categories of IPC phases.
Twenty countries were then further analysed, and a detailed narrative on their situations is provided in
this report. They are countries with discrepancies in their assessments from different sources and
countries with complex situations that combine several risk factors, for instance countries with a very
low socioeconomic development that are also subject to violent conflicts. The following countries
2 COM(2012)586 final “The EU approach to Resilience: Learning from Food Security Crises”

13
were eventually selected for the detailed analysis: Somalia, Ethiopia, Eritrea, Sudan and South Sudan
in the Horn of Africa; Gambia, Guinea, Liberia and Sierra Leone in West Africa; the Central African
Republic (CAR); Yemen and the Democratic People’s Republic of Korea (DPRK) in Asia; Haiti and
the countries of the Central American Dry Corridor (Guatemala, Honduras, Nicaragua); and Papua
New Guinea. The types of crises affecting each of those countries are described in the respective
sections. In addition, a dedicated section summarises the impacts of the 2015 El Niño episode on food
security in countries most affected and of interest to EU Food Security programmes. The number of
countries that were analysed increased from circa 40 for the previous analysis in January 2015 to 70 in
this edition of the report (January 2016), mainly because of the impact of El Niño.
2 Methodology
The IPC Phase descriptions (Table 1) are used as a guide to classify populations according to their
severity of food insecurity. When IPC or Cadre Harmonisé analyses were available, the numbers were
taken directly from these reports. In a few IPC analyses, the breakdown of food-insecure populations
into the different phases was not available. For these, we estimated the share of each phase based on
the classification map and the population of each administrative unit represented on the map. Where
IPC or Cadre Harmonisé analyses are not available, the numbers of people in each IPC Phase were
derived from the available information, taking into account the IPC Phase descriptions and thresholds
defined in the IPC reference table for food security indicators. It is always difficult to combine data
from several non-standardised sources. The final estimates provided in this report try to make best use
of all the information that was available at the time of writing, i.e. end of January 2016. Sources and
ancillary data (satellite imagery, meteorological data, food price data, etc.) are triangulated wherever
conflicting assessments were reported.
Regarding the food security assessment, this situation analysis mainly used information from IPC
Acute analyses, FEWS NET, SADC VAC, FAO, WFP and JRC food security outlook and bulletins,
and from the CILSS Cadre Harmonisé reports. Compared to the previous report (Nkunzimana et al.,
2015), this report benefited from important contributions by the FAO and the WFP which provided a
lot of data and reviewed the first manuscript. Several EU delegations also contributed to the data
collection with reports from national institutions. Therefore, the assessment has a broad basis in terms
of data and information collection.

14
Table 1: IPC Phase descriptions
Phase
Name Phase description Priority response objective
Phase 1
Household (HH) group is able to meet
essential food and non-food needs without
engaging in atypical, unsustainable
strategies to access food and income,
including any reliance on humanitarian
assistance.
Resilience building and
disaster risk reduction
Phase 2
Even with humanitarian assistance, HH
group has minimally adequate food
consumption but is able to afford some
essential non-food expenditures without
engaging in irreversible coping strategies.
Disaster risk reduction,
protection of livelihoods
Phase 3
Even with humanitarian assistance,
HH group has food consumption gaps with
high or higher than usual acute malnutrition;
OR
HH group is marginally able to meet
minimum food needs only with accelerated
depletion of assets that will lead to food
consumption gaps.
Urg
ent
Act
ion
req
uir
ed
Protect livelihoods, reduce
food consumption gaps and
reduce acute malnutrition
Phase 4
Even with humanitarian assistance,
HH group has large food consumption gaps
resulting in very high levels of acute
malnutrition and excess mortality
OR
HH group has extreme loss of livelihood
assets that will lead to large food
consumption gaps in the short term.
Save lives and livelihoods
Phase 5
Even with humanitarian assistance,
HH group has an extreme lack of food
and/or basic needs even with full
employment of coping strategies. Starvation,
death and destitution are evident.
Prevent widespread death and
total collapse of livelihoods
Source: adapted from IPC Manual version 2.0.
http://www.ipcinfo.org/fileadmin/user_upload/ipcinfo/docs/IPC-Manual-2-Interactive.pdf.
The nutrition assessment focuses on the nutritional status of children under five years of age. It is
common to focus on this group as it is among the most vulnerable and represents a critical
development period during which undernutrition might have long-term consequences. We are aware
that a complete assessment of nutrition should include an analysis of other nutrition indicators such as
biochemical markers or clinical variables, and target other vulnerable groups such as women of
reproductive age. However, in order to provide a consistent snapshot of the 20 countries studied, we
decided to focus the analysis on the indicators of the nutritional status of preschool-age children.

15
Unless stated otherwise, stunting or chronic malnutrition is identified as occurring when the ‘height
for age’ Z score is more than two standard deviations (SDs) below that of the WHO Standards
reference population; and wasting or global acute malnutrition (GAM), moderate acute malnutrition
(MAM), and severe acute malnutrition (SAM) are identified as occurring when the ‘weight for height’
Z scores are more than 2, between 2 and 3, and more than 3 SDs below those of the reference
population, respectively. The current international thresholds used for classifying the status of
nutrition at population level are presented in table 2.
Table 2: Thresholds for classifying the status of nutrition in a population
Stunting Wasting
<20%: Acceptable
20-30%: Poor
30-40%: Serious
>40%: Critical
< 5%: Acceptable
5-10%: Poor
10-15%: Serious
>15%: Critical
Although the latest data available for some of the countries are not recent and cannot be used as a
reference for the current situation, we considered it to be pertinent to include them in order to
highlight areas that are particularly vulnerable to nutrition crises.
The country sections are grouped by geographic area since food insecurity factors are often similar
across neighbouring countries, and in order to respect the usual geographic grouping in European
Commission (EC) projects. Countries affected by armed conflicts, the Ebola virus crisis and by the
2015 El Niño phenomenon were grouped thematically. The reference period for the analysis is from
January 2015 to December 2015. However, some situations may have roots in events that occurred in
previous years. Reference to such events is made wherever relevant, and the expected evolution in
2016 is discussed.

16
3 Global overview of food crises
At the end of 2015, several food crises were triggered by extreme climate events due to the El Niño
phenomenon. Severe droughts affected several countries in the Horn of Africa, southern Africa,
eastern and southern Asia, South America, Central America and the Caribbean. During the 2015
summer period, drier-than-average conditions were also recorded in the Pacific Islands. Heavy rains
and floods affected some areas of Southeast Asia and the Pacific Islands. The impact of the drought
due to El Niño is forecast to continue throughout 2016, particularly in Southern Africa and in
Southern and Central America. Countries of the Central American Dry Corridor (Honduras,
Guatemala, Nicaragua, El Salvador) and Haiti and Cuba are among those most affected by drought in
Central America and the Caribbean. A large part of southern Africa was hit by a severe drought at the
beginning of the 2015-2016 crop season, which led to a state of emergency in several provinces of
South Africa, in Zimbabwe and Lesotho. Malawi, Angola and Namibia were also badly affected, as
were the southern parts of Mozambique and Madagascar.
In addition to climate events, armed conflicts continue to put tens of millions of people into food
crises. New food crisis hotspots emerged because of the intensification of armed conflicts in the
Middle East, namely in Syria and in neighbouring countries where displaced people struggle to access
sufficient food. The escalation of the conflict in Yemen has dramatically exacerbated food insecurity
in the country, which was already very fragile. The situation remains of high concern in countries
affected by prolonged armed conflicts such as Somalia, Sudan, South Sudan, the Central African
Republic (CAR), the Democratic Republic of the Congo (DRC) and Afghanistan (Figure 1). Internally
displaced persons and refugees who have fled to neighbouring countries are among the most affected.
Although the 2015 crop season was generally good in most of West Africa, a large part of the
population remains food insecure due to structural vulnerabilities. The number of food-insecure
people remains high, and was added to by the populations affected by the conflict in northern Nigeria
and in the area around Lake Chad. The situation in Sierra Leone, Liberia and Guinea, the three
countries that were most affected by the Ebola epidemic, has improved compared to last year (January
2015).
The hotspots of severe food crises (IPC Phase 3 or higher) that emerge are mainly in Africa - in the
Horn of Africa (Ethiopia, Somalia, Sudan and South Sudan), Central Africa (CAR and DRC),
Zimbabwe, Malawi, Lesotho and Angola in southern Africa, and Sierra Leone, Nigeria and Niger in
West Africa (Figure 2). Eritrea does not appear on the map because of a lack of data on the actual
number of people affected by the food crisis, although the crop assessment based on satellite imagery
indicates a significant reduction in crop production for the main agricultural season in 2015.
17
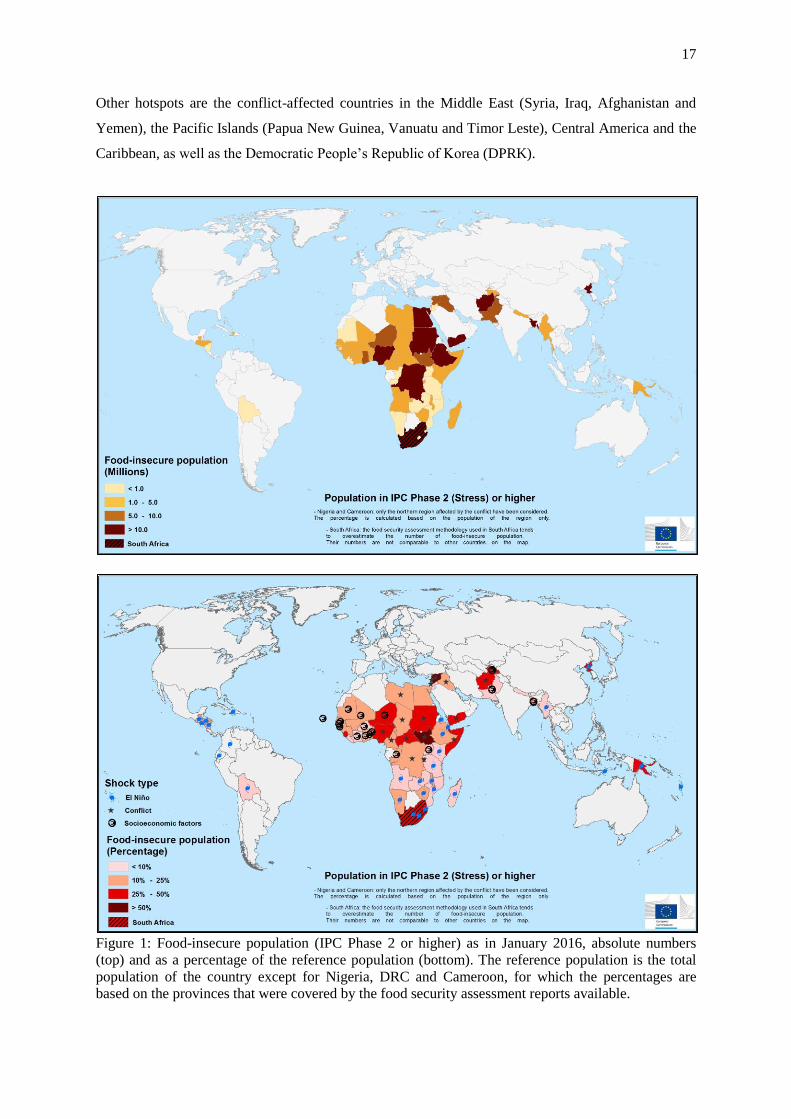
Other hotspots are the conflict-affected countries in the Middle East (Syria, Iraq, Afghanistan and
Yemen), the Pacific Islands (Papua New Guinea, Vanuatu and Timor Leste), Central America and the
Caribbean, as well as the Democratic People’s Republic of Korea (DPRK).
Figure 1: Food-insecure population (IPC Phase 2 or higher) as in January 2016, absolute numbers
(top) and as a percentage of the reference population (bottom). The reference population is the total
population of the country except for Nigeria, DRC and Cameroon, for which the percentages are
based on the provinces that were covered by the food security assessment reports available.

18
Figure 2: Population in food crisis (IPC Phase 3 or higher) as per January 2016, absolute numbers
(top) and as a percentage of the reference population (bottom). The reference population is the total
population of the country except for Nigeria, the DRC and Cameroon, for which the percentages are
based on the provinces that were covered by the food security assessment reports available.

19
4 Horn of Africa
Food and nutrition security in the Horn of Africa are threatened by one of the strongest El Niño
weather phenomena ever seen in the past 20 years. Over 15 million people in the region are food
insecure, including about two million internally displaced persons (IDPs) and 1.7 million refugees.
Among them, about 10.2 million and 3.2 million people are in need of emergency food assistance in
Ethiopia and Somalia, respectively. Drier-than-average conditions are also affecting food security in
Sudan, Eritrea, Somalia and eastern South Sudan. The March to September rains were the lowest (in
50 years in central and eastern Ethiopia. The situation in Eritrea might be critical because the main
crop season (July-September) was badly affected by a drought that hit the most productive regions
(EC-JRC report, October 2015).
Localised floods have been reported in parts of Ethiopia (OCHA, 26 October 2015). In contrast to the
beginning of the year, the rains were generally favourable during the period from October to
December 2015 for the main cropping areas of the region (GEOGLAM, February 2016). Moisture
stress was still observed in marginal agricultural areas in south-eastern Kenya, parts of southern
Somalia and parts of northern Tanzania.
Since 2011, the EU has pledged over €1 billion in humanitarian aid to the region: €108.5 million in
2013, €104 million in 2014 and, so far, €93 million in 2015. This funding aimed primarily to provide
food assistance, health, nutrition, clean water, sanitation and shelter to affected populations (ECHO
Factsheet).
4.1 Somalia
Somalia has been frequently described using terms such as ‘state failure’, ‘anarchy’, and ‘warlord
economy’. Over the past two decades, violent conflicts have occurred all over the country, with the
most recent conflict outbreaks occurring in the central and southern parts and, in particular, in the Bay
and Hiiraan regions. Those regions, in which the Islamist Al Shabab militia has been active, are also
where food insecurity reportedly has been most acute after the intense and destructive droughts of
2011 (IFPRI 2014).
4.1.1 Food security situation
According to the October 2015 reports of the Food Security and Nutrition Analysis Unit (FSNAU)
and Global Information and Early Warning System (GIEWS), about 855 000 people were in Crisis
and Emergency (IPC Phases 3 and 4) through December 2015. Internally displaced persons (IDPs)

20
constitute 68% of the total number of people in Crisis and Emergency, followed by rural (25%) and
urban (7%) populations. Furthermore, approximately 2.3 million additional people were classified as
Stressed (IPC Phase 2) through December 2015. The most food-insecure people are in the Middle
Shabelle region and agropastoral areas in the Awdal, Hiraan, and Middle Juba regions.
According to FEWS NET (November 2015 report), food security is expected to improve between
January and March 2016 as a result of increased livestock production and the anticipated above-
average Deyr (secondary rainy season) harvest in January/February 2016. Moreover, some pastoral
areas in southern and northern regions are expected to improve to Minimal (IPC Phase 1).
Nevertheless, a majority of the country remains Stressed (IPC Phase 2). Riverine areas in Middle
Shabelle are also expected to remain in Crisis (IPC Phase 3) through December, as heavy rainfall,
driven in part by the ongoing El Niño phenomenon, led to flooding that delayed planting, destroyed
crops, and prevented households from accessing markets. Agropastoral areas in Awdal and Woqooyi
Galbeed will likely have had below-average Gu/Karan (first rainy season) long-cycle crop production
in November/December as a result of a drier-than-usual April to July. These areas are expected to
remain in Crisis (IPC Phase 3), even after the harvest. Although the Guban Pastoral livelihood zone
received atypical, moderate rainfall in October and November, which increased pasture and water
availability, poor households in this region will remain in Crisis (IPC Phase 3) through to March, but
only with humanitarian assistance. This is due to very dry conditions in 2014 and 2015, which
resulted in low livestock production, reduced incomes due to low livestock values, and unusual
livestock losses during the drought in 2015, likely in part due to the ongoing El Niño phenomenon.
Normalized Difference Vegetation Index (NDVI) anomalies (Figure 3) are close to average apart from
some areas in the North (Awdal) and some areas of concern in the rain-fed maize agro-pastoral
livelihood zone of lower Shabelle, the Sorghum High potential of Shabelle regions and some pockets
in pastoral areas of Gedo, and Lower and Middle Juba (in the South) which show signs of stressed
vegetation.

21
Figure 3: Monthly vegetation conditions (NDVI) compared to the historical average (1999-2014).
Data source: SPOT-VEGETATION/ProbaV.
4.1.2 Nutrition security situation
An estimated 214 650 children under the age of five in Somalia are suffering from acute malnutrition,
39 650 (18.5%) of whom are severely malnourished. As more children become malnourished through
the end of the year, the number of acutely and severely malnourished children is expected to increase,
respectively, to 343 440 and 63 440 (based on incidence).
The nutrition survey conducted by FSNAU during the Gu season of 2015 indicated a median GAM
rate of 13.6% and a median SAM rate of 2.3% at national level, with prevalence exceeding the
emergency threshold of 15% in livelihoods of the South Central Region (North and South Gedo,
Mataban, Beletweyene, Coastal Deeh and Cowpea Belt districts).
Critical levels of GAM prevalence (≥15%) were also recorded in two out of six urban areas surveyed
during 2015 Gu (18.4% in Bari and 15.7% in Nugal) while Serious GAM prevalence (above 10%)
was noted in urban Mogadishu (10.5%) and Alert (5-9.9%) in urban Sool and urban Kismayo.

22
The overall stunting rate in Somalia was 12%, although there were major differences between zones:
15% in southern and central areas, and 1% in the North-East.
Out of 13 IDP settlements surveyed during 2015 Gu season, five showed Critical levels of GAM:
Dhobley, Baidoa, Dolow Garowe and Galkayo. It is of concern that acute malnutrition levels in three
of these IDP settlements (Dolow, Garowe and Galkayo) have remained at Critical levels over the past
two years. The nutrition situation among Dollow IDPs has also deteriorated since December 2014
with an increase in the levels of GAM, a near doubling of the Crude Death Rate (CDR) as well as
increases in the Under Five Death Rate (U5DR) and morbidity levels.
Figure 4: Nutrition situation in Somalia in July 2015
The livelihoods and populations identified by FSNAU as priorities (hotspots) for nutrition
programming are the most affected IDPs (Dollow, Baidoa, Dhobley, Garowe, Galkayo), as well
as the Belwtweyne and Mataban districs, urban Bari and the Coastal Deeh and Cowpea Belt
livelihood zones.

23
The nutrition situation in the drought affected areas of Northwest agro pastoral and Gubal
Pastoral livelihoods as observed during the Gu-season survey was expected to deteriorate from
Serious to Critical levels of acute malnutrition as the drought conditions were expected to worsen
until Deyr rains are fully established in October 2015. Deterioration of the nutrition situation was
also expected among Bossaso IDPs in the North-East and in Bay Agro-pastoral and in Middle
and Lower Shebelle livelihoods in the South (see Figure 5).
Figure 5: Projected Nutrition Situation, August-October 2015
4.1.3 Main factors in food and nutrition insecurity
Besides conflict and civil insecurity, food insecurity in 2015 was highly influenced by erratic rainfall
in the main cropping areas of southern Somalia, including agro-pastoral areas in the Awdal, Hiraan,
and Middle Juba regions. Flooding in some riverine areas of the Middle Shabelle region and agro-
pastoral areas caused a decline of overall cereal production.
The high rates of acute malnutrition among children can be attributed to food insecurity, but also to
suboptimal child-feeding practices, low coverage of health services, and lack of access to clean water
supply, all related to water-borne diseases that further deteriorate the nutritional status.

24
4.2 Ethiopia Ethiopia, the second most populous country in Africa, has achieved impressive economic growth over
the past decade. However, failed spring/Belg (mid-February-May 2015) rains compounded by the El
Niño weather conditions that affected summer Kiremt (June-October 2015) rains caused havoc on
planting and livestock production across the country, and resulted in a severe drought. This created a
major problem for agriculture, which generates about half of the country's income. Figure 6, which
illustrates the NDVI from July to September 2015 (Kiremt season) compared to its respective long-
term average (1999-2014), shows negative vegetation anomalies due to the dry spell. The hardest-hit
areas are Afar, the Sitti (Shinile) zone of the Somali region, Southern Tigray, Eastern Amhara, East of
the Southern Nations, Nationalities and People’s (SNNP) region, East and West Hararge, Arsi and
West Arsi; and lower Bale zones of the Oromia regions. Pastures and water resources are also
unusually low in the central and eastern Oromo region, and in the northern Tigray and Amhara
districts.
Figure 6: Monthly vegetation conditions (NDVI) compared to the historical average (1999-2014) and
zoom of the affected area. Data source: SPOT-VEGETATION/ProbaV.
Dry conditions have led to poor livestock body conditions and a massive number of unusual livestock
deaths in pastoral and agro-pastoral communities. For instance, according to the FAO (October 2015

25
reports), El Niño-driven livestock deaths in an IDP camp in Ethiopia’s Somali region, were severe in
the past six months. In northern pastoral areas, little pasture, forage, or water is available. More than
200 000 livestock have died in southern Afar and the Somali region’s Sitti zone. More than 13 000
households have lost all livestock and migrated to informal camps in the Sitti zone (FEWS NET,
Ethiopia Food Security Alert, 4 December 2015). The situation in the Afar and Dire Dawa regions is
of great concern, in particular in the districts of Amibara, Milesso and Shinile.
4.2.1 Food security situation
The El Niño-driven drought has greatly expanded food insecurity and malnutrition, and devastated
livelihoods of the poorest and vulnerable people across the country, including those in areas such as
Aris and West Arsi zones in the Oromia region that normally produce a surplus. The government of
Ethiopia has recently appealed to its international partners for emergency food assistance to feed 10.2
million people and for special nutritional programmes for more than 2.1 million, including 400 000
severely malnourished children3. In addition, over 8 million vulnerable and food-insecure people
receive support under the Productive Safety Net Programme (PSNP). According to UN reports, the
number of people in need of emergency food assistance may reach 15 million by 2016. The number of
areas in need of urgent humanitarian support (hotspot priority 1: IPC Phase 3 and above) have
quadrupled from 40 woredas in February to 186 woredas in December 2015, reflecting the
deteriorated humanitarian context (OCHA, weekly Humanitarian Bulletin, Ethiopia, 7 December
2015).
3 UN, Ethiopia: Government and humanitarian partners launch the Humanitarian Requirements Document
(HDR) for 2016, December 11, 2015, Addis Ababa.

26
Figure 7: Current food security outcomes, October 2015. Source: FEWS NET, October 2015
According to OCHA (October – December reports), following drought-driven crop failure, market
prices have already started to shift, with the price of food staples such as lentils 73% higher than at the
same time last year (Addis Ababa, August 2015). By contrast, the price of livestock has fallen by as
much as 80% (northern Somali region, August 2015). As a result of these price changes, the
purchasing power of drought-affected smallholder farmers is threatened as they can buy less and less
with the money that they have.
Water shortages are affecting an important part of the population in the woredas that were affected by
drought in 2015. According to the Humanitarian Requirement Document (Government of Ethiopia
and Partners, December 2015), the 10.2 million food-insecure people are also affected by water
shortages.
The federal government of Ethiopia and the regional state authorities have started an outreach
programme for the affected people, through which they have allocated US$192 million for food aid,
water transport, animal feed and other assistance, and appealed for US$596 million in assistance from
the international community for the remainder of 2015. International organisations, donors and NGOs
pledged about US$432 million for humanitarian assistance. Moreover, in its 2nd emergency meeting
on 27 November 2015, the Ethiopian Council of Ministers approved a draft bill for upgrading the
Government’s Disaster Risk Management and Food Security Sector (DRMFSS) to establish a
National Disaster Risk Management Commission (NDRMC), led by a Commissioner. The objectives
of the NDRMC are to prevent disaster by tackling their root causes, build the capacity necessary to

27
reduce the impact of disasters (i.e. preparedness) and ensure the timely arrival of the necessary
assistance to victims of disaster (i.e. emergency response). El Niño also brought unseasonal rains to
agricultural areas of Ethiopia’s central highlands, which could increase postharvest losses. According
to OCHA and FEWS NET reports (October 2015), the water level of the Wabishabelle River in the
Somali region has been rising and has broken its banks in the East Imy woreda, and communities
along the river bank have been engulfed by water. OCHA also warns that above-average rains could
continue until early 2016. According to Disaster Prevention and Preparedness Bureau reports of the
Somali region, more than a thousand households from Diray Kebele in the East Imy woreda are taking
refugees in East Imy town. On the other hand, enhanced rainfall will lead to good pasture and crop
development, helping to further rebuild the livelihoods of pastoralists in the southern Somali region.
As a result, livestock body conditions will improve, and livestock production and productivity are
likely to increase. These will increase food and income from livestock. Therefore, with of
humanitarian assistance, a large majority of households in the southern Somali region will have be to
meet their food and non-food needs.
4.2.2 Nutrition security situation
The number of children with Severe Acute Malnutrition (SAM) admitted into therapeutic feeding
programmes at national level in 2015 was higher than that of year 2014, and as of June 2015 the
admissions were increasing every month, reaching 29 722 in April 2015 (Figure 8).
Figure 8: National admission trend for SAM in Ethiopia (2011-2015). Source: Ethiopian Emergency
Nutrition Cluster
The most affected regions are Oromia and the SNNPR, with Oromia accounting for 47% of the
Community-Based Management of Acute Malnutrition (CMAM) admissions and SNNPR for 37%.
As of June 2015, the trend of admissions was increasing in both regions (Figure 9). The most affected
zones from the Oromia region are Arsi, Bale, Borana, East Hararghe, West Harargeh and West Arsi,

28
while the most affected zones of the SNNPR are: Hawassa Zuria, Gedeo, Gurage, hadiya, Kembata
Tembaro, Segen Hizboch, Disama, Silte and Halaba Special woreda.
Figure 9: Admission trends for SNNPR and Oromia regions (2011-2015).Source: Ethiopian
Emergency Nutrition Cluster Unit.
The Amhara and Somali regions are also affected by the poor Belg rains, but the number of
admissions of SAM children is not as high as in previous years. In July 2015, two nutrition surveys
were conducted by GOAL and Action Contre la Faim (ACF) in Gambella (Jikawo woreda) and Hareri
(Hundene woreda), and the situation in Jikawo was classified as Serious, with 11.7% of SAM, and
Normal in Hundene. Out of 18 surveys supported by UNICEF in different woredas of the Tigray,
Afar, Amhara, Oromia and SNNPR regions, only one Afar woreda reported critical values for SAM
(15%), while 9 woredas of Afar, Amhara, Oromia and the SNNPR rated the malnutrition situation as
Serious, with GAM values in the 10-15% range (Ethiopian Humanitarian Situation Report, June-July
2015). Malnutrition is estimated to affect 2.1 million children (Government of Ethiopia and partners,
December 2015), 1.7 million of whom are moderately acutely malnourished and 0.4 million severely
malnourished.
4.2.3 Main factors in food and nutrition insecurity
Drought due to the poor Belg (first rainy season) and Meher (second and main rainy season) rains
caused by El Niño, followed by crop failure and animal death, are the major factors contributing to
food and nutrition insecurity in the country. El Niño also caused local flooding in some parts of the
country. The events result in high staple food prices, but adversely affected livestock prices. The
shortage of water also compromises the correct functioning of emergency and sustainable Water,
Sanitation and Hygiene (WASH) services, resulting in outbreaks of water-borne diseases that further
deteriorate the nutrition situation.
The influx of refugees from South Sudan and Somalia further fuelled the food insecurity situation in
the country. Since the outbreak of violence in mid-December 2013, approximately 209 000 South

29
Sudanese refugees have entered the country, bringing the total number of refugees and asylum
seekers in Ethiopia to nearly 700 000. In addition, congestion in the Djibouti port, the main entry
point for goods into landlocked Ethiopia, is also slowing the timely distribution of food aid to
beneficiaries.

30
4.3 Eritrea
The Eritrean economy is largely dependent on agriculture, with two-thirds of the population engaged
in subsistence farming and pastoralism. Domestic production meets approximately half of total food
needs in good years and only about a quarter of total demand in bad years.
4.3.1 Food security situation
The country is vulnerable to food insecurity due to economic constraints, civil insecurity as well as
soaring prices of imported food staples, especially cereals. Furthermore, the El Niño weather
phenomena have influenced the pasture and crop production of the country. According to a JRC
Technical Report (October 2015), below-average rainfall in July and the first half of August resulted
in poor crop growth at the beginning of the season. Despite a slight improvement in rainfall in
September, the uneven distribution during the previous months negatively affected crop development
and jeopardised the main harvest of 2015. The lack of rainfall in the current Kremti season resulted in
abnormal vegetation conditions (i.e. negative anomalies) in the main productive areas of the country,
principally in the sub-zobas of La’ealy Gash, Malqui, Mensura, Tesseny, and Homajer in the Gash
Barka zoba, Adil Kuala in the Debub zoba and Gala Nefhi in the Maekel zoba (Figure 10).
Figure 10: Monthly vegetation conditions (NDVI) compared to the historical average (1999-2014).
Data source: SPOT-VEGETATION/ProbaV.

31
4.3.2 Nutrition security situation
In early 2015, UNICEF stated that the nutrition situation is critical in Eritrea, highlighting that without
additional funding it would be unable to support the national response to the country’s continuing
nutrition crisis, or to provide critical WASH services to the population in need. The results of the last
Eritrea Population and Health Survey (EPHS) carried out in 2010 already showed a deterioration in
the nutritional status of children in the country, with stunting rates rising from 43% in 2002 to 50% in
2010, and wasting rates remaining at emergency level (15%) (Figure 11: Trends in children’s
nutritional status in Eritrea: 2002, 2010
Figure 11: Trends in children’s nutritional status in Eritrea: 2002, 2010. Source: EPHS 2010.
Moreover, UNICEF reported at mid-year that the acute malnutrition trends in children under five
years of age had been increasing in all regions. According to UNICEF’s latest country report
(UNICEF January-June 2015), a total of 12 234 children under five suffering from moderate acute
malnutrition (MAM) and 4 098 children under five suffering from severe acute malnutrition (SAM)
were treated at the end of May 2015.
However, there is a scarcity of updated data on the nutrition situation of Eritrea. In order to support
data generation, UNICEF, the WFP and other UN agencies recently helped the government to conduct
a comprehensive nationwide food security and nutrition assessment. The results indicate that the
prevalence of stunting is over 50%.
4.3.3 Main factors in food and nutrition insecurity
El Niño weather phenomena, economic constraints, soaring imported food prices and civil insecurity
that constrain humanitarian interventions are the major contributing factors to food and nutrition
insecurity in the country.
32
5 West Africa
5.1 Countries affected by Ebola in 2014 and 2015: Liberia, Guinea, Sierra Leone.
The impact of the Ebola outbreak on food security is gradually waning. The return to normal is
occurring more quickly in areas that were less affected by the epidemic and more slowly in places that
were worse or longer affected. However, food insecurity is still prevalent in part of the population due
to structural issues and the remaining effects of the Ebola epidemic. The July –September period
corresponds to the lean season in Guinea, Liberia and Sierra Leone. During this period, food security
typically remains a challenge. The situation is expected to have gradually improved with the October
harvest.
Liberia was declared Ebola free on 3 September 2015, but three new cases were confirmed during the
week of 22 November. Sierra Leone was declared Ebola free on 7 November 2015. In Guinea, the
latest positive case was found on 29 October 2015.
5.1.1 Food security situation
The food security situation seems to be improving in Liberia. Minimal food security (IPC Phase 1) is
to be expected from October 2015 (FEWS NET a., 2015) if the harvest is good. This means that less
than 20% of the population will suffer from food insecurity. According to the Cadre Harmonisé
analysis, carried out in November 2015 (CILSS, Nov 2015), less than 1% of the population will be in
Crisis (IPC Phase 3 or more) in the coming year, and around 5 to 10 % will be Stressed (IPC Phase
2).
The situation in Guinea should also have improved with the harvest around October 2015. WFP
monitoring was still showing quite severe levels of food insecurity in August. However, both
FEWS NET and the Cadre Harmonisé technical working group forecast that there would be Minimal
food insecurity (IPC Phase 1) in the country by December 2015. A significant part of the population
(around 15 to 18%) will still face Stress (IPC Phase 2) during the coming year (CILSS, Nov 2015,
FEWSNET c., 2015).
Sierra Leone is making a slower recovery. While most of the country should reach Minimal levels of
food insecurity (IPC Phase 1) by December 2015 thanks to the harvest, more than 20% of the
population in the Moyamba, Kenema and Kailahun districts is expected to face difficulties to meet its
food needs. These areas were classified as Stressed (IPC Phase 2) from October to December 2015 by
FEWS NET (b., 2015). According the November 2015 Cadre Harmonisé analysis (CILSS, November

33
2015), between 5 and 10% of the population were in Crisis (IPC Phase3) and around 30% of the
population were in Stress (IPC Phase 2).
In all three countries, expected improvements are dependent on the harvest. In most places, various
programmes to combat food insecurity, including distribution of food, subsidised sales, and cash and
food for work programmes, have mitigated the impact of the Ebola epidemic on food insecurity
(FEWS NET a, b, c, August 2015).
Agricultural activity and wages reached normal levels in August in Liberia and Guinea (FEWS NET,
August 2015; WFP, August 2015). On the contrary, below-average agricultural demand and wages
still persist in Sierra Leone according to FEWS NET b (August 2015). However, the last bans on
weekly markets were lifted in August, and the situation may have returned to normal in the following
months.
Some sources of income were still below their normal levels in September 2015, especially charcoal
sales, hunting and trapping, petty trade, handicraft, casual labour on rubber plantations, and export of
palm oil in Sierra Leone. This was also the case for other countries such as Liberia (hunting and
trapping, export of palm oil) and Guinea (petty trade, craft trades, hunting, mine work and sale of
livestock and poultry). Other sources of income returned to normal, with the normalisation process
occurring more quickly in places less affected by the Ebola epidemic (FEWS NET, August 2015).
According to WFP monitoring, prices follow normal trends for the season in most parts of three
countries (WFP, August 2015)
5.1.2 Nutrition security situation
In July 2015, a SMART survey (UNICEF, 2015) conducted in Guinea showed that the national
prevalence of GAM was 8% (2% for SAM) and that rural were more affected than urban populations
(8.5% and 7%, respectively). These rates are similar to national GAM levels reported before the Ebola
outbreak in 2012, as recorded by the 2012 Demographic and Health Survey (DHS).

34
Figure 12: Global Acute Malnutrition in Guinea (SMART, 2015). Source: OCHA, 1 September 2015
The Kankan region showed the highest rates of GAM, with a global prevalence of 9.3%, and the city
of Siguiri, in this same region, showed a prevalence approximating the 15% emergency rate (SMART
preliminary results, July 2015). The prevalence of GAM in Kankan was, however, already very high
before the Ebola outbreak (17.9% GAM reported by DHS 2012).
The latest UNICEF reports give the number of children with severe acute malnutrition that had been
treated since October 2014 as 7 504 in Guinea, 19 709 in Sierra Leone and 7 737 in Liberia (UNICEF
countries Situation Report on Ebola, 28 October 2015).
5.1.3 Main factors in food and nutrition insecurity
The impact of the Ebola outbreak on food security is gradually waning. In areas worst or still affected,
economic activity is still below average and some income sources have not returned to their pre-Ebola
levels.
The harvest is crucial to the evolution of the food security situation in the coming months. However,
Guinea, Liberia and Sierra Leone also face structural issues that will maintain a significant level of
food insecurity and malnutrition. This is due to several factors, including the low productivity of
agriculture, insufficient infrastructures, high poverty rates and low literacy levels.

35
5.2 Gambia The Gambia is a small West African state surrounded by the Republic of Senegal on all sides except
along the Atlantic Ocean. The width of the country varies from 24 to 28 kilometres. The Gambia has a
total land surface area of 10 689 square kilometres, of which 4 300 square kilometres (40%) are
devoted to arable agriculture and related activities.
Traditionally, agriculture in the Gambia is characterised by subsistence food crop cultivation,
livestock farming and semi-commercial cash crop production. The main crops are groundnuts, millet,
rice, maize and sorghum. Groundnut is the main cash crop, whereas millet and rice constitute the
staple foods. Agriculture in the Gambia is largely and essentially rain fed, although small areas of
irrigation exist for rice and horticultural crops.
The climate is typically “Sudano-Sahelian” characterised by a short mono-modal rainy season (June
to October) followed by a long dry season (November to May) which is characterised by the
Harmattan Wind. Average temperatures range from 18 to 30 degrees Celsius during the dry season
and 23 to 33 degrees Celsius during the rainy season. The relative humidity is about 68% along the
coast and 41% inland during the dry season, and generally about 77% throughout the country during
the rainy season. Average annual rainfall is about 1 000 mm, but ranges from 850 mm to 2 200 mm
depending on the agro-ecological zone.
The Gambian Government has developed many initiatives to boost rice (which is still the main staple
food crop) production in the country. Under these initiatives, Gambians have to grow what they
consume and consume what they grow. There are now around 250 000 hectares of rice, thanks to an
expansion programme which started in 2009. Another important strategic programme is to improve
the livelihoods of farmers under the Gambia National Agricultural Investment Plan (GNAIP), which
is the medium-term (2011-2015) strategic plan within the framework of the New Partnership for
Africa’s Development (NEPAD) and the Comprehensive Africa Agriculture Development
Programme (CAADP).
5.2.1 Food security situation
According to the November 2015 Cadre Harmonisé analysis, 54 000 persons were in Crisis (IPC
Phase 3) during the October to November 2015 period in the Gambia, and 373 000 persons were in
Stress (IPC Phase 2). For the projected period June to August 2016, 96 000 persons are expected to be
in Crisis and 510 000 persons in Stress.

36
Figure 13. Cadre Harmonisé maps for the period October -December 2015 and June-August 2016,
Source : CH analysis , Gambia, November 2015.
According to preliminary results of the National Agricultural Survey (Gambian Government -
Planning, CILSS, FAO, WFP, FEWSNET, November 2015), the 2015-2016 harvest will be below the
five-year average (about 283 853 MT production this year compared to the five-year average of 300
368 MT). It will, however, be better than last year (2014-2015), which was a bad year with about
256 898 MT production. Early millet and groundnuts performed worst in terms of production
compared to the five-year average. The harvest of upland rice, late millet and maize was average. The
below-average 2015-2016 crop performance is due to a heavy downpour that reduced the number of
working days on the farm as most of the rains were reported to have occurred during daytime hours.
Most rice fields were submerged along the swamp fields, and low tillering has been observed. This
also led to a short photosynthesis period for the field crops.
Rice prices are comparable to their 2014 levels or higher, and are above the five-year average. This
could pose a challenge to food access since rice is the staple food in the Gambia and is consumed in
high quantities by the poor, as per 2014 data. More generally, food prices were above their five-year-
average levels at least until August 2015 (latest results available at the time of the writing of the
report).
Livestock conditions are good this year due to favourable water and pasture availability. No
significant disease outbreaks have been observed.
5.2.2 Nutrition security situation
The preliminary results of the latest national SMART survey conducted in September-October 2015
estimated the GAM prevalence at 10.1% and SAM prevalence at 1.6%, while the stunting rate was
estimated at 22.6%. These rates are similar to those found in the previous SMART survey conducted
in the same season of 2012 (wasting or GAM at 9.9% and stunting at 21.2%).

37
5.2.3 Main factors of food and nutrition insecurity
Food insecurity in the Gambia is tightly linked to agricultural performance. Food insecurity observed
during the lean season this year is largely the result of the bad harvest of the previous year (2014-
2015). As the current harvest (2015-2016) is likely to be slightly below average, the food security
situation will remain precarious this year. The Gambia is characterised by subsistence food crop
cultivation and mostly rain-fed agriculture, which make it very vulnerable to rainfall shocks.
The factors contributing to undernutrition in the Gambia are related to high levels of morbidity,
mainly due to water-borne diseases such as diarrhoea which have a great impact on malnutrition.

38
6 Asia and Pacific
6.1 Democratic People’s Republic of Korea
In the Democratic People’s Republic of Korea (DPRK), agriculture accounts for 21% of the GDP
(2011) and remains a major provider of employment (CFSAM, 2013). However, the performance of
the agricultural sector was erratic in recent years due to its vulnerability to natural hazards and the
lack of marketing and technological reforms.
Before the 1990s, the DPRK had achieved relatively high levels of human development in terms of
life expectancy, infant mortality, and access to health services, water and sanitation. After 1990, many
socioeconomic indicators worsened due to the loss of the socialist markets and the natural disasters
that occurred during the 1990s. To restore the same economic level as the one that prevailed before
1990, the DPRK government introduced economic measures that allowed the gross domestic product
(GDP) to increase gradually from US$10.6 billion in 2000 to about US$12.3 billion in 2010.
The DPRK economy remains fragile despite international aid and gradual improvements in
agricultural production in recent years. As agriculture is the backbone of the economy, weak
resilience and susceptibility to shocks exacerbates the country’s economic vulnerability. Furthermore,
the difficulties in securing the energy required to meet increasing demands of production, weak
infrastructure and logistical support, imbalanced import-export policies, difficulties in introducing
new technologies, and international sanctions all contribute to an unstable economy that could
potentially provoke humanitarian crises.
Whilst there is a continued risk that a natural hazard or other unexpected shock could cause a new
humanitarian crisis, there are still critical day-to-day needs across the food security, nutrition, health
and water and sanitation sectors, which will require the support of the international community.
6.1.1 Food security situation
Food and nutrition security across the whole DPRK remains a significant challenge. According to
OCHA (2015), an estimated 70% of the population (18 million people) rely on the Public Distribution
System (PDS) for food, which is vulnerable to fluctuations in production. In 2015, the Government’s
target was to provide 573 grammes of cereal per person per day. This figure represents an increase of
around 50% compared to the 2014 average PDS ration of 383 grammes.
A lack of agricultural inputs (seeds, fertiliser and plastic sheets) remains the main challenge for food
production. The data from the 2013 Crop and Food Security Assessment Mission (CFSAM) indicated

39
that only 16% of households in the country have acceptable food consumption standards, with serious
gaps remaining between the recommended and actual nutrient intake. Of these, approximately 1.8
million people, including children, pregnant and lactating women, and the elderly, rely on regular
specialised nutritious food designed to combat malnutrition (OCHA 2015).
Rainfall in the DPRK is highly seasonal. Spring is usually dry (typically 50 to 70 mm rain in March
and April depending on the location), and rainfall levels increase in May followed by the beginning of
the main rains in June, when the monthly average varies from 100 to 200 mm, again depending on the
location (Randall Iresson, Korean Central News Agency, June 18, 2015). Rice seedlings are typically
planted in irrigated seedbeds in April and, as long as there is water in the reservoirs, the seedlings can
be cared for through transplantation in mid- to late June. At that point, problems arise if the rains do
not materialise. Maize is planted in the fields somewhat earlier than rice, and is wholly dependent on
rainfall for proper growth.
The JRC scientific report of July-August 2015 highlights a hotspot of negative NDVI anomalies in the
southwest of the country, which is part of the rice bowl area. The greatest negative anomalies
compared to the average are observed in the area near Jaeryong. Larger areas with negative NDVI
anomalies were recorded in North Hamgyong, whereas good vegetative development was observed in
Chagang, South Hamgyong and Kangwon. In August, the area near Jaeryong continued to display
negative NDVI anomalies, while the surrounding area returned to average or above-average NDVI
values.
During the main rainy period (July and August), rainfall was below average and some episodes of
extreme rainfall were recorded in some areas, causing floods. The main crops (rice and maize)
recovered in vegetative growth but they were significantly delayed in the main agricultural provinces
(south and southwest). As the grain-filling and ripening phases occurred under less favourable
conditions than in a normal season, yields were expected to be lower than average. In addition, an
early end to the rains in the northern provinces is likely to have had a negative impact on the
maturation of potatoes and other crops in the area.
OCHA reports that, although the humanitarian situation has improved slightly since 2013, the
structural causes of vulnerability persist and external assistance is needed, notably in the north-eastern
provinces. The food system in the DPRK remains highly vulnerable to shocks and serious shortages
exist, particularly in the production of protein-rich crops.

40
6.1.2 Nutrition security situation
There is no updated data available on the status of nutrition in the country, but results of the 2012
National Nutrition Survey showed a chronic malnutrition rate of 28%, and an acute malnutrition rate
of 4%, nationally. Regional disparities were significant, with stunting rates nearing 40% in some areas
in the northeast of the country. High rates of wasting were also found in the northern counties (see
Figure 14).
Figure 14: Global acute malnutrition rate in the DPR Korea (% of total population), 2012.
Source: OCHA, DPR Korea, 2015.
Moreover, a mid-term programme review conducted by the WFP in July 2014 revealed that a
staggering 81% of the population do not have an acceptable diet in terms of quality and diversity. The
population consumes 25% less protein and 30% less fat than the amount required for a healthy
lifestyle (WFP DPR Korea Brief 01 July - 30 September 2015).
6.1.3 Main factors in food and nutrition insecurity
In the DPRK, only 17% of the total land area is suitable for arable farming, of which more than 80%
is under cereals. The land area remaining for animal, legume or horticultural production is
consequently very small. Dietary quality is also poor for many people, with limited consumption of
foods that are rich in protein, fat and essential micronutrients. Micronutrient deficiencies are common,
especially in iron, zinc, vitamin A and iodine. Since 2012, there has been an abrupt fall in soya
production, an essential source of protein. This is due to the pricing structure, which encourages
maize production at the expense of soya. Soya is furthermore important for soil amelioration and
essential to conservation agriculture, which is crucial to the strategy for agricultural recovery.

41
Abnormal weather in the DPRK is always of concern, given the very fragile nature of the agricultural
recovery that has been progressing for the past several years. Farm production in the past four years
has been relatively stable at about five million metric tonnes grain equivalent, higher than at any time
since 1994 but still below the UN estimate of the minimum requirement for basic nutrition of the
population.
The causes of under-nutrition are related to food inadequacy and a serious lack of food diversity to
meet the nutritional requirements for healthy growth, as well as deteriorated health and WASH
services. The government system of central collection and redistribution (Public Distribution System)
can be erratic, with insufficient rations that deliver a poor quality and low diversity diet. This year,
despite slight increases in the production of rice and maize, there was a decrease in soybean
production, one of the main sources of protein for people in the DPRK. This is a result of three
consecutive years of dry conditions and poor quality seeds, and the limited production of vegetables,
which has further contributed to inadequate food diversity across the country.
Moreover, although the coverage of the health system is extensive, the prevailing lack of medical
supplies challenges the provision of adequate health services. Although access to clean water and
improved sanitation is widespread, there is limited information on the maintenance of the piping
systems and in the quality of the water piped to households.

42
6.2 Nepal
On 25 April 2015, a 7.8 magnitude earthquake struck Nepal, with the epicentre in the Lamjung
District (northwest) of Kathmandu and south of the border with China. This has led to a considerable
amount of destruction. About 9 000 died and thousands more were injured. Nearly 60 000 Nepalese
have been displaced to 120 sites across 13 districts.
6.2.1 Food security situation
Food security has largely deteriorated following the earthquake. In May 2015, a total of 275 500 food-
insecure households (1.4 million people) were identified as being in need of assistance. Whereas prior
to the earthquake all Village Development Committees (VDCs) were classified as having minimal
food insecurity, after the earthquake, in May 2015, 80 VDCs were classified as severely food insecure
(Phase 44), 271 VDCs as highly food insecure, and 181 VDCs as moderately food insecure. The
associated number of food-insecure people are 240 000 severely food insecure, 1.1 million highly food
insecure, 930 000 moderately food insecure and 774 000 minimally food insecure. For the period mid-
July to mid-November 2015 (forecast), 10 VDCs were classified as severely food insecure (Phase 4)
in Sindhupalchowk, 224 VDCs were classified as highly food insecure (Phase 34), 329 VDCs as
moderately food insecure (Phase 24), and the remaining 3 360 as minimally food insecure (Phase 1
4).
In terms of population, this corresponds to 28 700 (Phase 44) persons being severely food insecure and
500 300 highly food insecure (Phase 34).
Whereas the non-mountain areas are witnessing a reasonable improvement in their food security
situation, the remote mountain areas are still facing difficulties as they are more difficult to reach by
humanitarian assistance, market functioning has not resumed and food availability is still very low.
These areas were also the most food insecure and malnourished before the earthquake, due to a
combination of unfavourable geography, poor infrastructure and vulnerable livelihoods. Pockets of
food insecurity and vulnerability do persist however, most notably in Dolakha, Sindhupalchok,
Gorkha, Sindhuli and Ramechhap (NeKsaP, Februray 2016).
4 Since 2008, the Ministry of Agricultural Development (MoAD) of Nepal, with the technical support of the
WFP in Nepal and the financial support of the European Union, has been implementing food security analyses
on a quarterly/trimestral basis, as part of the Nepal Food Security Monitoring System (NeKSAP). Nepal uses
version 1.1 of the IPC classification, modified to adapt to the national context. The Phases described in this
paragraph are thus slightly different from the IPC Phases described in other paragraphs.
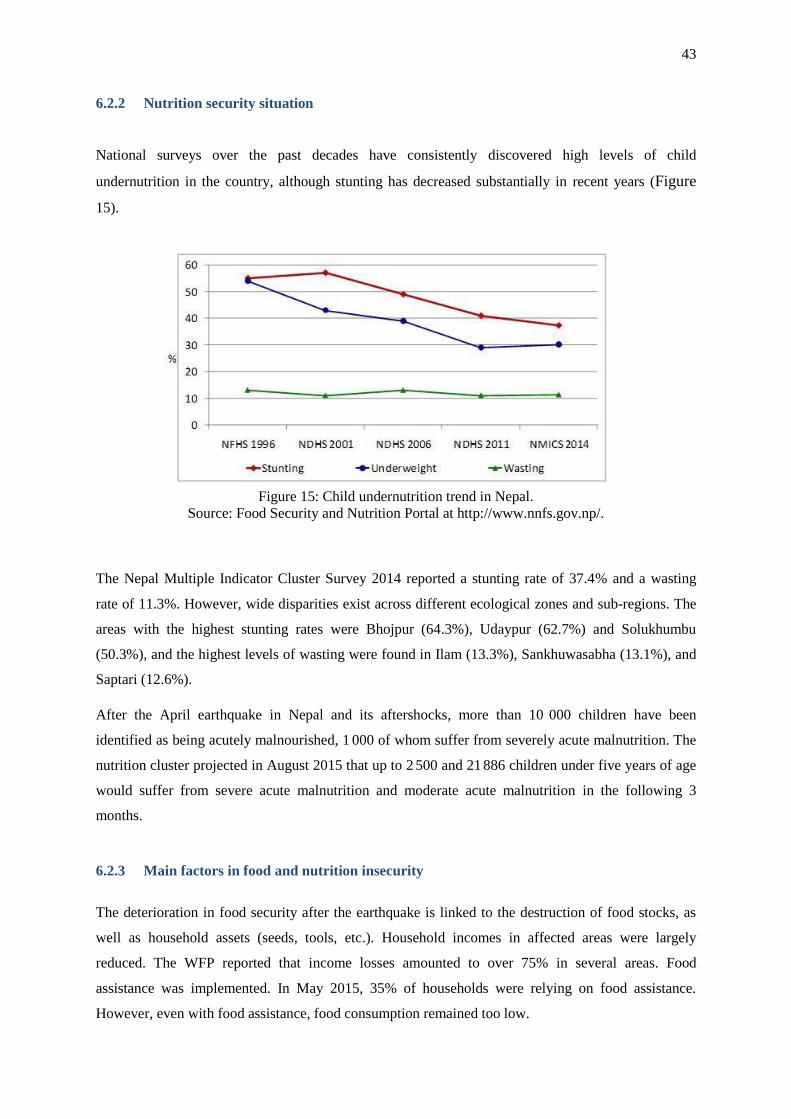
43
6.2.2 Nutrition security situation
National surveys over the past decades have consistently discovered high levels of child
undernutrition in the country, although stunting has decreased substantially in recent years (Figure
15).
Figure 15: Child undernutrition trend in Nepal.
Source: Food Security and Nutrition Portal at http://www.nnfs.gov.np/.
The Nepal Multiple Indicator Cluster Survey 2014 reported a stunting rate of 37.4% and a wasting
rate of 11.3%. However, wide disparities exist across different ecological zones and sub-regions. The
areas with the highest stunting rates were Bhojpur (64.3%), Udaypur (62.7%) and Solukhumbu
(50.3%), and the highest levels of wasting were found in Ilam (13.3%), Sankhuwasabha (13.1%), and
Saptari (12.6%).
After the April earthquake in Nepal and its aftershocks, more than 10 000 children have been
identified as being acutely malnourished, 1 000 of whom suffer from severely acute malnutrition. The
nutrition cluster projected in August 2015 that up to 2 500 and 21 886 children under five years of age
would suffer from severe acute malnutrition and moderate acute malnutrition in the following 3
months.
6.2.3 Main factors in food and nutrition insecurity
The deterioration in food security after the earthquake is linked to the destruction of food stocks, as
well as household assets (seeds, tools, etc.). Household incomes in affected areas were largely
reduced. The WFP reported that income losses amounted to over 75% in several areas. Food
assistance was implemented. In May 2015, 35% of households were relying on food assistance.
However, even with food assistance, food consumption remained too low.

44
Improvements have been observed since May 2015. These are attributable to humanitarian assistance,
the winter harvest (wheat and potato) and the resumption of market functioning and better road
access. This applies mainly to non-mountain areas along the earthquake belt. The food security
situation of households living in mountain areas affected by the earthquake is more difficult. In May
2015, markets remained largely closed and the food availability is still limited.
Further contributing factors to malnutrition are inappropriate caring practices, limited access to and
consumption of appropriate foods, and high incidence of diarrheal diseases and respiratory infection
episodes. However, the distribution and importance of these factors may vary across regions.
45
6.3 Papua New Guinea
Papua New Guinea (PNG) has a population of 7.3 million inhabitants, 85% of whom live in rural and
15% in urban areas. The highlands host 40% of the population, whose livelihoods consist mainly of
subsistence sweet potato production. The rural population mainly practice subsistence agriculture.
Cash crop production also exists and includes cocoa, coffee and palm oil production. 83% of the food
consumed is produced in the country.
6.3.1 Food security situation
At the end of 2015, about one third of the PNG population faced food shortages. The exact number of
food-insecure people and the severity of food insecurity is difficult to assess since no large scale
survey has been conducted. The Government is planning to conduct a food security assessment in
mid-January 2016. It is expected that the food security situation will worsen until the next harvest.
The Government of Papua New Guinea estimates that more than 2.7 million people are facing food
shortages, among which 522 000 require urgent food assistance (OCHA, 7 January 2016). The
estimation specifies that among the 522 000 severely food insecure, 266 000 people live in very high
altitudes areas, 182 000 in the highlands or highland fringes, 46 000 in inland lowlands of western
provinces, and 28 000 in small and remote islands. Oxfam and CARE estimate that three million
people were affected by El Niño (Oxfam, 2015; CARE, October 2015). This number is based on the
number of people affected during the previous El Niño event in 1997-1998, and takes into account the
fact that the situation in 2015-2016 will be worse (CARE, October 2015). During the 1997-1998 El
Niño episode, 260 000 people were found to be in a critical life-threatening situation, and 1.9 million
were found to have limited quantities of food. The atypical level of food insecurity this year is mainly
linked to low rainfall in 2015 (Figures 16 and 17).
The situation is particularly problematic in the highlands, which suffered frosts in addition to drought
in August 2015. Torrential rains have also been recorded at the beginning of 2015. The harvest is
severely diminished or has failed. Food availability is thus greatly reduced. Two provinces, Enga and
the Southern Highlands, have declared a state of emergency (WFP, September 2015). The most
vulnerable population group are those that are isolated and have poor market access. As they usually
rely on their own production, large-scale harvest failure automatically leads to a food-security crisis.
In addition, they do not have easy access to markets to buy and are difficult to reach for the
distribution of food aid because of difficult physical access.
In the lowlands and islands, agriculture has been primarily affected by droughts. Food availability is
thus far below average. Food prices are reported to be increasing in some markets (WFP, September
2015). In addition, the water level in rivers and water points is very low.
Pest outbreaks have also affected crops and livestock in certain areas (Oxfam, 2015).

46
Figure 16: Monthly rainfall anomalies (mm) compared to the past seven-year average (2008-2014).
Data source: EC-JRC, based on the ECMWF model.
Figure 18: Rainfall profile. Data source: EC-JRC, based on the ECMWF model.

47
6.3.2 Nutrition situation
According to our knowledge, the most recent data collection at country level dates from 2010. At that
time, wasting affected 14% of children under five, which is Serious according to the WHO
classification, and the prevalence of severe wasting was at 7%. The stunting rate was also very high,
reaching 50%. A cause for concern is the fact that these figures reflect a deterioration in the overall
nutrition situation, as shown in Figure 18.
Figure 17: Trend in malnutrition of children under five years of age in PNG.
Source: Global Hunger Index report, IFPRI 2015
6.3.3 Main factors in food and nutrition insecurity
The food crisis this year is linked to the exceptional weather conditions caused by the El Niño
phenomenon. Drought conditions have added to the impact of frosts and floods, and have led to very
poor crop development. Since more than 80% of the food consumed in PNG comes from national
production, these weather shocks have led to widespread and significant food shortages.
The quantity of food consumption (calories) in PNG is typically at an acceptable level. However, the
prevalence of malnutrition is quite worrying (Wilson, December 2015). This is mainly due to a very
low diversity diet and poor knowledge about children’s nutrition needs. The typical diet is composed
of a large share of carbohydrates, with very little fat or protein. Vegetables and meat are eaten in very
small quantities (WFP, September 2015).

48
7 Central America and the Caribbean
7.1 Central American Dry Corridor (Guatemala, El Salvador, Nicaragua and
Honduras)
The Central American Dry Corridor (CADC) is prone to recurrent disasters and is highly vulnerable
due to its exposure to extreme weather events (floods and droughts) and institutional and
socioeconomic weaknesses. El Niño episodes are known to cause droughts in the region.
7.1.1 Food security situation
The ongoing El Niño event has led to one of the worst droughts in the region with significantly
below-average rainfall from May to September 2015 (primera season), when crops are most sensitive
to water shortages. The rainfall deficit during the primera planting season has reduced seed
germination and limited the flowering and development of grains. Maize and beans were most
affected by the drought. While the extent of crop damages varies according to their sowing and
planting times and the irregular temporal and spatial distribution of rains, the Dry Corridor is of
particular concern.
The WFP has been continuously assessing the food security needs of drought-affected populations in
Guatemala, El Salvador and Honduras. Based on primary data collected between May and July 2015
from affected households in Guatemala (1 870 households) and key informants as well as secondary
data provided by official entities, the WFP made preliminary estimates of the affected population and
of those in food insecurity. The findings show that around 51% of municipalities in the Dry Corridor
have been affected, mainly in Guatemala (Baja Vera-paz, El Progreso, Zacapa, Chiquimula, Jalapa y
Jutiapa, Quiche, Huehuetenango, Totonicapán, San Marcos, Retalhuleu, Santa Rosa and Escuintla).
In Guatemala and Honduras, food expenditures in 70% of affected households account for over 65%
of total household expenditures, reflecting extremely high levels of economic vulnerability. As
reported by the WFP (September 2005), in order to maintain adequate food consumption, households
resort to negative coping strategies that often impair their ability to cope with further shocks, such as
the recent protracted drought or increased food prices.
The pressure on supply led to an increase in food prices. This situation, combined with reduced
incomes due to limited job opportunities and the lack of food stocks for sale, increased the food
insecurity status of vulnerable households, which have not still recovered from the effects of the 2014
drought and coffee rust.
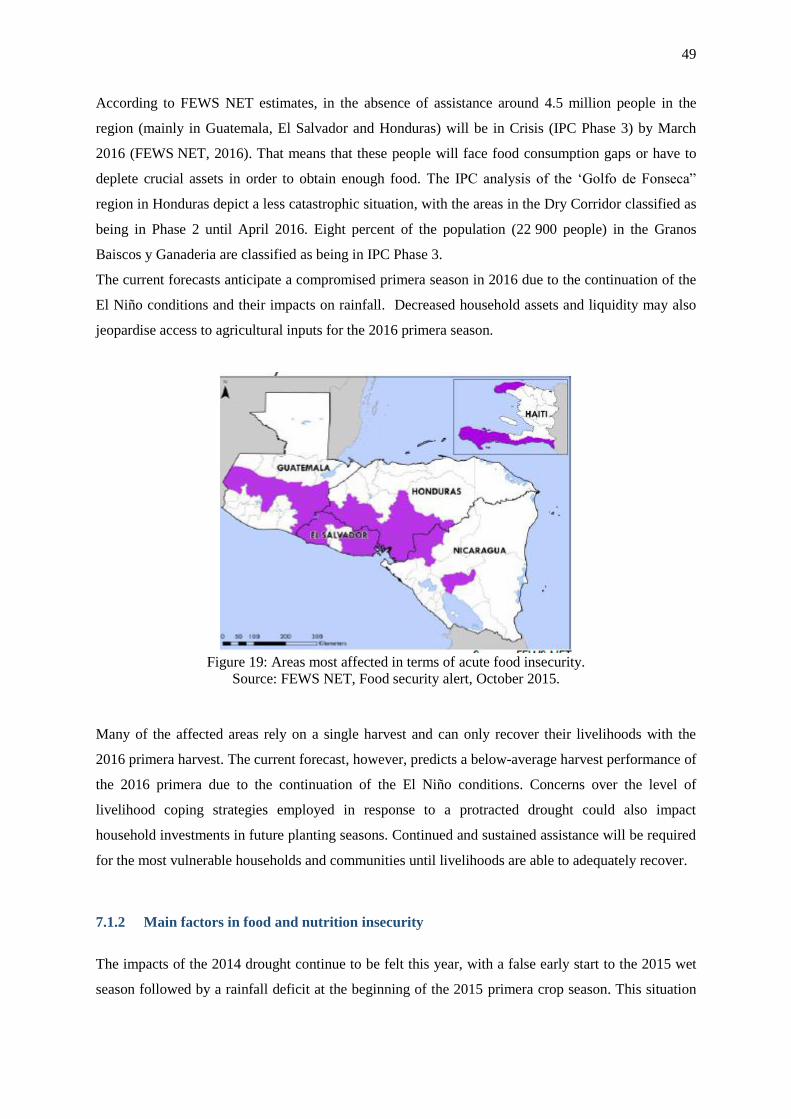
49
According to FEWS NET estimates, in the absence of assistance around 4.5 million people in the
region (mainly in Guatemala, El Salvador and Honduras) will be in Crisis (IPC Phase 3) by March
2016 (FEWS NET, 2016). That means that these people will face food consumption gaps or have to
deplete crucial assets in order to obtain enough food. The IPC analysis of the ‘Golfo de Fonseca”
region in Honduras depict a less catastrophic situation, with the areas in the Dry Corridor classified as
being in Phase 2 until April 2016. Eight percent of the population (22 900 people) in the Granos
Baiscos y Ganaderia are classified as being in IPC Phase 3.
The current forecasts anticipate a compromised primera season in 2016 due to the continuation of the
El Niño conditions and their impacts on rainfall. Decreased household assets and liquidity may also
jeopardise access to agricultural inputs for the 2016 primera season.
Figure 19: Areas most affected in terms of acute food insecurity.
Source: FEWS NET, Food security alert, October 2015.
Many of the affected areas rely on a single harvest and can only recover their livelihoods with the
2016 primera harvest. The current forecast, however, predicts a below-average harvest performance of
the 2016 primera due to the continuation of the El Niño conditions. Concerns over the level of
livelihood coping strategies employed in response to a protracted drought could also impact
household investments in future planting seasons. Continued and sustained assistance will be required
for the most vulnerable households and communities until livelihoods are able to adequately recover.
7.1.2 Main factors in food and nutrition insecurity
The impacts of the 2014 drought continue to be felt this year, with a false early start to the 2015 wet
season followed by a rainfall deficit at the beginning of the 2015 primera crop season. This situation

50
caused significant losses in food production. In addition, an extended mid-season dry spell led to a
reduction in sown areas. If the El Niño conditions persist in early 2016, the harvest could again be low
and the situation would deteriorate further.
In previous years, apart from the food insecurity situation, the high incidence of diarrhoea and
respiratory infections as well as limited access to safe water were identified as contributory factors of
malnutrition in the most affected areas.

51
7.2 Haiti
Food insecurity is chronic in Haiti. Poverty is widespread and the wealth distribution is very unequal.
Population density is high, reaching 384 people per square metres according to the World Bank
(http://data.worldbank.org/indicator/EN.POP.DNST).
Persistent poverty and food insecurity have structural causes that include recurrent natural disasters,
low levels of national food production, environmental degradation, political and social turmoil and
poor basic services, including the access to rural finance and education.
7.2.1 Food security situation
OCHA estimates that 0.3 to 0.6 million people are currently affected by food insecurity, and that
820 000 are severely food insecure (OCHA, 31 Dec 2015) .
An IPC Chronic analysis has been recently completed. This facilitates the assessment of the number
of people who have food consumption issues on a recurrent basis even in the absence of an important
shock to food security, like the below-average crop production levels of last year (2015).
According to a FEWS NET IPC compatible analysis (Figure 20), 37 communes in the North West,
South East and the Central Plateau were facing IPC Phase 3 (Crisis) during the period November-
December 2015(CNSA, FEWS NET, 2015). This means that more than 20% of the population in
these areas are facing food consumption gaps and high or above-average acute malnutrition, or are
only marginally able to meet minimum food needs by accelerating the depletion of livelihood assets,
which will lead to further food consumption gaps in the future. The December 2015-January 2016
harvest was not enough to lower the proportion of people in IPC Phase 3 to less than 20%. IPC Phase
2 (Stress) was also registered in several communes during the period October to November 2015.
The September 2015 Alert published by the CNSA established that between 300 000 and 560 000
people are in Crisis (IPC Phase 3) (CNSA, September 2015). This situation is likely to worsen by
May- June 2016 with the spring harvest.
According to ACF, the lean period lasted for seven months in 2015 instead of the average three
months in a typical year in three communes of the North West5 due to harvest failure (ACF, 2015).
Livestock suffers from the lack of water, and early mortality rates among small ruminants have
increased. Prices are reported to be 70% higher than normal in these areas.
5 Bombardopolis, Baie de Henne, Anse rouge.

52
Figure 20: Outcomes of the April 2015 IPC Compatible Analysis, April 2015. Source: FEWS NET
Figure 21: Outcome of the IPC compatible analysis for November-December 2015, and projection for
January-March 2016. Source: FEWS NET
These levels of food insecurity are atypically high. Food security in Haiti has gradually worsened
throughout 2015 due the consequences of repeated dry spells on crop performance, namely during the
first season (April to August) of 2014 and 2015 and the second season (August to September) of
2015. This has led to poor crop development and poor harvests, and has particularly affected the
southern peninsula, the North West, the Northern Artibonite, the North-East, the South-East, North-
East and West of the country (OCHA, August 2015). It is estimated that the 2015 national production
is 50% lower than the long-term average (CNSA, FEWS NET, 2015). The FAO estimates the 2015
cereal production to be 353 000 tonnes, which is significantly below the five–year average (FAO, 30
December 2015). Cereal imports are forecasted to be at a record level of 698 000 tonnes. However, the
current political crisis and the strong devaluation of the Gourde may jeopardise the capacity of the
country to achieve this level of imports.

53
Poor crop development has led to reduced agricultural activity and low demand for agricultural
labour. As a result, the purchasing power and food access of poor wage workers has been dramatically
reduced. The labour demand for agricultural work related to the production of congo peas in the
communes of Anse-à –veaux, Arnault and Aziles in Nippes has been particularly affected, as has the
tuber and bean production in the mountain areas. Yields of irrigated rice, fruit and vegetables in the
Artibonite valley have not been greatly affected.
Prices of locally produced crops follow seasonal trends. However, their levels are above average this
year. The high prices are attributed to the low level of production this year (CNSA, FEWS NET,
2015). According to the FAO (30 December 2015), the prices of domestically produced maize meal
surged in several markets in November, with monthly increases ranging from 10 to 33%, particularly
in Jeremie, the main market in the South West of the country (FEWS NET, December 2015). In the
capital, Port-au-Prince, and Hinche markets, important price increases were recorded for black beans.
Despite the fact that the harvest of certain crops (beans, cornmeal, banana) has begun, price increases
have been observed locally because of poor harvest yields in these areas (CNSA, October 2015). The
price of imported food products remains stable compared to other years, except for broken rice
imported from the Dominican Republic, the price of which was 30% higher in September 2015 than
in September 2014. The poorest households consume this food item. On the other hand, the price of
imported rice from the US fell in November 2015, reflecting its drop on the international market.
Overall, the drop in incomes due to lower-than-average activity (mainly from agricultural wage work)
and above-average food prices has reduced food access and increased food insecurity, particularly for
the poor households for whom agricultural wages represent an important source of income.
This deterioration in food security arises in a situation of very high chronic food insecurity. According
to the IPC Chronic analysis, about 70% of the Haitian population faces chronic food insecurity (IPC
Chronic Levels 2, 3 and 4).
Overall, about 15% of the population faces severe chronic food insecurity (IPC Chronic Level 4),
which means that this proportion of the population suffers deficits in food consumption for more than
four months each year, does not consume a diet of sufficient quality throughout the year, and is likely
to have stunted children. Twenty-eight percent face moderate chronic food insecurity (IPC Chronic
Level 3), which means that they have moderate food consumption deficits throughout the year or
important food consumption deficits for two to four months each year, and they do not consume a diet
of sufficient quality throughout the year. Their children are likely to be moderately stunted. About
31% of the population face mild chronic food insecurity (IPC Chronic Level 2), which means that
they consume a sufficient quantity of food calories but do not consume a diet of sufficient quality
during most of the year. Their children are not likely to be stunted (Haiti IPC Technical Working
Group, 2015).

54
7.2.2 Nutrition situation
To our knowledge, the latest nationally representative nutrition surveys are from 2012. Wasting then
affected 5% of children under five years of age, i.e. about 65 000 children in total. Stunting affected
22% of children under five, i.e. about 274 000 children (Global Nutrition Report, 2015). In 2011, 37%
of women of reproductive age were anaemic. According to UNICEF, cited in the 2015 Global
Nutrition Report, only 14 % of six- to 23- month-old children have a minimum acceptable diet, and
only 29% have acceptable dietary diversity.
7.2.3 Main factors of food and nutrition insecurity
The high number of food-insecure people observed in 2015 and expected for 2016 results from the
cumulative effects of three poor harvests due to dry spells that occurred during the cropping seasons.
In addition to the lower-than-average food availability, poor harvests have led to a chain of events that
resulted in an increased number of food-insecure people in the country. Low agricultural activity
resulted in low agricultural labour demand. Demand for labour has fallen dramatically in almost all
regions except for the Artibonite valley, where irrigated rice and fruit and vegetable production still
demand a reasonable level of labour. As agricultural wage income is major source of income for poor
households, the decrease in agricultural labour demand has reduced their purchasing power. In
addition, the low quantity of food on the market has led prices to increase above their normal levels.
Overall, food access is much lower than average this year, and food insecurity has consequently
increased. If the 2016 harvest is again below average because of the continuation of El Niño, the food
security situation could deteriorate further.
As already mentioned, Haiti is a vulnerable country. The reasons why the poor harvests of 2014 and
2015 have resulted in a large increase in those that are food insecure are structural. Haiti has a high
rate of poverty and chronic food insecurity. Structural causes of chronic food insecurity include low
purchasing power, high market dependency, low agricultural productivity and income, recurrent
natural disasters, environmental degradation, poor access to drinking water, poor infrastructures, and a
very low level of education (Haiti IPC Technical Working Group, 2015).
Haiti remains the poorest country in the Americas and one of the poorest in the world, with a GDP per
capita of US$846 in 2014 and a significant of basic services. More than 25% of the women and 20%
of the men are not able to read or write (Haiti IPC Technical Working Group, 2015).
Recurrent natural disasters include severe storms, notably the magnitude 7.0 earthquake that struck
Haiti on 12 January 2010, hurricanes Isaac and Sandy in 2012, flooding, landslides and drought. Six
years after the 2010 earthquake, 60 000 people still live in camps (ACF, 2015).

55
Haiti is a food deficit country. Domestic production accounts for about 50% of the country’s food
needs. Agricultural productivity is low. Environmental degradation (soil erosion, degradation of water
sources, forest losses) is a major concern. Roads are in a very poor condition. At household level,
physical capital endowments are low. More than 50% of the population cultivates plots of less than
0.5 ha. As a result, 60 to 80% of the food consumed come from the market (Haiti IPC Technical
Working Group, 2015). Low incomes prevent poor households from accessing a diet of sufficient
quality and quantity.

56
8 Countries with conflict areas
8.1 South Sudan
South Sudan is the theatre of a protracted civil war stemming from political and ethnic rivalries since
December 2013. Tens of thousands of people have been killed and more than 1.6 million have been
internally displaced. In late August 2015, a Compromise Peace Agreement was accepted by both
parties. However, the deal remains fragile. Several agreements have been signed since January 2014,
only to be violated shortly after signature. Currently, clashes continue despite the peace agreement.
Both sides have blamed the other for violating the ceasefire. Conflict situations mainly occur in the
Jonglei, Upper Nile, and Unity states.
The food security situation is greatly affected by the conflict. Moreover, inflation was very high in
2015. “The South Sudan annual Consumer Price Index (CPI) increased by 165 % from January 2015.
The increase was mainly driven by the high prices of food and non-alcoholic beverages” (NBS, Feb
2016). The South Sudanese Pound (SSP) has depreciated significantly. In mid-December 2015, the
exchange rate moved from a fixed to a floating regime, with important impacts on local food prices.
Food insecurity in South Sudan is widespread and recurrent, following the agricultural season which
is bimodal in the south-western and south-central parts of the country (known as the greenbelt zone)
and unimodal in the rest of the country. The lean season usually begins between April and May,
peaking from August or September. Food insecurity is mitigated in the greenbelt zone at the peak lean
season due to the “green” harvest, which is the harvest of products that are not completely ripe. The
first harvest in the bimodal areas occurs in October-November, while the main harvest for both
seasons occurs from December to January. Although South Sudan is predominantly import dependant,
harvest performance as well as the conditions of pasture and water available for livestock greatly
determine the food security situation.
8.1.1 Food security situation
According to the IPC analysis, 3.1 million people were in food Crisis (IPC Phase 3) in August-
September 2015, 830 000 in Emergency (IPC Phase 4) and 30 000 in Catastrophe (IPC Phase 5). The
IPC Technical Working Group specified that even though famine was not declared in areas highly
affected by conflict due to limited evidence, there was a concrete risk of famine occurring between
October and December 2015 if urgent humanitarian access and assistance were not provided in the
most affected areas. According to WFP food security monitoring, conducted in August 2015, about
50% of the population is food insecure (9% severely, 39 % moderately). An important part of the

57
population has an inadequate diet, i.e. a poor or borderline Food Consumption Score (FCS). This
affects between 33% of the population in Jonglei and 57% of the population in Lakes.
The areas worst affected by food insecurity are the four counties most affected by the conflict in Unity
State, namely Leer, Guit, Koch and Mayendit. Other areas of concern are Jonglei and Upper Nile, the
two other conflict-affected States. This year (2015), the Greater Equatoria region is witnessing a large
deterioration in its food security situation; this is the first time, since the country exists, that these
regions have experienced such a deterioration at this time of the year. A significant deterioration in
the food security condition compared to last year in the same time period was also noted in Bahr el
Ghazal. The situation in Unity, especially in Leer, Guit, Koch and Mayendit, is dire but it is difficult
to properly assess the exact severity of the situation and the number of people affected due to access
issues linked to insecurity.
The most affected populations are the Internally Displaced Persons (IDPs) and the host communities
affected by the ongoing conflict. These households have lost their livelihoods, income and assets.
They have inadequate food access due to low income, market disruption and high prices.
Figure 22: IPC classification for the period August-September 2015. Source: IPC, August 2015.

58
Figure 23: IPC classification for the period October-December 2015. Source: IPC, August 2015
Table 3: Proportion of the food-insecure population by State, WFP Monitoring, August 2015.
WFP monitoring, August 2015 Severely food insecure
(% of total population)
Moderately food insecure
(% of total population)
National 9 39
Lakes 18 60
Upper Nile 18 40
Northern Bahr el Ghazal 14 47
Western Bahr el Ghazal 17 36
Western Equatoria 3 46
Warrap 9 41
Eastern Equatoria 4 37
Jonglei 1 30
Central Equatoria 2 27
Food commodity prices have been increasing dramatically since the beginning 2015. Shortages in
hard currency greatly impact the South-Sudanese economy. Moreover, transport costs have increased
due to the high cost of fuel and insecurity. Insecurity also greatly disrupts trade flows. Food prices
are largely above average in the country as a whole, reaching record levels in areas affected by the
conflict. The terms of trade of wage against cereals, and livestock against cereals, have sharply
declined compared to last year. For example, a day’s wages could buy 5 kg of sorghum in August
2014 compared to 1.9 kg in August 2015 (WFP market analysis, personal communication).

59
Figure 24: Food and general prices in South Sudan over the 2012-2015 period. Source: WFP, Market
functionality in South Sudan, October 2015.
The harvest performance this year is expected to be average at the country level. Production deficits
are expected in the Greater Upper Nile and Lakes states due to a reduction in the planted areas and in
the agricultural activities overall, related to insecurity and displacement, and also to poor rainfall
distribution. Rainfall performance has been poor in Eastern Equatoria, particularly in the Kapoeta
South, Torit, Budi, and Lafon counties, so production may be below average in these areas
(FEWS NET, July 2015).
8.1.2 Nutrition security situation
The overall nutrition situation remains Critical, with Global Acute Malnutrition (GAM) prevalence
above the emergency threshold (GAM greater than 15%) in the conflict-affected states of the Greater
Upper Nile (Jonglei, Unity and Upper Nile) and in states generally associated with high rates of
malnutrition (Northern Bahr el Ghazal and Warrap). Notable is the deterioration in the Lakes state,
with rates approaching the emergency threshold. Countrywide, GAM is found to be 13% and Severe
Acute Malnutrition (SAM) is at 2.6%. Weighted malnutrition rates were only computed for the seven
‘non-conflict’ states. Jonglei, Unity and Upper Nile were excluded. The worst nutrition situation is
observed in Warrap (24.2% GAM) followed by Northern Bahr el Ghazal (17.6%).
The SMART surveys conducted in the conflict states indicated that GAM rates in the majority of
areas were above the emergency threshold, with the worst nutrition situation observed in Unity.

60
Figure 25: IPC Nutrition classification for the period August-September 2015.
Source: IPC, August 2015.
8.1.3 Main factors of food and nutrition insecurity
The main factor responsible for the large deterioration in food security this year in South Sudan is the
conflict and associated displacement and insecurity. Insecurity in the Greater Upper Nile limits trade
(and thus food availability and access) and the area planted, and disrupts the cropping season. The
conflict has also resulted in market disruption and a strong economic downturn. Very high food prices
have been recorded (up to 150% above average), especially in Greater Bahr El Ghazal. The high
prices affect the urban more than the rural population. Depreciation of the South Sudanese pound has
also limited imports and thus food availability. Moreover, conflict and insecurity limit and challenge
humanitarian access.
Erratic rainfall patterns have added to the difficult situation. This year, rain was significantly below
average in Eastern Equatoria and Jonglei. Delayed rains led farmers to replant crops in Western
Equatoria and Jonglei. The October to December harvest show more favourable prospects, and should
be moderate to good with respect to rainfall. The situation will, however, remain very precarious
because of the conflict and due to the high prices.
Moreover, structural vulnerability prevails throughout the country, and any shock translates into rapid
deterioration of the food security situation.

61
The high levels of acute malnutrition are attributable to inadequate food consumption, namely very
poor diet diversity, poor maternal and child feeding practices, morbidity, and constrained health and
nutrition service delivery. The malnutrition rates, which are above emergency thresholds in the
Greater Upper Nile, are attributable to the ongoing conflict which has hindered humanitarian access,
affected crop and livestock production, rendered markets non-functional, and led to major population
displacements.

62
8.2 Sudan
Sudan is the largest nation in Africa, with a total area of 2 505 813 sq. km. The country is rich in
natural resources such as crude oil. The Sudanese economy has been slow to develop due to persistent
civil wars in the nation over the past three decades. The nation has, however, achieved considerable
economic growth over the past few years as a result of the Sudanese government’s efforts to
implement macroeconomic reforms in association with the International Monetary Fund (IMF). The
civil wars were officially put to an end with the adoption of a revised constitution in 2005, but the
country is still suffering from internal conflicts as well as the South Sudan border conflict.
8.2.1 Food security situation
According to the latest IPC analysis, (IPC TWG, September 2015), an estimated 3.9 million people in
Sudan face Stressed (IPC Phase 2) and Crisis (IPC Phase 3) acute food insecurity. This is mainly due
to internal displacement as well as below-average cumulative seasonal rainfall across most of Sudan’s
main agricultural production areas (total rains ranging from 25 to 50% of the average in some areas).
Most of the food-insecure populations are in the conflict-affected areas of Darfur, the South
Kordofan, West Kordofan, and Blue Nile states, with additional pockets of Stressed (IPC Phase 2)
populations in drought-prone areas of the Red Sea, North Kordofan, North Darfur and Kassala states
(FEWS NET, July 2015). About 65% of the current food-insecure population are in Darfur and 14%
in South Kordofan. Crisis (IPC Phase 3) or acute food insecurity is mainly found among internally
displaced persons (IDPs) in the SPLM-N-controlled areas of South Kordofan and the IDPs in Darfur
displaced in the past six months due to conflict.
According to 2015 OCHA reports, more than 3.3 million of these people are in need of humanitarian
assistance. The latest update of the Ministry of Livestock (February 2016) corroborates this finding. It
estimates the number of people in need of urgent interventions at 3.5 million as a result of the impact
of El Niño (Ministry of Livestock, Fisheries and Rangeland, February 2016). These people are located
in the West Kordofan, North Kordofan, East Darfur, North Darfur, Blue Nile, White Nile, River Nile
Kassala, Gedarif, and Red Sea states. The El Niño phenomenon greatly impacted Sudan. In 2015,
rains were delayed and erratic. Below-average rainfall was registered. As a consequence, areas
planted have been reduced and planting has been delayed in several areas. Water availability was
reduced both for livestock and human consumption. Pasture conditions were poor, and livestock
conditions have deteriorated as a consequence. Competition for access to pastures could have led to
increased tension between pastoralists since the beginning of 2016. The migration of livestock has
started earlier than usual.

63
Increased sales of livestock have been observed, especially in eastern Sudan. As a consequence, the
prices of livestock are far below average in eastern Sudanese markets. The incomes of herders are
thus likely to be reduced, which will possibly jeopardise their access to food (Ministry of Livestock,
Fisheries and Rangeland, Februray 2016).
FEWS NET (October 2015) also warns that conflict has also continued to displace people in the states
of Darfur, South Kordofan, and the Blue Nile. In many cases, the displaced have limited access to
agricultural land, labour opportunities, markets, and humanitarian assistance.
Figure 26: Food Security outcome July 2015; Source: FEWS NET July 2015 report
8.2.2 Nutrition security situation
In the latest 2015 report, OCHA declares an overall GAM burden in Sudan of two million children
(OCHA Humanitarian Bulletin 26 October - 1 November 2015). As of July 2015, 80 246 children
with severe acute malnutrition (SAM) have been admitted to outpatient therapeutic programmes
(OTPs) across the country. This compares to 76 941 and 64 733 SAM admissions during the same
period in 2014 and 2013 respectively (Figure 27). This increase may in part be attributed to the
implementation of the CMAM expansion plan, with 943 treatment facilities now serving severely
malnourished children, compared to 795 in December 2014 (Sudan National SAM admission trends,
Sudan Nutrition Cluster).
Moreover, among the displaced population it is estimated that 22 000 children under five and pregnant
and lactating women still require nutrition assistance (Sudan Nutrition Sector Bulletin, August 2015).

64
Figure 27: National admissions of new severe acute malnutrition (SAM) cases in Sudan.
Source: Sudan Nutrition Sector Bulletin, August 2014, issue 2.
8.2.3 Main factors of food and nutrition insecurity
The major factors contributing to food and nutrion insecurity in the country are internal conflict and
civil insecurity as well as below-average rainfall conditions in May and July 2015 due to weather
phenomena related to El Niño.

65
8.3 Central African Republic (CAR)
With a population of 4 525 000, the Central African Republic (CAR) is one of the poorest countries in
the world. It has a Human Development Index of 0.35, which places it in 187th place out of 188
countries in the 2015 UNDP Human Development Index (UNDP, 2015). The main livelihoods in the
country are food agriculture (cassava, corn, groundnuts, sorghum and millet), cash crops (coffee,
citrus fruit, cotton), livestock breeding, mining (diamonds and gold), hunting, fishing and/or
gathering.
8.3.1 Food security situation
The conflict has seriously affected the agricultural sector, which has fallen by 46% in 2013. In 2014,
food production has been estimated at 762 689 metric tonnes, which represents a reduction of 58%
comparatively to the production level before the political crisis. For the season 2014-2015, there is a
deficit of around 60 000 tonnes in cereal production, despite an increase of 11% in cassava production.
Compared to the non-crisis period, a drop of between 67% and 77% has been registered for livestock.
In terms of fishing, a fall of 40% in the number of fish landed has been recorded, mainly due to the
loss of equipment.
In the CAR, people are facing serious deterioration in food access due mainly to destroyed
livelihoods, a decrease in domestic production and high food prices. This situation implies a decrease
in the quantity of food intake and in diet diversification. According to the FAO (November 2015),
cassava is substituting nutritious cereal and vegetable staples, and there is a sharp reduction in
consumption of animal proteins. This widespread dietary deterioration raises serious concerns, as it
has a direct effect on nutrition and health.

66
Figure 28: Trend in retail prices in Bangui. Left: selected agricultural commodities. Right: selected
food items. Source: Institut Centrafricain des Statistiques, des Études Economiques et Sociales
(ICASSES).
As shown on Figure 28, the national average trend in retail prices (maize, cassava, groundnut and
millet) is the same as the situation in the main market of Bangui. Food prices sharply increased from
early 2014, and in August 2014 the prices of maize, millet and groundnuts were 30-70% higher than
in March-April 2014. The sharp rise in prices was mainly due to an increase in demand, following a
resumption of payments to civil servants in March 2014 (which injected more cash into the economy)
and at the return of many IDPs to their homes. However, prices of local production such as cassava
declined by 13% between February and August 2014. This situation can be explained by an increase
in production with limited movement of products, and the retention of large amounts of supplies
around the surplus-producing zone of the capital, Bangui.
The 2015 IPC analysis indicates that, in December 2015, about 504 000 people were in IPC Phase 4
(Emergency) and 820 200 in IPC Phase 3 (IPC Technical Working Group, December 2015). More
than 20% of the population were in IPC Phase 4 in three sous-prefectures: Kabo (Ouham), Mbrès
(Nana-Gribizi) and Bambari (Ouaka). Areas with more than 20% in Phase 3 or above include six
prefectures (Mambéré-Kadei, Ouham-Pendé, Ouham, Nana Gribizi, Ouaka and Vakaga), and five
sous-prefectures (Abba (Nana-Mandere), Rafai (Mbomou), Zemio, Obo and Bambouti (Haut
Mbomou)).
Figure 28 shows the evolution of food insecurity from April 2014 to December 2015. A peak in the
population with humanitarian needs was observed in April 2014 (lean season). The situation in April
2015 showed an improvement, with about 25% less people in IPC humanitarian phase compared to
April 2014. However, in December 2015 the number of people in Phase 3 and above increased
compared to April 2015 (by 19.5% in rural areas and 27% in the capital). Food consumption levels
remain far below requirements in several areas. The last Emergency Food Security Assessment
(EFSA) and Rapid Response Mechanism (RRM) surveys reported by the IPC technical working
groups indicate that only 56% of the population has an acceptable food consumption score. In
addition, livelihoods have been eroded by the crisis.

67
Figure 29: Acute food insecurity situation, April 2014, April 2015 (projection until November 2015)
and December 2015.Source: CAR-IPC Technical Working Group.
According to OCHA, conflict has led to the continued internal displacement of more than 399 000
IDPs in the CAR, with 70 000 in Bangui, and approximately 460 000 have fled to neighbouring
countries as refugees (as of mid-October 2015, OCHA). In November 2015, according to the IPC
Technical Working Group (December 2015), the number of displaced people was 211 893. However,
the situation varies between areas. While the number of displaced people has decreased in most areas,
it has increased in Ouka (30%), Haut-Mbomou (28%) and Kémo (17%).
As reported by USAID (November 2015), threats to food security in the CAR include a resurgence of
armed conflict, population displacement, attacks on food transporters, disrupted markets, poverty, and
difficult access to food and safe water. Because of protracted conflict and displacement, agricultural

68
production continues to drop, and 1.3 million of people in the CAR are in need of emergency food
assistance.
Due to recent attacks (September 2015) in Bambari (prefecture of Ouaka), the Agency for Technical
Cooperation and Development (ACTED) conducted an evaluation of this prefecture in early in
October 2015. The findings show that around 664 households (1 940 persons) were displaced in
addition to the already existing 5 200 IDPs. IDPs had an acceptable consumption score due to WFP
food distribution, but households had only a one week or less of food stock, which is atypical for the
harvest period.
Until the first months of 2016, there will be a decrease in food availability due to seasonal
perturbations, conflict and population displacement. According to the FAO balance sheet, during the
2015 marketing year (January - December 2015), the domestic availability was around 157 000 tonnes
of cereals for 232 000 tonnes of food and non-food use; this means around 75 000 tonnes (48%) will
have to be imported.
8.3.2 Nutrition security situation
Based on the partial and preliminary results of the SMART survey in 2014, the nutrition cluster
estimated that the number of children suffering acute malnutrition in 2015 will be 110 683, of which
32 348 will be in severe acute malnutrition.
In February 2015, a pilot IPC malnutrition analysis conducted in the prefectures of Vakaga,
Bamingui-Bangoran, Nana-Gribizi and Sargha-Mbaere reported an alert situation in all of them.

69
Figure 30: Pilot IPC Malnutrition Analysis, February 2015
8.3.3 Main factors in food and nutrition insecurity
The major factors contributing to malnutrition are poor infrastructure and insecurity, which lead to
disrupted health services and limited access of humanitarian agents to malnourished populations.

70
8.4 Yemen
The Republic of Yemen is one of the driest, poorest and least developed countries in the world. It
ranks 160th out of 188 countries on the 2015 UNDP Human Development Index. 42% of the
population is poor. One fifth of Yemeni children are malnourished. The country relies on oil
production for over 70% of total government revenue. However, oil production was suspended in
January 2015 in the major oil-producing governorates of Shabwah and Hadramaut, and is likely to be
disrupted in Ma’rib due to the ongoing political crisis (FEWS NET, January 2015). Due to the high
dependency of the country on fuel and food imports (90-95% of staple food), the current war and
import restrictions have negatively affected food imports and affected the functioning of the markets,
transportation and distribution.
Besides this fragile economic situation, the situation in Yemen has deteriorated dramatically as
fighting and violence have intensified since March 2015.
8.4.1 Food security situation
Yemen is a country in a serious food security and humanitarian crisis, due to many factors such as
political instability, civil insecurity, an intensified war, and localised conflicts.
An estimated 14.4 million Yemeni were food insecure at the beginning of 2016. This represents more
than half of the population (FAO, 19 January 2016). The situation gradually deteriorated throughout
2015 because of the conflict. Food availability has dramatically fallen because of fuel shortages and
restrictions on imports. Food prices have soared and income opportunities are further restricted. Food
access is thus a big issue for Yemeni households.
According to this IPC Analysis6 (June 2015), 10 out of 22 governorates analysed (Aden, AlDhale’e,
Lahj, Taiz, Abyan, Sa’ada, Hajjah, Hodeida, Al Bayda and Shabwa) are facing a food insecurity
Emergency (IPC Phase 4). These governorates are currently among the worst affected by the
conflict. Nine governorates are classified as being in “Crisis” or IPC Phase 3 (Amran, Dhamar,
Sana’a, Sana’a city, Ibb, Mareb, Rayma, Al Mahweet and Al Jawf). It is estimated that currently
around 6.07 million people (23% of the population) face a food insecurity ‘Emergency’, while 6.8
million people (26%) are in ‘Crisis’. From the figures reported in the previous IPC analysis (2014),
6 The Yemen IPC TWG convened on 25-28 May 2015 to conduct the acute food insecurity analysis for June 2015 covering
the 22 governorates using the IPC Acute Food Insecurity Classification Protocols. The Yemen IPC TWG also asked the IPC
Global Support Unit (GSU) to carry out a Real-Time IPC Quality Review as an added quality assurance step in the
validation process of this round of the IPC Acute Food Insecurity Analysis in Yemen. It emerged that the minimum
confidence level of analyses usually required for an IPC analysis was not reached due to the absence of up-to-date outcome
evidence. However, due to the quality of the analysis and the need to inform about the food security situation, the IPC TWG
and the IPC GSU released the analysis as an indicative IPC analysis.

71
the level of food insecurity has increased by 21%. Around 158 887 households are displaced,
representing 1 019 762 individuals. Food shortages and poor access to markets, reduced access to
healthcare and sanitation, reduced income options and disruption of livelihood opportunities are the
main causes of the spiralling food insecurity. The scarcity of fuel, electricity, gas, water and other
services and utilities is further exacerbating the situation.
This analysis led to the classification of the severity of food insecurity among households as poor,
including women and children from among the small-scale farmers and sharecroppers, landless
labourers, fishermen and IDPs. This food insecurity significantly affects children, elderly and disabled
people. In addition, the remuneration of government employees has been reduced (by an estimated
30%) after austerity measures removed their monthly incentives/allowances in March 2015. This has
had a huge impact, given that about 26% of the population depend on government salaries.
Figure 31: Indicative IPC Acute food insecurity analysis in Yemen (June 2015).
Source: Yemen IPC Technical Working Group.
The food security situation has deteriorated in some governorates in 2015: Aden moved from a
stressed situation (Phase 2) to an emergency situation (Phase 4), Sana’a city from Phase 2 to Phase 3,
and four governorates (Taiz, Al Bayda, Al Dhale’e and Hodeidah) from Phase 3 to Phase 4. Besides
the food component, there is lack of access to water and basic services in the governorates of Aden,
Taiz, Lahj, Al Dhale’e and Al Bayda.

72
This fragile situation has been exacerbated by the passage of two cyclones in November 2015. It led
to significant displacement and destruction of houses, and had a great impact on fisheries, farming and
livestock.
According to the Ministry of Trade and Industry, 1 400 thousand tonnes of wheat and wheat flour
were imported from January to May 2015, with just over 400 thousand tonnes imported in April and
May. Some 740 000 tonnes of these imports were distributed to different governorates, but the amount
that reached the districts outside of the governorate capitals was limited, especially in the south-
eastern governorates where there was a ground war.
The south-western governorates reported a lack of availability of these basic food commodities on the
market due to severe shortages due to the risks and challenges of transportation and distribution to
different governorates. This situation has led to a sharp increase in the price of wheat flour, vegetal oil
and red beans in some selected markets.
As reported by OCHA (November 2015), overall food imports increased by 73% from September to
October 2015, and wheat prices have remained above pre-crisis levels (Figure 32). This may be
attributed to increased shipping costs and limited imports of fuel used to mill grains. Commercial food
imports rose to 392 000 tonnes in October, which represents an increase of more than 70% in terms of
the volume imported in September. Over the same period, humanitarian food imports increased by
54%, reaching 14 500 tonnes.
Acute shortage of fuel and consequent high prices are disrupting most economic activities and basic
services, including the transportation of goods from seaports to the other governorates and district
market centres (Figure 33). In a normal situation, the country produces oil and imports around 544 000
tonnes of refined fuels per month. However, due to the conflict and crisis, the country imported only
23% of the monthly requirement of fuel in March 2015, 1% in April and 18% in May. Fuel remains
scarce and prices continue to be high in different parts of the country. The situation is particularly
severe in areas with heavy ground fighting, such as in Aden, Abyan, Al Dhale’e, Lahj, Shabwa,
Sa’ada and Taiz.
According to the WFP’s October 2015 Market Monitoring (WFP, 2015), a slight decrease in wheat
prices and an increase in sorghum and millet prices were observed compared to September. Diesel
prices remained largely unchanged, while the price of cooking gas fell by up to 37%. With the onset
of the winter season, the prices of vegetables increased by up to 52% in some locations. The low
availability of commodities in the worst conflict-affected areas resulted in an escalation of all
commodities. During the first two weeks of October 2015, the national average price of petrol and
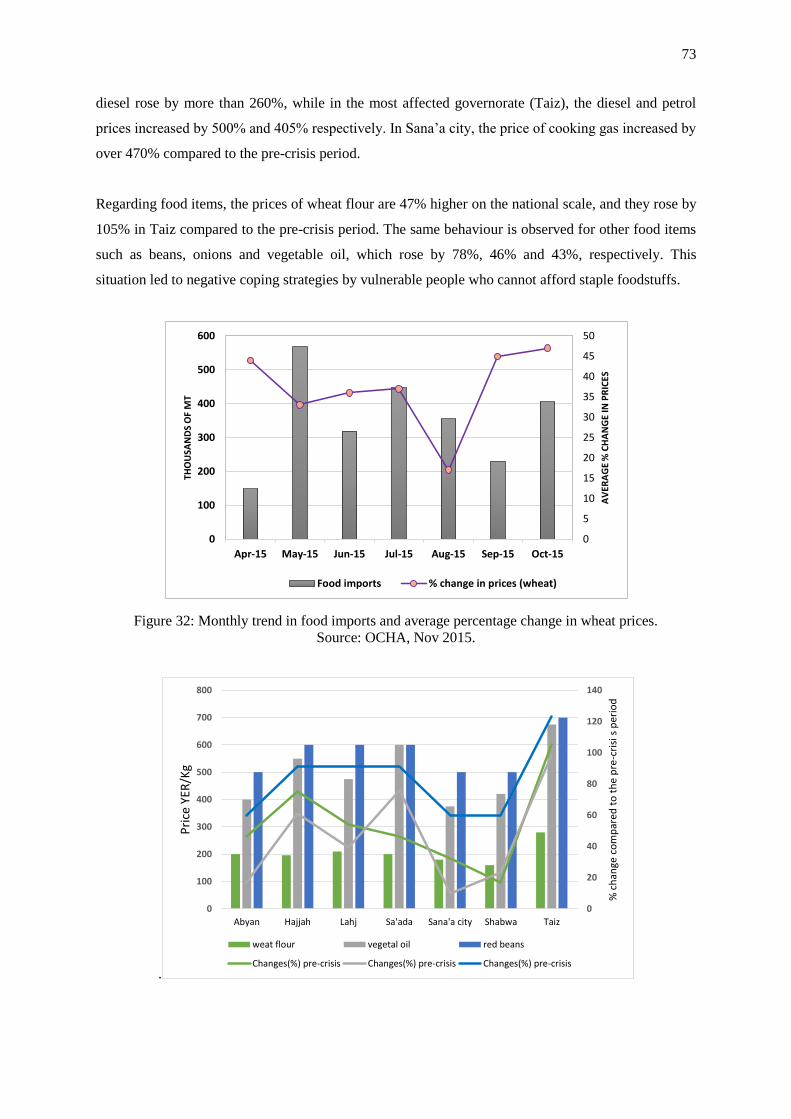
73
diesel rose by more than 260%, while in the most affected governorate (Taiz), the diesel and petrol
prices increased by 500% and 405% respectively. In Sana’a city, the price of cooking gas increased by
over 470% compared to the pre-crisis period.
Regarding food items, the prices of wheat flour are 47% higher on the national scale, and they rose by
105% in Taiz compared to the pre-crisis period. The same behaviour is observed for other food items
such as beans, onions and vegetable oil, which rose by 78%, 46% and 43%, respectively. This
situation led to negative coping strategies by vulnerable people who cannot afford staple foodstuffs.
Figure 32: Monthly trend in food imports and average percentage change in wheat prices.
Source: OCHA, Nov 2015.
.
0
5
10
15
20
25
30
35
40
45
50
0
100
200
300
400
500
600
Apr-15 May-15 Jun-15 Jul-15 Aug-15 Sep-15 Oct-15
AV
ERA
GE
% C
HA
NG
E IN
PR
ICES
THO
USA
ND
S O
F M
T
Food imports % change in prices (wheat)
0
20
40
60
80
100
120
140
0
100
200
300
400
500
600
700
800
Abyan Hajjah Lahj Sa'ada Sana'a city Shabwa Taiz
% c
han
ge c
om
par
ed t
o t
he
pre
-cri
si s
per
iod
Pri
ce Y
ER/K
g
weat flour vegetal oil red beans
Changes(%) pre-crisis Changes(%) pre-crisis Changes(%) pre-crisis

74
Figure 33: Trend in wheat flour, vegetable oil and red bean prices from selected governorates in the
1st and 2nd weeks of October 2015. Source: WFP.
8.4.2 Nutrition security situation
The child malnutrition rate in Yemen is critical and deteriorating. UNICEF estimates that almost 1.3
million children under the age of five are moderately malnourished compared to 690 000 children
prior to the crisis. They also estimate that 537 000 children under the age of five are at risk of SAM - a
threefold increase from 160 000 in March 2015. This means that one in eight children under the age of
five is at risk of severe malnutrition (OCHA, 15 October 2015).
Moreover, assessments in the Aden, Al Hudaydah and Hajjah governorates indicate that global acute
malnutrition (GAM) levels are above the emergency threshold of 15%. In the coastal areas of Al
Hudaydah and Hajjah, severe acute malnutrition (SAM) levels are at 8.9 and 3.8% respectively.
8.4.3 Main factors in food and nutrition insecurity
The escalating conflict in Yemen involving coalition air strikes and intensified ground fighting came
at a time when there was already increased civil insecurity and political instability in the country,
which has been ongoing since September 2014. The intensified conflict situation has so far affected
more than 19 of the 22 governorates of Yemen.
According to the Government’s Executive Bureau for IDPs and task force on population movements
(protection cluster 31 May 2015) report, over 158 887 families (over one million individuals) have
been internally displaced and had their livelihoods disrupted by the escalating conflic. The direct
impact and the fear of being affected by the internal ground fighting and aerial bombardment have
exacerbated the displacement and caused desperate movements of people, especially in the north-
western and southern governorates, where the fighting has been intense.
The country’s alarming malnutrition levels are aggravated by the limited availability of and access to
food due to blocked or damaged delivery routes and restrictions on food and fuel imports. At the same
time, livelihoods have been disrupted, unemployment has risen, fuel and water prices have surged and
their availability remains erratic.
The World Food Programme (WFP) reports that the national monthly average cost of a partial food
basket in September 2015 was over 30% more than the pre-crisis level. This price increase adds
further pressure to the already weakened purchasing power of average people who are struggling with

75
limited coping mechanisms, such as relying on family and friends for support and eating less
nutritious meals. Others have resorted to begging.
Moreover, access to health and nutrition services is increasingly difficult, as facilities in at least 10
governorates have been damaged. Medical supplies are low, some medical staff have fled to other
areas in search of safety and others have left the country. UNICEF reports that 192 nutrition centres
across the country had to close down due to fuel shortages and partners’ lack of access to these areas.
Deteriorating sanitation conditions exacerbate the nutrition situation, further exposing children to
diseases such as diarrhoea and malaria, perpetuating the vicious cycle of malnutrition (OCHA
Humanitarian Bulletin, 15 October 2015).

76
8.5 Syria
Violence and conflict have prevailed in Syria since March 2011. As of December 2014, over 50% of
the population has fled their homes, including about 7 million people who have been internally
displaced. It is estimated that approximately 5 000 flee Syria every day. Around 4.3 million refugees
have been registered according to the UNHCR7. From January to April 2015, more than 0.5 million
were newly displaced (OCHA, 2015). About 2.1 million Syrians are registered8 in Turkey (WFP, June
2015, ERCC, November 2015), 1.1 million in Lebanon, 630 000 in Jordan, 245 000 in Iraq, 128 000 in
Egypt, and 27 000 in North Africa. The UNHCR reports that, from the beginning of the Syrian crisis
until October 2015, the total number of asylum applications from Syrians in Europe is 681 7139.
8.5.1 Food security situation
In Syria, the 2015 Humanitarian Needs Overview (HNO) assessed that 8.7 million people were food
insecure, 6.3 million severely (OCHA, November 2014). One in three households in Syria and 40% of
the IDP population are food insecure (WFP, October 2015).
Crop production was adversely affected by the continuing crisis. Agricultural inputs are not always
available and prices are high. Other inputs are often of unreliable quality, and irrigation systems are
damaged. The availability of farm labour is reduced in its cost is high. Some crops have also been
destroyed by the conflict. The areas planted with cereals, and in many cases the areas harvested, were
limited due to insecurity. The estimated harvested wheat area in 2015 was the smallest since the 1960s
(CFSAM report, 2015). Agricultural performance was good in 2015 thanks to good rainfall levels,
both in terms of quantity and distribution. Wheat production in 2015, estimated at 2.445 million
tonnes, was significantly better than the very poor harvest of 2014 and slightly better than that of
2013. However, it is not expected to lead to significant improvements in household food security
outcomes. There is an estimated shortfall of about 800 000 tonnes in the country’s national wheat
requirement of 4.854 million tonnes (CFSAM, 2015).
The livestock sector has suffered substantially since 2011, with reductions in terms of numbers of
animals of about 30% for cattle and 40% for sheep and goats, while poultry numbers, the usual main
and most affordable source of proteins of animal origin, have fallen by 50%. In 2015, the conditions
of the livestock were good, according the 2015 CFSAM report.
7 http://data.unhcr.org/syrianrefugees/regional.php
8 These are the number of registered refugees. The total number of refugees may be larger.
9 http://data.unhcr.org/syrianrefugees/asylum.php

77
After being relatively stable in 2014, food prices began increasing sharply in early 2015 as
government subsidies were curtailed and the currency depreciated. The prices of many critical goods
spiralled in 2014, such as bread (which increased by 66% in private bakeries, and by 87% in public
bakeries).
The Syrian refugee population in neighbouring countries count for about 4 290 332 people according
to the UNHCR (http://data.unhcr.org/syrianrefugees/regional.php).
There are about 1.1 million Syrian refugees in Lebanon. Their food security situation has deteriorated
since 2013 (FAO, USAID, 2015). Seventy-five percent are food insecure (compared to 66% in 2014),
among which 62% are mildly food insecure, 12% moderately food insecure and 0.4 % severely food
insecure.
In Jordan there are about 600 000 Syrian refugees. Jordan has the highest per capita ratio of refugees
worldwide, with Syrian refugees making up about 10% of the Jordanian population. This puts
pressure on economic and social services in the country. Eighty-five percent of the refugees (about
534 759 persons) live outside camps, and 15% (about 94 369 persons) live in camps. Most of these
refugees are completely dependent on food aid to meet their food needs. Seventy-five percent of
refugees in communities (outside camps) were food insecure in 2015, according to the
Comprehensive Food Security Monitoring Exercise (CFSME) conducted by the Jordanian Ministry of
Planning with the WFP and REACH. This is a drastic deterioration from 2014, when 52% of the
refugees in the communities were food secure (FAO, iMMAP, USAID, 2015. RFSAN, Jordan). The
food security situation of refugees living in camps is worse than of those leaving in the local
communities.
Iraq is hosting about 247 352 Syrians, mainly in the Kurdistan Region. This region also hosts about
one million IDPs. The food security situation of the Syrian refugees in Iraqi Kurdistan is not precisely
known since, to our knowledge, no food security assessment has been conducted.
8.5.2 Nutrition security situation
UNICEF’s SMART survey suggests that three governorates (Hama, Hassakeh, and Deir Ezzor)
appear to have GAM rates that are greater than 10%.
The pre-crisis nutrition situation in Syria (2009) was poor, with an estimated Global Acute
Malnutrition (GAM) prevalence of 9.3% and stunting prevalence of 23%, indicating a poor public
health situation.

78
A series of Rapid Nutrition Assessments (RNA) were carried between March and July 2014 amongst
IDPs in 13 governorates in Syria (except Ar-Raqqa), by the Ministry of Health and UNICEF Syria.
The GAM rate and SAM rate reported were 7.2%, and 2.3%, respectively, indicating a poor situation.
Stunting prevalence was found to be above 20% in all governorates except for Homs, Da’ra, Tartous
and As-sweida, indicating a chronically poor public nutrition situation. Micronutrient deficiencies
were also recorded in Syria with the prevalence of anaemia in children of 0-59 months at 29.2%
(2011), indicating a moderate public health concern (Whole of Syria nutrition Bulletin, Issue #1
January to July 2015).
As for the situation of Syrian refugees living in other countries, preliminary results of the 2014
follow-up nutrition survey conducted in Jordan among refugees living in Za’atari camp and the local
community suggested that there has been an improvement in acute malnutrition since 2012. The 2014
survey findings revealed that GAM rates are at 1.2% in Za’atri camp and 0.8% in the local
community, whereas in 2010 the rates were 5.8 and 5.1% respectively (Inter Agency Nutrition
Assessment, 2012). However, it also showed that micronutrient deficiencies have persisted among
Syrian refugees, especially those living in camps. Results showed that the prevalence of anaemia
was at 48.7% among children under five years of age, and as high as 64% among children under two
years of age (Jordan Nutrition Response Strategy, 2014).
Among Syrian refugees in Lebanon, the low levels of consumption of certain types of protein- and
other nutrient-rich food items, and the high proportion of families who report experiencing a lack of
food or money needed to buy it, raise serious concerns about the nutrition status of these populations.
Even though the majority of families report that they had consumed vegetables, legumes, and nuts a
few times during the week preceding the assessment, one in five families had not consumed milk or
dairy products, and almost half had not consumed fruits or meat at all during the same period.
Surprisingly, families in the Beqaa agricultural region consumed vegetables and other food items less
than in other regions (UNRWA, 2015).
8.5.3 Main factors in food and nutrition insecurity
Four years of conflict have destroyed agricultural infrastructures, displaced farmers and disrupted the
regional food and agricultural input trade. Many farmers cannot access or afford inputs, which have
soared in price and degraded in quality. Livestock production is also suffering, as animal feed is
scarce and costly. Veterinary services are also lacking. Many farmers have lost their assets or have
abandoned their fields and animals because of the conflict.
Displaced and refugee populations do not have access to assets and face difficulties in entering the
labour markets in hosting communities.

79
The malnutrition situation of refugees is mainly attributed to the lack of quality and diversity of diet.

80
9 Food insecurity implications of the 2015 El Niño event
Very strong impacts of El Niño were observed in 2015 and are expected to continue until around
March 2016. The El Niño phenomenon is characterised by warmer-than-usual sea surface temperature
in the Pacific. It occurs every three to seven years, and last for six to 24 months. The current El Niño
started around late winter or early spring 2015, and is expected to last until at least March 2016.
The El Niño phenomenon is mainly associated with droughts in some regions of the world, and
cyclones, heavy rains and floods in others. Atypical and extreme weather events disturb agricultural
and livestock production or destroy crops and other assets.
Globally, it seems that the agricultural production of 2015 will not be below average. Much of the
2015 wheat yield was harvested before the onset of El Niño, and was above average in Russia,
Pakistan and the European Union. For other cereals (rice, maize), production is lower than average
but large stocks are available. Globally, stocks will decrease but still remain at reasonable levels.
Regarding regions with food security concerns, weather anomalies related to El Niño are most marked
in Southeast Asia, the Pacific Islands, the Horn of Africa, southern Africa, Central America and the
Caribbean, and South America. Remarkably, the West African Sahel is not affected by the El Niño
phenomenon, even though it is structurally vulnerable to drought. The impacts of the current El Niño
phenomenon have been particularly high in Ethiopia (which is facing the worst drought in 30 years),
Papua New Guinea (where one third of the population is affected by food shortages), Haiti and the
Dry Corridor of Central America (Guatemala, Honduras, El Salvador and Nicaragua). Its impact has
also been strongly felt in southern African countries.
The impact in terms of number of food-insecure people is summarised in the table below. However,
the reader should be aware that the numbers in the column “people in need of assistance” are not
always comparable between countries. Depending on the countries, we could access either the number
of people affected by droughts or floods, the number of food insecure without the precise definition of
what the food insecure definition covers, or the number of people in the different IPC Phases. In some
cases, the given number of people affected only pertains to the areas affected by drought or floods and
not the entire countries. The periods of the assessment may also differ. Finally, the table does not
distinguish between food insecurity that is specifically linked to El Niño and food insecurity
associated with other causes. Nevertheless, the table provides a good picture of the most recent and
complete assessments of food insecurity in countries that experienced unusual weather patterns in
2015.

81
Summary of the impact of El Niño on food security in countries prone to food insecurity
Country Number of people
requiring assistance
Date of the
assessment
Main impacts of El
Niño
Crop and food security situation summary Affected
regions within
the country
Pacific
Papua New
Guinea
About 522 000 people
require urgent food
assistance.
About 2.7 to 3 million
people face food shortages
(1/3 of the country’s
population).
1.75 million people in IPC
Phase 3 or higher (Crisis or
worse).
2015 Drought
+ Frost in the
beginning of 2015
- Below-average rainfall in 2015 and expected
until March 2016
- Harvest is severely diminished or failed
- Food availability is reduced, especially in
remote mountain areas that don’t have access
to markets
Highlands:
Enga, Chimbu
and Southern
Highland
provinces
Floods
Pacific Islands
(Fiji, Vanuatu,
Tonga,
Solomon
Islands)
4.7 million people affected. 2015 Drought and frost - Solomon Islands: crop failure; water shortage Western
Highlands
Cyclones - Fiji: 25% decrease in sugarcane production
- Vanuatu (cyclone Pam): water shortages and
lack of sanitation
Timor Leste 220 000 people affected.
Feb-March
2016
Drought - Low agricultural production
- 50% of the areas of Timor- Leste could be food
insecure by February-March 2016
Mongolia Colder and snowier
winter than usual
Philippines 12 million people could be
affected by the impact of El
Niño (FAO).
2016 Below average
rainfall
65 855 farmers affected by
drought.
August
2015
Drought - 85% of the country could be affected by
drought by March 2016
Cyclones - Typhone Koppu (US$180 million damages);
- 144 083 ha, 218 000 tonnes of crops lost

82
Central America and the Caribbean
Guatemala 1.5 million in need of
humanitarian assistance.
4.2 million people affected
by the drought.
November
2015
Drought - Reduced rains from June to September 2015
and expected until March 2016
- Very poor or failed agricultural production
(80% of crops lost)
Dry Corridor:
Baja Vera-paz,
El Progreso,
Zacapa,
Chiquimula,
Jalapa y Jutiapa,
Quiche,
Huehuetenango,
Totonicapán,
San Marcos,
Retalhuleu,
Santa Rosa and
Escuintla.
Honduras 1 350 000 affected by
drought (15% of the
population).
250 000 in immediate need
of food assistance.
2015 Drought
Floods in early
December in Colon
and Atlantida
- Below-average rains from June to September
2015 and expected until March 2016
- Very poor harvest or crop failure (-80% for
beans, -60% for maize)
- High food prices (+20% in August 2015
compared to August 2014)
Dry Corridor
El Salvador 700 000 people food
insecure and in need of
food assistance (11% of the
population).
192 000 severe acute
malnutrition cases.
2015 Drought - Below average rains from June to September
2015 and expected until March 2016
- Very poor harvest or crop failure, namely
maize
Dry Corridor
Nicaragua Up to 1 million people in
IPC Phase 2 or higher.
Drought - Reduced rains from June to September 2015 and
expected until March 2016
- Very poor harvest or crop failure
- High food prices
Dry Corridor
Cuba No data. December
2015
Drought - Dry spells in June-October 2015 affecting 68%
of the territory
- Lack of irrigation water; Dams are at 50% of

83
their capacity
- Rice production expected to decrease by 26%
and maize by 3% compared to 2014
- Milk production expected to decrease by 17%, affecting the main nutritional programme of
the government
Haiti 37 communes, about
300 000 to 560 000 people
are in Crisis (IPC Phase 3).
October to
December
2015
Drought - Below-average rainfall in the first and second
season in 2015 and is expected until March
2016
- Adds to poor harvest of 2014
- Very poor harvest (spring harvest 50% lower
than usual)
- Decreased income for agricultural wage
workers
- High food prices
Nord-ouest,
Sud-est, Sud,
Plateau Central
3.5 million food insecure.
40 communes affected by
drought.
2016 lean
season
Latin America
Bolivia Over 1 million people in
IPC Phase 3 or higher.
August
2015
Drought Below average rainfall
Floods 60 000 ha of crops destroyed
Colombia Nine of Colombia’s
32 provinces are in a state
of emergency due to
extreme drought, high
temperatures and forest
fires.
Drought - Reduced crop production
- Reduced livestock production
Aipe, Villavieja
and Baraya
municipalities
Huila
Ecuador No data. Forecasts
to March
2016
Floods
Peru No data. Forecasts
to March
2016
Floods
Cold
- Increased livestock mortality
Horn of Africa

84
Ethiopia Between 10 and 15 million
people requiring emergency
food assistance, depending
on the source.
7-8 million
IPC Phase 4 in Pastoral
southern Afar and Sitti
Zone in Somali Region, and
in the agricultural lowlands
of East and West Hararghe
Zones in Oromia.
IPC Phase 3 in Tigray,
Amhara, Afar, Oromia,
Somali and SNNPR.
400 000 severely
malnourished children.
Forecast: IPC Phase 4 until
July 2016, with up to 18
million people in need of
assistance by the end of
2016.
November
2015
Drought (worst
drought in more than
50 years)
- Below-average rainfall from June to October
2015 expected until March 2016
- Below-average Meher harvests in most
eastern cropping areas
- Massive livestock deaths, poor livestock
body conditions and very low livestock
production
- High food prices
Pastoral
southern Afar
and Sitti Zone
in Somali
Region and in
the agricultural
lowlands of
East and West
Hararghe Zones
in Oromia;
Southern
Tigray, Eastern
Amhara, lower
Bales zones of
the Oromia, and
eastern
SNNPR, Arsi
and West Arsi
Floods
South
East Imy
Woreda and
along the river
bank
Eritrea No data. Drought - Below-average rainfall in June and July
2015, delayed start of the rains
- Below-average pasture and crop production
Main
productive
areas of the
country,
principally in
the sub-zobas of
La’ealy Gash,
Malqui,
Mensura,
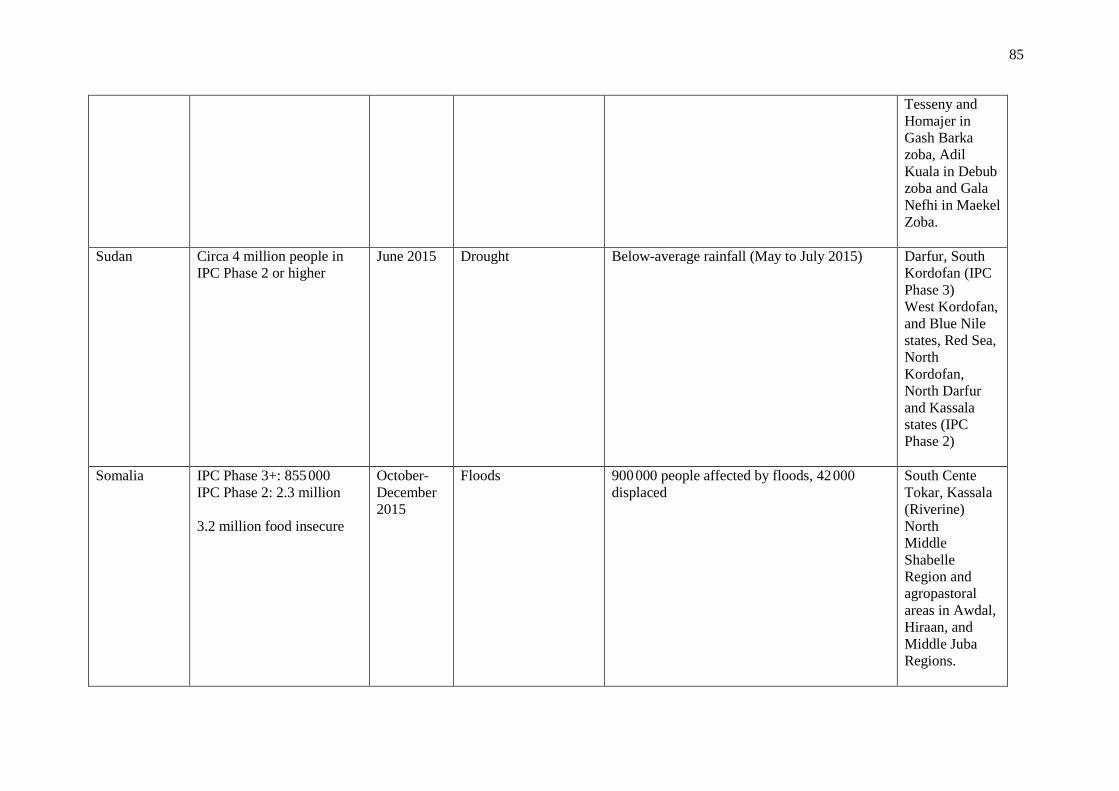
85
Tesseny and
Homajer in
Gash Barka
zoba, Adil
Kuala in Debub
zoba and Gala
Nefhi in Maekel
Zoba.
Sudan Circa 4 million people in
IPC Phase 2 or higher
June 2015 Drought Below-average rainfall (May to July 2015) Darfur, South
Kordofan (IPC
Phase 3)
West Kordofan,
and Blue Nile
states, Red Sea,
North
Kordofan,
North Darfur
and Kassala
states (IPC
Phase 2)
Somalia IPC Phase 3+: 855 000
IPC Phase 2: 2.3 million
3.2 million food insecure
October-
December
2015
Floods
900 000 people affected by floods, 42 000
displaced
South Cente
Tokar, Kassala
(Riverine)
North
Middle
Shabelle
Region and
agropastoral
areas in Awdal,
Hiraan, and
Middle Juba
Regions.

86
Drought Awdal and
Woqooyi
Galbeed, Guban
Kenya 1.1 million in severe food
insecurity
2015 Localised flooding and
mudslides/landslides
- Above-average short rains
- Possible damage to crops and post-harvest
losses.
- Livestock losses
North-western
and north-
eastern pastoral
areas and south-
eastern and
coastal
marginal
agricultural
areas
Southern Africa
South Africa About 14 million food-
insecure people, but it
seems more related to
structural socioeconomic
problems than to El Niño
impact alone.
December
2015
Drought - Below-average rainfall from October to
December 2015 (worst in 35 years) and
expected until March 2016
- Reduced planting; below-average harvest
- Poor pasture conditions; increased livestock
mortality
- Water shortages for households
- Decreased cereal exports will affect food
security in neighbouring countries
Central and
western parts
Lesotho 650 000 do not have enough
food (1/3 of the
population).
State of drought emergency
declared in Lesotho on 21
December 2015.
December
2015
Drought - Below-average rainfall from October to
December 2015 and expected until March
2016
- -Reduced planting
- Poor crop development
- -Low 2015/16 harvest expected
- Water shortages
- Poor pasture conditions
- Large numbers of drought-related cattle
deaths

87
Zimbabwe 2.8 million people food
insecure ( 19.7% of the
population).
By early
2016
Drought - Below-average rainfall from October to
December 2015 and expected until March
2016
- Adds to poor rainfall of the 2014-2015
season
- Very reduced planting
- Reduced production (50% below previous
year)
- Increased livestock mortality: 8 000 cattle
have died because of drought
Southern areas
About 930 000 people, 10%
of the rural population,
food insecure (ZimVAC).
October-
December
2015
Angola About 1.4 million people
are food insecure in the
southern areas affected by
the drought.
November
2015
Drought - Low and poorly distributed rainfall for the
third year in a row
- Poor harvest in 2014-2015 season and dry
spells at the beginning of the 2015-2016
season
- Below-average rainfall forecasted in the
south-east for early 2016
- Food price increases, up to 40-60% in
affected areas
- High rate of malnutrition in the southern
provinces
Southern areas:
Cunene, Huila.
Namibe and
Cuando
Cubango
Namibia More than 370 000 people
are food-insecure mainly in
the pastoral and agricultural
dry land areas.
November
2015
Drought
- Poor rainfall
- Crop production 30% lower than in 2014
- Pressure on water resources and poor
pastures
Botswana 30 000 people at risk of
food insecurity.
2015 Drought - Dry spell from January to end of March
2015
- Poor crop condition, crop failure
- Below average food production
- Poor pasture and livestock condition
Eastern areas
Swaziland 201 000 people face food
and livelihoods insecurity.
Between
May 2015
and
April 2016
Drought - Below-average rainfall from October to
December 2015 and expected until March
2016
- Water shortages

88
- Increased livestock mortality, poor grazing
and water conditions
Malawi 2.8 million food insecure
47% of children under five
years of age are
malnourished
January-
March
2016
Drought - Below-average rainfall from October to
December 2015 and expected until March
2016
- Adds to poor rainfall of the 2014-2015
season (harvest reduced by 30% in June
2015)
- Delayed planting but possibility to recover,
especially in the northern areas
- Pasture and livestock conditions are
sufficient
- Very high maize prices (90% higher than
last year in October 2015)
Southern areas
Mozambique
(southern and
central)
IPC Phase 3+: 176 000
IPC Phase 2: 575 000
(Vulnerability Assessment
Group)
November
2015
Drought - Below-average and delayed rains; erratic
rainfall
- Adds to poor rainfall of the 2014-2015
season
- Delayed and reduced planting
- Crop destruction
- Reduced crop yields
- Water shortages for human and livestock use
- Increased maize prices but average price
levels for other cereals
Good rainfall conditions in northern
Mozambique
South, Gaza,
Inhambane,
Sofala, and
Niassa
provinces
Zambia
(South)
800 000 people require
food (twice the 2014 level)
2015 Dry conditions - Poorly distributed and below-average rains
since the start of the cropping season in
October 2015
- Adds to poor rainfall of the 2014-2015
season: maize harvest of 2015 is 21% below
2014 production levels
31 districts,
mostly located
in the western
and eastern
provinces
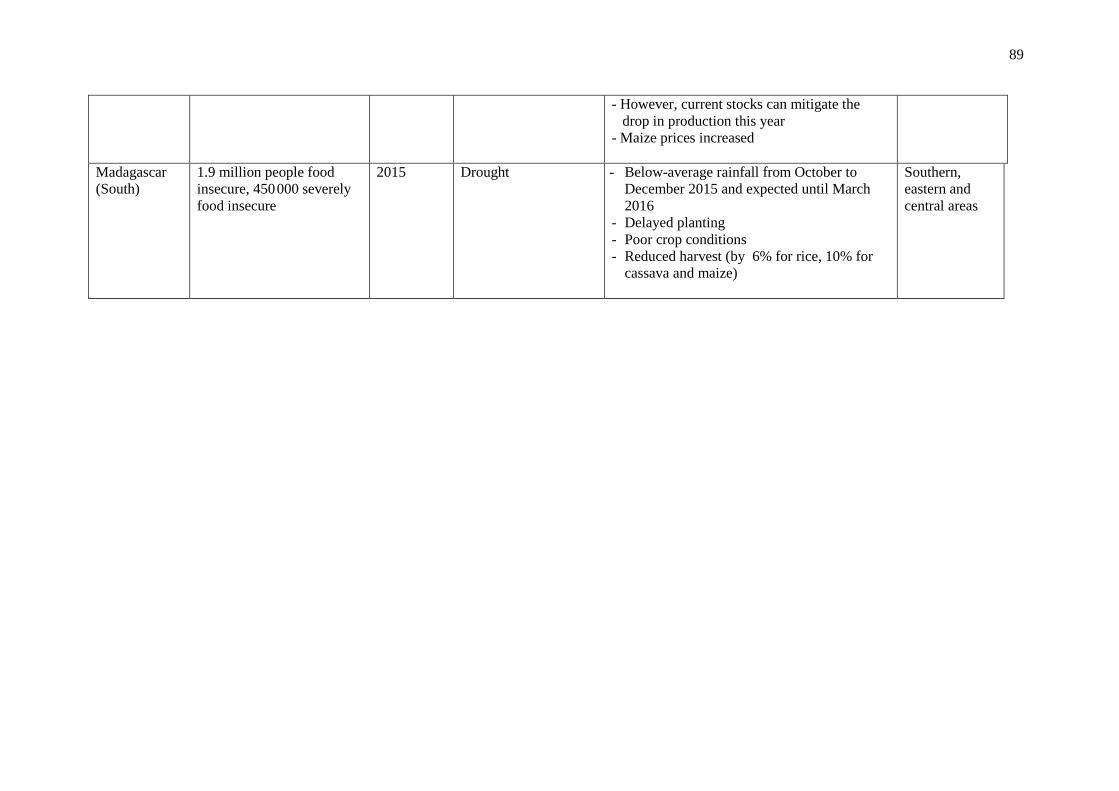
89
- However, current stocks can mitigate the
drop in production this year
- Maize prices increased
Madagascar
(South)
1.9 million people food
insecure, 450 000 severely
food insecure
2015 Drought - Below-average rainfall from October to
December 2015 and expected until March
2016
- Delayed planting
- Poor crop conditions
- Reduced harvest (by 6% for rice, 10% for
cassava and maize)
Southern,
eastern and
central areas

90
10 BIBLIOGRAPHY
Horn of Africa (general)
ECHO FACTSHEET, October 2015. Horn of Africa, European Commission Humanitarian Aid and
Civil Protection
GEOGLAM, February 2016. Crop conditions at a glance of January 28th. GEOGLAM Early warning
crop monitor N°1.
OCHA, October- December 2015. Humanitarian outlook for the Horn of Africa and the Great Lakes
region.
OCHA, October- December 2015. Humanitarian outlook for the Horn of Africa and the Great Lakes
region.
Somalia
FSNAU, September 2015. Food Security and Nutrition Analysis Unit – Somalia, Nutrition Update.
FSNAU, October 2015. Somalia Food Security and Nutrition Analysis, Post Gu 2015, Technical
Series Report No VII. 60
IFPRI, 2014. Resilience for food and nutrition security, eds by Shenggen Fan, Rajul Pandya-Lorch,
and Sivan Yosef
FEWS NET, November 2015. Somalia Food Security outlook update.
Ethiopia ECHO FACTSHEET, October 2015. Horn of Africa, European Commission Humanitarian Aid and
Civil Protection.
FEWS NET, July –December 2015. Ethiopia Food Security outlook.
Government of Ethiopia and partners, December 2015. 2016 Ethiopia Humanitarian Requirement
Document.
https://www.humanitarianresponse.info/en/system/files/documents/files/ethiopia_hrd_2016.pdf
OCHA, 26 October 2015. Weekly Humanitarian Bulletin Ethiopia;
http://reliefweb.int/report/somalia/somalia-post-deyr-201516-food-security-and-nutrition-
outlook-february-june-2016
OCHA, October- December 2015. Humanitarian outlook for the Horn of Africa and the Great Lakes
region.
UNICEF, June-July 2015. Ethiopia Humanitarian Situation Report, Unicef Sit Rep #3.
Eritrea
National Statistics Office of the State of Eritrea and Fafo Institute for Applied International Studies,
Oslo, Norway. August 2013.
UNICEF, January-June 2015. Eritrea Humanitarian Report.
WFP, January 2016. Regional Food security and Nutrition Situation. p.3
http://documents.wfp.org/stellent/groups/public/documents/resources/wfp279314.pdf,)
EC-JRC, October 2015. Crop Monitoring in Eritrea. JRC Technical Report.
91
Countries affected by Ebola in 2014 and 2015: Liberia, Guinea, Sierra Leone
CILSS, March 2015. Cadre Harmonisé for identification of areas and populations in food insecurity
in Guinea, Liberia and Sierra Leone. Regional analysis of acute food inecurity. Retrieved
from http://www.fao.org/fileadmin/user_upload/emergencies/docs/Communication-brief-
CH.pdf
CILSS, November 2015. Cadre Harmonisé for identification of areas and populations in food
insecurity in Guinea, Liberia and Sierra Leone. Regional analysis of acute food inecurity.
FEWS NET.a., August 2015. Atypically prolonged lean season contibutes to Stressed (IPC Phase 2)
acute food insecurity. Liberia Remote Monitoring Update. Retrieved from
http://www.fews.net/west-africa/liberia/remote-monitoring-report/august-2015
FEWS NET. b., August 2015. Crisis food insecurity persists despite the lifting of the offical ban on
weekly markets. Sierra Leone Remote Monitoring Update. Retrieved from
http://www.fews.net/west-africa/sierra-leone/remote-monitoring-report/august-2015
FEWS NET. c., August 2015. Stressed level of food insecurity, driven by the residual effects of the
Ebola outbreak. Guinea - Remote Monitoring Update. Retrieved from
http://www.fews.net/west-africa/guinea/remote-monitoring-report/august-2015
Institut National de la Statistique, Ministère du Plan [Guinée] and MEASURE DHS, ICF
International, Calverton, Maryland, U.S.A. 2013. Enqueête demographice et de santé et a indicateurs
multiples (EDS-MICS 2012). Conakry, Guinea.
Ministère de travail, justice et solidarité Juillet 2015. Rapport de l’Enquete Nutrition SMART Guinée.
OCHA Map nutrition situation based on SMART 2015 available at
www.humanitarianresponse/info/en/operations/Guinea
UNICEF, 16 September 2015. Liberia Situation Report on Ebola.
UNICEF, 14 October 2015. Liberia Situation Report on Ebola.
UNICEF, 14 October 2015. Sierra Leone Situation Report on Ebola
UNICEF, 28 October 2015. Sierra Leone Situation Report on Ebola
UNICEF, 28 October 2015. Guinea Situation Report on Ebola
UNICEF, WFP, HI, ACF, Terre des Homes, July 2015. Enquête Nationale Nutritionenelle basée sur
la méthodologie SMART, Juillet 2015.
WFP, August 2015. Coping improves in all three countries this month. mVAM Regional Bulletin.
Retrieved from http://vam.wfp.org/sites/mvam_monitoring/Ebola.html
WFP, July 2015. Negative coping decreasesin Guinea and Liberia. mVAM Regional Bulletin #9.
Retrieved from http://vam.wfp.org/sites/mvam_monitoring/Ebola.html
WFP, June 2015. More negative coping as lean season begins. mVAM egional Bulletin #8. Retrieved
from http://vam.wfp.org/sites/mvam_monitoring/Ebola.html

92
Gambia
Gambian Government/ FAO/CILSS/FEWS-NET/WFP, November 2015. Pre-harvest assessment of
the 2015/2016 cropping season in The Gambia.
Gambian Government/ FAO/CILSS/FEWS-NET/WFP, November 2015, Cadre Harmonise for
identifying risk areas and populations in food and nutritional insecurity in The Gambia
Democratic People’s Republic of Korea
Democratic People’s Republic of Korea, 17 September-17 October 2012. Final Report of the National
Nutrition Survey 2012.
EC-JRC, August 2014. Seasonal monitoring in DPRK 2014. Lower crop production expected
compared to 2013. JRC Scientific and Policy Report.
EC-JRC, July 2015. Early Assessment of the 2015 cropping season in DPRK. Technical report.
FAO-GIEWS, February 2015. The Democratic People’s Republic of Korea (DPRK). Outlook
for food supply and demand in 2014/2015.
OCHA, DPR Korea 2015. Humanitarian Needs & Priorities.
Randall Ireson (18 June 2015). Worst Drought Ever – A Cautionary Note, available at: http://38north.org/2015/06/rireson061815/ WFP, September 2013. Food and Nutrition Security in the Democratic People’s Republic of
Korea.
WFP, 1 July-30 September 2015. DPR Korea Brief.
WFP, VAM food security analysis, 2013. Food and Nutrition Security in the Democratic
People’s Republic of Korea, Pyongyang, DPRK.
Nepal
Central Bureau Statistics. National Planning Commission Secretariat. Government of Nepal and
UNICEF. Nepal Multiple Indicator Cluster Survey 2014, Key Findings. January 2015.
WFP, May 2015, Nepal, A report on the food security impact of the 2015 earthquake Central Bureau
Statistics. National Planning Commission Secretariat. Government of Nepal and UNICEF.
Nepal Multiple Indicator Cluster Survey 2014, Key Findings, January 2015.
Nepal Cluster Bulletin, August 2015.
Nepal Food Security and Nutrition Portal, available at: http;//www.nnfs.gov.np/
NeKsaP, Februray 2016. Joint Assesment of Food Security, Livelihood and Early Recovery. http://neksap.org.np/uploaded/resources/Publications-and-
Research/Others/Joint%20Assessment%20of%20Food%20Security,%20Livelihoods%20and
%20Early%20Recovery.pdf

93
Papua New Guinea
CARE. (October 2015). PNG: El Niño monitoring.
Global Nutrition Report. (2015). Retrieved from http://globalnutritionreport.org/the-report/
IFPRI. (2015). 2015 Global Hunger Index. Retrieved from http://www.ifpri.org/publication/2015-
global-hunger-index-armed-conflict-and-challenge-hunger
OCHA. (7 January 2016). Papua New Guinea: Drought. UN Resident Coordinator'soffice Situation
Report.
OCHA(22 february 2016). Papua New Guinea: Drought. UN Resident Coordinator'soffice Situation
Report. https://www.humanitarianresponse.info/en/node/120303
Oxfam. (2015). En Papouasie Nouvelle Guinée, El Niño plonge des milliers de personnes dans la
faim. Retrieved from http://oxf.am/ZevR
Oxfam. (October 1, 2015). Navigation en eaux troubles. la sécurité limentaire sous la menace d'el
Nino. Note d'information. Retrieved from
https://www.oxfam.org/sites/www.oxfam.org/files/file_attachments/mb-el_nino-uncharted-
waters-fr.pdf
WFP. (September 2015). Papua New Guinea El Niño 2015-2016 (ppt presentation).
Wilson, C. (December 2015). Malnutrition: a Silent Emergency in Papua New Guinea. Inter Press
Agency.
Guatemala
FEWS NET (13 August 2014). CENTRAL AMERICA Food Security Alert.
FEWS NET (20 December 2014). CENTRAL AMERICA Food Security Alert.
Ministerio de Salud Pública y Asistencia Social (MSPAS),Instituto Nacional de Estadística
(INE),Centros de Control y Prevención de Enfermedades (CDC) (2010) Encuesta nacional de
salud materno infantil 2008 (ENSMI-2008/09). Ciudad de Guatemala, Guatemala: Ministerio
de Salud Pública, MSPAS, INE y CDC, 2010 (and additional analysis).
WFP (2013). Mapeo y análisis de la desnutrición crónica en Guatemala VAM 2012.
Secretaria de Seguridad Alimentaria y Nutricional (SESAN), Gobierno de Guatemala (2014).
Pronóstico de Seguridad Alimentaria y Nutricional. Periodo: diciembre 2014 a febrero 2015.
SESAN, September 2015.Muertes por desnutricion en Guatemala. Report from the Guatemala
Government published in http://reliefweb.int/report/guatemala/muertes-por-desnutrici-n-en-
guatemala-se-reducen-en-20-por-ciento
Haiti
ACF. (2015, October 23). Haïti: la sécheresse et l'insécurité alimentaire en ballotage. Retrieved from
http://www.actioncontrelafaim.org/fr/content/haiti-la-secheresse-et-l-insecurite-alimentaire-
en-ballotage-0
CNSA. (Octobre 2015). Panier alimentaire et conditions actuelle de la securité alimentaire.
Retrieved from http://www.cnsa509.org/panier-alimentaire-et-conditions-actuelles-de-
securite-alimentaire-octobre-2015/
94
CNSA. (September 2015). Alerte à l'insécurité alimentaire. Retrieved from
http://www.cnsa509.org/haiti-alerte-a-linsecurite-alimentaire-septembre-2015/
CNSA, FEWSNET. (2015). Haiti: perpsectives sur la sécurité alimentaire - Octobre 2015 à mars
2016. Retrieved from http://www.cnsa509.org/haiti-perspectives-sur-la-securite-
alimentaireoctobre-2015-a-mars-2016/
FAO. (30 December 2015). GIEWS Country Brief. Retrieved from
http://reliefweb.int/sites/reliefweb.int/files/resources/HTI30-December-2015.pdf
FEWS NET. (December 2015). Haiti Price Bulletin. Retrieved from http://www.fews.net/central-
america-and-caribbean/haiti/price-bulletin/december-
2015?utm_source=FEWS%20NET%20Daily%20Digest&utm_campaign=ac44c9a10a-
RSS_EMAIL_CAMPAIGN&utm_medium=email&utm_term=0_02ee344349-ac44c9a10a-
84428741
FEWS NET. (November 2015). Food assistance Outlook Brief. Retrieved from
http://www.fews.net/fr/global/food-assistance-outlook-brief/november-2015
Global Nutrition Report. (2015). Retrieved from http://globalnutritionreport.org/the-report/
Haiti IPC Technical Working Group. (2015). IPC Chronic Haiti. Preliminary results. (personal
communication).
IFPRI. (2015). 2015 Global Hunger Index. Retrieved from http://www.ifpri.org/publication/2015-
global-hunger-index-armed-conflict-and-challenge-hunger
OCHA. (August 2015). The Humanitarian Country Team in Haiti is appealing for funds to meet the
critical humanitarian needs. Humanitarian bulletin haiti. Retrieved from
https://www.humanitarianresponse.info/en/system/files/documents/files/ocha_haiti_humanitar
ian_bulletin_53_-_august2015.pdf
OCHA (31 December 2015). Haiti: Humanitarian Snapshot (Jan- Dec 2015)
https://www.humanitarianresponse.info/en/operations/haiti/infographic/haiti-humanitarian-snapshot-
jan-dec-2015
World Bank. (2015). Haiti: Overview. Retrieved from
http://www.worldbank.org/en/country/haiti/overview
South Sudan
FEWS NET, July 2015. Emergency (IPC Phase 4 persists in Greater Upper Nile, Crisis (IPC Phase3)
increases in western areas. South Sudan Food Security Outlook.
FEWS NET October 22, 2015. Alert: 3.9 Million People are in Need or Urgent Action to Save
Livelihoods and Lives and to Prevent Famine
http://www.fews.net/east-africa/south-sudan/alert/october-22-2015
IPC, September 2015. Food security and Nutrition Analysis – Key message,
http://www.ipcinfo.org/ipcinfo-detail-forms/ipcinfo-map-detail/en/c/338142/
IPC, October 22, 2015, Call for immediate Humanitarian Action to prevent Famine in South Sudan.
3.9 Million people are in need of urgent action to save livelihoods and lives and to prevent
famine http://www.ipcinfo.org/ipcinfo-detail-forms/ipcinfo-news-detail/en/c/338892/

95
National Bureau of Statistics, The Republic of South Sudan, 04 February 2016. Consumer price index
for South Sudan. http://static1.1.sqspcdn.com/static/f/750842/26838632/1454679387347/CPI-
Jan+2016_press+release..pdf?token=KXaQ0PWeKOnqyCXIpQhHxzlVXLo%3D
South Sudan Nutrition Cluster, April-June 2015. Quarterly Bulletin.
WFP, August/September 2015. Food Security and Nutrition Monitoring System, South Sudan.
WFP, 2015. South Sudan: The 2015 Rainfall Seasonal Analysis. December 2015.
http://www.wfp.org/content/south-sudan-2015-rainfall-season
Sudan
IPC technical working group, September 2015. Acute Food Insecurity Overview. Sudan.
http://www.ipcinfo.org/ipcinfo-detail-forms/ipcinfo-map-detail/en/c/343809/
FEWSNET, July 2015. Sudan Food security Outlook. Below average rainfall delays main season
planting across most of Sudan.
http://reliefweb.int/sites/reliefweb.int/files/resources/Sudan%20FSO_07_2015.pdf
Ministry of Livestock, Fisheries and Rangeland, February 2016.El Niño in Sudan, email
communication.
OCHA Humanitarian Bulletin Sudan Issue 44 (26 October- 1 November 2015)
Sudan Nutrition Sector Bulletin, issue no 1, August 2015.
Central African Republic
Humanitarian team, Janvier 2015-Decembre 2015. Plan de Réponse Humanitaire République
Centrafricaine.
IPC Technical Working Group – CAR, December 2015. Analyse de la situation de la sécurité
alimentaire-Décembre 2015 à Mai 2016.
Yemen
FAO, 19 January 2015. FAO in the 2016 humanitarian appeals.
http://www.fao.org/emergencies/appeals/2016/en/
Ministry of Public Health and Population, 8-12 August 2015. Nutrition & Mortality Survey in
Hodeidah Lowland Yemen- Hodeidah Governorate Health Office.
Ministry of Public Health and Population, 8-13 August 2015. Nutrition & Mortality Survey in Aden
Yemen- Aden Governorate Health Office.

96
OCHA, 15 October 2015. Humanitarian Bulletin Yémen.
http://reliefweb.int/sites/reliefweb.int/files/resources/Yemen%20Humanitarian%20Bulletin-
%2015%20October%202015.pdf
Syria
ERCC, 4 November 2015. ECHO Daily Map.
http://erccportal.jrc.ec.europa.eu/getdailymap/docId/1371
FAO, WFP, 23 July 2015, Special Report, Crop and Food Security Assessment Mission to the Syrian
Arabic Republic. http://www.fao.org/3/a-i4804e.pdf
FAO, iMMAP, USAID, 2015. Overview of food security situation in Lebanon. RFSAN Situation
Report.
http://rfsan.info/wp-content/uploads/2015/09/RFSAN-Food-Security-Report-Lebanon-Aug2015.pdf
FAO, iMMAP, USAID, 2015. Overview of food security situation in Jordan. RFSAN Situation
Report.
http://rfsan.info/wp-content/uploads/2015/09/RFSAN-Food-Security-Report-Jordan-Aug2015.pdf
Nutrition Cluster Syria, 2015. Whole of Syria Nutrition Bulletin. January to July 2015, issue #1.
UNRWA, 2015. Lebanon, profiling the vulnerability of Palestine refugees from Syria living in
Lebanon.
OCHA, November 2014. Humanitarian Needs Overview. Syrian Arabic Republic.
http://jubileecampaign.org/wp-content/uploads/2015/04/2015-Humanitarian-Needs-Overview.pdf
UNHCR, UNICEF and WFP, 2015. Vulnerability Assessment of Syrian Refugees (VASyR) in
Lebanon.
Syrian Humanitarian Field Team, 2014. Jordan Nutrition Response Intervention Strategy.
Inter-Agency Nutrition Assessment Syrian refugees in Jordan host communities and Zaatri camp,
2012.
WFP, UNICEF, UNHCR, 2014. Vulnerability Assessment of Syrian Refugee in Lebanon.
http://foodsecuritycluster.net/sites/default/files/VASyR%202014%20FINAL.pdf
WFP, June 2015. Situation Update. Syria crisis Regional Response.
http://documents.wfp.org/stellent/groups/public/documents/ep/wfp276498.pdf
WFP, October 2015. Global Food Security Update, Issue 19. http://vam.wfp.org/sites/global_update/
97
Europe Direct is a service to help you find answers to your questions about the European Union
Free phone number (*): 00 800 6 7 8 9 10 11
(*) Certain mobile telephone operators do not allow access to 00 800 numbers or these calls may be billed.
A great deal of additional information on the European Union is available on the Internet.
It can be accessed through the Europa server http://europa.eu
How to obtain EU publications
Our publications are available from EU Bookshop (http://bookshop.europa.eu),
where you can place an order with the sales agent of your choice.
The Publications Office has a worldwide network of sales agents.
You can obtain their contact details by sending a fax to (352) 29 29-42758.

98
doi:10.2788/669159
ISBN 978-92-79-57814-4
LB-N
A-2
7879-E
N-N
JRC Mission
As the Commission’s
in-house science service,
the Joint Research Centre’s
mission is to provide EU
policies with independent,
evidence-based scientific
and technical support
throughout the whole
policy cycle.
Working in close
cooperation with policy
Directorates-General,
the JRC addresses key
societal challenges while
stimulating innovation
through developing
new methods, tools
and standards, and sharing
its know-how with
the Member States,
the scientific community
and international partners.
Serving society Stimulating innovation Supporting legislation
Recommended