A cost analysis of promotional products versus other advertising media
Released at the 2013 ASI Power SummitA PDF of this report (plus end buyer-friendly, downloadable charts) can be found at asicentral.com/study
©Copyright 2013 Advertising Specialty Institute. All Rights Reserved
This report may be reproduced and used in presentations by active supplier, distributor and decorator members of the Advertising Specialty Institute (ASI) to educate the public about advertising specialties. Such use must not alter the
information and must set forth the following legend: “Research provided by the Advertising Specialty Institute, ©2013, All Rights Reserved.” No other use is permitted without the express written consent of ASI.
V.3
GLOBALADVERTISINGSPECIALTIESIMPRESSIONSSTUDY
GLOBALADVERTISINGSPECIALTIESIMPRESSIONSSTUDY
V.4

2©2013 Advertising Specialty Institute®. All Rights Reserved.
Introduction . . . . . . . . . . . . . . . . . . . . . . . . . . . . . . . . . . . . . . . . . . . . . . . . . . . . . . . . . . . . . . . . . . . . . . . . . . . . . . . . . . . . . . . . . . . . . . . . . .3
��Section One
Product Popularity . . . . . . . . . . . . . . . . . . . . . . . . . . . . . . . . . . . . . . . . . . . . . . . . . . . . . . . . . . . . . . . . . . . . . . . . . . . . . . . . . . . . . . . . .4
Product Spotlight: Writing Instruments . . . . . . . . . . . . . . . . . . . . . . . . . . . . . . . . . . . . . . . . . . . . . . . . . . . . . . . .5
Product Spotlight: Shirts . . . . . . . . . . . . . . . . . . . . . . . . . . . . . . . . . . . . . . . . . . . . . . . . . . . . . . . . . . . . . . . . . . . . . . . . . . . . . . . .6
Product Spotlight: Bags. . . . . . . . . . . . . . . . . . . . . . . . . . . . . . . . . . . . . . . . . . . . . . . . . . . . . . . . . . . . . . . . . . . . . . . . . . . . . . . . . . 7
Product Spotlight: Calendars . . . . . . . . . . . . . . . . . . . . . . . . . . . . . . . . . . . . . . . . . . . . . . . . . . . . . . . . . . . . . . . . . . . . . . . . .8
Product Spotlight: Desk Accessories. . . . . . . . . . . . . . . . . . . . . . . . . . . . . . . . . . . . . . . . . . . . . . . . . . . . . . . . . . . . . . 9
Product Spotlight: Caps/Headwear . . . . . . . . . . . . . . . . . . . . . . . . . . . . . . . . . . . . . . . . . . . . . . . . . . . . . . . . . . . . . . . 10
Product Spotlight: Drinkware . . . . . . . . . . . . . . . . . . . . . . . . . . . . . . . . . . . . . . . . . . . . . . . . . . . . . . . . . . . . . . . . . . . . . . . . 11
Product Spotlight: USB Drives . . . . . . . . . . . . . . . . . . . . . . . . . . . . . . . . . . . . . . . . . . . . . . . . . . . . . . . . . . . . . . . . . . . . . . . 12
Product Spotlight: Health & Safety Items . . . . . . . . . . . . . . . . . . . . . . . . . . . . . . . . . . . . . . . . . . . . . . . . . . . . . . 13
Product Spotlight: Outerwear . . . . . . . . . . . . . . . . . . . . . . . . . . . . . . . . . . . . . . . . . . . . . . . . . . . . . . . . . . . . . . . . . . . . . . . . 14
Staying Power. . . . . . . . . . . . . . . . . . . . . . . . . . . . . . . . . . . . . . . . . . . . . . . . . . . . . . . . . . . . . . . . . . . . . . . . . . . . . . . . . . . . . . . . . . . . . . . . . 15
Promo Products are Passed Along — Usefulness is Key . . . . . . . . . . . . . . . . . . . . . . . . . . . . . . . . . 16
How Many Items Do People Own? . . . . . . . . . . . . . . . . . . . . . . . . . . . . . . . . . . . . . . . . . . . . . . . . . . . . . . . . . . . . . . . . . 18
��Section Two
Recipients’ Views on Advertisers. . . . . . . . . . . . . . . . . . . . . . . . . . . . . . . . . . . . . . . . . . . . . . . . . . . . . . . . . . . . . . . . . . . 19
Swaying Opinions . . . . . . . . . . . . . . . . . . . . . . . . . . . . . . . . . . . . . . . . . . . . . . . . . . . . . . . . . . . . . . . . . . . . . . . . . . . . . . . . . . . . . . . . . . .20
Ad Specialties Generate New Business . . . . . . . . . . . . . . . . . . . . . . . . . . . . . . . . . . . . . . . . . . . . . . . . . . . . . . . . . .21Location of Promotional Products . . . . . . . . . . . . . . . . . . . . . . . . . . . . . . . . . . . . . . . . . . . . . . . . . . . . . . . . . . . . . . . . .22
�Section Three
Promotional Products Make an Impression . . . . . . . . . . . . . . . . . . . . . . . . . . . . . . . . . . . . . . . . . . . . . . . . . .23
The Cost-Effectiveness of Ad Specialties . . . . . . . . . . . . . . . . . . . . . . . . . . . . . . . . . . . . . . . . . . . . . . . . . . . . . . .25
Demographics . . . . . . . . . . . . . . . . . . . . . . . . . . . . . . . . . . . . . . . . . . . . . . . . . . . . . . . . . . . . . . . . . . . . . . . . . . . . . . . . . . . . . . . . . . . . . . . .26
Table of Contents
GLOBALADVERTISINGSPECIALTIESIMPRESSIONSSTUDYV.4

3©2013 Advertising Specialty Institute®. All Rights Reserved.
The ASI Ad Impressions Study was first launched in 2006 by ASI’s research team to give its members powerful data that proves ad specialties are one of the most high-impact, cost-effective ad mediums available.
Through thousands of live and online interviews with businesspeople and college students in key cities in the United States, Canada, Europe and Australia, the study gauges consumer perceptions of promotional products and how they influence buying decisions; highlights the popularity of key promo product categories by demographic group (such as age, race, sex and gender); reveals the cost-per-impression of top advertising specialty product categories; and shows the cost-per-impression of promotional products compared to other forms of advertising media, like radio, TV and Internet advertising. The study is conducted by ASI annually.
MethodologyThis report contains results from the 2012 study and additional research which took place in 2013. For the 2013 phase of the study, conducted during May through July of 2013, ASI’s research team and business partners interviewed businesspeople in nine metro areas: Atlanta, Boston, Houston, Phoenix, San Francisco, Madrid, Rome, Berlin/Düsseldorf and Sydney. In Germany, ASI partnered with PSI (Promotional Product Service Institute) to administer the surveys, while Pantheon Systems conducted the research in Sydney, Australia. Respondents in all regions were asked questions about the promotional products they had received, including how many they had, how they used them, why they kept them, and their impressions of the advertisers that gave them the items.
Further, an online panel survey was conducted among recipients of advertising specialties in those same geographic areas to augment the sample from the man-on-the-street interviews. All respondents were at least 18 years old. Results from the 2012 ASI Ad Impressions Study have been incorporated here so that additional metro areas can be included in the analysis as well as providing a more robust view of the U.S. Last year there were 12 metro areas: New York, Chicago, Miami, Los Angeles, Seattle, Dallas, Philadelphia, London, Paris, Toronto, Vancouver and Montreal. This brings the total number of metro areas covered by the report over the two-year period to 21, eight of which took place outside of the U.S. There are responses from eight different countries in the report. The total combined number of interviews, both in person and online, for both waves of this study is 7,145.
How This Report is OrganizedThis report contains three sections:
• “Product Popularity” (Pages 4 to 18) highlights the most popular promotional products by category, and includes detailed demographic breakdowns by geography, gender, race, age, income and political affiliation. For example, on the “Product Spotlight: Writing Instruments” section on page 5, you’ll note that women are significantly more likely than men to own a logoed pen or pencil, and over one-half of Caucasians own branded writing instruments. This section will be a helpful tool for distributors to use in guiding their clients toward products that will be the most impactful in their marketing efforts.
• “Recipients’ Views on Advertisers” (Pages 19 to 22) reveals important information showcasing how long businesspeople hold onto logoed items; what they do with items they don’t wish to keep; and how many total promotional items they own, broken out by a variety of demographic groups. This section provides hard data to combat objections from buyers who may think that promotional items are “throwaways” or “afterthoughts” in a marketing campaign, and may not understand their true value.
• “Promo Products Make an Impression” (Pages 23 to 25) highlights the industry products that deliver the best cost-per-impression and compares the cost-per-impression of ad specialties to other forms of media, like Internet and radio advertising. This is a great tool distributors can use to convince end-buyers to allocate more of their marketing dollars to promotional products.
While this report includes the study’s highlights, ASI members can go online at www.asicentral.com/study for a research tool that will allow them to gain access to the full study data.Note: All demographic breakdowns (age, race, gender, etc.) reflect U.S. consumers only. Respondents from other countries are represented in aggregate.
ASI’s research team polled 7,000+ consumers in 21 metro areas to prove the power of promotional products.
4
Section One
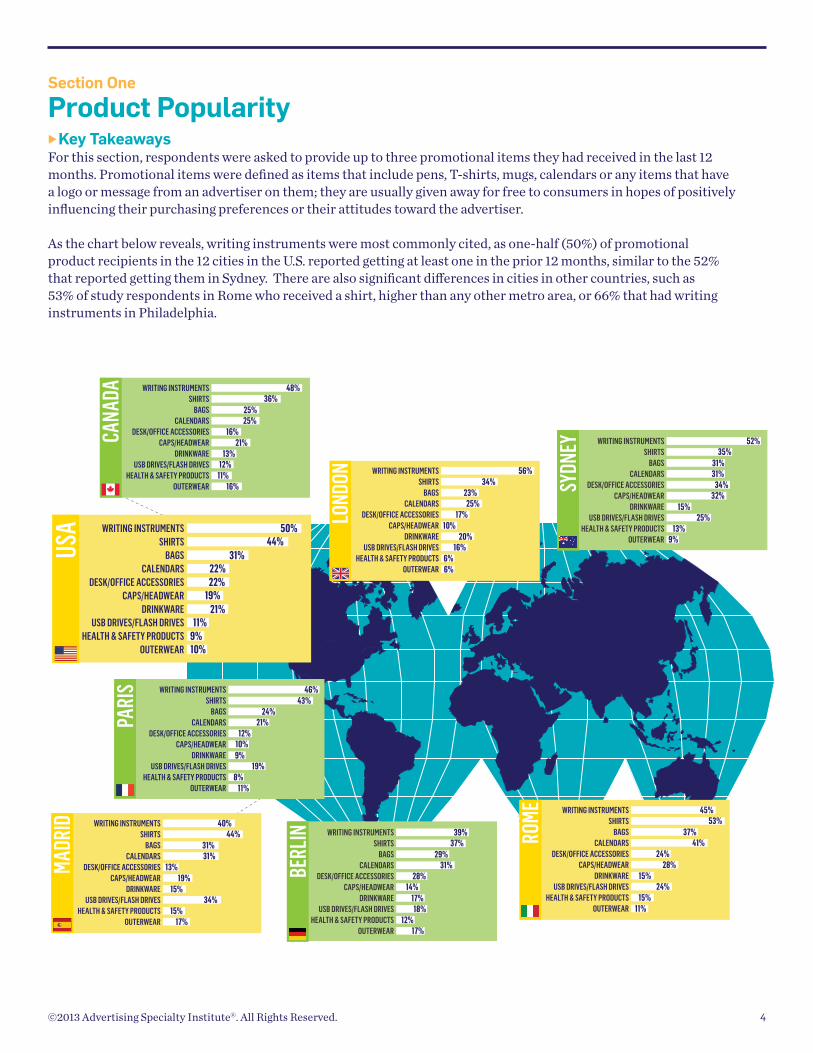
Product PopularityKey TakeawaysFor this section, respondents were asked to provide up to three promotional items they had received in the last 12 months. Promotional items were defined as items that include pens, T-shirts, mugs, calendars or any items that have a logo or message from an advertiser on them; they are usually given away for free to consumers in hopes of positively influencing their purchasing preferences or their attitudes toward the advertiser.
As the chart below reveals, writing instruments were most commonly cited, as one-half (50%) of promotional product recipients in the 12 cities in the U.S. reported getting at least one in the prior 12 months, similar to the 52% that reported getting them in Sydney. There are also significant differences in cities in other countries, such as 53% of study respondents in Rome who received a shirt, higher than any other metro area, or 66% that had writing instruments in Philadelphia.
©2013 Advertising Specialty Institute®. All Rights Reserved.
WRITING INSTRUMENTSSHIRTS
BAGSCALENDARS
DESK/OFFICE ACCESSORIESCAPS/HEADWEAR
DRINKWAREUSB DRIVES/FLASH DRIVES
HEALTH & SAFETY PRODUCTSOUTERWEAR
50%44%
31%22%22%
19%21%
11%9%10%
USA
WRITING INSTRUMENTSSHIRTS
BAGSCALENDARS
DESK/OFFICE ACCESSORIESCAPS/HEADWEAR
DRINKWAREUSB DRIVES/FLASH DRIVES
HEALTH & SAFETY PRODUCTSOUTERWEAR
52%35%
31%31%
34%32%
15%25%
13%9%
SYDN
EY
WRITING INSTRUMENTSSHIRTS
BAGSCALENDARS
DESK/OFFICE ACCESSORIESCAPS/HEADWEAR
DRINKWAREUSB DRIVES/FLASH DRIVES
HEALTH & SAFETY PRODUCTSOUTERWEAR
40%44%
31%31%
13%19%
15%34%
15%17%
MADR
ID
WRITING INSTRUMENTSSHIRTS
BAGSCALENDARS
DESK/OFFICE ACCESSORIESCAPS/HEADWEAR
DRINKWAREUSB DRIVES/FLASH DRIVES
HEALTH & SAFETY PRODUCTSOUTERWEAR
45%53%
37%41%
24%28%
15%24%
15%11%
ROME
LOND
ON
5.8
WRITING INSTRUMENTSSHIRTS
BAGSCALENDARS
DESK/OFFICE ACCESSORIESCAPS/HEADWEAR
DRINKWAREUSB DRIVES/FLASH DRIVES
HEALTH & SAFETY PRODUCTSOUTERWEAR
56%34%
23%25%
17%10%
20%16%
6%6%
PARI
S WRITING INSTRUMENTSSHIRTS
BAGSCALENDARS
DESK/OFFICE ACCESSORIESCAPS/HEADWEAR
DRINKWAREUSB DRIVES/FLASH DRIVES
HEALTH & SAFETY PRODUCTSOUTERWEAR
46%43%
24%21%
12%10%9%
19%8%
11% ★
★★★★
★★
★
WRITING INSTRUMENTSSHIRTS
BAGSCALENDARS
DESK/OFFICE ACCESSORIESCAPS/HEADWEAR
DRINKWAREUSB DRIVES/FLASH DRIVES
HEALTH & SAFETY PRODUCTSOUTERWEAR
48%36%
25%25%
16%21%
13%12%
11%16%
CANA
DA
WRITING INSTRUMENTSSHIRTS
BAGSCALENDARS
DESK/OFFICE ACCESSORIESCAPS/HEADWEAR
DRINKWAREUSB DRIVES/FLASH DRIVES
HEALTH & SAFETY PRODUCTSOUTERWEAR
39%37%
29%31%
28%14%
17%18%
12%17%
BERL
IN

5
50% 66%
5,788
More Women than Men Own Promo Pens & Pencils
56%of Caucasian
consumers own branded writing
instruments – the highest percentage
of any racialdemographic.
Logoed pens and pencilstie bags for the lowest cost-per-impression inthe United States.
47%53%
1/10thof a cent
2013
continue towriting instruments the most. 66% say they own a branded pen or pencil, vs. 50% in the U.S. overall.
Philadelphians
Rome generates the most product impressions of any European city.
Writing instruments are more popularthan in the U.S.
52%DOWN UNDER
52% of Aussies own a branded writing instrument.
Product Spotlight: Writing Instruments
©2013 Advertising Specialty Institute®. All Rights Reserved.

6
Product Spotlight: Shirts
62%
VivaItalia!
40%
46%
41%
Romans love their gelato. . .and their promo tees. 53% of consumers in Rome own branded shirts —the highest percentage of any of the 21 metro areas in the survey.
46%say they own a promotional shirt, vs. 44% in the U.S.
★
Men Own More Promo Shirts Than Women
45%
40%
TEE IT UP!Although they’re
popular among all age groups, younger
consumers are most likely to own a
branded shirt.
55+
21-34
35-44
45-54
48%
45%
33%
35%
U.S. CONSUMERS OWN A PROMOTIONAL SHIRT
44%OF U.S. CONSUMERS OWN A PROMOTIONAL SHIRT
52%of Latino
consumers own a promotional
T-shirt, the most of any racial
demographic.
53%
The Vote Is In46% of independent voters report owninga promotional shirt. 40% of Democrats and 41% of Republicans make the same claim.
Independent
GEORGIA
Atlanta
Of the 12 U.S. metro cities where people were polled, consumers in Atlanta lead the way.
©2013 Advertising Specialty Institute®. All Rights Reserved.

7
Logoed bags tie with writing instruments as having the lowest cost-
per-impression of any promotional item in the
United States.
1/10th of a cent=
37%The percentage of African Americans
who own promo bags – the highest percentage of any
racial demographic.
By the BayIn the United States, San Franciscans are most likely to own a promotional bag.
of consumers there have received one in the last 12 months.
Women are more likely than men to own branded bags
24%36%★
38%35%>$50,000
33%$50,000 - $99,00
30%$100,000+
Income GapPeople who make less than $50,000 are most likely to carry promo bags.
Product Spotlight: Bags
Bags generate more impressions in the United States than any other promotional item.
5,983Politically Speaking
33% of Democrats own logoed bags, compared to 27% of Republicans and
27% of Independents.
27%
33%
27%
Inde
pend
ent
31%OF U.S. CONSUMERS
OWN A PROMOTIONAL BAG
©2013 Advertising Specialty Institute®. All Rights Reserved.

8
22% OF U.S. CONSUMERS OWN A PROMOTIONAL CALENDAR
76% of consumers who own calendars say they display them prominently in their homes or offices.
Product Spotlight: Calendars
37%HAVE ONEIN THEIRPOSSESSION NOW
Of all the metro areas, consumersin Montreal have the most branded calendars.
27%of consumers in Houston own promotional calendars. That’s five percentage points above the U.S. average.
★
Northern Exposure
21-3435-4445-5455+
15%
24%27%29%
Better With Age Branded calendars are especially popular among older consumers.
The Votes are InIndependent voters were
most likely to report having calendars.
26%
22% 21%
Independent
9 mo. 7 mo.
Staying Power Not surprisingly, calendars are held onto longer than all other promotional products — nine months on average, compared to seven months for the average ad specialty.
OnDisplayPromotional calendars are great branding tools.
76%
©2013 Advertising Specialty Institute®. All Rights Reserved.

9
OF U.S. CONSUMERS OWN A LOGOED DESK ACCESSORY22%
25%
24% 18%
Women Vs. MenWomen are more likely than men
to own desk accessories.
ABC
Women Men
Go Blue!Democrats are the most likely among the major political parties to own
desk accessories.
25%
18%
19%
35-4421-34 45-54 55+
25%
20% 19%16%
Trending YoungYounger consumers
are more likely to have desk accessories
than older ones.
The percentage of U.S. Asian consumers who own desk accessories, the most of any
racial demographic group.
44%
Inde
pend
ent
Product Spotlight: Desk Accessories
34% OF SYDNEY RESIDENTS ADORN THEIR DESKS WITH PEN SETS, LOGOED PHONE CHARGERS, BUSINESS CARD HOLDERS AND THE LIKE.
Australians are the most likely to have a branded desk accessory.
©2013 Advertising Specialty Institute®. All Rights Reserved.

10
19%OF U.S. CONSUMERSOWN A PROMOTIONAL CAP
Men at WorkMale consumers are far
more likely than females to own a branded cap.
Dollar SignsLooking to target high earners? A cap might do the trick. Those who earn $100,000+ are more likely to wear a branded hat.
24% 14%
21-34 years
35-44years
45-54years
55+years
16%
23%21%
18%
Hats off to Gen Xers Caps are most popular among the 35- to 44-year-old segment.
Seeing Red22% of Republicans own promotional hats, versus 20% of Independents and 18% of Dems.
Sydney
Rome
Canada
U.S.
Madrid
Berlin
London
Paris
The Aussies Win! Consumers in Sydney, Rome and Canada all own more caps than those in the U.S. London has the fewest cap-wearers.
59%Why do people keep
branded hats? A majority do so because
they’re useful, but looks matter, too. 42%
say they also keep caps because they are
attractive.
32%28%
20%19%19%
14%12%
11%
20%> $50,000
25%$50,000 - $99,000
27%$100,000 +
Product Spotlight: Caps/Headwear
HAVE ONEIN THEIRPOSSESION NOW
©2013 Advertising Specialty Institute®. All Rights Reserved.

11
More women own branded
drinkware than men
Consumers under 35 own more drinkware than their
older counterparts.
Branded drinkware is just as likely to be kept in the office as in the home
Branded drinkware is just as likely to be kept in the office as in the home. 36% of consumers there own
promotional drinkware.
Drinks inthe Desert Of all of the metro areas surveyed, Phoenix residents
love their logoed mugs and glasses the most.
25%
21-34
39%MuggingIt Up
20% 20% 19%
35-44 45-54 55+
OF U.S. CONSUMERS
OWN BRANDED DRINKWARE
21%
Campaign CupsDemocrats report owning more drinkware than members of other
political parties.
23% 21% 19%
Vs.17%24%
Product Spotlight: Drinkware
Independent
©2013 Advertising Specialty Institute®. All Rights Reserved.

12
21-34 years 35-44 years 45-54 years 55+ years
13% 11% 8% 7%
of Asian consumers in the U.S. own branded USB Drives, leading the
way among all racial demographic groups.
14%In
depe
nden
t
13%
11%8%
27%Merci! Parisians are far more likely to own promotional USB drives than consumers in other cities: 27% own them vs. 11% of U.S. consumers.
★Paris
OF U.S. CONSUMERSOWN A LOGOED
USB DRIVE
11%
18%
12%
10%
Product Spotlight: usB Drives
HAVE ONEIN THEIRPOSSESION NOW
Trending Young Younger consumers are more likely to own a promo USB drive than their older counterparts.
Deep Pockets Six-figure earners are more likely to own a logoed USB drive than those in other economic groups.
Men are More Likely to Own a Branded
USB Drive Than Women
14%
8%
Democrat = Techie?13% of democratic voters own branded USB drives; 8% of Republicans own them and 11% of Independents have them on hand.
$50,000 - $99,000
> $50,000
$100,000 +
©2013 Advertising Specialty Institute®. All Rights Reserved.

13
14% of African American
consumers own branded health and safety items,
the most of any racial demographic group.
Product Spotlight: Health & Safety Items
of U.S. consumers can immediately remember the advertiser’s name on the safety product they own.
YOUTHFUL CHOICES
Consumers between 21 and 34 were the most likely to own a logoed health and
safety product.
IT’S A TIE!17% of Berlin residents own promotional health and safety products, the
most in Europe.
17% of San Franciscans own promotional health
and safety items, the most in the United States.
9%OF U.S. CONSUMERS
OWN PROMOTIONALHEALTH & SAFETY PRODUCTS
★
★
17% 82%
11%
7%
9%
7%
21-34 years 35-44 years 45-54 years 55+ years
UNITED STATES
GERMANY
©2013 Advertising Specialty Institute®. All Rights Reserved.

14
Total RecallJackets have the best
advertiser recall of any promotional product. A whopping 95% of those
who own logoed outerwear can recall
the advertiser’s name.
Business-BuilderIn the U.S., nearly half (48%) of all outerwear recipients say they were more likely to do business with an advertiser after they were given a logoed jacket.
In the Money
Those with household incomes above
$100,000 are slightly more likely to have branded outerwear
than those with lower incomes.
9%OF U.S. CONSUMERSHAVE PROMOTIONAL OUTERWEAR
Bundle Up!Outerwear recipients
think very favorably about the advertiser —
especially in Sydney, where 86% of
consumers think more positively about an
advertiser after receiving a
promotional jacket.
95%
To the LeftDemocrats are more likely to have logoed
jackets than members of other political parties.
>$50,000
$50,000 –$99,000
$100,000+
8%
10%
12%
10%7% 6%
=
Product Spotlight: Outerwear
HAVE ONEIN THEIRPOSSESION NOW
48%U.S.A.
©2013 Advertising Specialty Institute®. All Rights Reserved.

15
Staying PowerIn addition to identifying the logoed items they had kept, respondents were asked how long they kept the most recently-obtained item of each product type. On average, ad specialty items are kept for nearly seven months in the U.S. Overall, calendars are typically held the longest - about nine months on average. Writing instruments are held the shortest amount of time at just over five months.
Fun factThe longest time an item was kept was in Madrid, where calendars were kept nearly 13 months. The shortest was in Rome, where writing instruments were kept only 4.1 months.
Key Takeaways• One of the advantages promotional products have is that just one item can deliver a message for a far longer time
period than other forms of advertising. Advertisers can reinforce their brand or a call to action for an average of seven months, and even longer on some products such as calendars and outerwear.
• Perhaps not surprisingly, calendars are kept for a long period. This offers advertisers obvious advantages, but because of their longevity, steps should be taken to keep the product noticed. For example, a changing image each month is key; so is positioning an advertiser’s logo in a prominent spot on each page.
Number of Months Promotional Items are Kept
CALENDARSOUTERWEARDRINKWAREUSB DRIVESBAGSAVERAGECAPSDESK/OFFICE ACC. SHIRTSHEALTH/SAFETYWRITING INSTRUMENTS
9.07.3
7.16.9
6.86.6
6.06.0
5.85.5
5.3
0.0 2.0 4.0 6.0 8.0 10.0
©2013 Advertising Specialty Institute®. All Rights Reserved.
16
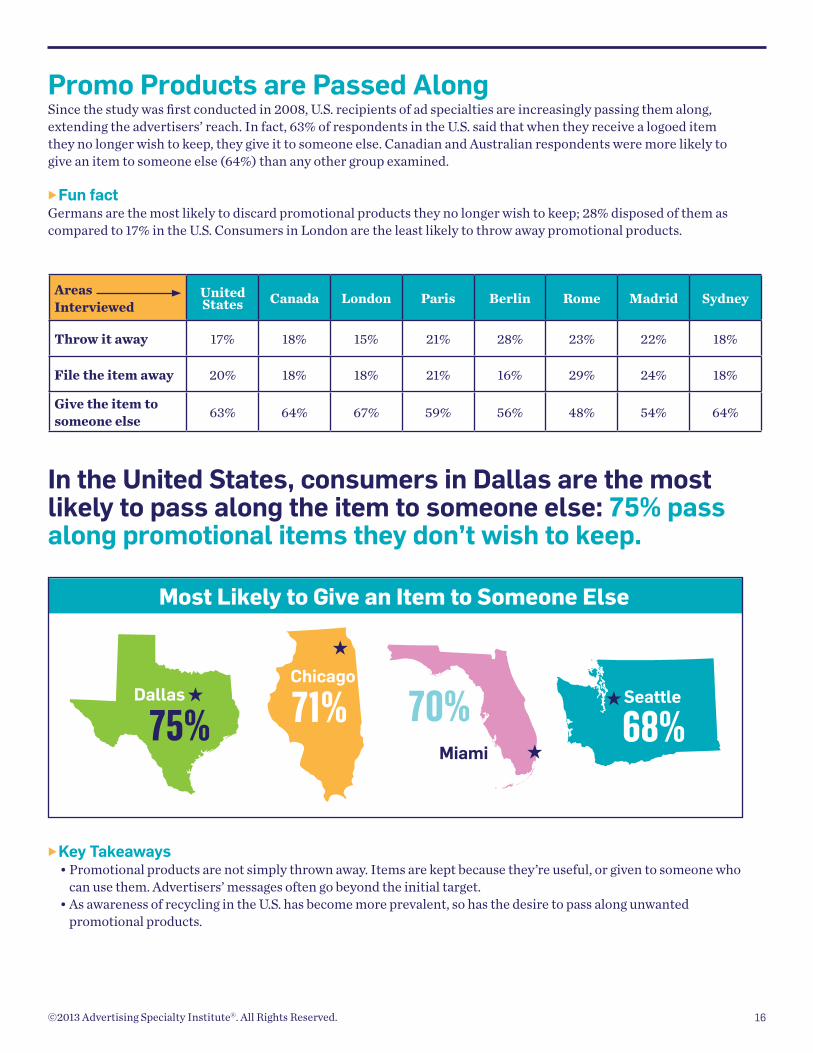
Promo Products are Passed AlongSince the study was first conducted in 2008, U.S. recipients of ad specialties are increasingly passing them along, extending the advertisers’ reach. In fact, 63% of respondents in the U.S. said that when they receive a logoed item they no longer wish to keep, they give it to someone else. Canadian and Australian respondents were more likely to give an item to someone else (64%) than any other group examined.
Fun factGermans are the most likely to discard promotional products they no longer wish to keep; 28% disposed of them as compared to 17% in the U.S. Consumers in London are the least likely to throw away promotional products.
In the United States, consumers in Dallas are the most likely to pass along the item to someone else: 75% pass along promotional items they don’t wish to keep.
Key Takeaways• Promotional products are not simply thrown away. Items are kept because they’re useful, or given to someone who
can use them. Advertisers’ messages often go beyond the initial target.• As awareness of recycling in the U.S. has become more prevalent, so has the desire to pass along unwanted
promotional products.
©2013 Advertising Specialty Institute®. All Rights Reserved.
Areas Interviewed
United States Canada London Paris Berlin Rome Madrid Sydney
Throw it away 17% 18% 15% 21% 28% 23% 22% 18%
File the item away 20% 18% 18% 21% 16% 29% 24% 18%
Give the item to someone else 63% 64% 67% 59% 56% 48% 54% 64%
★
★
Most Likely to Give an Item to Someone Else
★
★DallasChicago
Miami
Seattle
75% 71% 68%70%
17©2013 Advertising Specialty Institute®. All Rights Reserved.
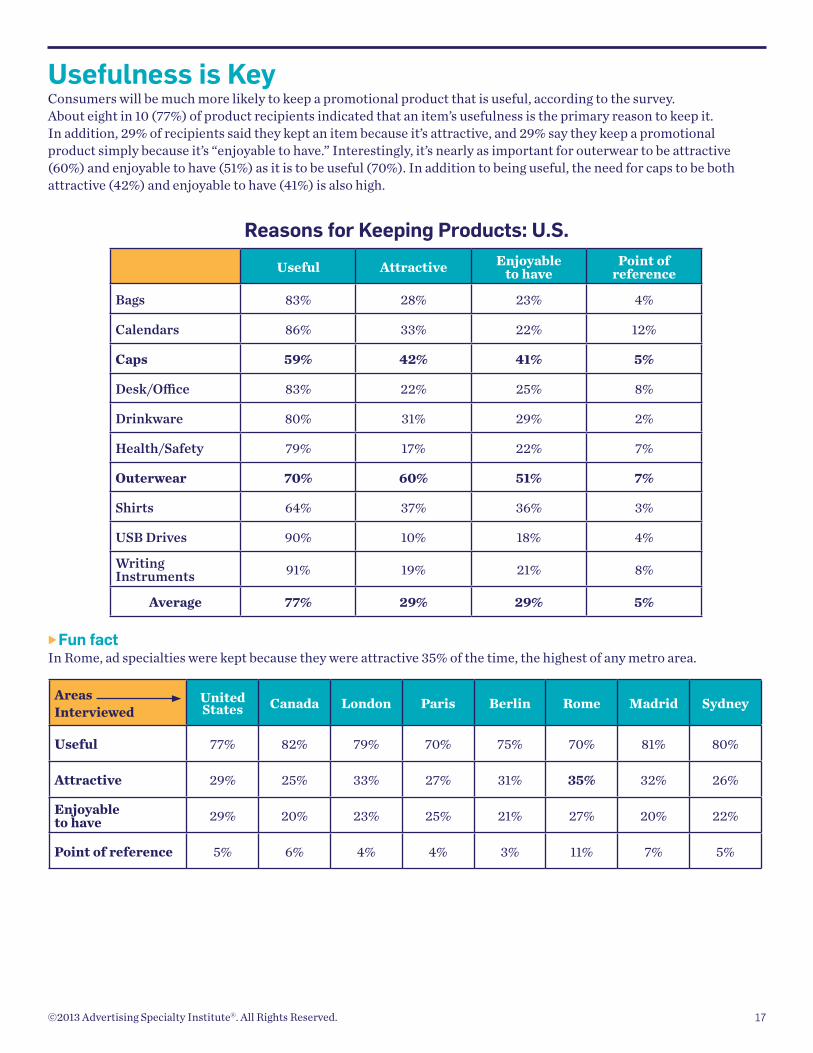
Usefulness is KeyConsumers will be much more likely to keep a promotional product that is useful, according to the survey. About eight in 10 (77%) of product recipients indicated that an item’s usefulness is the primary reason to keep it. In addition, 29% of recipients said they kept an item because it’s attractive, and 29% say they keep a promotional product simply because it’s “enjoyable to have.” Interestingly, it’s nearly as important for outerwear to be attractive (60%) and enjoyable to have (51%) as it is to be useful (70%). In addition to being useful, the need for caps to be both attractive (42%) and enjoyable to have (41%) is also high.
Fun factIn Rome, ad specialties were kept because they were attractive 35% of the time, the highest of any metro area.
Areas Interviewed
United States Canada London Paris Berlin Rome Madrid Sydney
Useful 77% 82% 79% 70% 75% 70% 81% 80%
Attractive 29% 25% 33% 27% 31% 35% 32% 26%
Enjoyable to have 29% 20% 23% 25% 21% 27% 20% 22%
Point of reference 5% 6% 4% 4% 3% 11% 7% 5%
Useful Attractive Enjoyable to have
Point of reference
Bags 83% 28% 23% 4%
Calendars 86% 33% 22% 12%
Caps 59% 42% 41% 5%
Desk/Office 83% 22% 25% 8%
Drinkware 80% 31% 29% 2%
Health/Safety 79% 17% 22% 7%
Outerwear 70% 60% 51% 7%
Shirts 64% 37% 36% 3%
USB Drives 90% 10% 18% 4%
Writing Instruments 91% 19% 21% 8%
Average 77% 29% 29% 5%
Reasons for Keeping Products: U.S.

How Many Items Do People Own?In the study, respondents were asked how many logoed items they currently had in their homes and/or offices. As indicated in the accompanying charts, people in the U.S. own an average of 9.8 promotional products. The number varies according to U.S. city, country, gender, race, income, age and political affiliation.
Democrats reported having the most promotional items in 2012 (10.5), a change from the prior year. Deeper support among Democrats for President Obama than the Republican challenger Mitt Romney could be part of the reason why.
Key Takeaway Knowing the target audience can help any marketing initiative be more successful. While promotional products are widely valued, some groups have more than others, either by interest or opportunity.
African AmericanHispanic Caucasian Asian
10.0 10.39.2
Inde
pend
ent
Dem
ocra
t
Repu
blic
an>$50,000
Own 8.5Promotional
Products
$50,000- $99,999
Own 10.0Promotional
Products
$100,000+
Own 10.8Promotional
Products
People who make:
In the U.S., as income increases, so does the number of ad specialties owned.
Republicans have more ad specialtiesthan Democrats or Independents.
Males aged 55+ own the greatest number of ad specialties.
Males aged 55+ own the greatest number of ad specialties .
Typically, people have about 10 ad specialties. Asians have more ad specialties than any other group.
Who owns the most ad specialties?average number of items owned
Females in Spain have the most ad specialties, while females in Germany have the least.
Seat
tle
London Chi
cago
Dal
las
Residents of Dallas ownthe most promo products.
9.18.2 10.0 10.7
75%71%70%67% 68%
9.1
9.8United States
9.9Spain
Italy
9.8Italy
7.4Australia
7.9Australia
7.8Germany
7.2Germany
9.7United States
8.3Spain
35-44
U.S. Males U.S. Females
21-34 45-54 55+
8.710.7 10.2
35-4421-34 45-54 55+
11.2
9.5 9.310.7 10.1
9.3Canada
9.6Canada
9.1U.K
7.7U.K
France
8.5France
8.1
Mia
mi
African AmericanHispanic Caucasian Asian
10.0 10.39.2
Inde
pend
ent
Dem
ocra
t
Repu
blic
an
>$50,000
Own 8.5Promotional
Products
$50,000- $99,999
Own 10.0Promotional
Products
$100,000+
Own 10.8Promotional
Products
People who make:
In the U.S., as income increases, so does the number of ad specialties owned.
Republicans have more ad specialtiesthan Democrats or Independents.
Males aged 55+ own the greatest number of ad specialties.
Males aged 55+ own the greatest number of ad specialties .
Typically, people have about 10 ad specialties. Asians have more ad specialties than any other group.
Who owns the most ad specialties?average number of items owned
Females in Spain have the most ad specialties, while females in Germany have the least.
Seat
tle
London Chi
cago
Dal
las
Residents of Dallas ownthe most promo products.
9.18.2 10.0 10.7
75%71%70%67% 68%
9.1
9.8United States
9.9Spain
Italy
9.8Italy
7.4Australia
7.9Australia
7.8Germany
7.2Germany
9.7United States
8.3Spain
35-44
U.S. Males U.S. Females
21-34 45-54 55+
8.710.7 10.2
35-4421-34 45-54 55+
11.2
9.5 9.310.7 10.1
9.3Canada
9.6Canada
9.1U.K
7.7U.K
France
8.5France
8.1M
iam
i
18©2013 Advertising Specialty Institute®. All Rights Reserved.

19
Section Two: Recipients’ Views on Advertisers
Recipients’ Views on AdvertisersFor this section, we asked respondents whether they could identify the advertisers on the promotional items they currently owned. The result: Nearly nine in 10 (86%) U.S. recipients of promotional merchandise can identify the advertiser on the item, the highest of any country in the study. As the graphic below reveals, of all major product categories, outerwear has the highest recognition of all promotional items: 95% of respondents who have logoed outerwear can name the advertiser on the items. Overall, wearables as a whole maintain a very high advertiser awareness rate, taking the top three spots.
Fun factAdvertiser awareness is high in other countries as well. In Canada, 85% of respondents can identify the advertiser. In all other countries in the study, recipients were able to recall the advertiser on a promotional item about 80% of the time.
Key Takeaways • Distributors who have clients looking to get their company or brand’s name in the marketplace have a
compelling reason to suggest advertising specialties as a marketing solution: Promotional product recipients clearly remember the advertisers on the items they receive.
• The more interaction recipients of promotional items have with the item, the higher the recognition of the advertiser. This explains in part why wearables lead the way with advertiser recall. Further, a higher perceived value of the product, such as that obtained with outerwear, increases advertiser recognition even more. Distributors looking to present clients with an item of high perceived value that has high advertiser recognition might consider higher-end wearables as an option.
Rememberthe Advertiser
86%
On Average
Owners of ad specialties recall the advertiser 86% of the time.
©2013 Advertising Specialty Institute®. All Rights Reserved.

20
Swaying OpinionsIn this section, we also asked consumers their opinions of advertisers who gave them a logoed item. Over one-half (53%) of the time, ad specialties leave a more favorable impression of the advertiser. This trend was seen across all countries.
Outerwear leaves the most positive attitude about the advertiser, as three-quarters (75%) of branded outerwear recipients had a more favorable impression of the advertiser.
Positive attitudes about the advertiser are correlated with advertiser recall. Once again, the top three products generating positive feelings are also the most likely to have advertiser recall.
An exception to that rule is health and safety products, which have a lower advertiser recollection but generate favorable impressions about the advertiser.
Fun factItalians were even more likely to feel favorable towards the advertiser, with nearly two-thirds (64%) of those in Rome citing a more positive view, by far the most of any group.
Key Takeaway All categories of promotional products generate favorable impressions of the advertisers as a whole. Steps should be taken when presenting recipients with items that are seen as more of a commodity (like writing instruments) to reinforce the advertiser connection with the item.
How Recipients Feel About the Advertiser: U.S.
OUTERWEARSHIRTSCAPS/HEADWEARHEALTH/SAFETY PRODUCTSBAGSAVERAGEUSB DRIVES/FLASH DRIVESDESK/OFFICE ACC. CALENDARSDRINKWAREWRITING INSTRUMENTS
75%61%
59%54%
53%53%
52%50%
49%48%
43%
0% 10% 20% 30% 40% 50% 60% 70% 80%
53% of recipients feel more favorable about the advertiser after receiving an item.
©2013 Advertising Specialty Institute®. All Rights Reserved.

21
Ad Specialties Generate New BusinessWhen consumers were asked how likely they were to do business with an advertiser they hadn’t previously done business with after receiving an item, over one-third (36%) said they were more likely to do business with them in the future.
Fun factPerhaps in part because of the good will generated by ad specialties in Rome, Italians were also the most likely to cite a positive likelihood for doing new business, as nearly one-half (48%) thought they would be more likely to do business with the advertiser. Further, 17% thought it very likely, twice that of any other area.
Some items generate even more goodwill from consumers: For example, about 48% of recipients of logoed outerwear said they’d be more likely to do business with an advertiser; recipients of bags were 43% more likely to do business with an advertiser; and USB recipients were 39% more likely.
Key TakeawayA goal of advertising is to get the prospect more likely to buy from the advertiser. This is often done in incremental amounts. Even the lowest-scoring ad specialty (health and safety) still manages to get nearly one-quarter of recipients to feel more likely to do business with the advertiser in the future.
©2013 Advertising Specialty Institute®. All Rights Reserved.
Likelihood for New Business
OUTERWEARBAGSUSB DRIVES/FLASH DRIVESSHIRTS
DRINKWARECALENDARSWRITING INSTRUMENTSCAPS/HEADWEARDESK/OFFICE ACC.HEALTH/SAFETY
48%43%
39%38%
AVERAGE 36%
0% 10% 15%5% 20% 25% 30% 35% 40% 45% 50%
31%31%31%
29%28%
23%

22©2013 Advertising Specialty Institute®. All Rights Reserved.
Location of Promotional ProductsConsumers were asked about the location of the logoed items they’d received. Overall, the office was cited most often (41%), but only marginally more than at home (36%).
Wearables, bags and health and safety products were most likely to be at home, while desk accessories, calendars, writing instruments and USB drives were most likely in the office.
.
Some geographic areas have a higher propensity to have items at home. For example, nearly one-half (48%) of recipients in Madrid reported the items were kept in the home.
Key TakeawayWhen choosing promotional products, the end-buyer needs to consider where the item will ultimately be used. The office isn’t necessarily a given, especially for items like shirts, caps and bags.
41%
People Keep Items at Home
Madrid Berlin Sydney Rome
48% 39% 39%
Home Office On Person
Shirts 47% 28% 25%
Caps/headwear 40% 35% 25%
Bags 40% 32% 28%
Health and safety products 40% 30% 31%
Drinkware 39% 39% 23%
Outerwear 35% 34% 31%
Calendars 35% 51% 14%
USB drives/ flash drives 30% 50% 19%
Writing instruments 27% 50% 23%
Desk/office accessories 25% 59% 16%
Overall 36% 41% 23%
Location of Items in the U.S.
23
Section Three
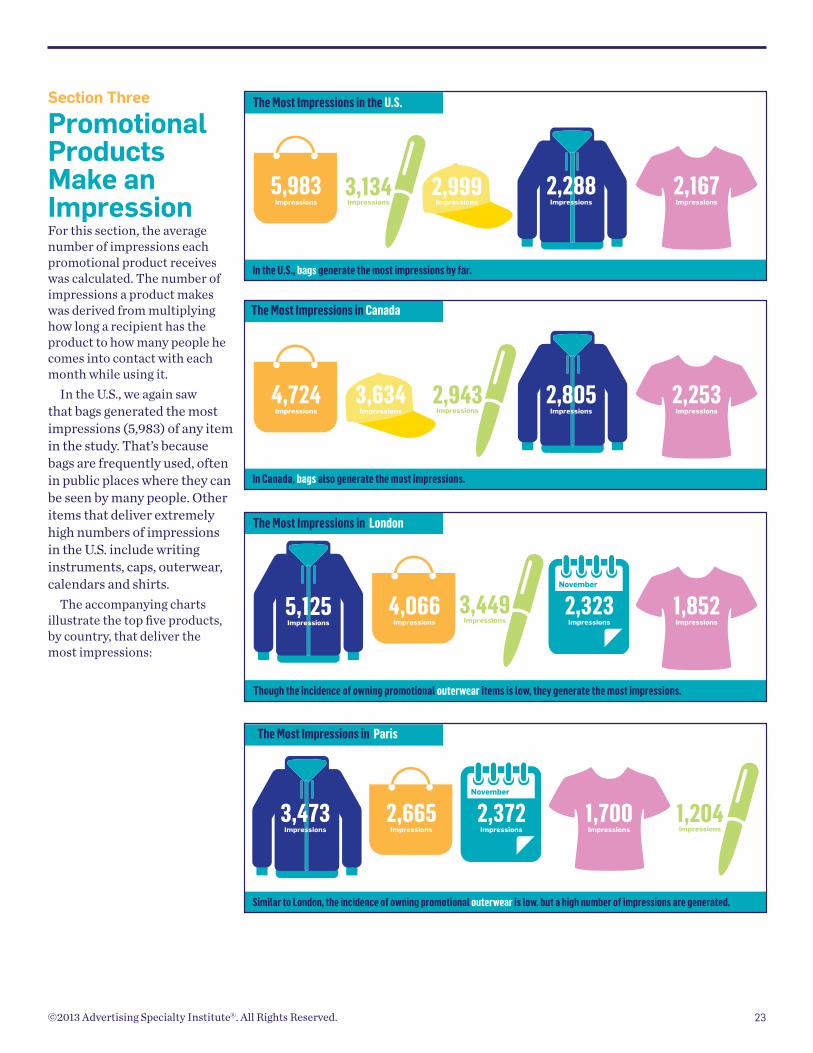
Promotional Products Make an ImpressionFor this section, the average number of impressions each promotional product receives was calculated. The number of impressions a product makes was derived from multiplying how long a recipient has the product to how many people he comes into contact with each month while using it.
In the U.S., we again saw that bags generated the most impressions (5,983) of any item in the study. That’s because bags are frequently used, often in public places where they can be seen by many people. Other items that deliver extremely high numbers of impressions in the U.S. include writing instruments, caps, outerwear, calendars and shirts.
The accompanying charts illustrate the top five products, by country, that deliver the most impressions:
4,724Impressions
4,066Impressions
2,253Impressions
1,852Impressions
The Most Impressions in the U.S.
5,983Impressions
2,999Impressions
2,167Impressions
2,288Impressions
In the U.S., bags generate the most impressions by far.
The Most Impressions in Canada
In Canada, bags also generate the most impressions.
The Most Impressions in London
Though the incidence of owning promotional outerwear items is low, they generate the most impressions.
November
The Most Impressions in Paris
Similar to London, the incidence of owning promotional outerwear is low, but a high number of impressions are generated.
3,134Impressions
2,323Impressions
November
2,372Impressions
2,665Impressions
1,700Impressions
5,881Impressions
3,729Impressions
1,755Impressions
3,179Impressions
1,344Impressions
November
2,505Impressions
1,447Impressions
2,260Impressions
November
2,125Impressions
1,966Impressions
2,774Impressions
1,763Impressions
2,380Impressions
1,421Impressions
3,634Impressions
2,805Impressions
5,125Impressions
3,473Impressions
2,943Impressions
3,449Impressions
1,204Impressions
6,260Impressions
4,280Impressions
3,233Impressions
5,615Impressions
2,034Impressions
1,843Impressions
The Most Impressions in Sydney
In Sydney, bags generate the most impressions.
The Most Impressions in Madrid
In the Madrid, writing instruments generate the most impressions.
The Most Impressions in Rome
In Rome, writing instruments also generate the most impressions by far.
The Most Impressions in Berlin
In Berlin, writing instruments generate the most impressions by far.
©2013 Advertising Specialty Institute®. All Rights Reserved.

24©2013 Advertising Specialty Institute®. All Rights Reserved.
Key Takeaway While the exact ranking of impressions changes somewhat from location to location, the overall list of products generating the most impressions is consistent. Wearables consistently deliver a high number of impressions, and in the U.S., bags deliver the most impressions every year.
Items that create the fewest impressions tend to be those intended mostly for one person, such as health and safety items and USB drives. The value of these items is more in the connection they make with the user than the total number of impressions generated.
Distributors should work with clients to determine the goals of their campaigns and the connection they want to establish with the intended recipient before selecting the right vehicle to deliver their message. Taking into account the number and quality of the impressions generated, in addition to some of the demographic considerations shown earlier in the report, gives the distributor the opportunity to serve as a consultant rather than an order taker.
4,724Impressions
4,066Impressions
2,253Impressions
1,852Impressions
The Most Impressions in the U.S.
5,983Impressions
2,999Impressions
2,167Impressions
2,288Impressions
In the U.S., bags generate the most impressions by far.
The Most Impressions in Canada
In Canada, bags also generate the most impressions.
The Most Impressions in London
Though the incidence of owning promotional outerwear items is low, they generate the most impressions.
November
The Most Impressions in Paris
Similar to London, the incidence of owning promotional outerwear is low, but a high number of impressions are generated.
3,134Impressions
2,323Impressions
November
2,372Impressions
2,665Impressions
1,700Impressions
5,881Impressions
3,729Impressions
1,755Impressions
3,179Impressions
1,344Impressions
November
2,505Impressions
1,447Impressions
2,260Impressions
November
2,125Impressions
1,966Impressions
2,774Impressions
1,763Impressions
2,380Impressions
1,421Impressions
3,634Impressions
2,805Impressions
5,125Impressions
3,473Impressions
2,943Impressions
3,449Impressions
1,204Impressions
6,260Impressions
4,280Impressions
3,233Impressions
5,615Impressions
2,034Impressions
1,843Impressions
The Most Impressions in Sydney
In Sydney, bags generate the most impressions.
The Most Impressions in Madrid
In the Madrid, writing instruments generate the most impressions.
The Most Impressions in Rome
In Rome, writing instruments also generate the most impressions by far.
The Most Impressions in Berlin
In Berlin, writing instruments generate the most impressions by far.
25
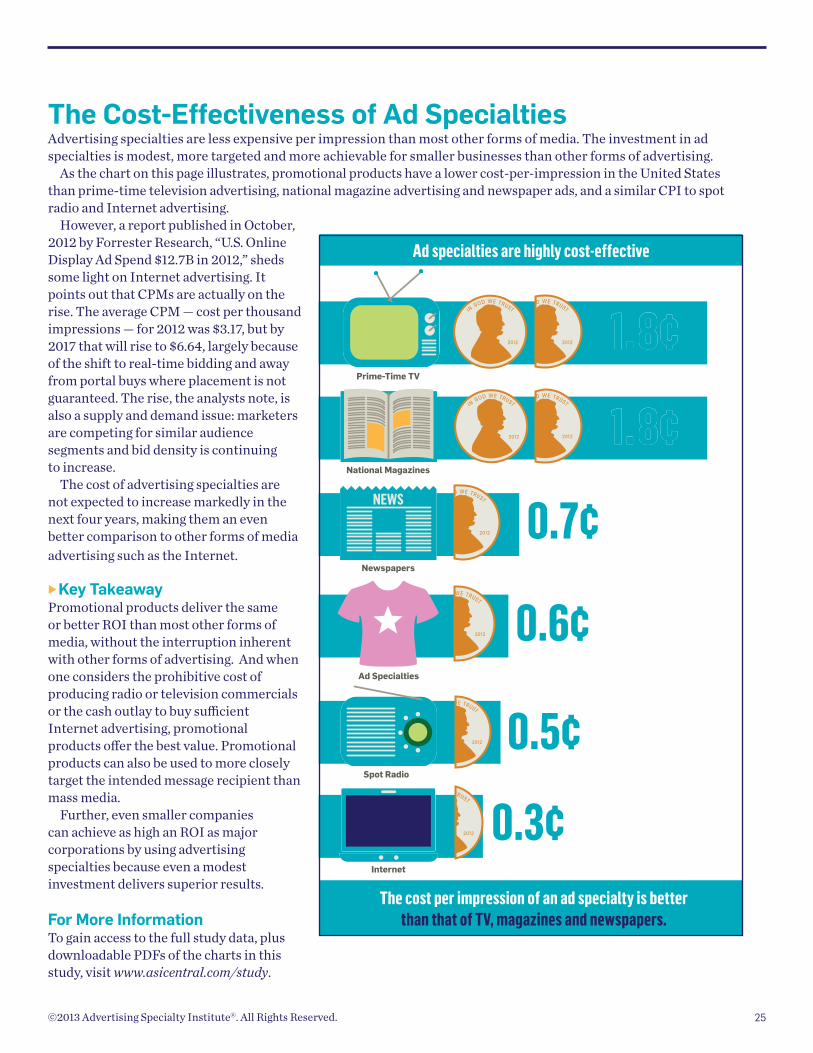
The Cost-Effectiveness of Ad SpecialtiesAdvertising specialties are less expensive per impression than most other forms of media. The investment in ad specialties is modest, more targeted and more achievable for smaller businesses than other forms of advertising.
As the chart on this page illustrates, promotional products have a lower cost-per-impression in the United States than prime-time television advertising, national magazine advertising and newspaper ads, and a similar CPI to spot radio and Internet advertising.
However, a report published in October, 2012 by Forrester Research, “U.S. Online Display Ad Spend $12.7B in 2012,” sheds some light on Internet advertising. It points out that CPMs are actually on the rise. The average CPM — cost per thousand impressions — for 2012 was $3.17, but by 2017 that will rise to $6.64, largely because of the shift to real-time bidding and away from portal buys where placement is not guaranteed. The rise, the analysts note, is also a supply and demand issue: marketers are competing for similar audience segments and bid density is continuing to increase.
The cost of advertising specialties are not expected to increase markedly in the next four years, making them an even better comparison to other forms of media advertising such as the Internet.
Key TakeawayPromotional products deliver the same or better ROI than most other forms of media, without the interruption inherent with other forms of advertising. And when one considers the prohibitive cost of producing radio or television commercials or the cash outlay to buy sufficient Internet advertising, promotional products offer the best value. Promotional products can also be used to more closely target the intended message recipient than mass media.
Further, even smaller companies can achieve as high an ROI as major corporations by using advertising specialties because even a modest investment delivers superior results.
For More InformationTo gain access to the full study data, plus downloadable PDFs of the charts in this study, visit www.asicentral.com/study.
0.5¢
0.3¢
0.6¢
0.7¢
1.8¢
1.8¢
National Magazines
NEWS
Newspapers
Internet
Spot Radio
The cost per impression of an ad specialty is better than that of TV, magazines and newspapers.
0.5¢
0.3¢
0.6¢
0.7¢
1.8¢
1.8¢
Ad Specialties
Prime-Time TV
Ad specialties are highly cost-effective
©2013 Advertising Specialty Institute®. All Rights Reserved.

26
DemographicsThe following is a breakdown of the demographics of all survey respondents who indicated they currently owned promotional products.
Gender % Count
Male 47% 1,416
Female 53% 1,616
Total 3,032
Age
21 to 34 years 46% 1,482
35 to 44 years 23% 744
45 to 54 years 18% 576
55 to 64 years 10% 320
65 years and over 2% 79
Total 3,201
Ethnicity (U.S.)
Asian 11% 297
Black or African American 9% 245
Hispanic or Latino 8% 207
White 68% 1,779
Other 4% 101
Total 2,629
Political Affiliation (U.S.)
Democrat 42% 741
Republican 25% 438
Independent 19% 331
Other 3% 57
Not Registered 12% 217
Total 1,784
©2013 Advertising Specialty Institute®. All Rights Reserved.

27
Country % Count
United States 58% 1,874
Germany 5% 153
Australia 4% 144
Spain 5% 157
Italy 4% 131
Canada 14% 453
Great Britain 5% 152
France 4% 126
Other 1% 24
Total 3,214
U.S. Cities
Atlanta 9% 165
Boston 9% 155
Chicago 7% 116
Dallas 8% 142
Houston 9% 153
Los Angeles 8% 141
Miami 9% 155
New York 9% 153
Philadelphia 7% 131
Phoenix 8% 151
San Francisco 8% 151
Seattle 10% 171
Total 1,784
Canadian Cities
Montreal 33% 151
Toronto 32% 147
Vancouver 35% 160
Total 458
European Cities
DÜsseldorf/Berlin 21% 153
London 21% 150
Madrid 22% 157
Paris 19% 135
Rome 18% 131
Total 726
Sydney 100% 144
Demographics continued
©2013 Advertising Specialty Institute®. All Rights Reserved.
Recommended