Glass Fiber-Filled Thermoplastics. I I . Cavity Filling and Fiber Orientation in Injection Molding
MUNEHARU SANOUf, BIN CHUNG, and CLAUDE COHEN
School of Chemical Engineering Cornell University
Ithaca, New York 14853
Mold filling of a rectangular cavity of three different thick- nesses fed from a reservoir is studied for unfilled and glass fiber-filled polypropylene and polystyrene. The shapes of flow- fronts studied by short-shots are affected predominantly by the thickness of the cavity with other parameters playing a less important role. Pressure drop versus volumetric flow rate inside the thinnest cavity is studied experimentally and predictions are made from a computer simulation of mold-filling. The orientation of fibers in the cavity is examined using a reflect- type microscope and the orientation is found to depend on cavity thickness, melt temperature, fiber content, and to a lesser extent, on volumetric flow rate. In the thinnest cavity, where the flow is quasi-unidirectional, the fibers remain in the plane of flow oriented either along the flow direction or per- pendicular to it, except in the region near the flow front, where they follow a “fountain” flow behavior.
INTRODUCTION
e use of short glass fibers as fillers in thermo- Th plastics has led to a marked improvement and easier control of certain properties of molded parts such as mold shrinkage, strength, stiffness, heat distortion, etc. The addition of glass fibers to plas- tics leads to some undesirable effects such as a higher viscosity for a given melt temperature, mak- ing the injection molding more difficult, and a bad surface finish; these problems can be circumvented or reduced by an increase in melt and cavity tem- peratures and by increasing the packing pressure of the molding cycle. The flow behavior of glass fiber-filled thermoplastics and the mechanical properties of molded parts depend not only on the properties of the polymer matrix and the glass fibers but also on the interaction between the two phases and on the orientation of the glass fibers (1).
With the increasing use of computer design and control of the injection molding process via a sim- ulation of the flow in the moId cavity (Z), it is important to examine cavity filling with glass fiber- filled plastics and to determine how accurate cer- tain predictions can be made on the basis of the rheological and thermal properties of these mate- rials. Furthermore, a study of the orientation of glass fibers in terms of its development in the cavity and how it is affected by various process parameters should be helpful in view of optimizing these pa-
t Permanent Address: Mitsuhishi Electric Corporation, Japan
rameters. There have been a number of qualitative studies concerning the orientation of glass fibers and its dependence upon injection-molding condi- tions. Bright, et al. ( 3 ) studied the effect of injection speed, of four types of gate geometries, and of different polymer matrices. The influence of injec- tion pressure and rotation speed of the screw have been examined by Xavier, et al. ( 4 ) . Moskal (l), on the other hand, emphasized the necessity of accu- rate measurements of the injection-molding param- eters on orientation to obtain more quantitative results. Relationships between the orientation of glass fibers and the mechanical properties of glass/ phenolic composites have been reported by Pipes, et al. (5).
In this paper we examine cavity filling and fiber orientation of glass fiber-filled polypropylene and polystyrene in simple rectangular cavities. Succes- sive flow-front patterns are obtained by the tech- nique of short-shots, and the cavity filling process is studied in terms of pressure drop versus volu- metric flow rate in the thinnest cavity examined. The flow in this cavity is shown by short-shots to be fairly unidirectional and thus amenable to a simple analysis (6). We also study the development of orientation in short-shot samples by observations on surfaces prepared by a metallographic polishing technique and illustrate semi-quantitatively the be- havior of orientation in full-shot samples in terms of various parameters such as melt temperature, cavity thickness, injection speed, and fiber concen- tration.
1008 POLYMER ENGINEERING AND SCIENCE, NOVEMBER, 1985, Vol. 25, No. 16
Cavity Filling and Fiber Orientation in Injection Molding
EXPERIMENTAL PROCEDURE Materials
The materials used in this study were the three types of polypropylene and the two types of poly- styrene that have been characterized in the preced- ing paper, namely PP, PP(20), PP(40), and PS, PS(20). The glass fibers had an average length of 400 pm and a diameter of 16 pm. All resins were dried at 70°C for 2 hours in a hopper dryer con- nected to the injection-molding machine before molding and were then molded at either 200 or 230°C (melt temperature). PP(20) was also molded at 185°C.
Injection Molding The injection molding was carried out on a Boy
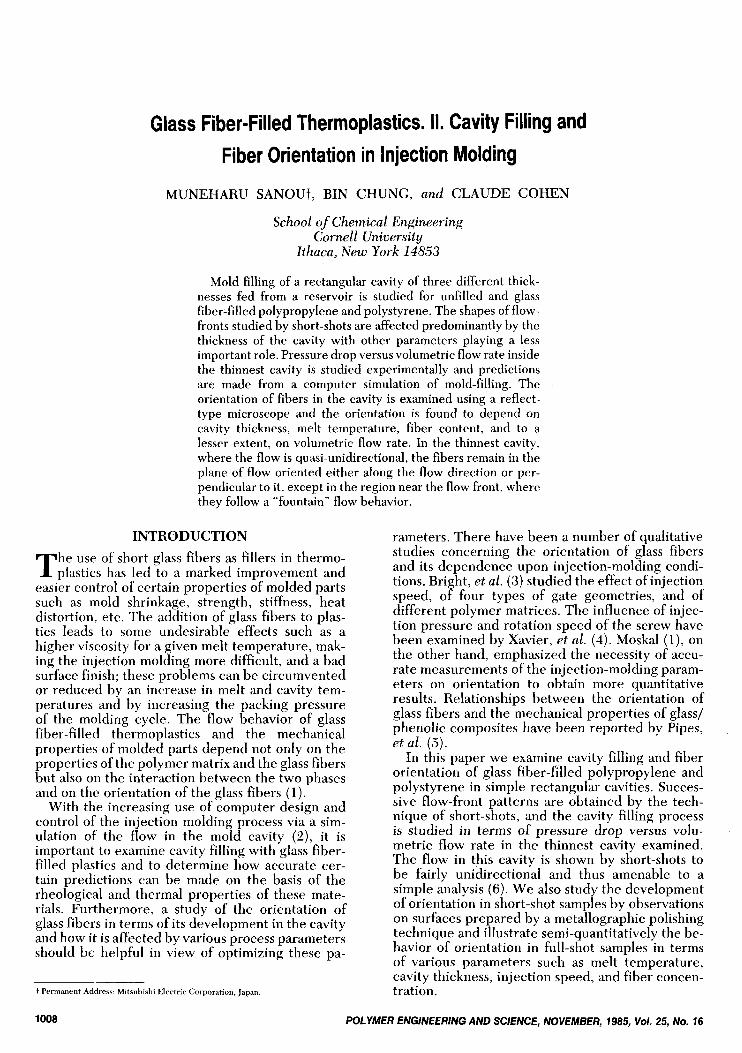
50-T machine with a 3.8 cm (1.5 in.) diameter screw and maximum values of 50 ton, 115 cm3 (7.0 in.7, 1.17 X 10’ dyne/cm2 (1.69 X lo4 psi), and 136 cm3/sec (8.3 in.3/sec) for the clamping force, shot size, injection oil pressure, and volumetric flow rate, respectively. The cavity dimensions were 7.62 cm (3 in.) in length, 3.8 cm (1.5 in.) in width, and one of three different thicknesses: 0.1 cm (0.04 in.), 0.254 cm (0.1 in.), and 0.508 cm (0.2 in.). These cavities were fed from a reservoir, as illustrated in Fig. 1 . The screw movement was monitored with a linear-variable-differential transformer (LVDT) and the pressure drop between two points, PI and Pz, shown in Fig. 1 , was measured with two pressure transducers in the case of the cavity of 0.1 cm thickness. These measurements were recorded on a visi-corder. The mold temperature around the cavity was controlled between 30 and 35°C by circulating water. The injection speed setting (Q) was varied from 10 to 70 percent of the maximum value. The applied injection oil-pressure setting ( P o ) in terms of percentage of the maximum oil pressure was set as follows: the minimum oil pres- sure ( Pmi,,) for filling a cavity under a given setting of Q was determined by increasing the oil pressure from a low value until the cavity was just filled; and Po was then set by increasing Pmin by a certain percentage of the maximum oil pressure (e.g. 0, 10, 30 percent, etc.). The short-shots were carried out by decreasing the amount of the molten polymer stored in front of the screw.
Fiber Orientation Observation of the glass fiber orientation on a
reflect-type microscope with an adapter and a cam- era was performed on surfaces of the molded sam- ples prepared with a metallographic polishing tech- nique using Alumina powder having a grain diam- eter of about 1 pm (7).
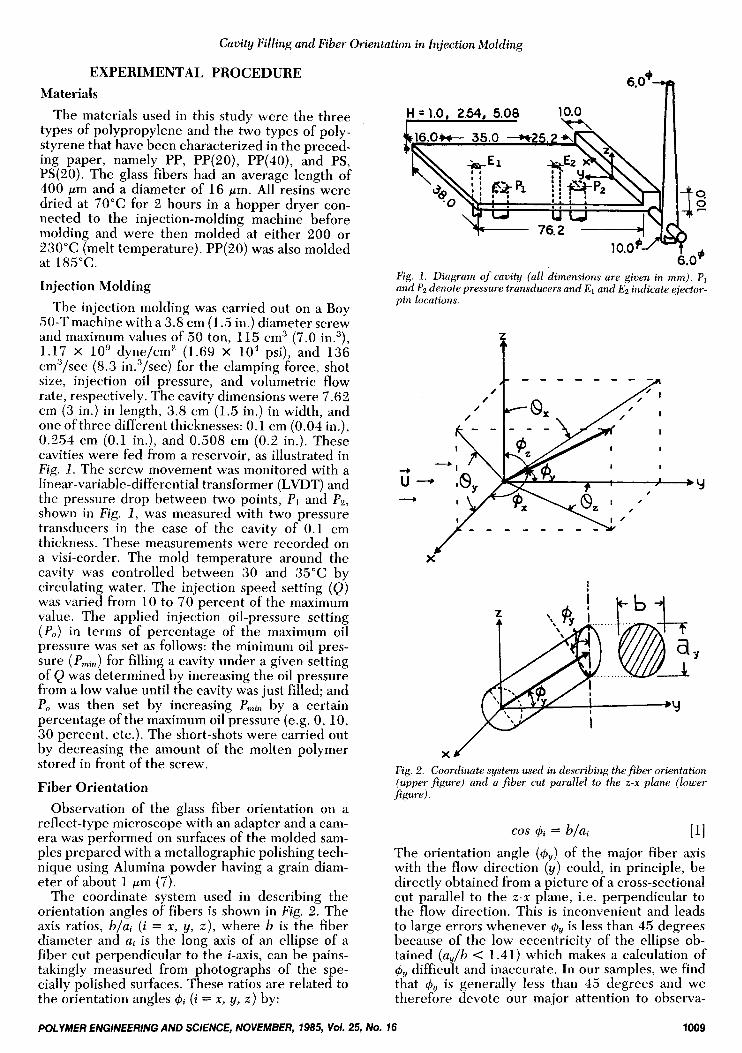
The coordinate system used in describing the orientation angles of fibers is shown in Fig. 2. The axis ratios, b/a, ( i = x, y, z ) , where h is the fiber diameter and ai is the long axis of an ellipse of a fiber cut perpendicular to the i-axis, can be pains- takingly measured from photographs of the spe- cially polished surfaces. These ratios are related to the orientation angles & (i = x, y, z ) by:
6 . 0 ’ 7
10.0
I r l
10.oP’. w * 6.0r
Fig. 1 . Diagram of cavity {all dimensions are given in mm). PI and Pz denote pressure transducers and El and Ez indicate ejector- pin locations.
i k - - - - - - - -A
I
Y
r / X
c
Y
=Y
X J
Fig. 2. Coordinate system used in describing thefiber orientation {upper figure) and a fiber cut parallel to the z-x plane (lower figure),
cos 4i = b/ai [I1 The orientation angle (&) of the major fiber axis with the flow direction (y) could, in principle, be directly obtained from a picture of a cross-sectional cut parallel to the z-x plane, i.e. perpendicular to the flow direction. This is inconvenient and leads to large errors whenever C#J~ is less than 45 degrees because of the low eccentricity of the ellipse ob- tained (a,/b < 1.41) which makes a calculation of $y difficult and inaccurate. In our samples, we find that 4y is generally less than 45 degrees and we therefore devote our major attention to observa-
POLYMER ENGlNEERlNG AND SCIENCE, NOVEMBER, 1985, Yo/. 25, No. 76 1009
Muneharu Sanou, Bin Chung, and Claude Cohen
tions of the y-z plane, where the following relation is used for an indirect calculation of $y:
cos $y = 41 - (b/a,)’sin 8, PI The distribution of orientation angles is calculated by dividing the thickness of the cross-section into ten layers and using the Krenchel equation for the average orientation angle in each layer [ 11:
131
[41
- $y = COS-~F
where F is given by I71
F = 1 ~k C O S ~ $y k= 1
with uk being the fraction of fibers with orientation $y and m being the total number of fibers in the examined layer. The layers were taken long enough such that the effect of length on qY was negligible. This occurred for 10 < m < 2 5 .
RESULTS AND DISCUSSION
Flow-Front Patterns The cavity thickness has the most evident effect
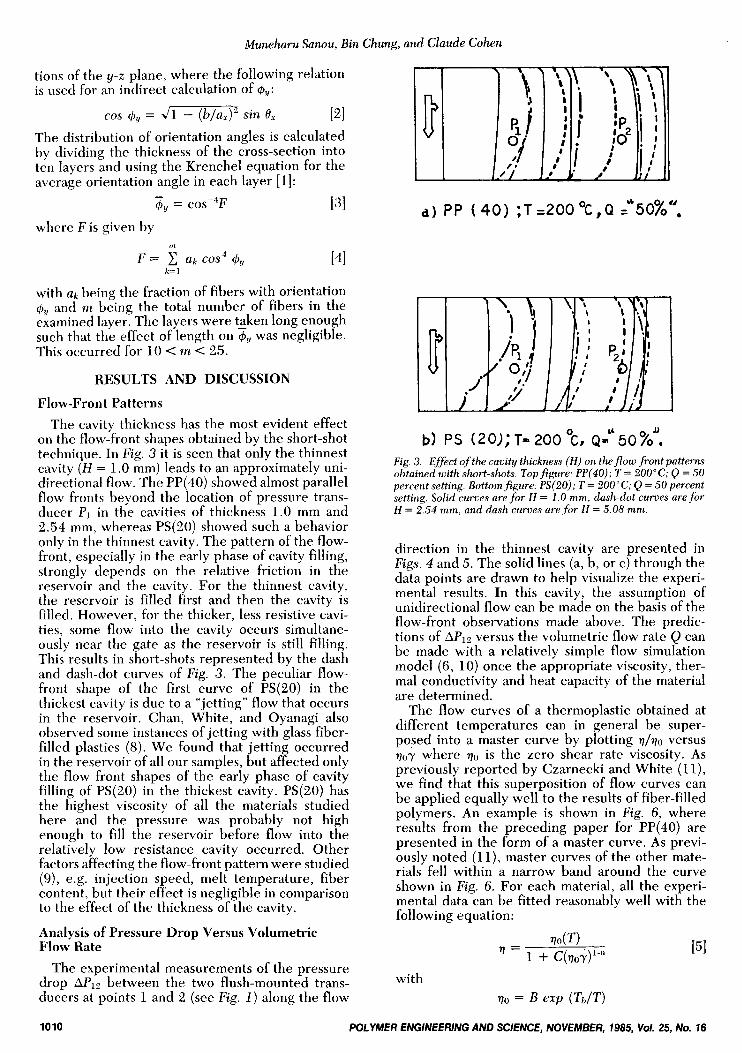
on the flow-front shapes obtained by the short-shot technique. In Fig. 3 it is seen that only the thinnest cavity ( H = 1 .0 mm) leads to an approximately uni- directional flow. The PP(40) showed almost parallel flow fronts beyond the location of pressure trans- ducer P I in the cavities of thickness 1.0 mm and 2.!54 mm, whereas PS(20) showed such a behavior only in the thinnest cavity. The pattern of the flow- front, especially in the early phase of cavity filling, strongly depends on the relative friction in the reservoir and the cavity. For the thinnest cavity, the reservoir is filled first and then the cavity is filled. However, for the thicker, less resistive cavi- ties, some flow into the cavity occurs simultane- ously near the gate as the reservoir is still filling. This results in short-shots represented by the dash and dash-dot curves of Fig. 3. The peculiar flow- front shape of the first curve of PS(20) in the thickest cavity is due to a “jetting” flow that occurs in the reservoir. Chan, White, and Oyanagi also observed some instances of jetting with glass fiber- filled plastics (8). We found that jetting occurred in the reservoir of all our samples, but affected only the flow front shapes of the early phase of cavity filling of PS(20) in the thickest cavity. PS(2O) has the highest viscosity of all the materials studied here and the pressure was probably not high enough to fill the reservoir before flow into the relatively low resistance cavity occurred. Other factors affecting the flow-front pattern were studied (9), e.g. injection speed, melt temperature, fiber content, but their effect is negligible in comparison to the effect of the thickness of the cavity.
Analysis of Pressure Drop Versus Volumetric Flow Rate
The experimental measurements of the pressure drop AP12 between the two flush-mounted trans- ducers at points 1 and 2 (see Fig. 1 ) along the flow
:p I :02 ;
I ; I ,* . ’
Fig. 3. Effect of the cavity thickness ( H ) on theflow-front patterns obtained with short-shots. Topfigure: PP(40); T = 200°C; Q = 50 percent setting. Bottomfigure: PS(20); T = ZOO’C; Q = 50 percent setting. Solid curves are for H = 1.0 mm, dash-dot curves are for H = 2.54 mm, and dash curves are for H = 5.08 mm.
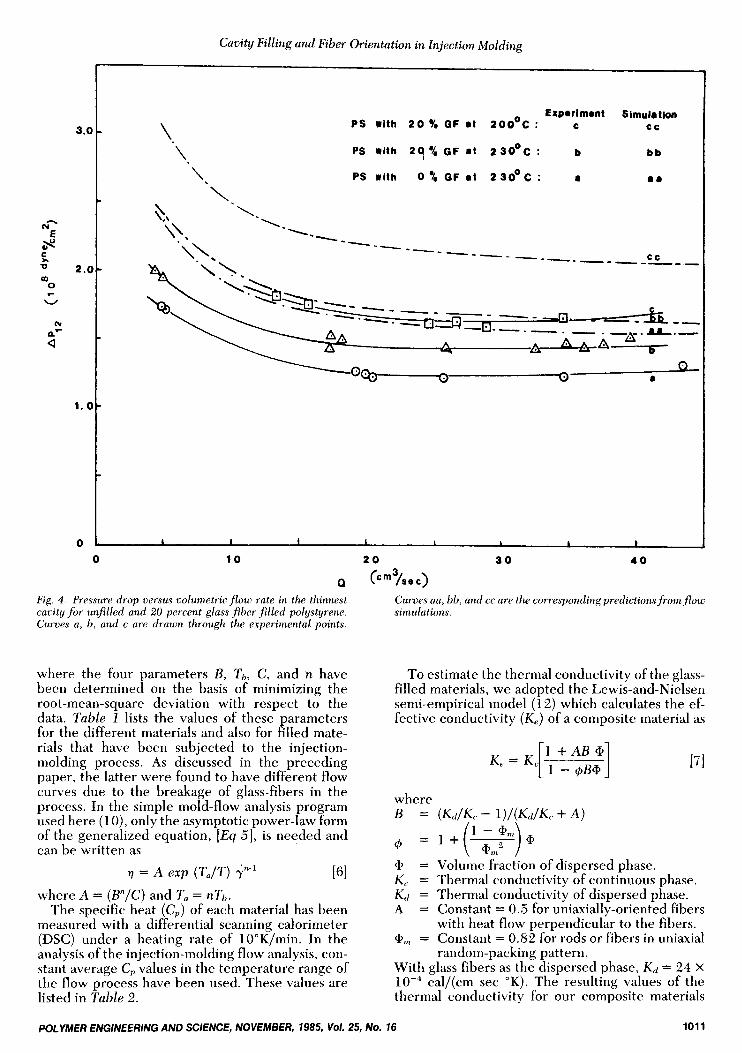
direction in the thinnest cavity are presented in Figs. 4 and 5. The solid lines (a, b, or c) through the data points are drawn to help visualize the experi- mental results. In this cavity, the assumption of unidirectional flow can be made on the basis of the flow-front observations made above. The predic- tions of APlz versus the volumetric flow rate Q can be made with a relatively simple flow simulation model (6, 10) once the appropriate viscosity, ther- mal conductivity and heat capacity of the material are determined.
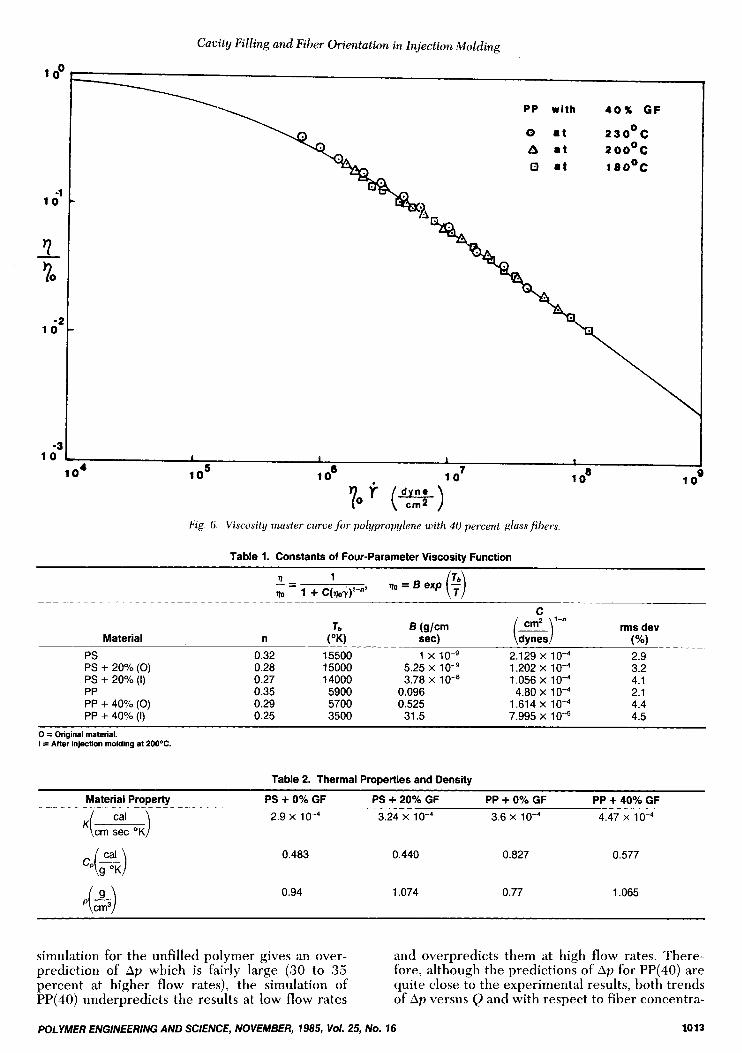
The flow curves of a thermoplastic obtained at different temperatures can in general be super- posed into a master curve by plotting 7/70 versus qoy where 70 is the zero shear rate viscosity. As previously reported by Czarnecki and White (1 l), we find that this superposition of flow curves can be applied equally well to the results of fiber-filled polymers. An example is shown in Fig. 6, where results from the preceding paper for PP(40) are presented in the form of a master curve. As previ- ously noted (1 l), master curves of the other mate- rials fell within a narrow band around the curve shown in Fig. 6. For each material, all the experi- mental data can be fitted reasonably well with the following equation:
with vo = exp ( T d T )
[51
1010 POLYMER ENGINEERING AND SCIENCE, NOVEMBER, 1985, Vol. 25, No. 16
r
3.0
N i E s
= 2.0- * OD 0
v v-
1. a
-
c
\
0
Ex~*rimont Simuirtion PS With 2 0 Yo GF 8 t 2OO0C : C c c
I 1 1 I I I 1 1
PS With 2 9 % OF 8 t 2 3 O o C : b bb
PS With 0 90 OF 8 t 2 3OoC : 8 a.
Fig. 4 Pressure drop versus volumetricflow rate in the thinnest cavity jhr unfilled and 20 percent glass fiber filled polystyrene. Curves a, h, and c are drawn through the experimental points.
where the four parameters B, Tb, C, and n have been determined on the basis of minimizing the root-mean-square deviation with respect to the data. Table 1 lists the values of these parameters for the different materials and also for filled mate- rials that have been subjected to the injection- molding process. As discussed in the preceding paper, the latter were found to have different flow curves due to the breakage of glass-fibers in the process. In the simple mold-flow analysis program used here (lo), only the asymptotic power-law form of the generalized equation, [Eq 51, is needed and can be written as
17 = A exp (T, /T) in-' 161 where A = (B"/C) and T, = nTh.
The specific heat (C,) of each material has been measured with a differential scanning calorimeter (DSC) under a heating rate of 10"K/min. In the analysis of the injection-molding flow analysis, con- stant average C, values in the temperature range of the flow process have been used. These values are listed in Table 2.
Curves aa, hh, and cc are the corresponding predictions fromflow simulations.
To estimate the thermal conductivity of the glass- filled materials, we adopted the Lewis-and-Nielsen semi-empirical model (1 2) which calculates the ef- fective conductivity ( K , ) of a composite material as
[71
@ = Volume fraction of dispersed phase. K , = Thermal conductivity of continuous phase. K,, = Thermal conductivity of dispersed phase. A = Constant = 0.5 for uniaxially-oriented fibers
an, = Constant = 0.82 for rods or fibers in uniaxial
With glass fibers as the dispersed phase, K d = 24 x cal/(cm sec "K). The resulting values of the
thermal conductivity for our composite materials
with heat flow perpendicular to the fibers.
random-packing pattern.
POLYMER ENGlNEERlNG AND SCIENCE, NOVEMBER, 1985, VoI. 25, No. 16 1011
3.0
cc
Exg.rlmont Simul8tion
PP Wlth 4 0 % O F at 200OC : b b b , CC.
- PP with 0% O F a t 2000C: a I 8
-
10 2 0 3 0 4 0
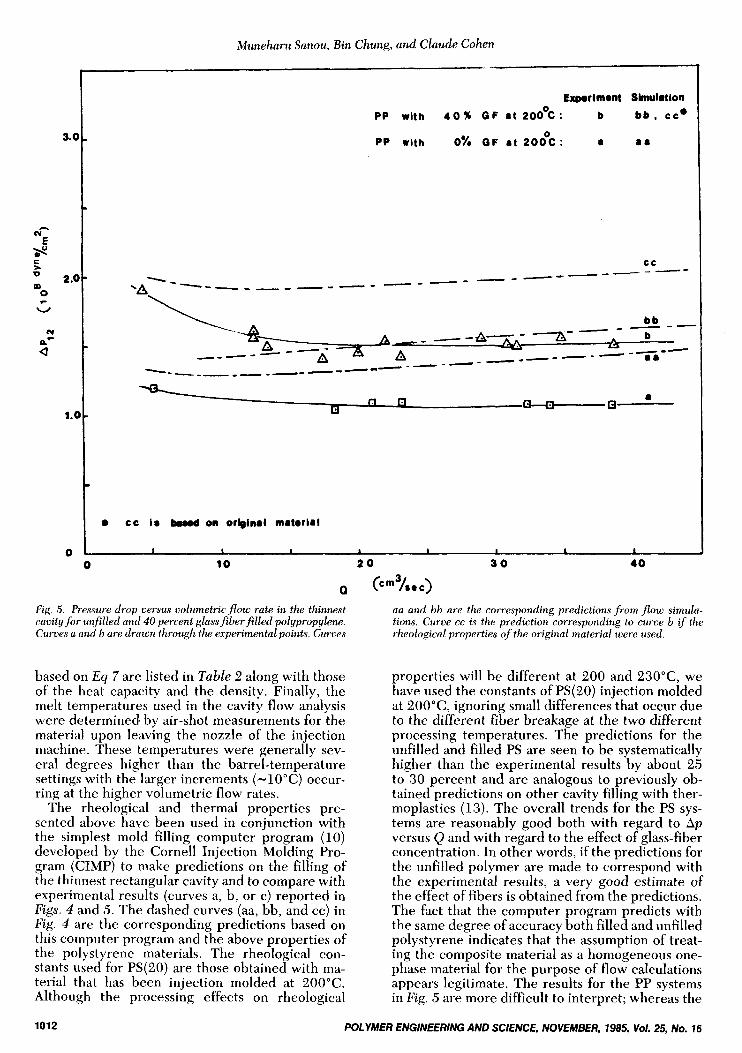
Fig. 5 . Pressure drop versus volumetricflow rate in the thinnest cavity for unfilled and 40 percent glassfiberfilled polypropylene. Curves a and b are drawn through the experimental points. Curves
based on Eq 7 are listed in Table 2 along with those of the heat capacity and the density. Finally, the melt temperatures used in the cavity flow analysis were determined by air-shot measurements for the material upon leaving the nozzle of the injection machine. These temperatures were generally sev- eral degrees higher than the barrel-temperature settings with the larger increments (-10°C) occur- ring at the higher volumetric flow rates.
The rheological and thermal properties pre- sented above have been used in conjunction with the simplest mold filling computer program (10) developed by the Cornell Injection Molding Pro- gram (CIMP) to make predictions on the filling of the thinnest rectangular cavity and to compare with experimental results (curves a, b, or c) reported in Figs. 4 and 5. The dashed curves (aa, bb, and CC) in Fig. 4 are the corresponding predictions based on this computer program and the above properties of the polystyrene materials. The rheological con- stants used for PS(20) are those obtained with ma- terial that has been injection molded at 200°C. Although the processing effects on rheological
aa and bb are the corresponding predictions from flow simula- tions. Curve cc is the prediction corresponding to curve b if the rheological properties of the original material were used.
properties will be different at 200 and 230"C, we have used the constants of PS(20) injection molded at 200"C, ignoring small differences that occur due to the different fiber breakage at the two different processing temperatures. The predictions for the unfilled and filled PS are seen to be systematically higher than the experimental results by about 25 to 30 percent and are analogous to previously ob- tained predictions on other cavity filling with ther- moplastics (13). The overall trends for the PS sys- tems are reasonably good both with regard to A p versus Q and with regard to the effect of glass-fiber concentration. In other words, if the predictions for the unfilled polymer are made to correspond with the experimental results, a very good estimate of the effect of fibers is obtained from the predictions. The fact that the computer program predicts with the same degree of accuracy both filled and unfilled polystyrene indicates that the assumption of treat- ing the composite material as a homogeneous one- phase material for the purpose of flow calculations appears legitimate. The results for the PP systems in Fig. 5 are more difficult to interpret; whereas the
1012 POLYMER ENGINEERING AND SCIENCE, NOVEMBER, 1985, Vol. 25, No. 16
Cavity Filling and Fiber Orientation in Injection Molding
1 oo
-1 10
- ? 70
-2 10
-3 1 0 1 I I I
1 c 7 8
1 o5 1 o6 10 10 1 O* . - f dyne 7'0 ( cm2 )
Fig. 6. Viscosity muster curue for polypropylene with 40 percent glass fibers.
Table 1. Constants of Four-Parameter Viscosity Function
Material
PS PS + 20% (0) PS + 20% (I) PP PP + 40% (0) PP + 40% (I)
Tb
n (OK)
0.32 15500 0.28 15000 0.27 14000 0.35 5900 0.29 5700 0.25 3500
1 x 10⁻⁹ 5.25 x 10⁻⁹ 3.78 x 10⁻⁸
0.096 0.525 31.5
C rms dev (igy (W
2.129 X 2.9 1.202 x 10⁻⁴ 3.2 1.056 X 1 0-4 4.1 4.80 x 10⁻⁴ 2.1
1.614 X 4.4 7.995 x 10⁻⁵ 4.5
0 = Original material. I = After injection molding at 2OOOC.
Table 2. Thermal Properties and Density
Material Property PS + 0% GF PS + 20% GF PP + 0% GF PP + 40% GF cal
~ ( c m sec OK) 2.9 x 10⁻⁴ 3.24 x 10⁻⁴ 3.6 x 10⁻⁴ 4.47 x 10⁻⁴
0.483 0.440 0.827 0.577
0.94 1.074 0.77 1.065
simulation for the unfilled polymer gives an over- prediction of Ap which is fairly large (30 to 35 percent at higher flow rates), the simulation of PP(40) underpredicts the results at low flow rates
POLYMER ENGINEERING AND SCIENCE, NOVEMBER, 7985, Vol. 25, No. 16
and overpredicts them at high flow rates. There- fore, although the predictions of Ap for PP(40) are quite close to the experimental results, both trends of Ap versus Q and with respect to fiber concentra-
1013
Muneharu Sanou, Bin Chung, and Claude Cohen
tion are not as good as in the case of PS. Use of the viscosity properties of the original PP(40) leads to curve cc in Fig. 5. It should be noted that the predictions are based on the assumption of constant flow rate during filling, whereas the experimental results obtained were not carried out entirely under such a condition. The volumetric flow rates calcu- lated from both the LVDT traces on the visi-corder and from the volumes in the cavity between PI and Pz and between Pz and the end of the cavity with the corresponding filling times of these volumes from the pressure traces indicate that the volumet- ric flow rate in the cavity was nearly constant only when the oil pressure values Po were appreciably higher than the minimum values for filling Pmin. Conditions for constant Q in the cavity were not always achieved (9). Very recent results obtained under controlled volumetric flow rate using a Moog process controller have led to much better agree- ment with simulation results (14).
Fiber-Orientation in the Cavities Reproductions of the orientation of the fibers in
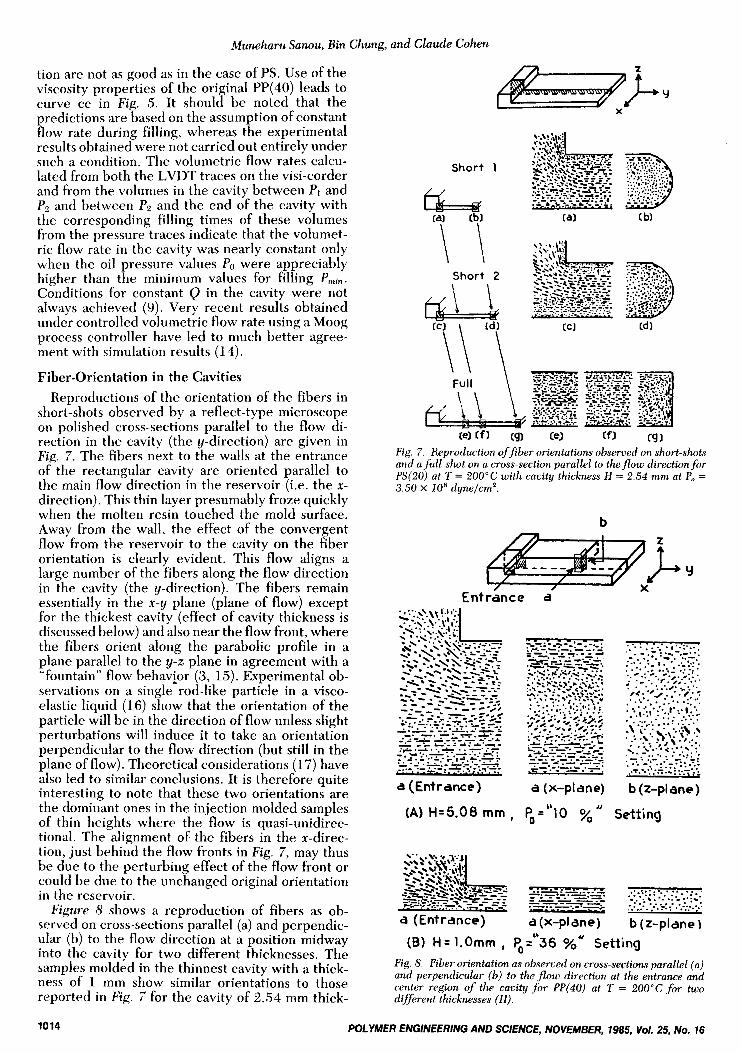
short-shots observed by a reflect-type microscope on polished cross-sections parallel to the flow di- rection in the cavity (the y-direction) are given in Fig. 7 . The fibers next to the walls at the entrance of the rectangular cavity are oriented parallel to the main flow direction in the reservoir (i.e. the x- direction). This thin layer presumably froze quickly when the molten resin touched the mold surface. Away from the wall, the effect of the convergent flow from the reservoir to the cavity on the fiber orientation is clearly evident. This flow aligns a large number of the fibers along the flow direction in the cavity (the y-direction). The fibers remain essentially in the x-y plane (plane of flow) except for the thickest cavity (effect of cavity thickness is discussed below) and also near the flow front, where the fibers orient along the parabolic profile in a plane parallel to the y-z plane in agreement with a "fountain" flow behavior (3, 15). Experimental ob- servations on a single rod-like particle in a visco- elastic liquid (16) show that the orientation of the particle will be in the direction of flow unless slight perturbations will induce it to take an orientation perpendicular to the flow direction (but still in the plane of flow). Theoretical considerations (1 7) have also led to similar conclusions. It is therefore quite interesting to note that these two orientations are the dominant ones in the injection molded samples of thin heights where the flow is quasi-unidirec- tional. The alignment of the fibers in the x-direc- tion, just behind the flow fronts in Fig. 7, may thus be due to the perturbing effect of the flow front or could be due to the unchanged original orientation in the reservoir.
Figure 8 shows a reproduction of fibers as ob- served on cross-sections parallel (a) and perpendic- ular (b) to the flow direction at a position midway into the cavity for two different thicknesses. The samples molded in the thinnest cavity with a thick- ness of 1 mm show similar orientations to those reported in Fig. 7 for the cavity of 2.54 mm thick-
Y
b
Entrance d
a (Entrance) a (x-plane) b (z-plane) I J (A) H=5.08 m m , $=''lo % Setting
a (Entrance) a (x-plane) b (z-plane I $6 (B) H = 1.Omm , $= 36 xu Setting
Fig. 8. Fiber orientation as observed on cross-sections parallel (a) and perpendicular (b) to the f low direction at the entrance and center region of the cauity for PP(40) at T = 200°C for two dqferent thicknesses ( H ) .
1014 POLYMER ENGINEERING AND SCIENCE, NOVEMBER, 1985, Vol. 25, No. 16
Cavity Filling and Fiber Orientation in Injection Molding
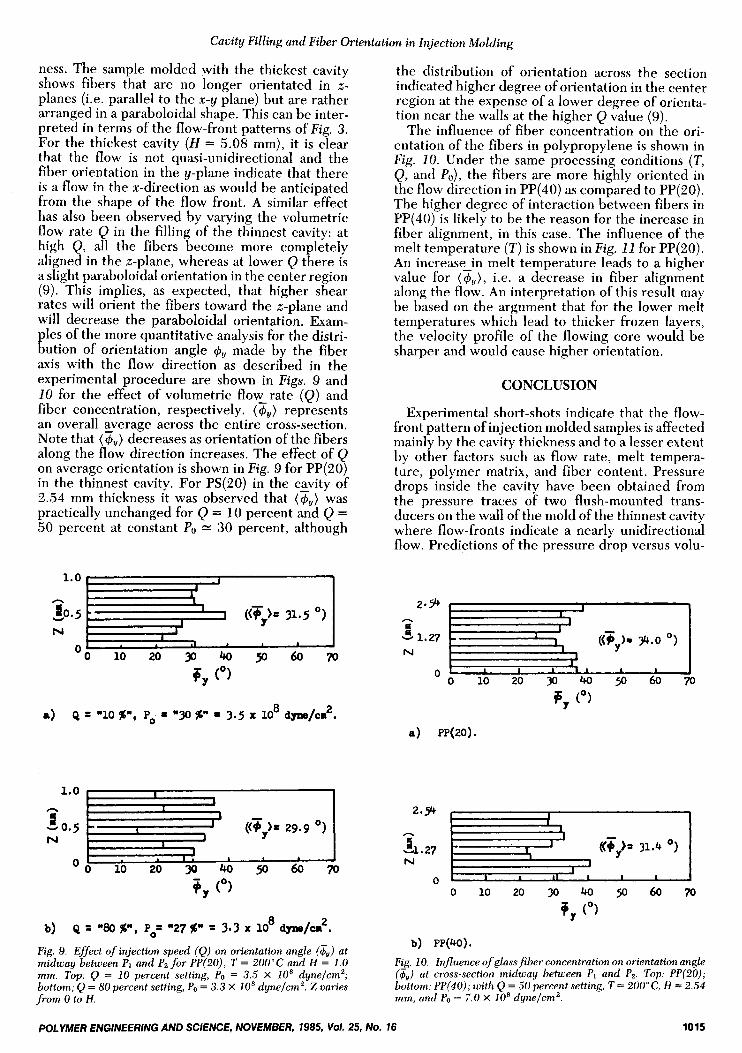
ness. The sample molded with the thickest cavity shows fibers that are no longer orientated in z- planes (i.e. parallel to the x-y plane) but are rather arranged in a paraboloidal shape. This can be inter- preted in terms of the flow-front patterns of Fig. 3. For the thickest cavity ( H = 5.08 mm), it is clear that the flow is not quasi-unidirectional and the fiber orientation in the y-plane indicate that there is a flow in the x-direction as would be anticipated from the shape of the flow front. A similar effect has also been observed by varying the volumetric flow rate Q in the filling of the thinnest cavity: at high Q, all the fibers become more completely aligned in the z-plane, whereas at lower Q there is a slight paraboloidal orientation in the center region (9). This implies, as expected, that higher shear rates will orient the fibers toward the z-plane and will decrease the paraboloidal orientation. Exam- ples of the more quantitative analysis for the distri- bution of orientation angle 6, made by the fiber axis with the flow direction as described in the experimental procedure are shown in Figs. 9 and 10 for the effect of volumetric flow rate (0) and fiber concentration, respectively. (&,) represents an overall average across the entire cross-section. Note that (&) decreases as orientation of the fibers along the flow direction increases. The effect of Q on average orientation is shown in Fig. 9 for PP(20) in the thinnest cavity. For PS(20) in the cavity of 2.54 mm thickness it was observed that (3,) was practically unchanged for Q = 10 percent and Q = SO percent at constant Po = 30 percent, although
0.5 N
8 b) Q = "80 $"* Po' "27 $* = 3.3 x 10 dyne/cm2.
Fig. 9. Effect of injection speed (Q) on orientation angle (&) at midway between PI and PZ for PP(20), T = 200°C and H = 1.0 mm. Top: Q = 10 percent setting, Po = 3.5 X 10' dynefan'; bottom; Q = 80 percent setting, Po = 3.3 X lo8 dynefcm2. Z varies from 0 to H .
the distribution of orientation across the section indicated higher degree of orientation in the center region at the expense of a lower degree of orienta- tion near the walls at the higher Q value (9).
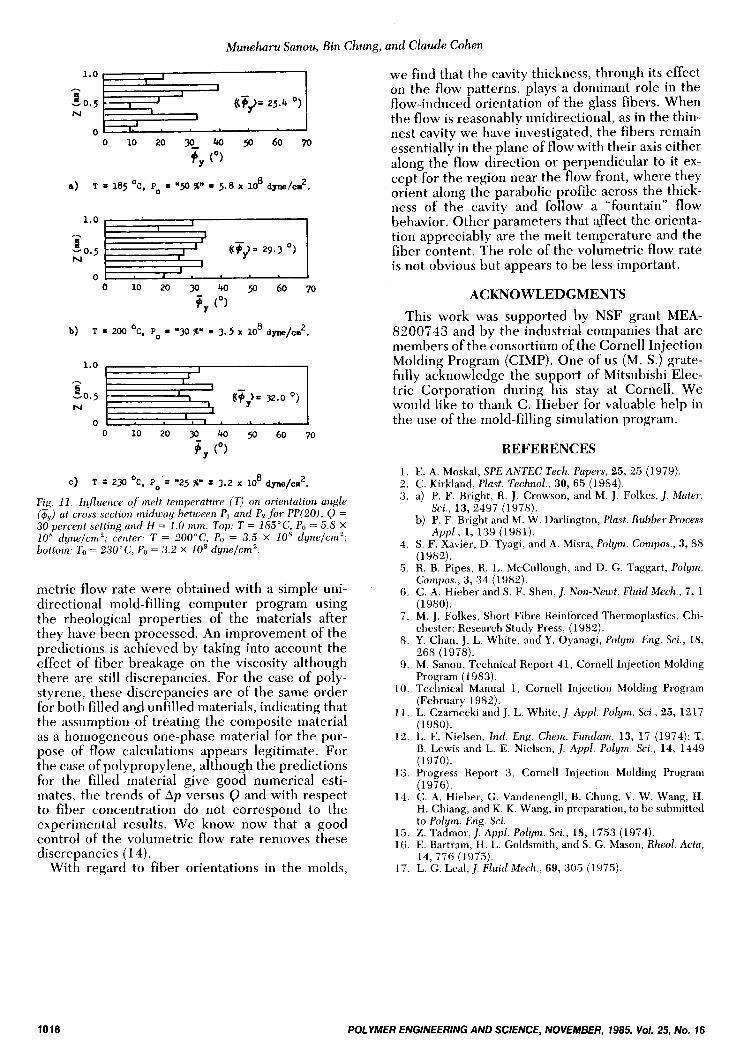
The influence of fiber concentration on the ori- entation of the fibers in polypropylene is shown in Fig. 10. Under the same processing conditions (T , Q, and Po), the fibers are more highly oriented in the flow direction in PP(40) as compared to PP(20). The higher degree of interaction between fibers in PP(40) is likely to be the reason for the increase in fiber alignment, in this case. The influence of the melt temperature ( T ) is shown in Fig. II for PP(20). An increase in melt temperature leads to a higher value for (s,), i.e. a decrease in fiber alignment along the flow. An interpretation of this result may be based on the argument that for the lower melt temperatures which lead to thicker frozen layers, the velocity profile of the flowing core would be sharper and would cause higher orientation.
CONCLUSION
Experimental short-shots indicate that the flow- front pattern of injection molded samples is affected mainly by the cavity thickness and to a lesser extent by other factors such as flow rate, melt tempera- ture, polymer matrix, and fiber content. Pressure drops inside the cavity have been obtained from the pressure traces of two flush-mounted trans- ducers on the wall of the mold of the thinnest cavity where flow-fronts indicate a nearly unidirectional flow. Predictions of the pressure drop versus volu-
((3,). 34.0 ")
0 10 20 30 40 9 60 70
b) PP(40). Fig. 10. lnfluence of glassfiber concentration on orientation angle (&) at cross-section midway between P , and Pz . Top: PP(20); bottom: PP(40); with Q = 50 percent setting, T = 200"C, H = 2.54 mm, and Po = 7.0 X 10' dynefcm2.
POLYMER ENGINEERING AND SCIENCE, NOVEMBER, 1985, VoI. 25, No. 16 1015
Muneharu Sanou, Bin Chung, and Claude Cohen
1.0
3 0 . 5 N
0
1.0 I I 1
I I I I
o t 1 ' . I 0 10 20 30 40 50 60 70
b) T = 200 OC, Po "30 %" 3.5 X 10 8 dyne/cn 2 .
0 10 20 30, 40 50 60 70
9 , (O)
8 C ) T = 230 OC, Po = "25 %" 5 3.2 x 10 dyne/cm2.
Fig. 1 1 . Influence of melt temperature (T) on orientation angle (&) at cross-section midway between PI and Pz for P P ( 2 0 ) , Q = 30 percent setting and H = 1.0 mrn. Top: T = 185"C, PO = 5 .8 X 10' dyne/cm2; center: T = 200"C, Po = 3.5 x 10' dynelcm'; bottom: To = 230"C, Po = 3.2 X 10' dynelcm'.
metric flow rate were obtained with a simple uni- directional mold-filling computer program using the rheological properties of the materials after they have been processed. An improvement of the predictions is achieved by taking into account the effect of fiber breakage on the viscosity although there are still discrepancies. For the case of poly- styrene, these discrepancies are of the same order for both filled and unfilled materials, indicating that the assumption .of treating the composite material as a homogeneous one-phase material for the pur- pose of flow calculations appears legitimate. For the case of polypropylene, although the predictions for the filled material give good numerical esti- mates, the trends of A p versus Q and with respect to fiber concentration do not correspond to the experimental results. We know now that a good control of the volumetric flow rate removes these discrepancies (1 4).
With regard to fiber orientations in the molds,
we find that the cavity thickness, through its effect on the flow patterns, plays a dominant role in the flow-induced orientation of the glass fibers. When the flow is reasonably unidirectional, as in the thin- nest cavity we have investigated, the fibers remain essentially in the plane of flow with their axis either along the flow direction or perpendicular to it ex- cept for the region near the flow front, where they orient along the parabolic profile across the thick- ness of the cavity and follow a "fountain" flow behavior. Other parameters that affect the orienta- tion appreciably are the melt temperature and the fiber content. The role of the volumetric flow rate is not obvious but appears to be less important.
ACKNOWLEDGMENTS This work was supported by NSF grant MEA-
8200743 and by the industrial companies that are members of the consortium of the Cornell Injection Molding Program (CIMP). One of us (M. S.) grate- fully acknowledge the support of Mitsubishi Elec- tric Corporation during his stay at Cornell. We would like to thank C. Hieber for valuable help in the use of the mold-filling simulation program.
REFERENCES 1. E. A. Moskal, SPEANTEC Tech. Papers, 25, 2ij (1979). 2 . C. Kirkland, Plust. TechnoZ., 30, 65 (1984). 3 . a) P. F. Bright, R. J. Crowson, and M. J. Folkes, j . Muter.
b) P. F. Bright and M. W. Darlington, Plast. Rubber Process
4 . S . F. Xavier, D. Tyagi, and A. Misra, Polym. Compos., 3, 88 (1982).
5. R. B. Pipes, R. L. McCullough, and D. G. Taggart, Polym. Cornpos., 3, 34 (1982).
6. C. A. Hieber and S. F. Shen, J. Non-Newt. Fluid Mech., 7 , 1 (1980).
7. M. J. Folkes, Short Fibre Reinforced Thermoplastics, Chi- Chester: Research Study Press, (1982).
8. Y. Chan, J. L. White, and Y. Oyanagi, Polym. Eng. Sci., 18, 268 (1978).
9. M. Sanou, Technical Report 41, Cornell Injection Molding Program (1983).
10. Technical Manual 1 , Cornell Injection Molding Program (February 198.2).
11. L. Czarnecki and J. L. White, J. Appl . Polym. Sci., 25, 1217 (1980).
12. L. E. Nielsen, Ind. Eng. Chem. Fundurn. 13, 17 (1974); T. B. Lewis and L. E. Nielsen, J. Appl. Polym. Sci., 14, 1449 (1970).
13. Progress Report 3, Cornell Injection Molding Program (1976).
14. C. A. Hieber, G. Vandenengll, B. Chung, V. W. Wang, H. H. Chiang, and K. K. Wang, in preparation, to be submitted to Polym. Eng. Sci.
Sci., 13, 2497 (1978).
Appl., 1, 139 (1981).
15. Z. Tadmor,J. Appl. Polym. Sci., 18, 1753 (1974). 16. E. Bartram, H . L. Goldsmith, and S . G. Mason, Rheol. Acta,
17. L. G. Leal, J. Fluid Mech., 69, 305 (1975). 14, 776 (1975).
1016 POLYMER ENGINEERING AND SCIENCE, NOVEMBER, 1985, Vol. 25, No. 16
Recommended