Getting Started with Splunk
Page 1 of 11
What you need
1. Download latest version of Splunk from http://www.splunk.com/download 2. Download http://docs.splunk.com/images/Tutorial/tutorialdata.zip 3. https://splunk.box.com/v/splunklivetoronto
Demo 1. Install latest version of Splunk.
2. Start up the new installed instance of Splunk.
• If not installing on a Windows based machine please mention it’s installed as a Service. Its start up status can be modified there.
• On *nix platforms the following command can be run to ensure Splunk starts at boot time: • $SPLUNK_HOME/bin/splunk enable boot-‐start
3. Ingest Tutorial Data Click Path – Screen Action Say -‐ Description Display Emulate that you download tutorialdata.zip and show it’s contents. Tutorial Data
Splunk provides an online tutorial for getting data into Splunk. It includes a sample data file that comes from the fictitious “Butter Cup Games, Inc.”: A worldwide game company selling it’s products through it’s online store. This zip file is collection of web access logs, security logs, and vendor sales generated from web site infrastructure.
Login to newly installed Splunk instance on your laptop.
There are two ways to get to the appropriate menu. After you login you see the option “Add Data”
Getting Started with Splunk
Page 2 of 11
-‐> Settings -‐> Add Data
OR
-‐> Settings -‐> Data Input
There are two more options under the Settings menu. You see the “Add Data” image again, but under Data you also have “Data Inputs”. I’m going to click on “Add Data”
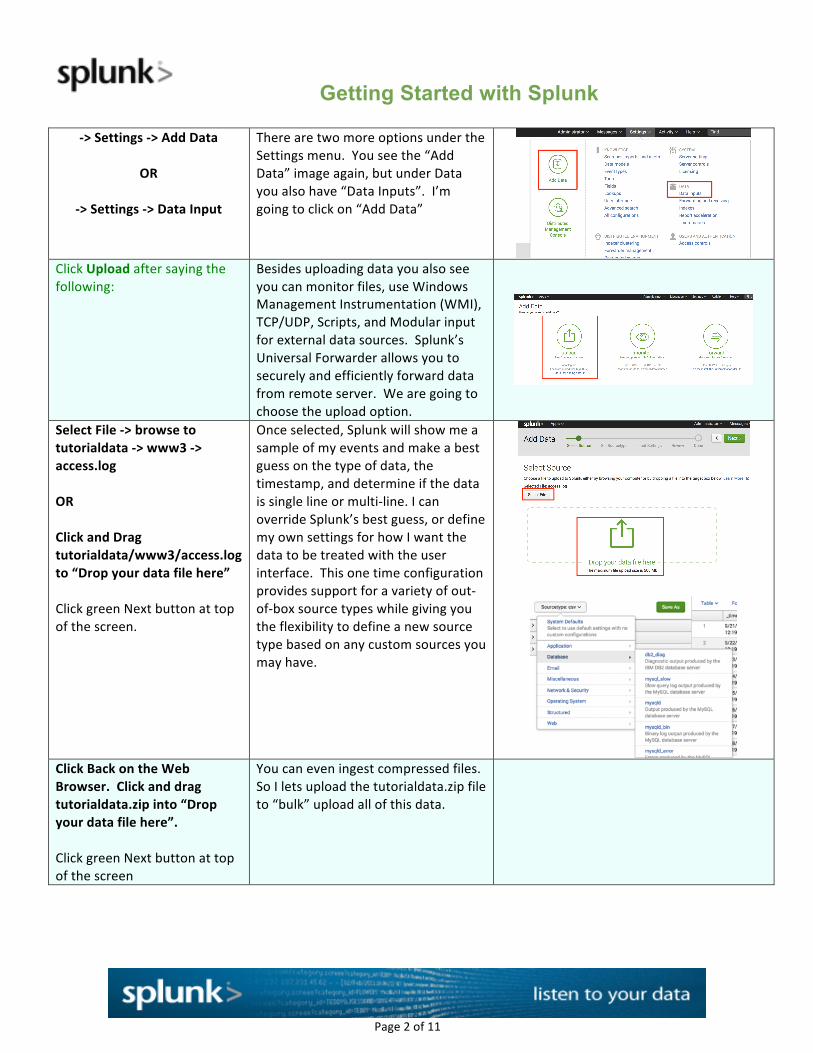
Click Upload after saying the following:
Besides uploading data you also see you can monitor files, use Windows Management Instrumentation (WMI), TCP/UDP, Scripts, and Modular input for external data sources. Splunk’s Universal Forwarder allows you to securely and efficiently forward data from remote server. We are going to choose the upload option.
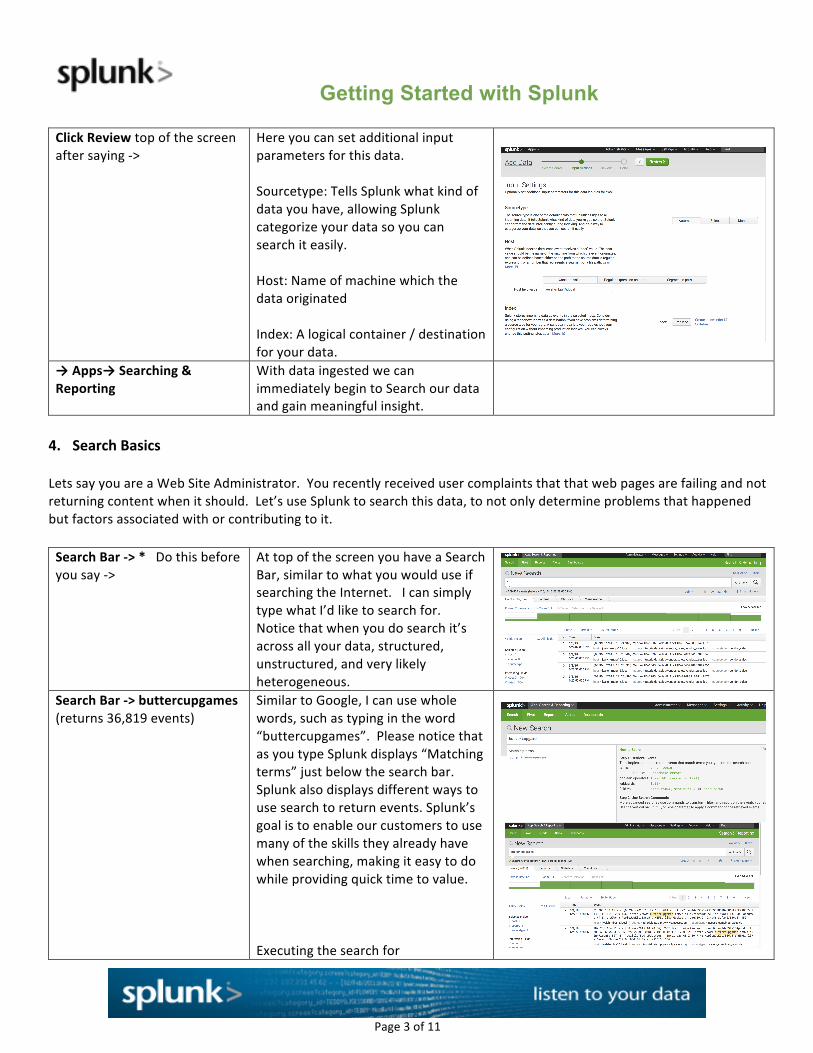
Select File -‐> browse to tutorialdata -‐> www3 -‐> access.log OR Click and Drag tutorialdata/www3/access.log to “Drop your data file here” Click green Next button at top of the screen.
Once selected, Splunk will show me a sample of my events and make a best guess on the type of data, the timestamp, and determine if the data is single line or multi-‐line. I can override Splunk’s best guess, or define my own settings for how I want the data to be treated with the user interface. This one time configuration provides support for a variety of out-‐of-‐box source types while giving you the flexibility to define a new source type based on any custom sources you may have.
Click Back on the Web Browser. Click and drag tutorialdata.zip into “Drop your data file here”. Click green Next button at top of the screen
You can even ingest compressed files. So I lets upload the tutorialdata.zip file to “bulk” upload all of this data.
Getting Started with Splunk
Page 3 of 11
Click Review top of the screen after saying -‐>
Here you can set additional input parameters for this data. Sourcetype: Tells Splunk what kind of data you have, allowing Splunk categorize your data so you can search it easily. Host: Name of machine which the data originated Index: A logical container / destination for your data.
→ Apps→ Searching & Reporting
With data ingested we can immediately begin to Search our data and gain meaningful insight.
4. Search Basics Lets say you are a Web Site Administrator. You recently received user complaints that that web pages are failing and not returning content when it should. Let’s use Splunk to search this data, to not only determine problems that happened but factors associated with or contributing to it. Search Bar -‐> * Do this before you say -‐>
At top of the screen you have a Search Bar, similar to what you would use if searching the Internet. I can simply type what I’d like to search for. Notice that when you do search it’s across all your data, structured, unstructured, and very likely heterogeneous.
Search Bar -‐> buttercupgames (returns 36,819 events)
Similar to Google, I can use whole words, such as typing in the word “buttercupgames”. Please notice that as you type Splunk displays “Matching terms” just below the search bar. Splunk also displays different ways to use search to return events. Splunk’s goal is to enable our customers to use many of the skills they already have when searching, making it easy to do while providing quick time to value. Executing the search for
Getting Started with Splunk
Page 4 of 11
“buttercupgames” returns events containing that word. Splunk returns events containing that term, highlighting the term in the events returned.
Search Bar -‐> buttercupgames 403 (returns 282 events)
Lets say a customer made a valid request but buttercupgames web service simply failed to respond, the web server would respond with a 403 code. Expand our search for 403. When searching for two terms the AND is implied.
Search Bar -‐> buttercupgames 403 OR 404 (returns 1013 events)
Maybe a web page resource was missing, that would be encoded as a 404, so we can look for either 403 OR 404
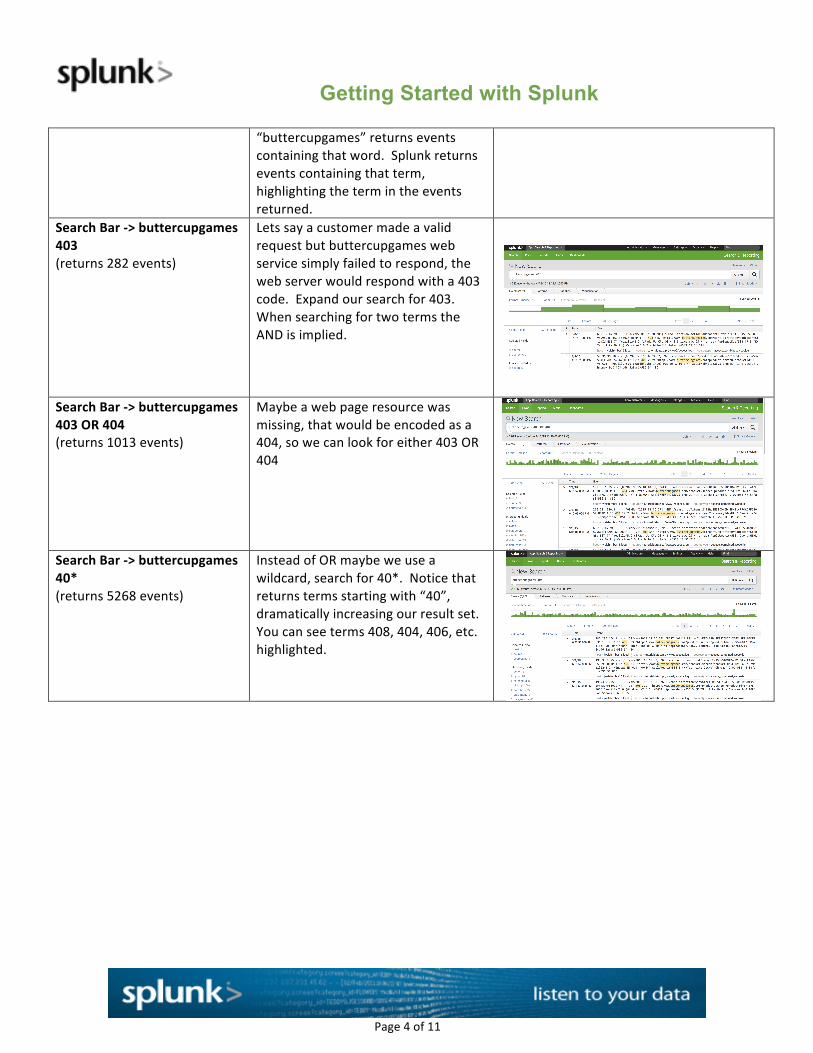
Search Bar -‐> buttercupgames 40* (returns 5268 events)
Instead of OR maybe we use a wildcard, search for 40*. Notice that returns terms starting with “40”, dramatically increasing our result set. You can see terms 408, 404, 406, etc. highlighted.

Getting Started with Splunk
Page 5 of 11
5. Time Picker Search Bar -‐> buttercupgames 403 → Time Drop Down
All events in Splunk are time-‐based. Keying off time is another way to enable efficient searching. Splunk provides a Time-‐Picker, giving you flexibility to search real-‐time data, relative time ranges, such as previous business week, last 30 minutes, or all time. You can also define specific time or date ranges.
Highlight the histogram Below the search bar is a histogram displaying the frequency of events. This can be very helpful if I’m looking for gaps or spikes in certain types of events. I also have the option of zooming in on the histogram or focusing all the way down to milliseconds.
6. Extracted Fields Expand on the first event. The real secret sauce to Splunk is it’s
ability to recognize and extract information contain within the events. Splunk will automatically pull out any key/value pairs, IP addresses, time and date fields, as well as common formats such as comma, tab delimited fields in a csv file. Splunk does this while retaining the entire raw event.
Click on the value of status – Add to search
By clicking on any given value you can Add it or Exclude it from a search, or even start a new search based on that value. Adding it to our existing search you’ll notice a key-‐value pair added to our search. Now, instead of just searching for a given term in any event you can further refine your search to events who’s given extracted field contains a specific value.

Getting Started with Splunk
Page 6 of 11
Highlight left hand pane On the left, I can see ALL the fields that were dynamically extracted and are available to me for searching and reporting purposes. Splunk also shows the number of unique values it found for every given field it found.
-‐> Smart Mode You can also adjust Splunk’s “discovery mode” for field data extraction during searches.
7. Dynamic Field Extraction
a Expand an Event, click on Event Actions -‐> Extract Fields
b Extract the field after status code, should be the response size. • It will miss some, no worries, just highlight the values missed in events and add to extraction.
8. Alerts -‐> Save As -‐> Alert Now, if a server refuses to responds to
a users request, status=403, Splunk can detect that and alert us to it.
Click Real Time, Provide a Title, then click Next
I can choose to constantly monitor for this in real-‐time or to schedule this alert based on a variety of frequencies.

Getting Started with Splunk
Page 7 of 11
Splunk provides flexible notification options, allowing you to assign severity to the Alert, to automatically distribute an email (or SMS text) and include output inline or as an attachment. You can even do more advanced actions like run a script native to the OS Splunk runs for such things as mitigation or remediation.
Getting Started with Splunk
Page 8 of 11
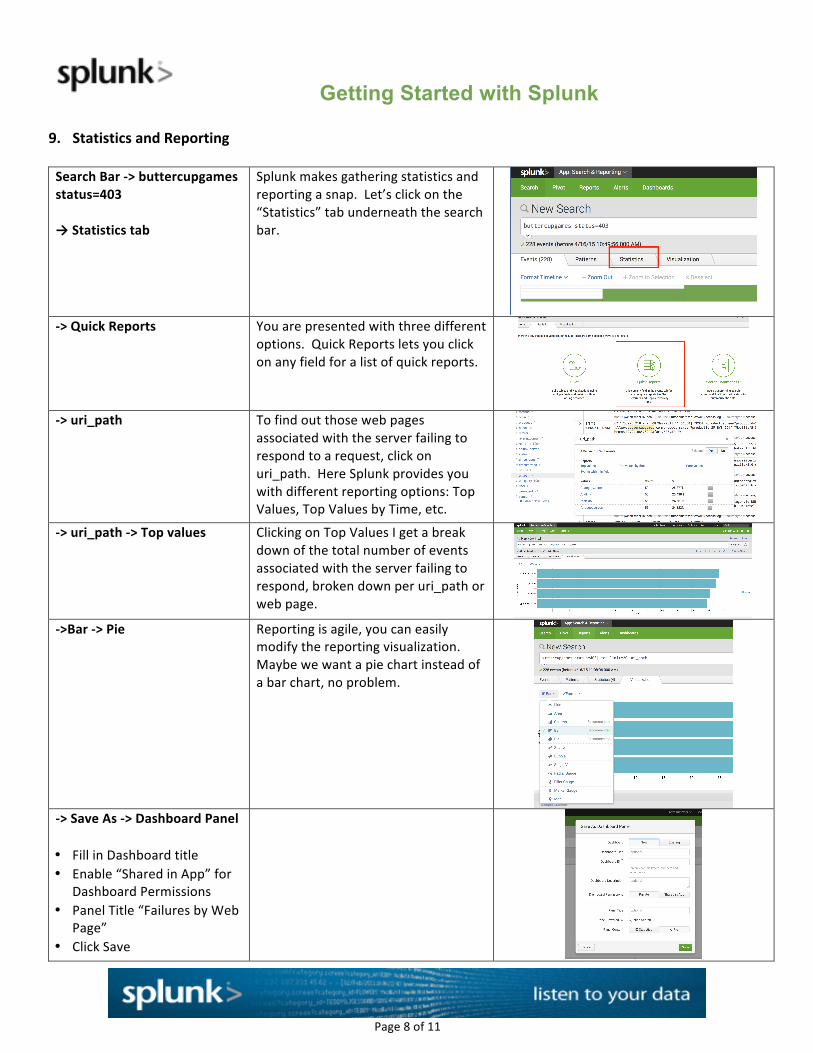
9. Statistics and Reporting Search Bar -‐> buttercupgames status=403 → Statistics tab
Splunk makes gathering statistics and reporting a snap. Let’s click on the “Statistics” tab underneath the search bar.
-‐> Quick Reports You are presented with three different
options. Quick Reports lets you click on any field for a list of quick reports.
-‐> uri_path To find out those web pages
associated with the server failing to respond to a request, click on uri_path. Here Splunk provides you with different reporting options: Top Values, Top Values by Time, etc.
-‐> uri_path -‐> Top values Clicking on Top Values I get a break down of the total number of events associated with the server failing to respond, broken down per uri_path or web page.
-‐>Bar -‐> Pie Reporting is agile, you can easily
modify the reporting visualization. Maybe we want a pie chart instead of a bar chart, no problem.
-‐> Save As -‐> Dashboard Panel • Fill in Dashboard title • Enable “Shared in App” for
Dashboard Permissions • Panel Title “Failures by Web
Page” • Click Save

Getting Started with Splunk
Page 9 of 11
• Click View Dashboard Search -‐> Search Bar -‐> buttercupgames Click on Statistics tab, choose Pivot. Click OK.
Splunk also allows you to build tables and visualizations using multiple fields and metrics without writing searches. Pivot automatically generates data models based on your data, allowing you to pivot around your data to extract statistics and reports.
-‐> + (Next to time filter), status, then match = 403
We can select the status attribute, then enter in a value of 403
Split Rows -‐> + -‐> uri_path, Add to Table
We can split the number of server refused responses by uri_path.
Click on Horizontal Bar Chart on reporting panel.
We can leave the data in tabular form or simply choose another visualization.
-‐> Save As -‐> Dashboard Panel -‐> Existing.

Getting Started with Splunk
Page 10 of 11
Make sure the previous Dashboard “Server Failures” appears. Provide a Model Title and ID. Click Save -‐> View Dashboard.
10. Command Language Search -‐> Search Bar -‐> buttercupgames | stats count by status Save As -‐> Report
There are nearly 140 search commands that can be applied to data. When searching data you isolated events you are interested in, then apply Splunk’s commands to transform data, further reduce data sets, generate statistics or perform analytics on the data. To do this we apply a pipe character (|) then issue the desired command. I.e. If we wanted to get a count of all status codes found in our data, we can use the stats command, count all events with status values, then split the count by individual status values. Lets save that as a report:
Search Bar -‐> buttercupgames | stats count by status | where status=403 OR status=404 Save As -‐> Dashboard
Maybe we’re only interested in 403’s and 404’s? No problem lets just use a WHERE command to isolate those. Cool. Let’s make this part of a dashboard.

Getting Started with Splunk
Page 11 of 11
Search Bar -‐> buttercupgames | stats count, sparkline by uri_path | where status=403 OR status=404
In addition to counting you can see trending information by adding a sparkline command to stats. Heck, lets even break it down by web page too. We’ll add that our dashboard.
Search Bar -‐> buttercupgames NOT status=200| timechart count by uri_path
What if we want to see any response that wasn’t OK, basically any non 200 code, and we like to see an actual time distribution of those. The timechart function handles that quite nicely. Because Splunk’s reporting is agile you can easily change the visualization on the fly. Maybe want stack our values for a given day. Totally cool! Lets save that to our dashboard.
Search Bar -‐> buttercupgames NOT status=200 | iplocation clientip | geostats count
Want to see where your clients are located encountering these browser requests problems, just use the iplocation and geostats commands. Definitely want to add that to my dashboard!
These are just a few ways to apply the
over 140 commands available in Splunk.
11. Splunk Applications
https://splunkbase.splunk.com The collections of these saved reports,
dashboards, alerts, input settings, etc. is what Splunk refers to as an Application. There are over 1000 readily available applications on the splunkbase website – meant to provide you instant value by providing prebuild dashboards, alerts, and reports for your datasources.
Recommended


![Skaffold - storage.googleapis.com · [getting-started getting-started] Hello world! [getting-started getting-started] Hello world! [getting-started getting-started] Hello world! 5](https://img.pdfslide.us/doc/110x75/5ec939f2a76a033f091c5ac7/skaffold-getting-started-getting-started-hello-world-getting-started-getting-started.jpg)