Geophysics 48
(3) Seismology
Introduction to Geophysics and Planetary Physics
Tectonic Plates
The seven major lithospheric plates and their boundaries (Press & Siever).
Pacific Plate
Eurasian Plate
African Plate
NorthAmerican
Plate
SouthAmerican
PlateIndo-
Australian Plate
Antarctic Plate
Geophysics 49
Eurasian Plate
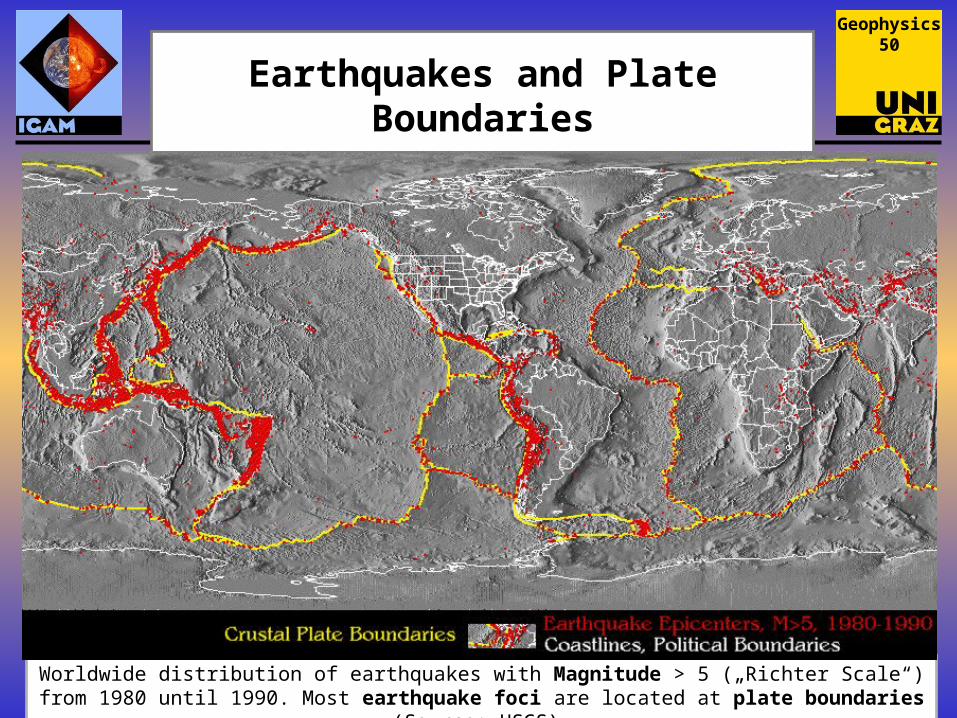
Earthquakes and Plate Boundaries
Worldwide distribution of earthquakes with Magnitude > 5 („Richter Scale“) from 1980 until 1990. Most earthquake foci are located at plate boundaries (Source: USGS).
Geophysics 50
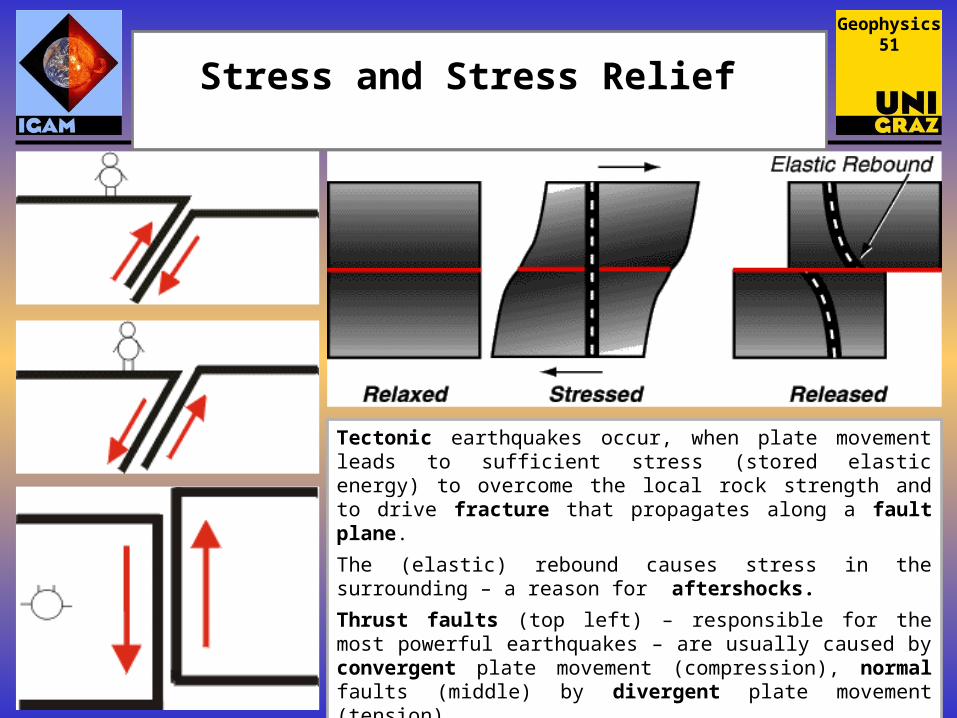
Stress and Stress Relief
Tectonic earthquakes occur, when plate movement leads to sufficient stress (stored elastic energy) to overcome the local rock strength and to drive fracture that propagates along a fault plane.
The (elastic) rebound causes stress in the surrounding – a reason for aftershocks.
Thrust faults (top left) – responsible for the most powerful earthquakes – are usually caused by convergent plate movement (compression), normal faults (middle) by divergent plate movement (tension).
Strike-slip faults (bottom) are the result of lateral movement with little or no vertical motion (shearing at transform boundaries).
Geophysics 51
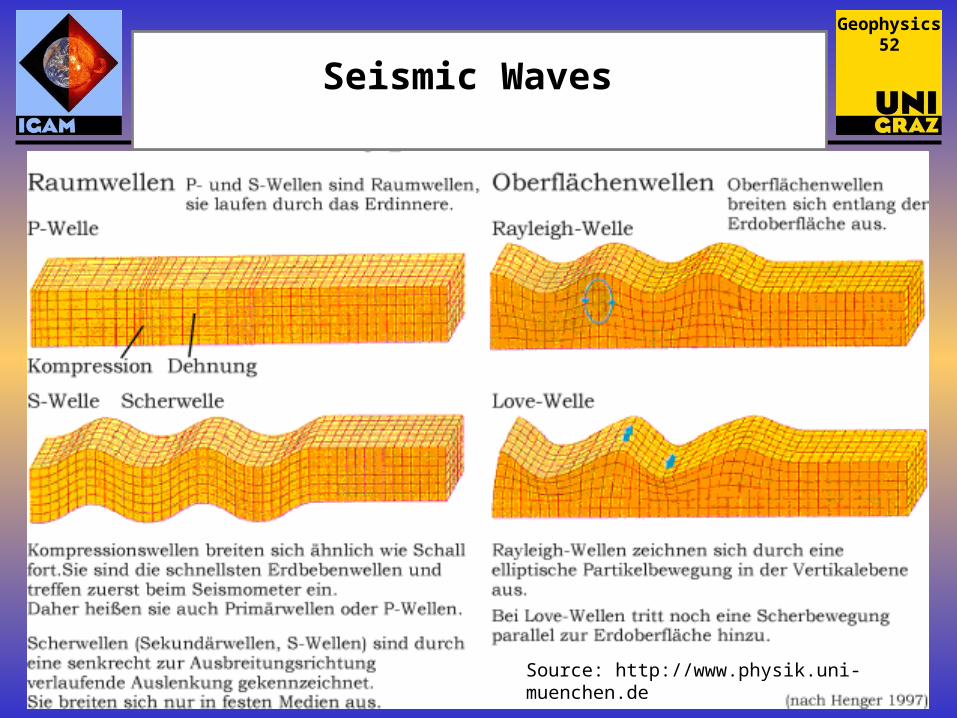
Seismic Waves
Source: http://www.physik.uni-muenchen.de
Geophysics 52
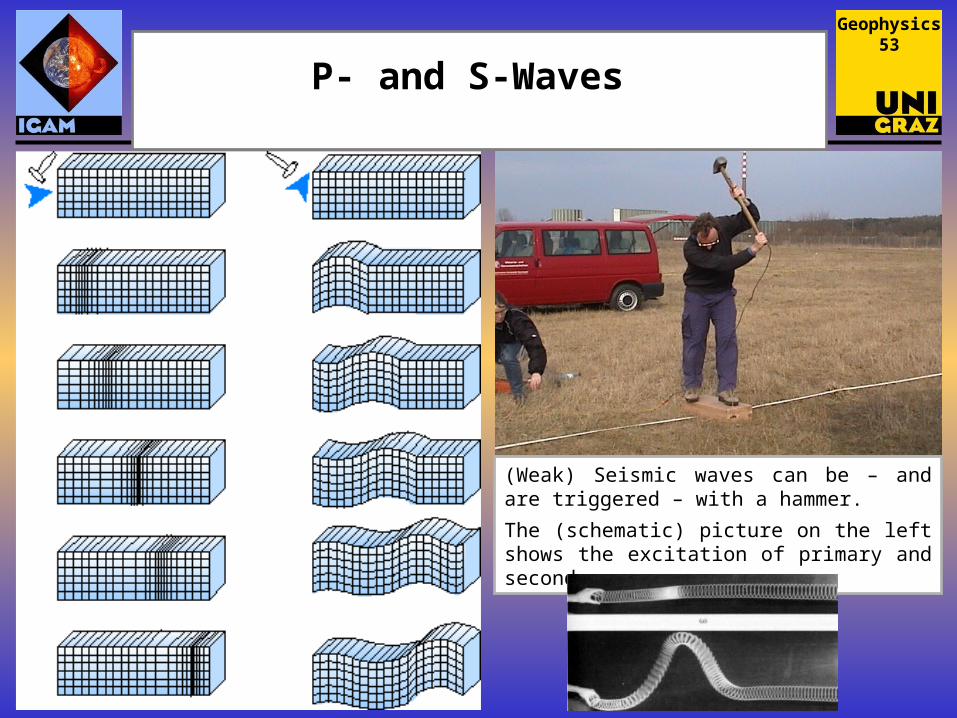
P- and S-Waves
(Weak) Seismic waves can be – and are triggered – with a hammer.
The (schematic) picture on the left shows the excitation of primary and secondary waves.
Geophysics 53
Sunquake
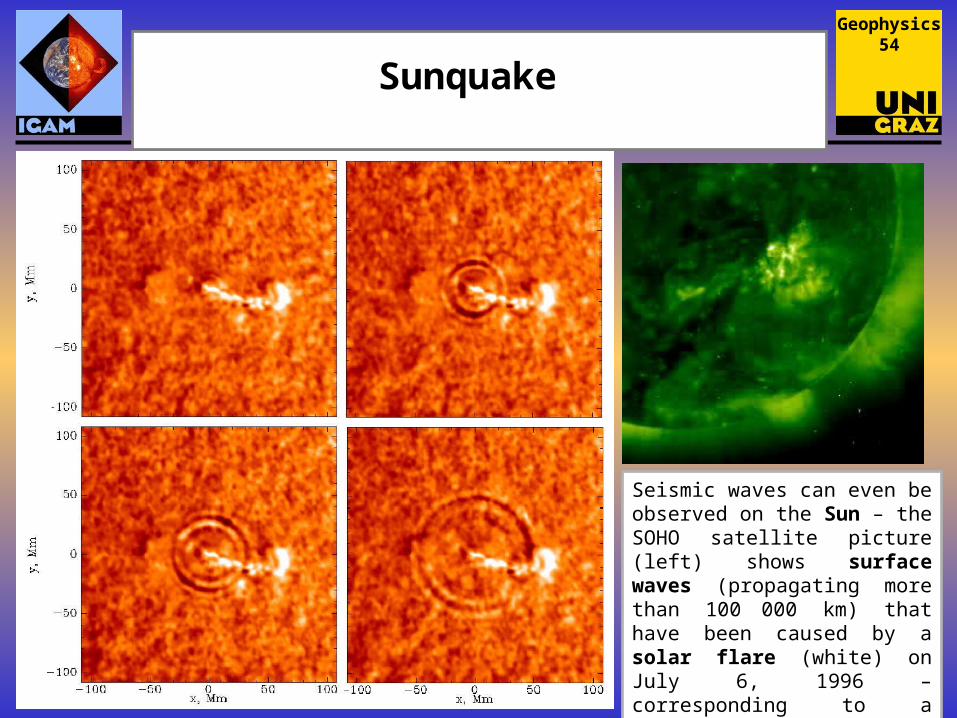
Seismic waves can even be observed on the Sun – the SOHO satellite picture (left) shows surface waves (propagating more than 100 000 km) that have been caused by a solar flare (white) on July 6, 1996 – corresponding to a magnitude 11.3
Above: Solar flare on May 2, 1998 (Source: SOHO, ESA/NASA).
Geophysics 54
Focus (Hypocenter) and Epicenter
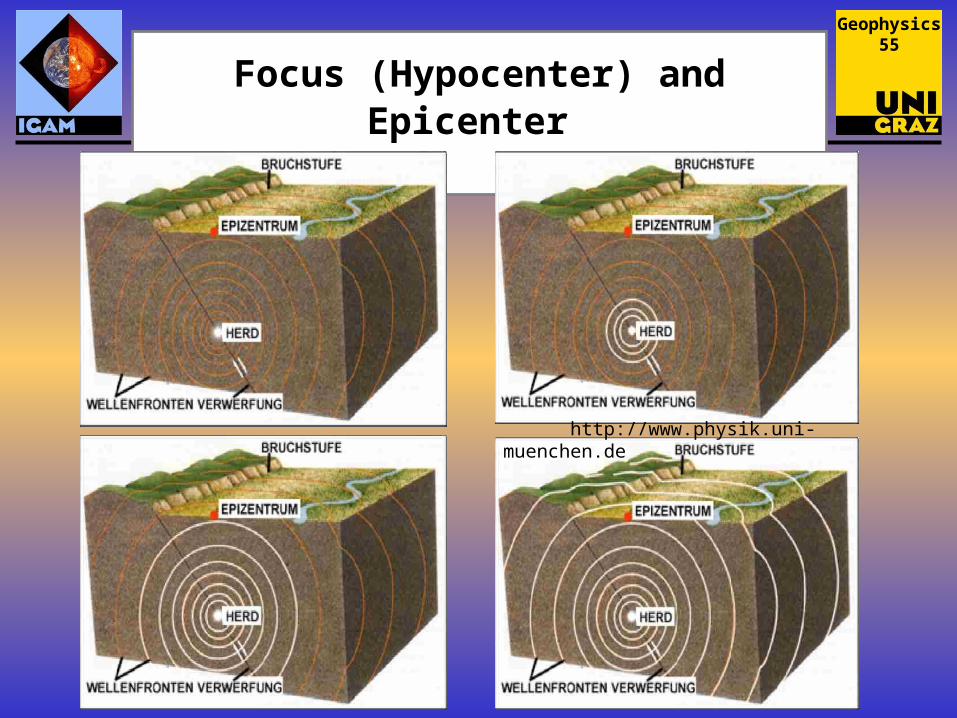
http://www.physik.uni-muenchen.de
Geophysics 55
Travel-Time Curve
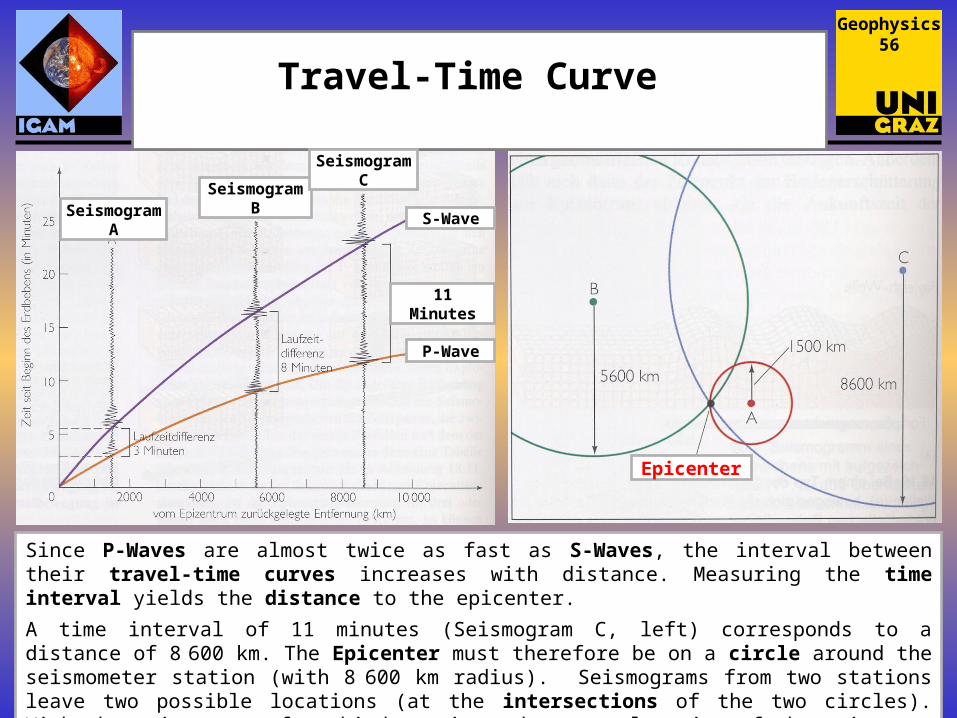
Since P-Waves are almost twice as fast as S-Waves, the interval between their travel-time curves increases with distance. Measuring the time interval yields the distance to the epicenter.
A time interval of 11 minutes (Seismogram C, left) corresponds to a distance of 8 600 km. The Epicenter must therefore be on a circle around the seismometer station (with 8 600 km radius). Seismograms from two stations leave two possible locations (at the intersections of the two circles). With the seismogram of a third station, the exact location of the epicenter can be determined („Allgemeine Geologie“, Press & Siever).
SeismogramA
SeismogramB
SeismogramC
P-Wave
S-Wave
11 Minutes
Epicenter
Geophysics 56
Seismograph
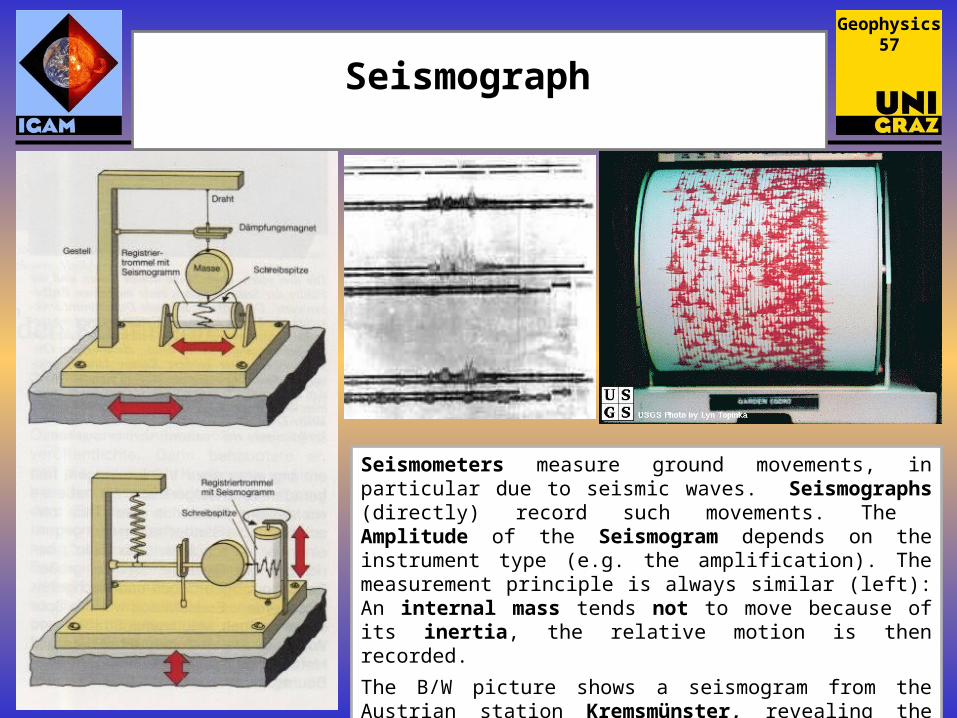
Seismometers measure ground movements, in particular due to seismic waves. Seismographs (directly) record such movements. The Amplitude of the Seismogram depends on the instrument type (e.g. the amplification). The measurement principle is always similar (left): An internal mass tends not to move because of its inertia, the relative motion is then recorded.
The B/W picture shows a seismogram from the Austrian station Kremsmünster, revealing the large earthquake in San Francisco, 1906 (Source: ZAMG) .
Geophysics 57
Dragon – Seismoscope
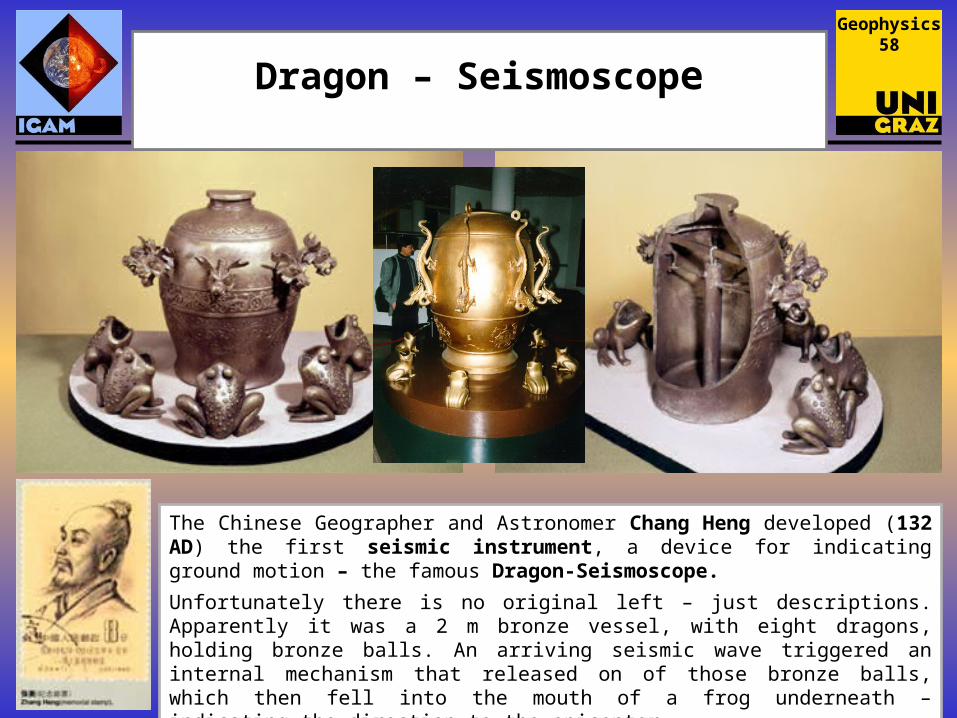
The Chinese Geographer and Astronomer Chang Heng developed (132 AD) the first seismic instrument, a device for indicating ground motion – the famous Dragon-Seismoscope.
Unfortunately there is no original left – just descriptions. Apparently it was a 2 m bronze vessel, with eight dragons, holding bronze balls. An arriving seismic wave triggered an internal mechanism that released on of those bronze balls, which then fell into the mouth of a frog underneath – indicating the direction to the epicenter.
Geophysics 58
Richter–Magnitude
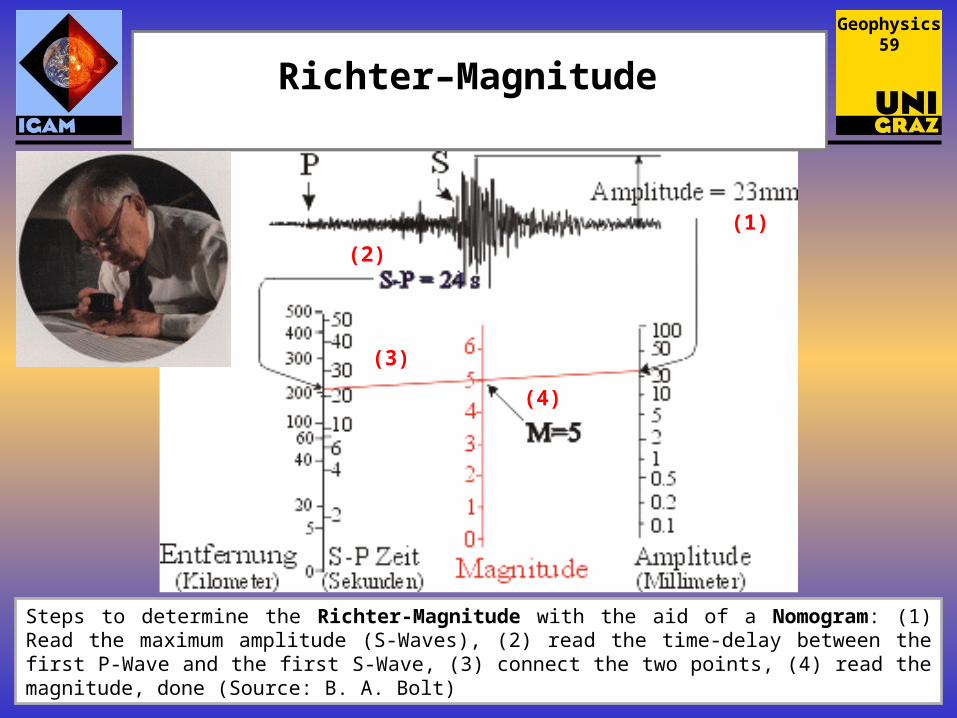
Steps to determine the Richter-Magnitude with the aid of a Nomogram: (1) Read the maximum amplitude (S-Waves), (2) read the time-delay between the first P-Wave and the first S-Wave, (3) connect the two points, (4) read the magnitude, done (Source: B. A. Bolt)
(1)
(2)
(3)
(4)
Geophysics 59
Recommended