3/3/20113/3/2011
11
GeoGeo‐‐electrical Methodselectrical Methodsfor Geothermal Explorationfor Geothermal Exploration
Dr. Hendra GrandisFaculty of Mining and PetroleumFaculty of Mining and Petroleum Engineering ‐ ITB
Electrical Properties of RocksElectrical Properties of Rocks
Electric currents flowing through a rock formation are mostly due to pore fluids.
3/3/20113/3/2011
22
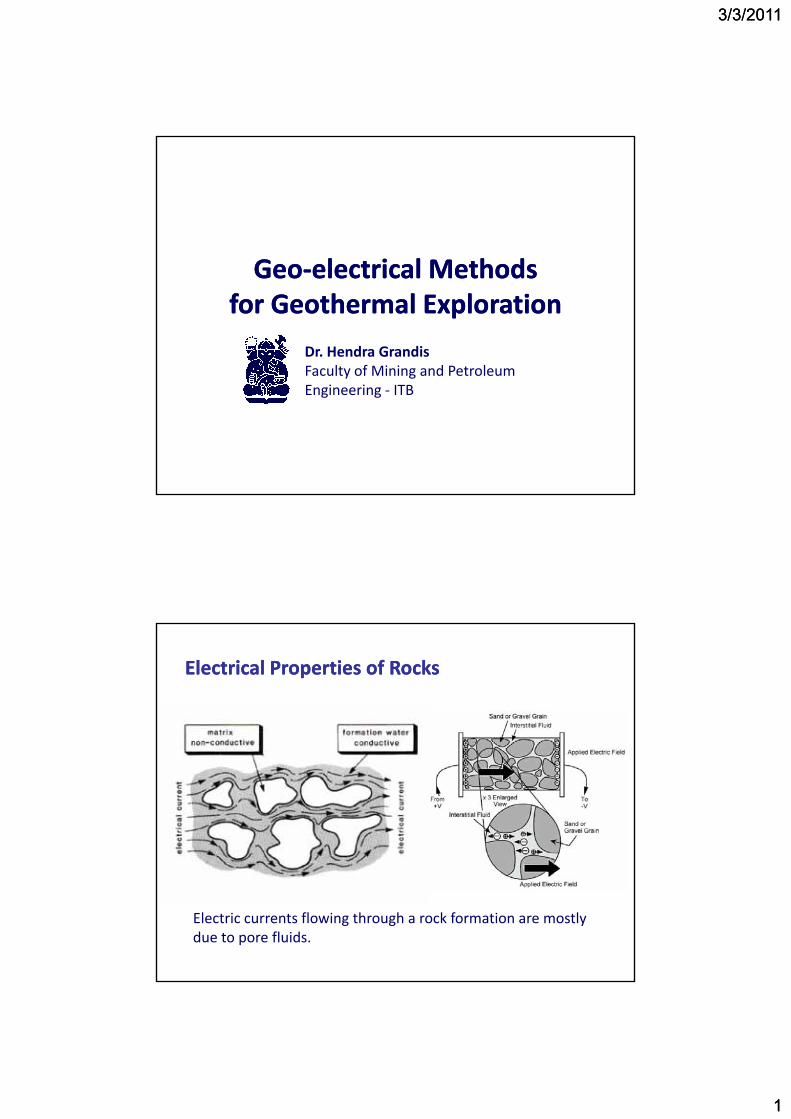
Electrical Properties of RocksElectrical Properties of Rocks
An electrical model for a porous rock containing pore fluids (water).
Conductivity Conductivity –– Salinity Salinity –– TemperatureTemperature
Conductivity of electrolyte fluid as function of salinity.
Conductivity of NaCl as function of salinity and temperature.

3/3/20113/3/2011
33
Archie’s LawArchie’s Law
3/3/20113/3/2011
44
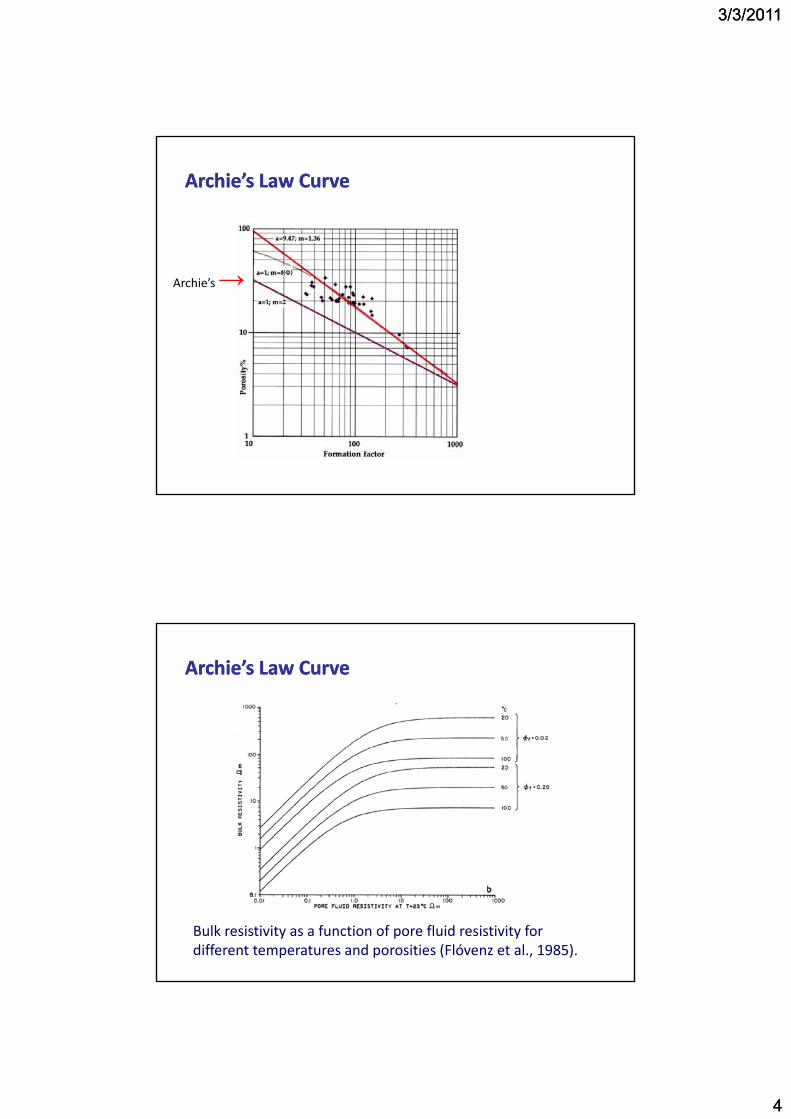
Archie’s Law CurveArchie’s Law Curve
Archie’s→
Archie’s Law CurveArchie’s Law Curve
Bulk resistivity as a function of pore fluid resistivity fordifferent temperatures and porosities (Flóvenz et al., 1985).
3/3/20113/3/2011
55
Resistivity of RocksResistivity of Rocks
Alteration Mineralogy Alteration Mineralogy
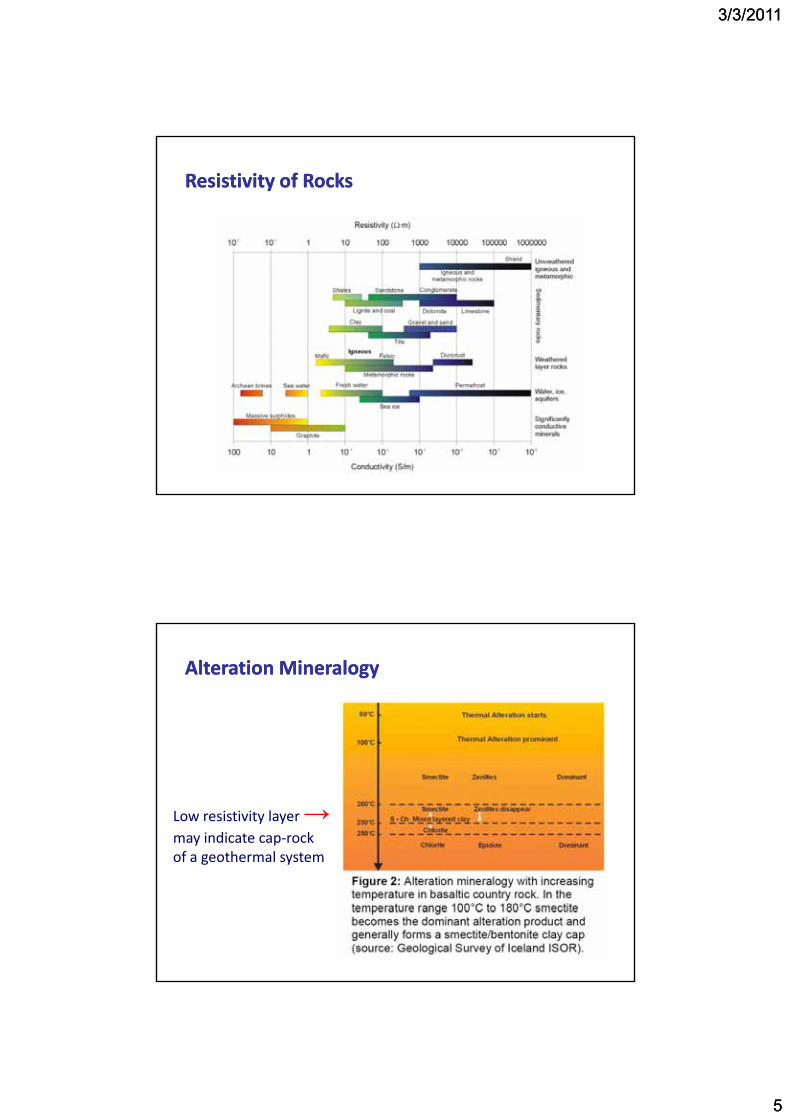
Low resistivity layer →may indicate cap‐rockof a geothermal systemg y
3/3/20113/3/2011
66
Alteration and Resistivity Alteration and Resistivity
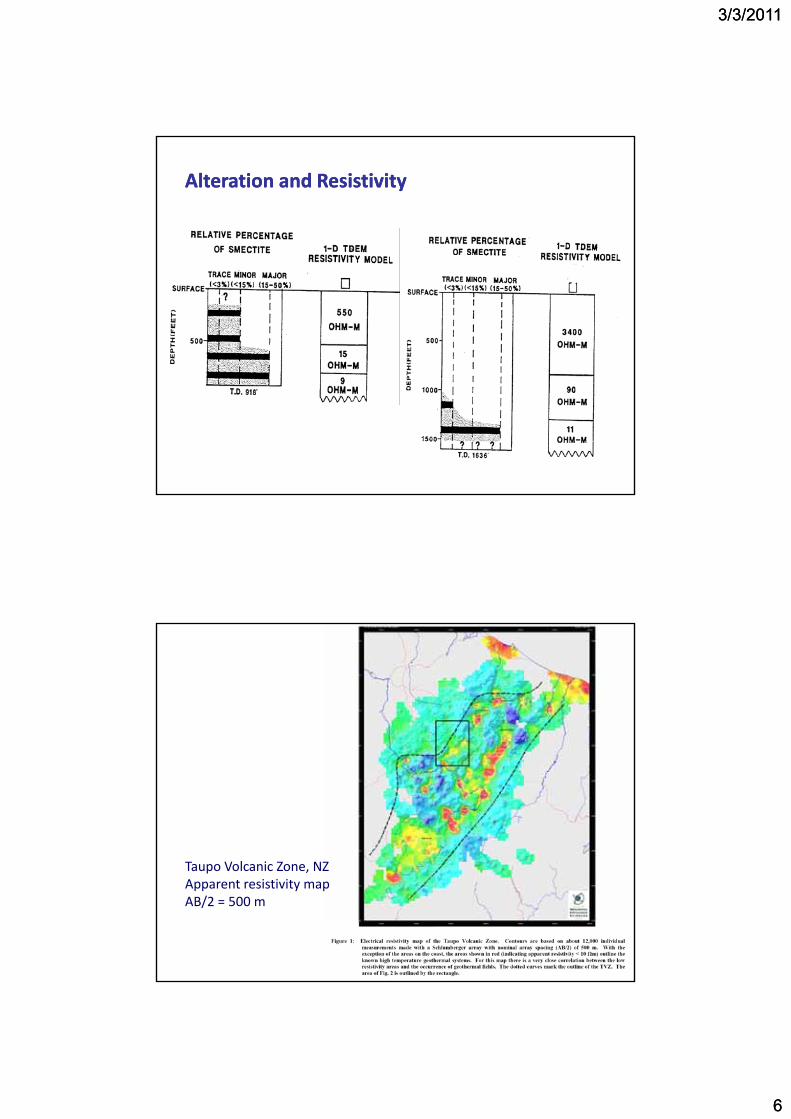
T V l i Z NZTaupo Volcanic Zone, NZApparent resistivity mapAB/2 = 500 m
3/3/20113/3/2011
77
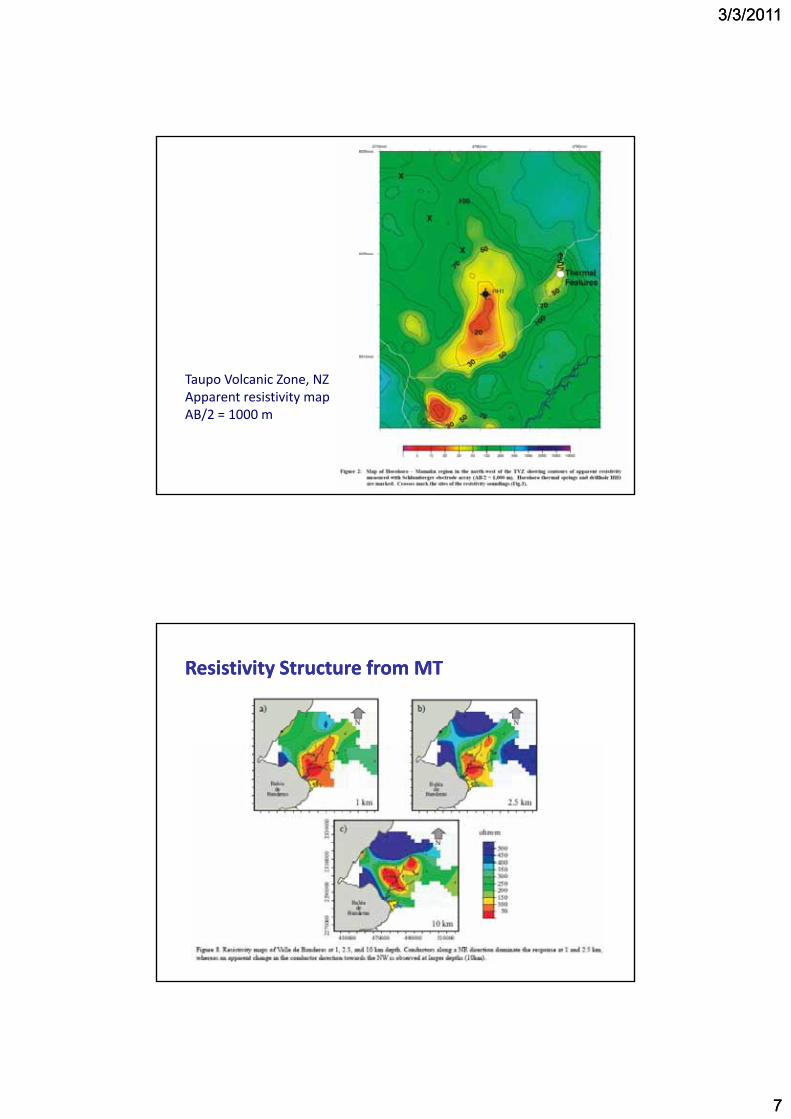
T V l i Z NZTaupo Volcanic Zone, NZApparent resistivity mapAB/2 = 1000 m
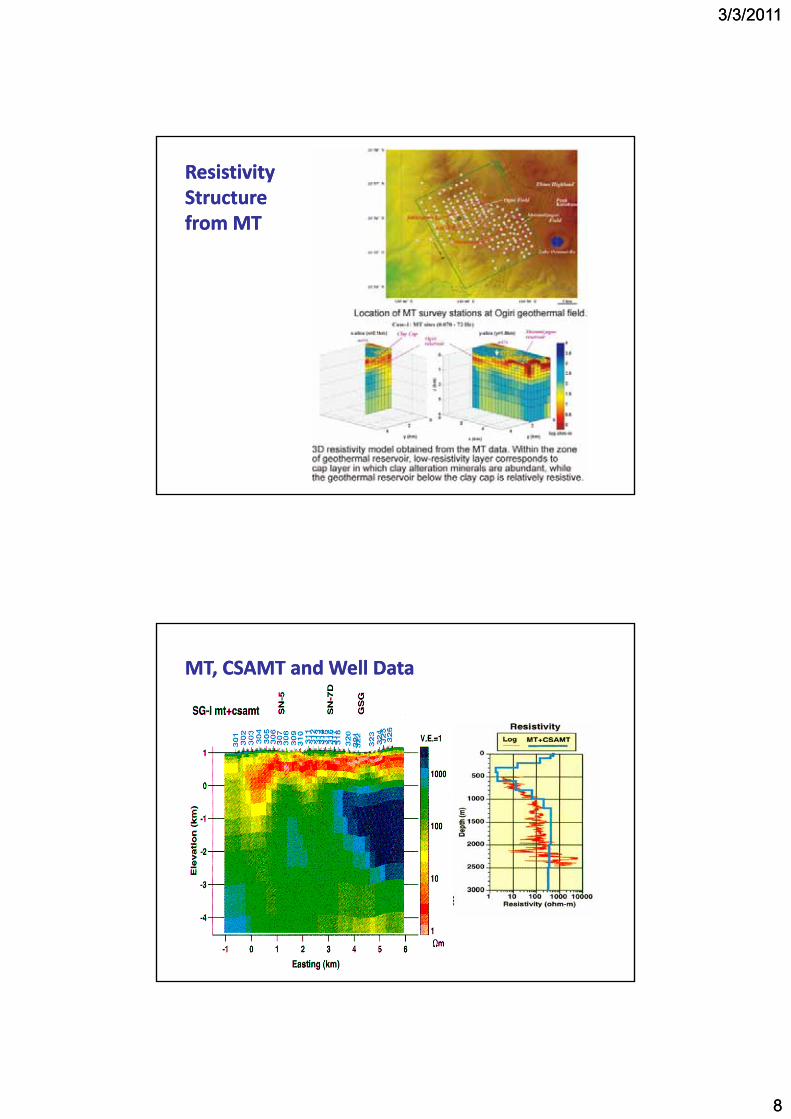
Resistivity Structure from MTResistivity Structure from MT
3/3/20113/3/2011
88
Resistivity Resistivity Structure Structure from MTfrom MT
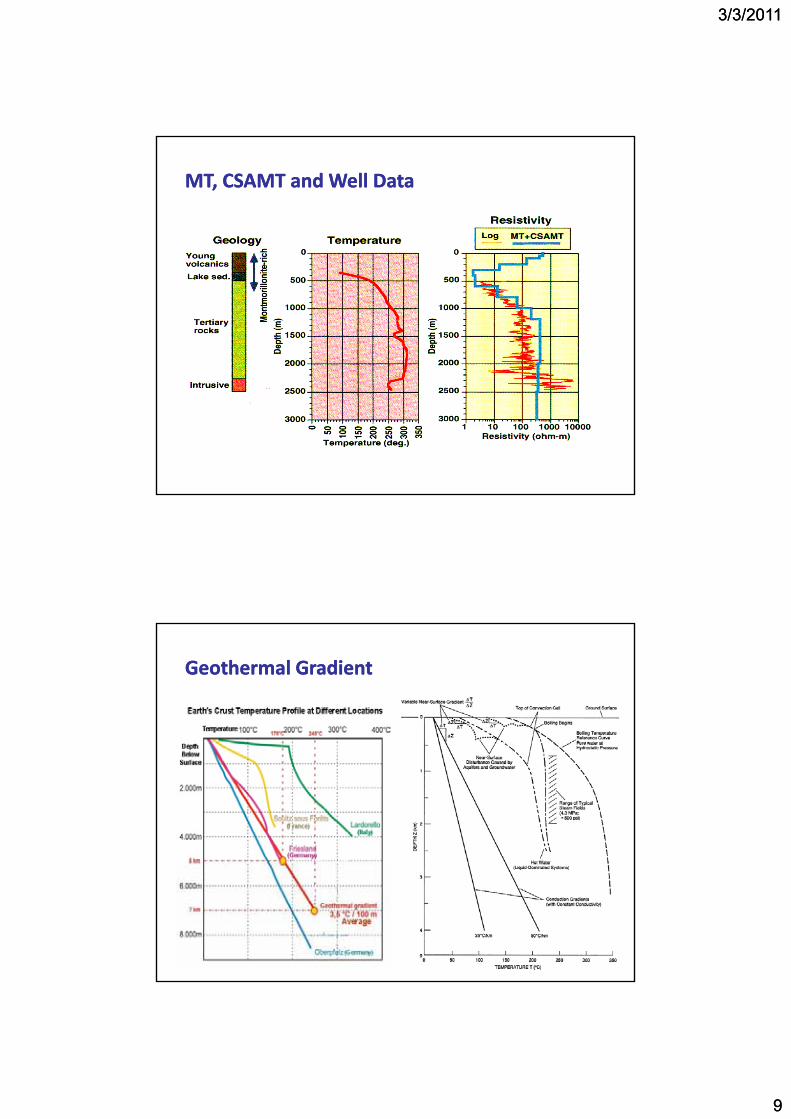
MT, CSAMT and Well DataMT, CSAMT and Well Data
3/3/20113/3/2011
99
MT, CSAMT and Well DataMT, CSAMT and Well Data
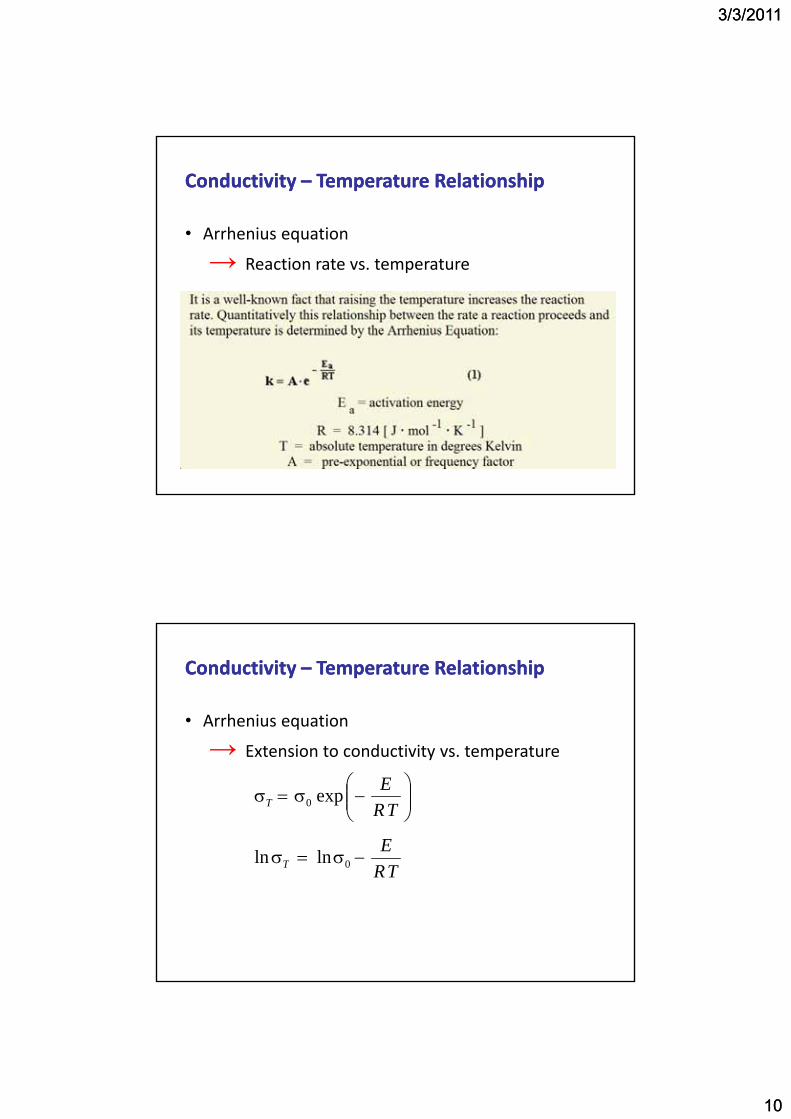
Geothermal GradientGeothermal Gradient
3/3/20113/3/2011
1010
ConductivityConductivity –– Temperature RelationshipTemperature Relationship
• Arrhenius equation
→ Reaction rate vs. temperature
ConductivityConductivity –– Temperature RelationshipTemperature Relationship
• Arrhenius equation
→ Extension to conductivity vs. temperature
⎟⎟⎠
⎞⎜⎜⎝
⎛−σ=σ
TRE
T exp0
ET −σ=σ 0lnln
TRT σσ 0lnln
3/3/20113/3/2011
1111
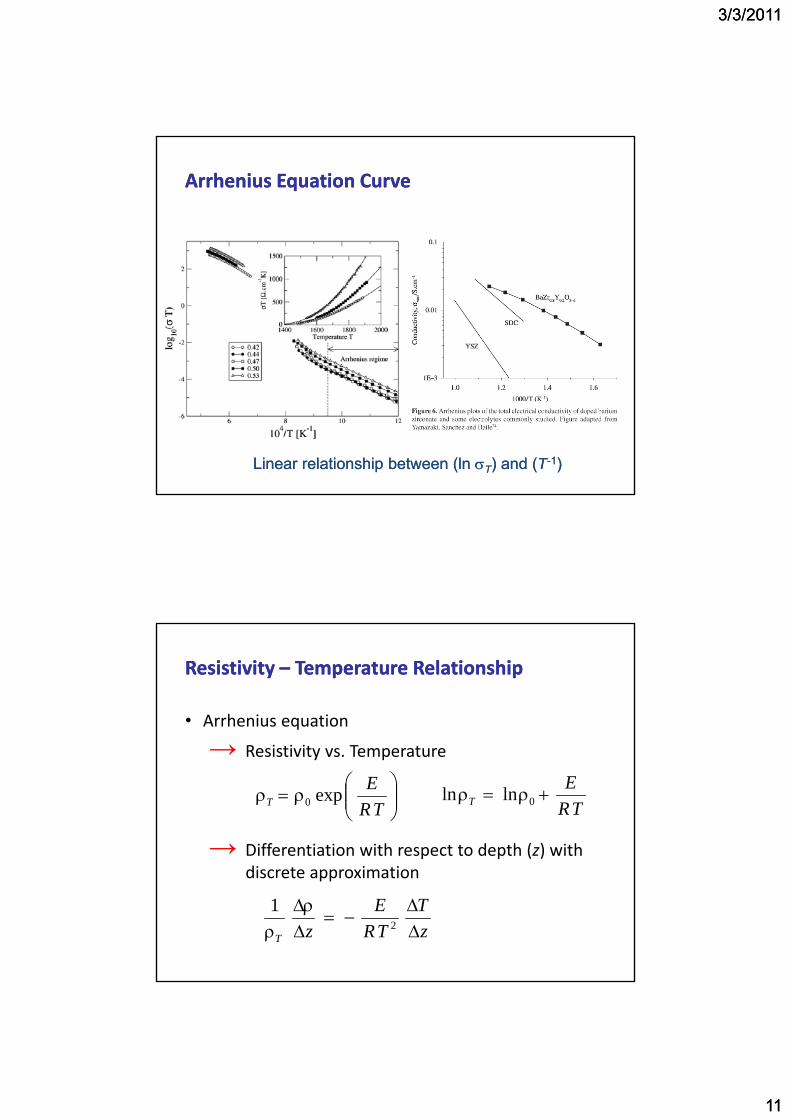
Arrhenius Equation CurveArrhenius Equation Curve
Linear relationship between (ln Linear relationship between (ln σσTT) and () and (TT--11))
ResistiResistivityvity –– Temperature RelationshipTemperature Relationship
• Arrhenius equation
→ Resistivity vs. Temperature
→ Differentiation with respect to depth (z) with
⎟⎟⎠
⎞⎜⎜⎝
⎛ρ=ρ
TRE
T exp0 TRE
T +ρ=ρ 0lnln
discrete approximation
zT
TRE
zT ∆∆
−=∆
ρ∆ρ 21
3/3/20113/3/2011
1212
ResistiResistivityvity –– Temperature RelationshipTemperature Relationship
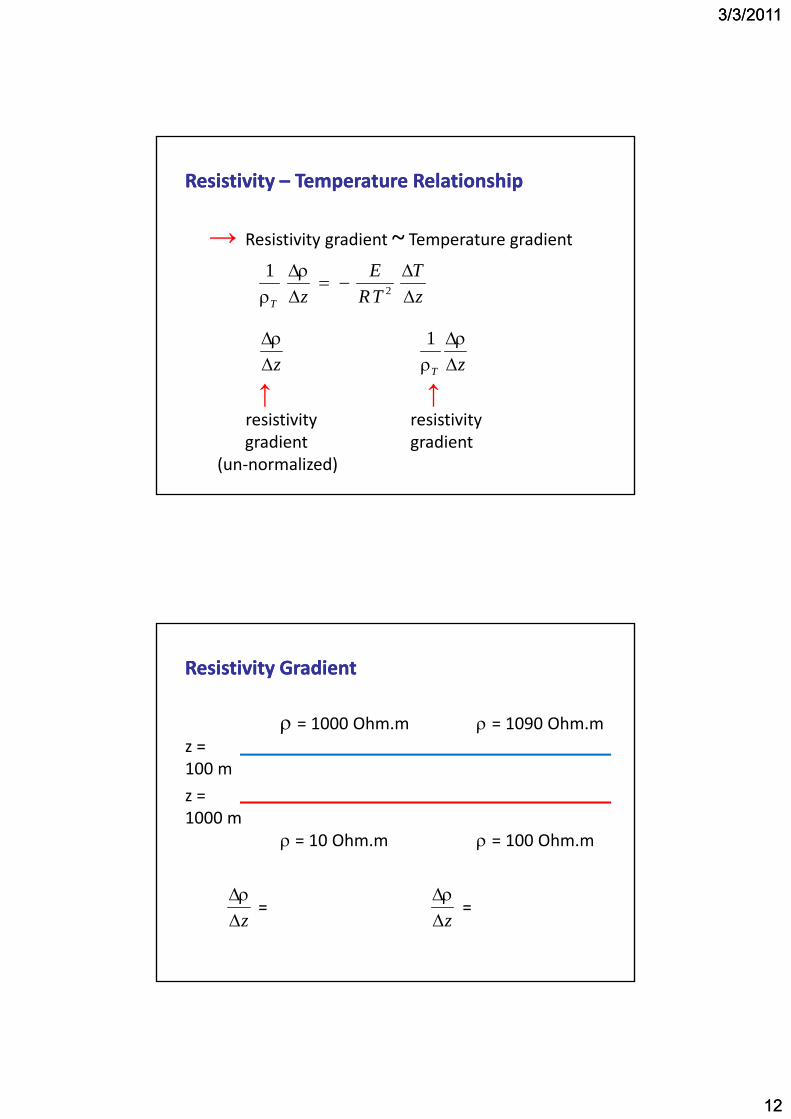
→ Resistivity gradient ~ Temperature gradient
zT
TRE
zT ∆∆
−=∆
ρ∆ρ 21
z∆ρ∆
zT ∆ρ∆
ρ1
↑ ↑resistivity resistivity gradient gradient
(un‐normalized)
ρ = 1000 Ohm.m ρ = 1090 Ohm.m
ResistiResistivityvity GradientGradient
z =100 m
z = 1000 m
ρ = 10 Ohm.m ρ = 100 Ohm.m
= = z∆ρ∆
z∆ρ∆
3/3/20113/3/2011
1313
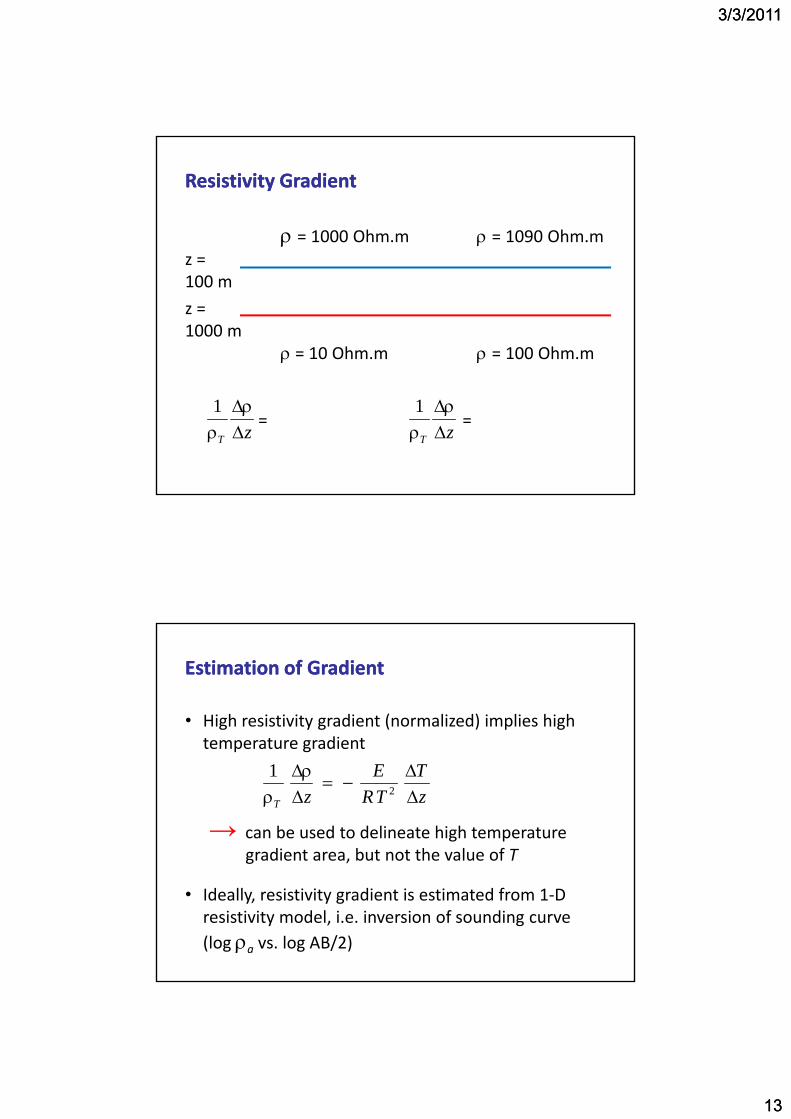
ρ = 1000 Ohm.m ρ = 1090 Ohm.m
ResistiResistivityvity GradientGradient
z =100 m
z = 1000 m
ρ = 10 Ohm.m ρ = 100 Ohm.m
zT ∆ρ∆
ρ1
zT ∆ρ∆
ρ1
= =
Estimation of Estimation of GradientGradient
• High resistivity gradient (normalized) implies high temperature gradienttemperature gradient
→ can be used to delineate high temperature gradient area, but not the value of T
zT
TRE
zT ∆∆
−=∆
ρ∆ρ 21
g ,
• Ideally, resistivity gradient is estimated from 1‐D resistivity model, i.e. inversion of sounding curve (log ρa vs. log AB/2)
3/3/20113/3/2011
1414
Estimation of Estimation of GradientGradient
• High resistivity gradient (normalized) implies high temperature gradienttemperature gradient
→ can be used to delineate high temperature gradient area, but not the value of T
zT
TRE
zT ∆∆
−=∆
ρ∆ρ 21
g ,
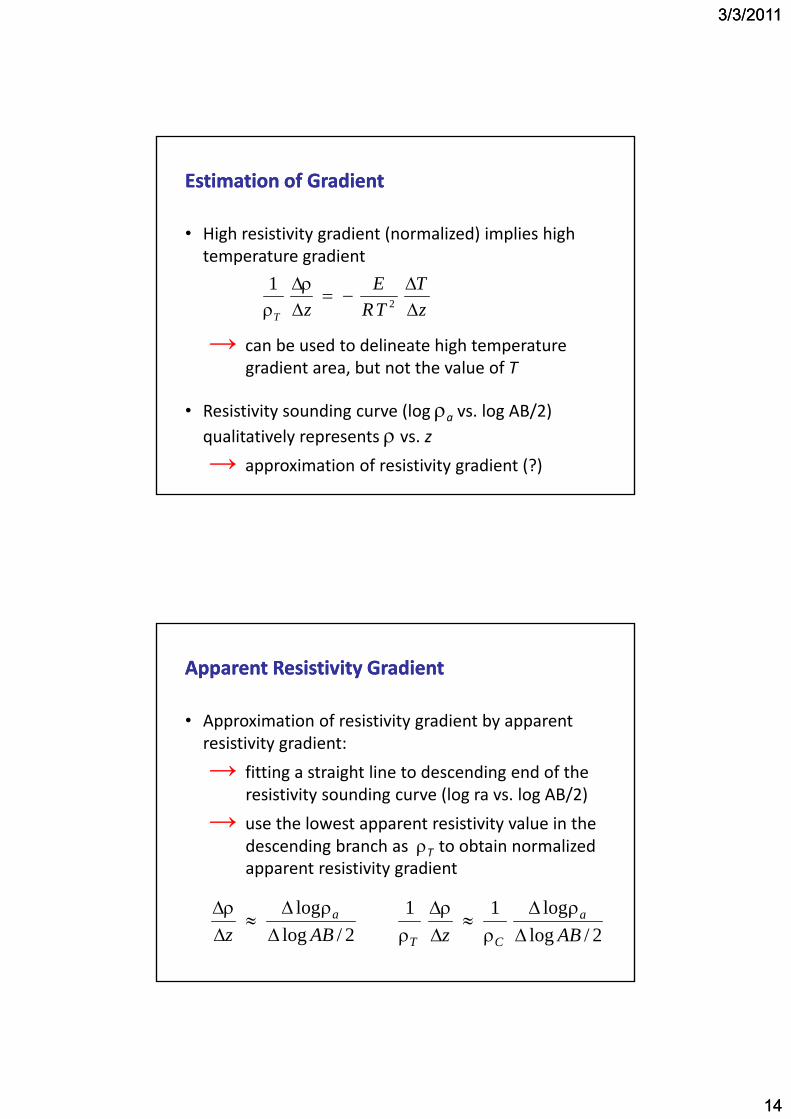
• Resistivity sounding curve (log ρa vs. log AB/2) qualitatively represents ρ vs. z
→ approximation of resistivity gradient (?)
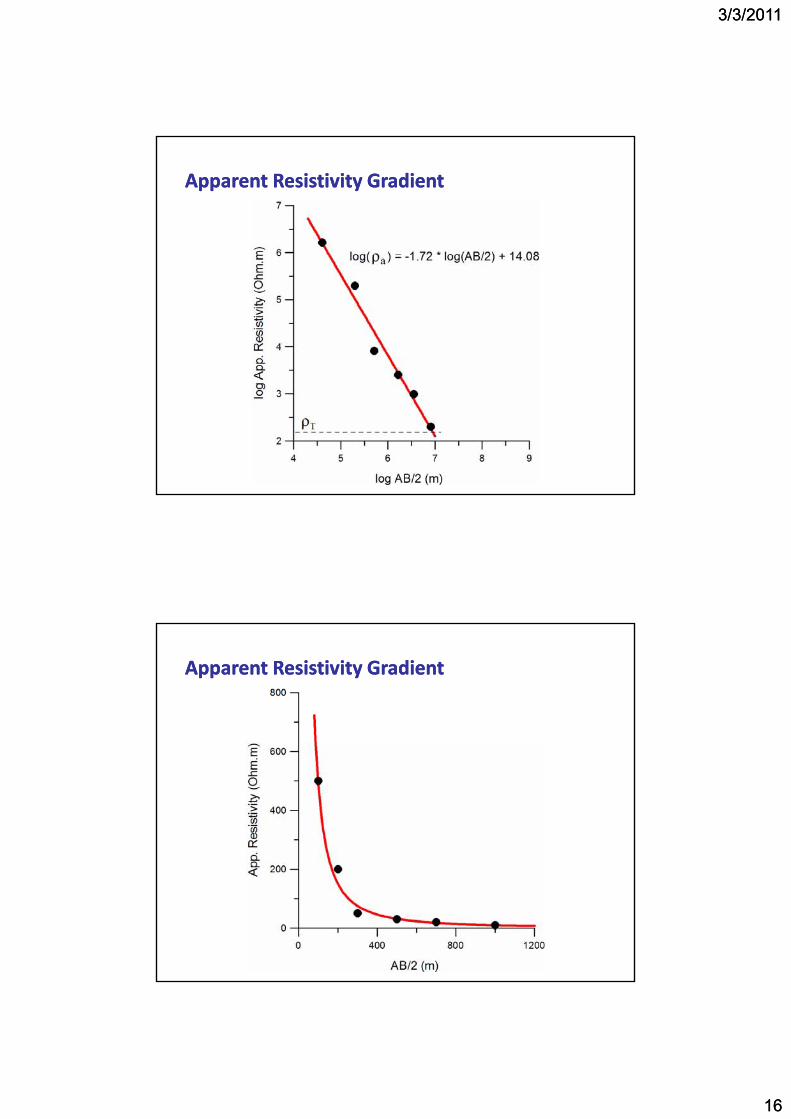
Apparent Resistivity GradientApparent Resistivity Gradient
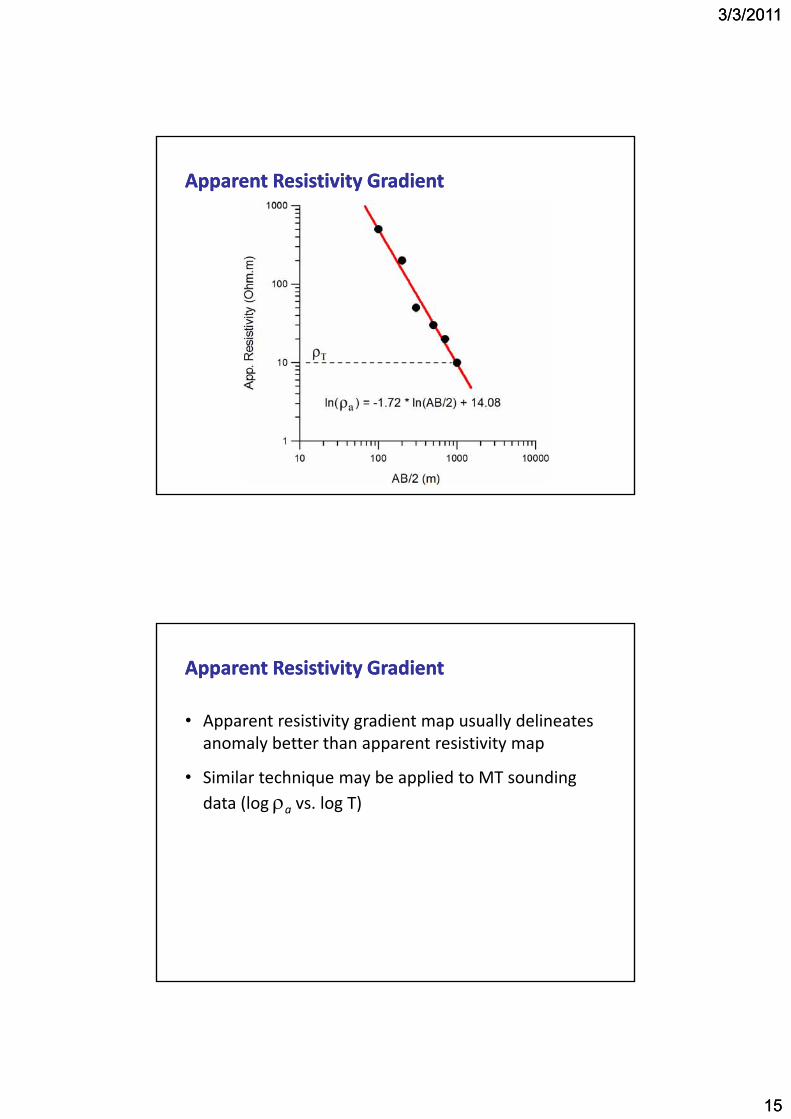
• Approximation of resistivity gradient by apparent resistivity gradient:resistivity gradient:
→ fitting a straight line to descending end of theresistivity sounding curve (log ra vs. log AB/2)
→ use the lowest apparent resistivity value in the descending branch as ρT to obtain normalized
i i i diapparent resistivity gradient
2/loglog
ABza
∆ρ∆
≈∆
ρ∆2/log
log11ABz
a
CT ∆ρ∆
ρ≈
∆ρ∆
ρ
3/3/20113/3/2011
1515
Apparent Resistivity GradientApparent Resistivity Gradient
Apparent Resistivity GradientApparent Resistivity Gradient
• Apparent resistivity gradient map usually delineates anomaly better than apparent resistivity mapanomaly better than apparent resistivity map
• Similar technique may be applied to MT sounding data (log ρa vs. log T)
3/3/20113/3/2011
1616
Apparent Resistivity GradientApparent Resistivity Gradient
Apparent Resistivity GradientApparent Resistivity Gradient
Recommended


![[GEOTHERMAL RESOURCE] 10-PM...[GEOTHERMAL RESOURCE] 10-PM Geothermal Reservoir Monitoring Using Multi-geophysical Survey Techniques Tsuneo ISHIDO Institute for Geo-Resources and Environment,](https://img.pdfslide.us/doc/110x75/5f23860250a1a91a656a1312/geothermal-resource-10-pm-geothermal-resource-10-pm-geothermal-reservoir.jpg)