Genetic effect of domestication Genetic effect of domestication selective pressures on Pacific oyster selective pressures on Pacific oyster
at larval stageat larval stage
N. Taris, C. Sauvage, B. N. Taris, C. Sauvage, B. ErnandeErnande*, *, P. BoudryP. Boudry
Laboratoire de Génétique et Pathologie, La Tremblade Laboratoire de Génétique et Pathologie, La Tremblade –– FranceFrance* Laboratoire Ressources Halieutiques, Avenue du G* Laboratoire Ressources Halieutiques, Avenue du Géénnééral de Gaulle, B.P. 32, 14520 ral de Gaulle, B.P. 32, 14520 PortPort--enen--BessinBessin, France, France
larvi 2005 Ghent University, Belgium september 5 - 8, 2005
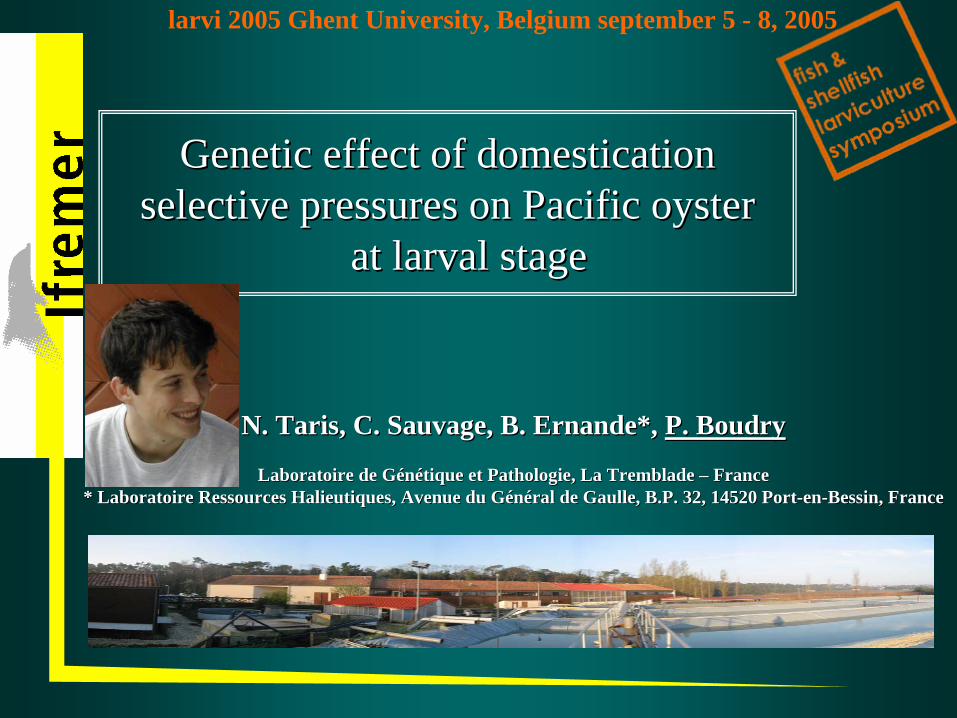
Crassostrea gigas life cycle
Williams 1975
Stages Survival
++++++++++++++
+
+++++++++
+++++
The “elmThe “elm--oyster model”oyster model”
High fecundity and high mortality at early stages
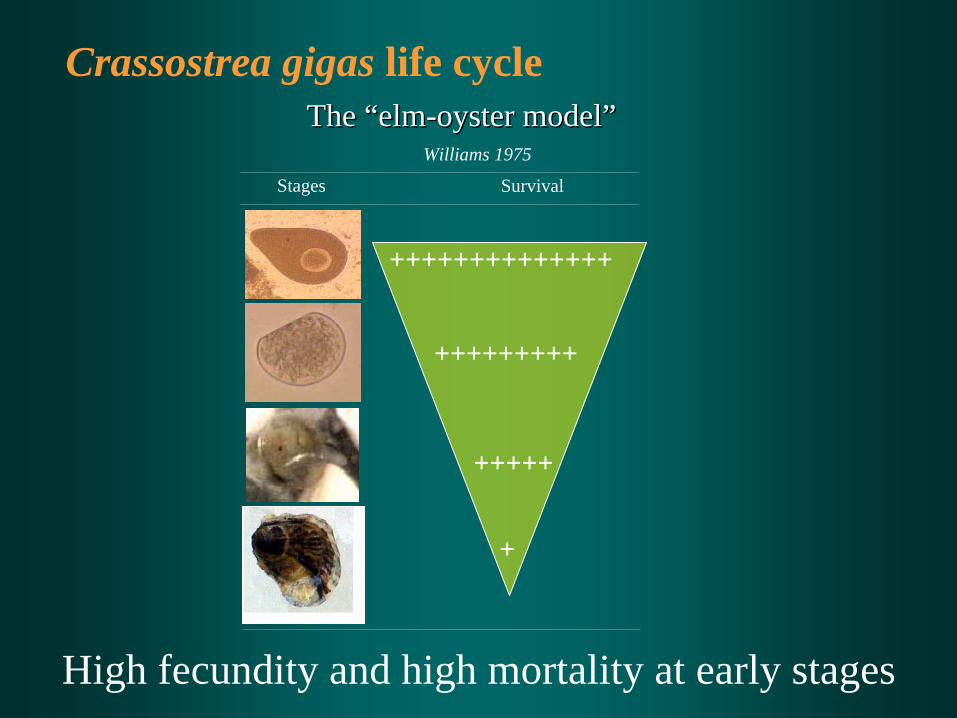
Can specific rearing practices (culling) and/or environmental conditions (high temperature) lead to a specific genetic
adaptation in C. gigas larvae ?
Which consequences of such a life history strategy for hatchery production ?
☺ Few genitors needed for mass production of juveniles☺ Culling (size selection)
Low effective population size (Hedgecock et al., 1992)Risks of rapid loss of genetic variability and inbreeding in
closed populations
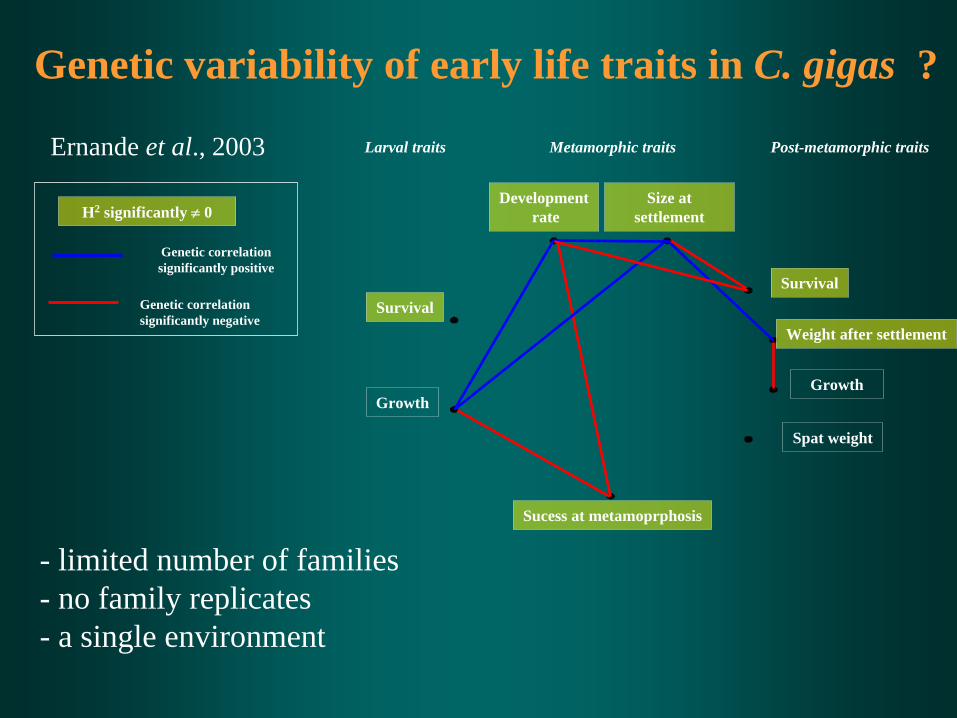
Ernande et al., 2003 Larval traits Metamorphic traits
Survival
Growth
Developmentrate
Size at settlement
Sucess at metamoprphosis
Spat weight
Growth
Weight after settlement
Survival
Post-metamorphic traits
H2 significantly ≠
0
Genetic correlation significantly positive
Genetic correlation significantly negative
Genetic variability of early life traits in C. gigas ?
- limited number of families- no family replicates - a single environment
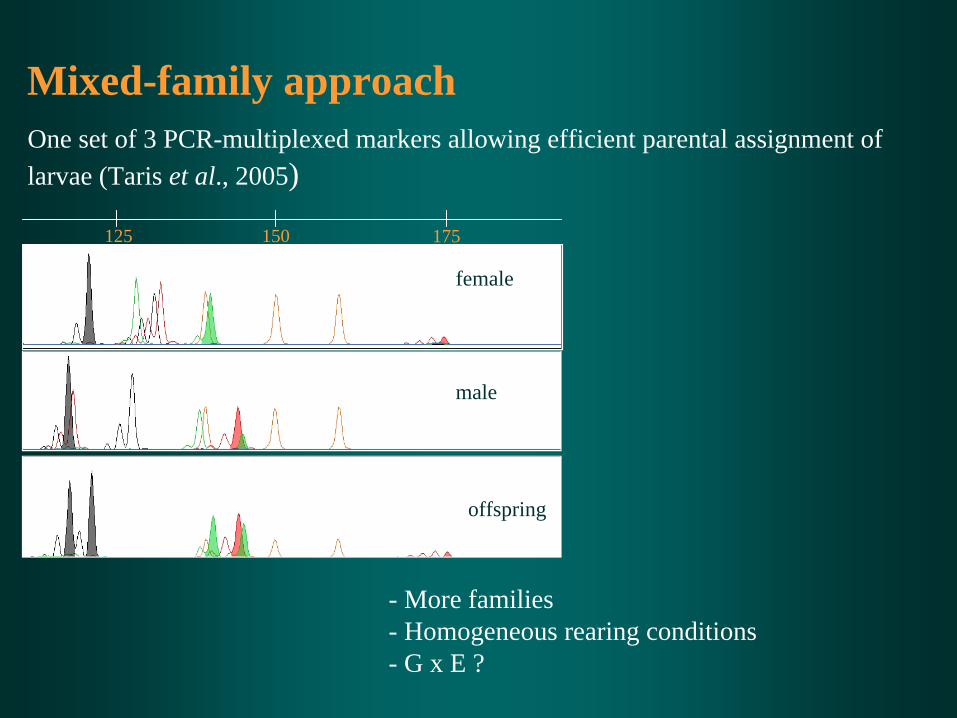
Mixed-family approachOne set of 3 PCR-multiplexed markers allowing efficient parental assignment of larvae (Taris et al., 2005)
125 150 175
female
male
offspring
- More families- Homogeneous rearing conditions- G x E ?
X
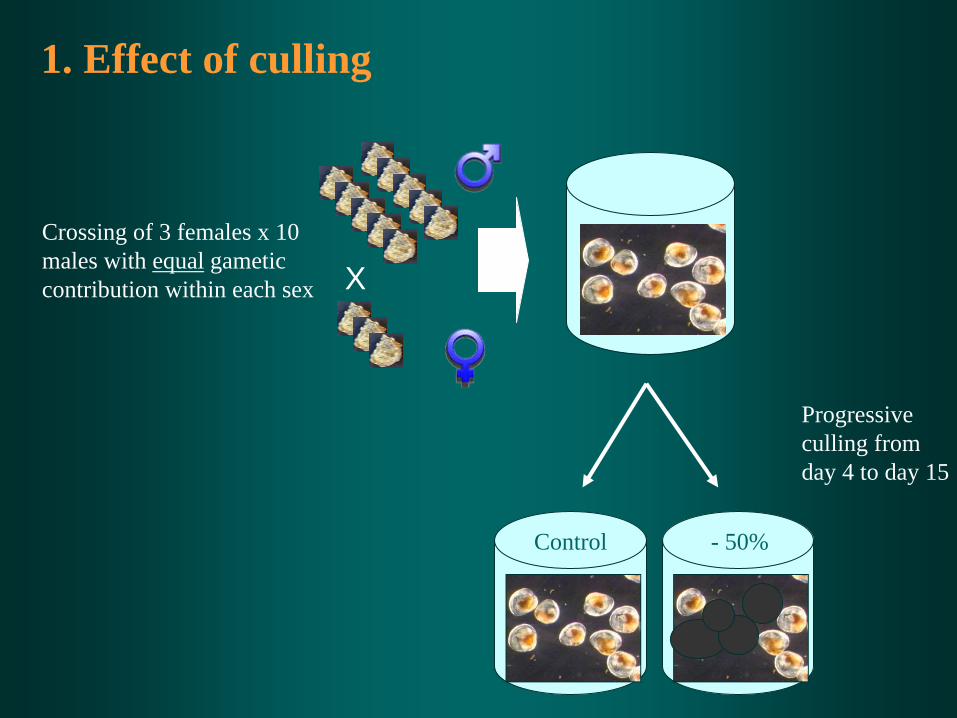
1. Effect of culling
Crossing of 3 females x 10 males with equal gametic contribution within each sex
- 50%
Progressive culling fromday 4 to day 15
Control
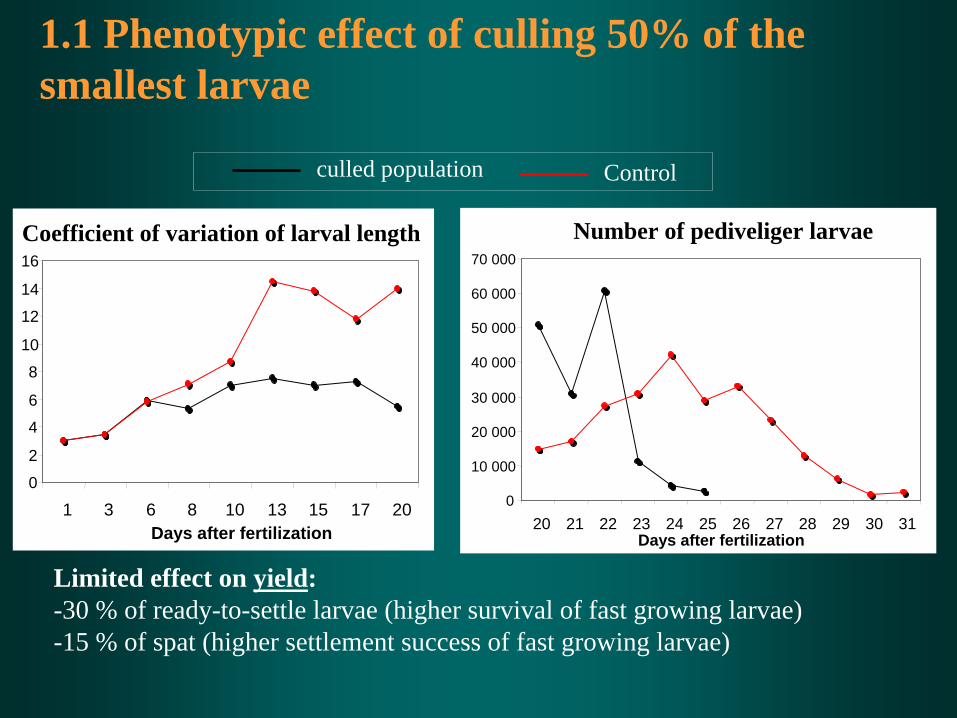
culled population Control
Number of pediveliger larvae
0
10 000
20 000
30 000
40 000
50 000
60 000
70 000
20 21 22 23 24 25 26 27 28 29 30 31Days
after
fertilization
1.1 Phenotypic effect of culling 50% of the smallest larvae
Limited effect on yield:-30 % of ready-to-settle larvae (higher survival of fast growing larvae)-15 % of spat (higher settlement success of fast growing larvae)
Coefficient of variation of larval length
0
2
4
6
8
10
12
14
16
1 3 6 8 10 13 15 17 20Days
after
fertilization
20 21 22 23 24 25 26 27 28 29 30 31
Sampling
B
Sampling
Sampling
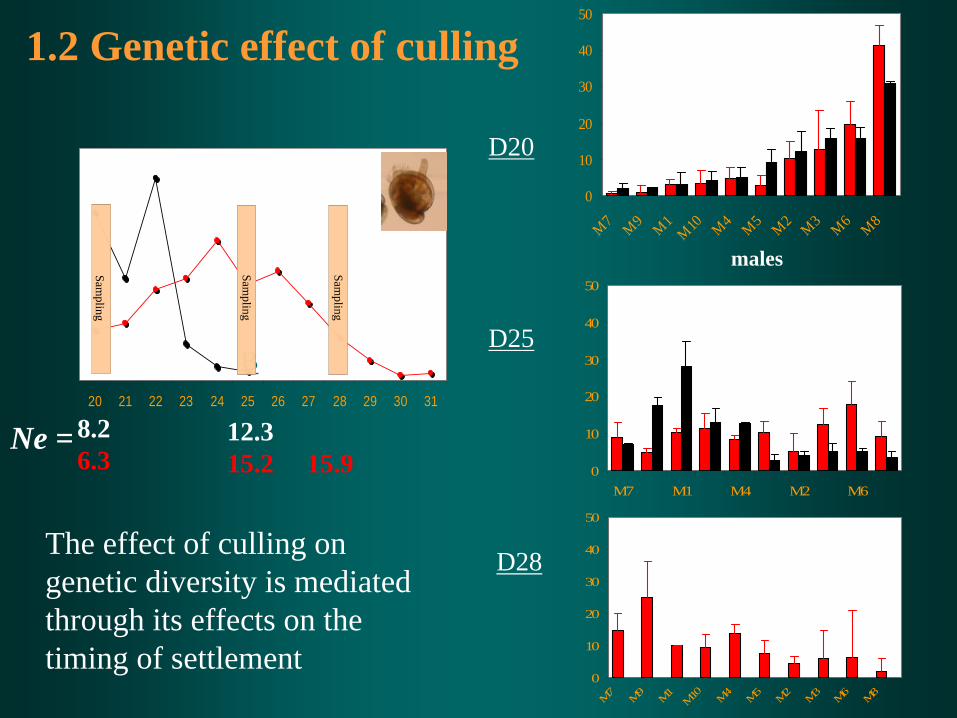
1.2 Genetic effect of culling
0
10
20
30
40
50
M7 M9 M1M10 M4 M5 M2 M3 M6 M8
males
D20
8.26.3
Ne =
D25
D28
0
10
20
30
40
50
M7
M9
M1
M10 M4
M5
M2
M3
M6
M8
0
10
20
30
40
50
M7 M1 M4 M2 M6
12.315.2 15.9
The effect of culling on genetic diversity is mediated through its effects on the timing of settlement
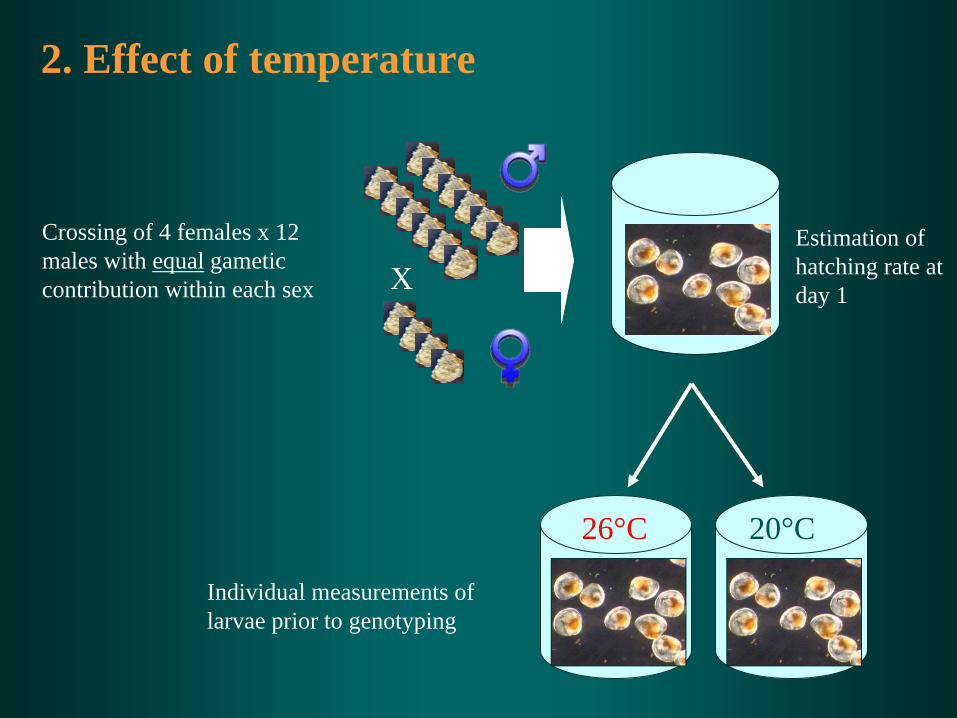
26°C 20°C
X
2. Effect of temperature
Crossing of 4 females x 12 males with equal gametic contribution within each sex
Individual measurements of larvae prior to genotyping
Estimation of hatching rate at day 1
50
100
150
200
250
300
350
400
1 3 6 8 10 13 15 17 20 22 24 27 29 30 31 33 80-28
-24
-20
-16
-12
-8
-4
0
4
8
12
16
leng
th(µ
m) l
arva
l she
ll
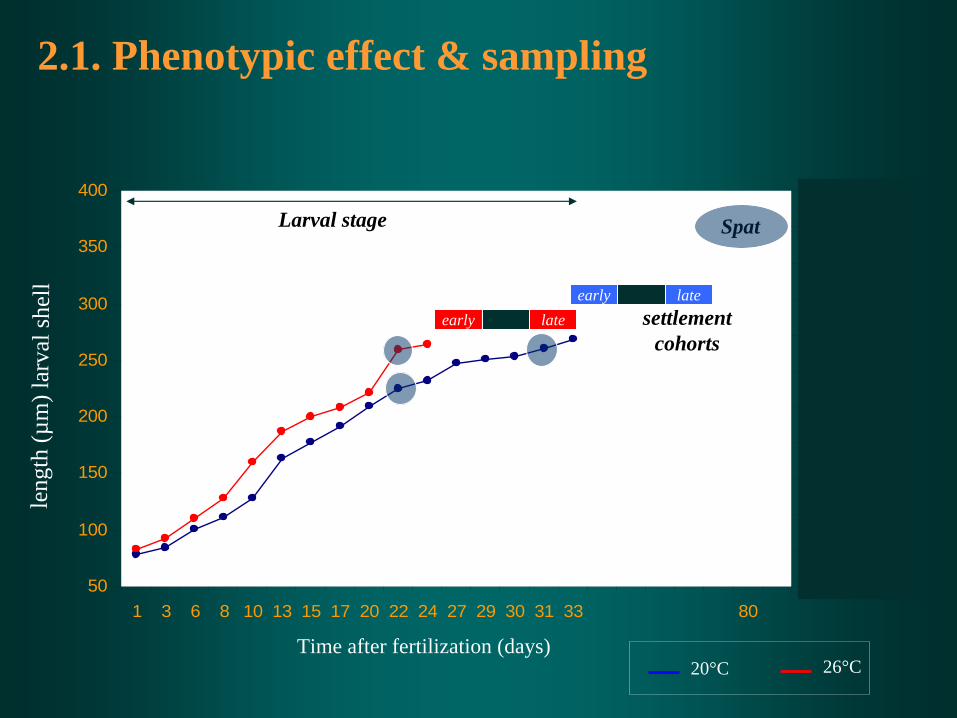
20°C 26°C
Larval stage
Time after fertilization (days)
settlement cohorts
early late
Spat
early late
2.1. Phenotypic effect & sampling
-15
-10
-5
0
5
10
15
(No
- Na)
/ 10
0
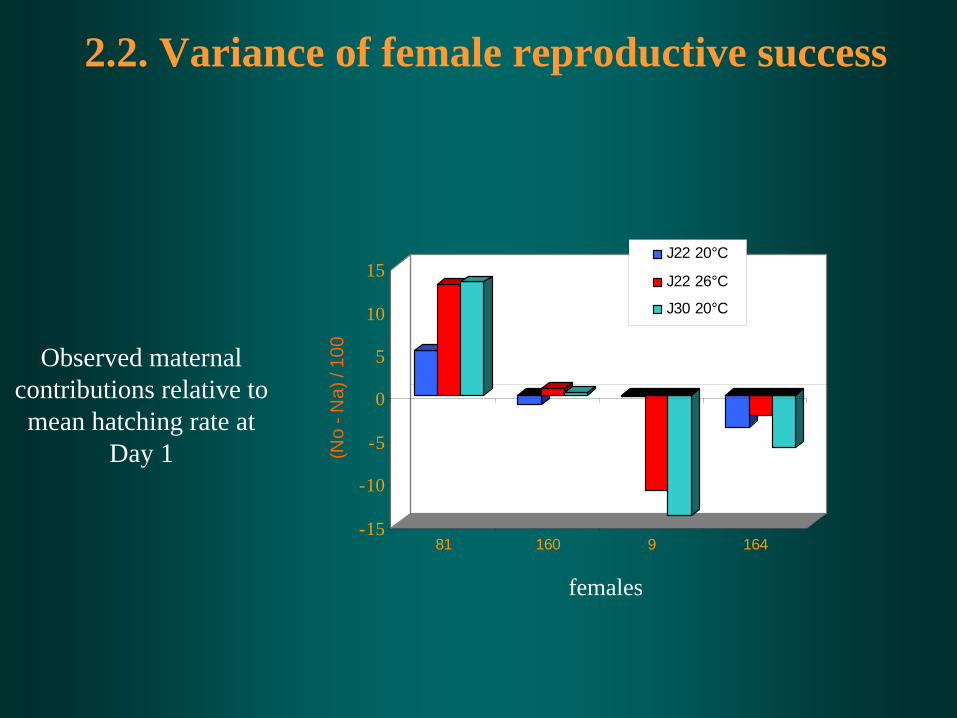
81 160 9 164
J22 20°C
J22 26°C
J30 20°C
Observed maternal contributions relative to mean hatching rate at
Day 1
females
2.2. Variance of female reproductive success
males
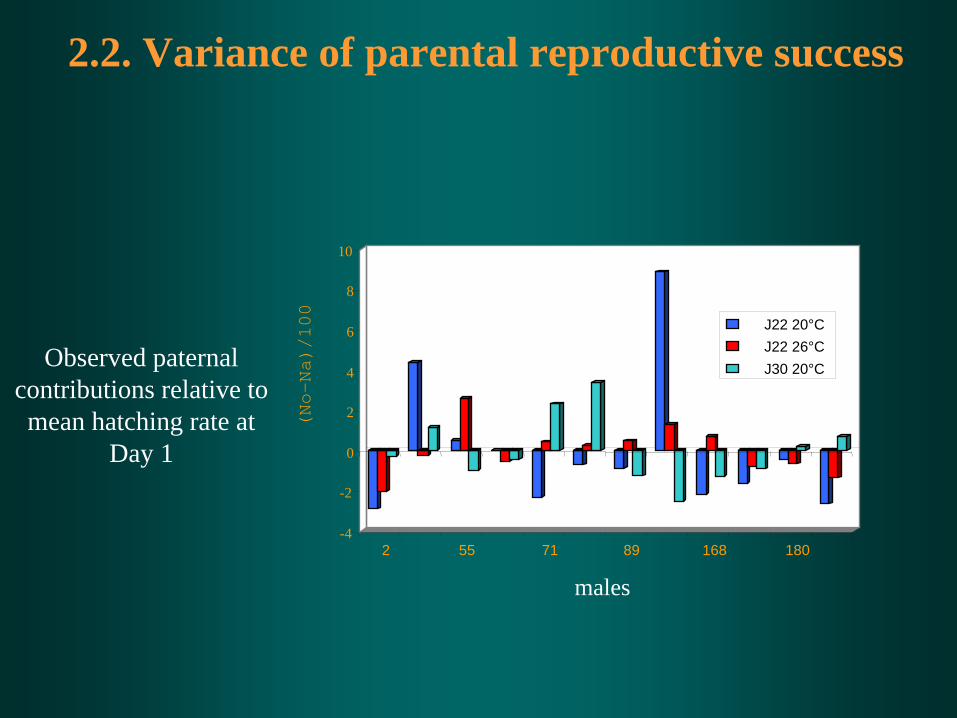
Observed paternal contributions relative to mean hatching rate at
Day 1
2.2. Variance of parental reproductive success
-4
-2
0
2
4
6
8
10
(N
o-
Na
)/
10
0
2 55 71 89 168 180
J22 20°CJ22 26°CJ30 20°C
70
90
110
130
150
170
190
210
230
250
270
1 3 6 8 10 13 15 17 20 22 24 27 29 30 31 33
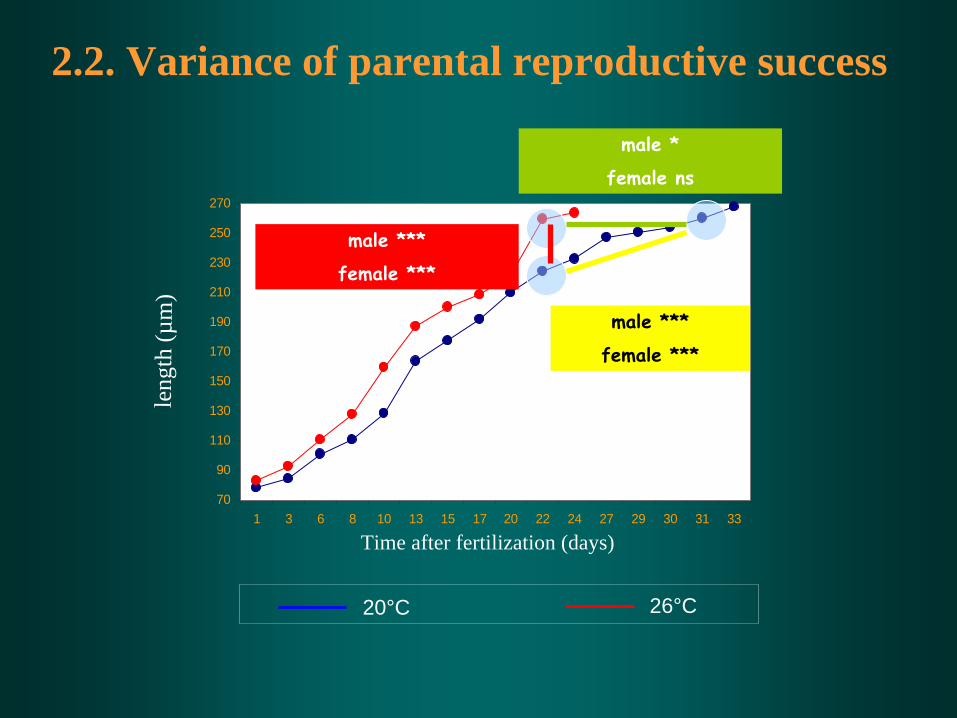
20°C 26°C
male ***
female
***
male ***
female
***
male *
female
nsle
ngth
(µm
)
Time after fertilization (days)
2.2. Variance of parental reproductive success
-10
-5
0
5
10
15
20
25
30
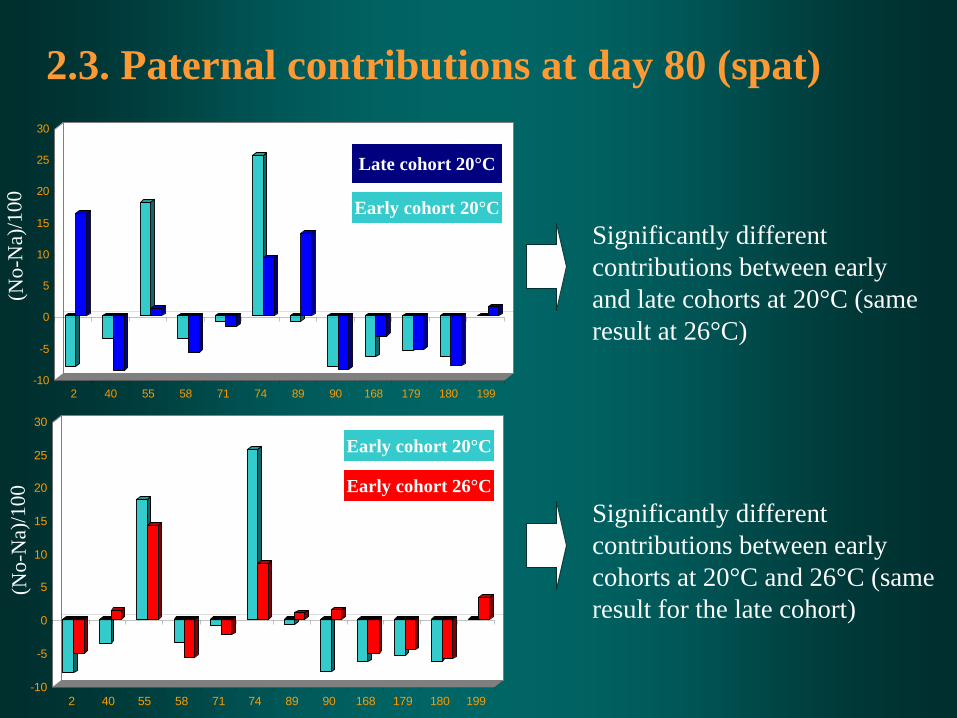
2 40 55 58 71 74 89 90 168 179 180 199
(No-
Na)
/100
Significantly different contributions between early and late cohorts at 20°C (same result at 26°C)
Late cohort 20°C
Early cohort 20°C
-10
-5
0
5
10
15
20
25
30
2 40 55 58 71 74 89 90 168 179 180 199
Early cohort 20°C
Early cohort 26°C
(No-
Na)
/100 Significantly different
contributions between early cohorts at 20°C and 26°C (same result for the late cohort)
2.3. Paternal contributions at day 80 (spat)
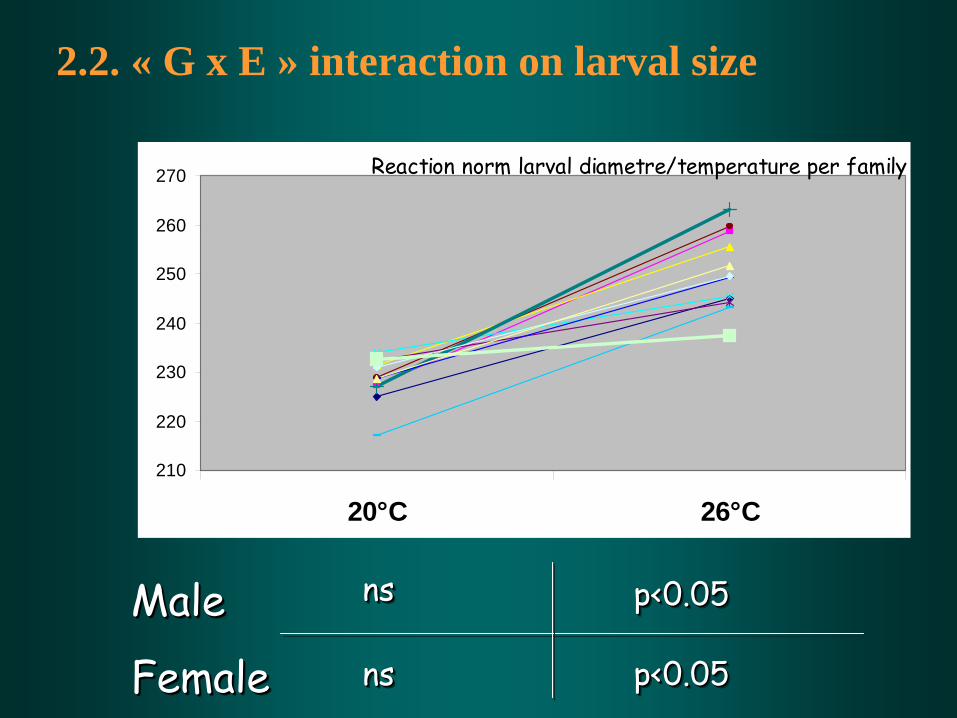
Reaction norm larval diametre/temperature per family
210
220
230
240
250
260
270
20°C 26°C
Male
Female
MaleMale
FemaleFemale
nsnsns
nsnsns
p<0.05p<0.05p<0.05
p<0.05p<0.05p<0.05
2.2. « G x E » interaction on larval size
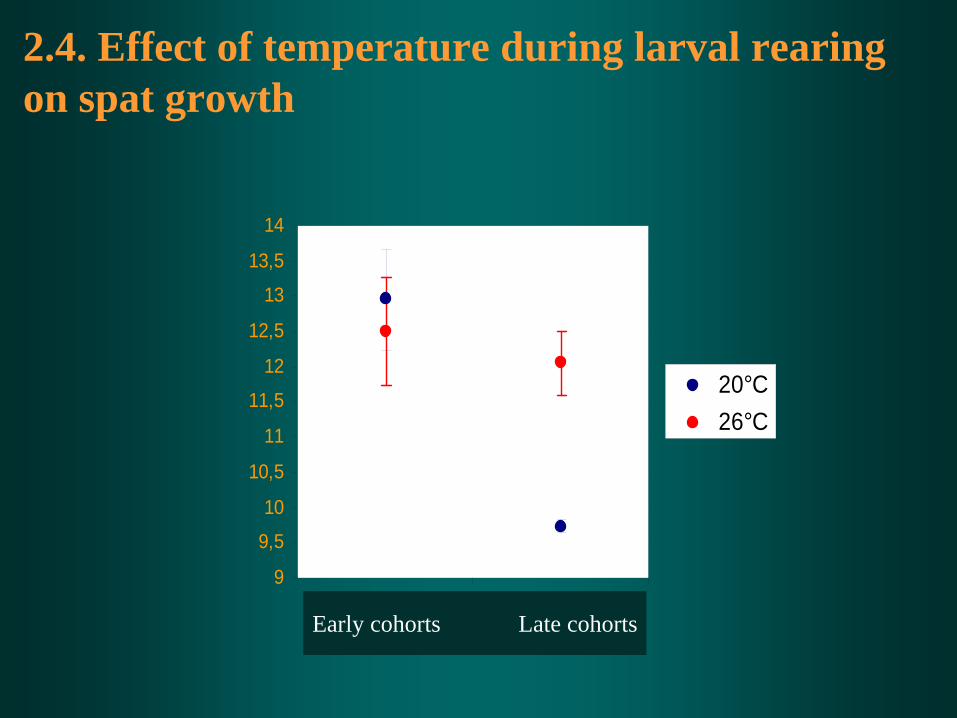
9
9,5
10
10,5
11
11,5
12
12,5
13
13,5
14
cohortes précoces cohortes tardives
20°C26°C
Early cohorts Late cohorts
2.4. Effect of temperature during larval rearing on spat growth
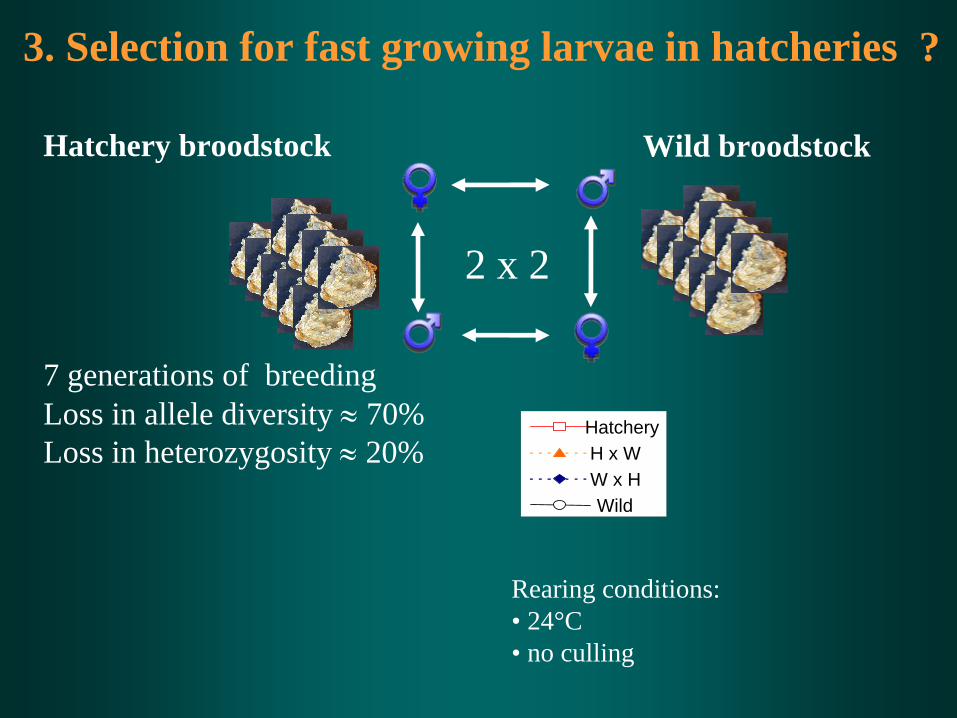
Rearing conditions: • 24°C• no culling
2 x 2
Wild broodstockHatchery broodstock
7 generations of breeding Loss in allele diversity ≈
70%
Loss in heterozygosity ≈
20%
3. Selection for fast growing larvae in hatcheries ?
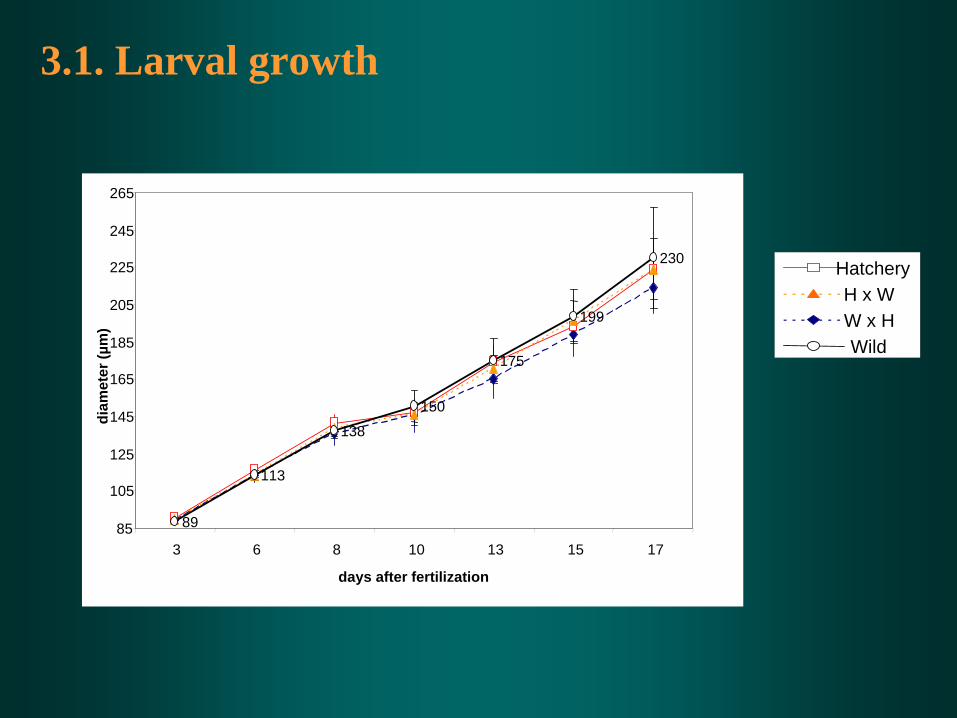
HatcheryH x WW x HWild
HatcheryH x WW x HWild
3.1. Larval growth
89
113
138
150
175
199
230
85
105
125
145
165
185
205
225
245
265
3 6 8 10 13 15 17
days
after
fertilization
diam
eter
(µm
)
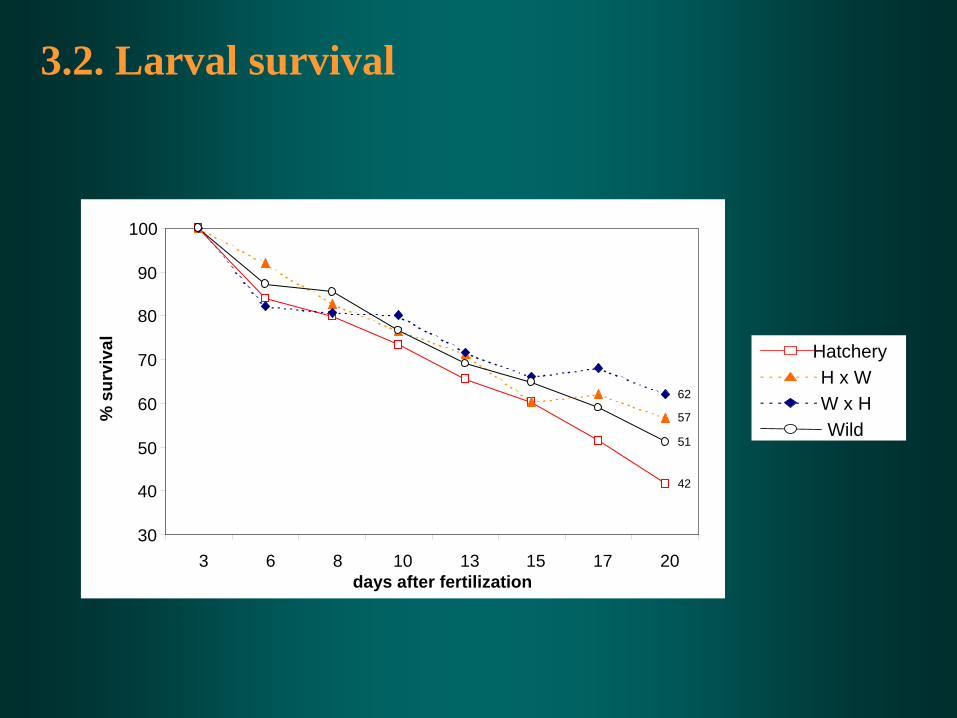
HatcheryH x WW x HWild
3.2. Larval survival
42
57
62
51
30
40
50
60
70
80
90
100
3 6 8 10 13 15 17 20days
after
fertilization
% s
urvi
val
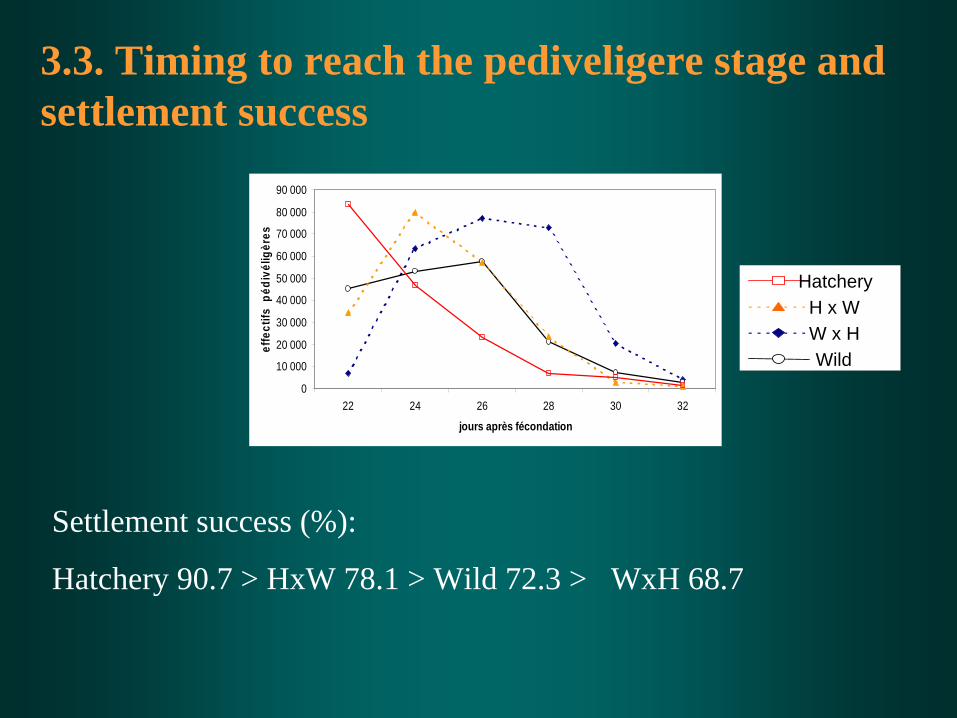
Settlement success (%):
Hatchery 90.7 > HxW 78.1 > Wild 72.3 > WxH 68.7
0
10 000
20 000
30 000
40 000
50 000
60 000
70 000
80 000
90 000
22 24 26 28 30 32
jours après fécondation
effe
ctifs
péd
ivél
igèr
esHatchery
H x WW x HWild
3.3. Timing to reach the pediveligere stage and settlement success
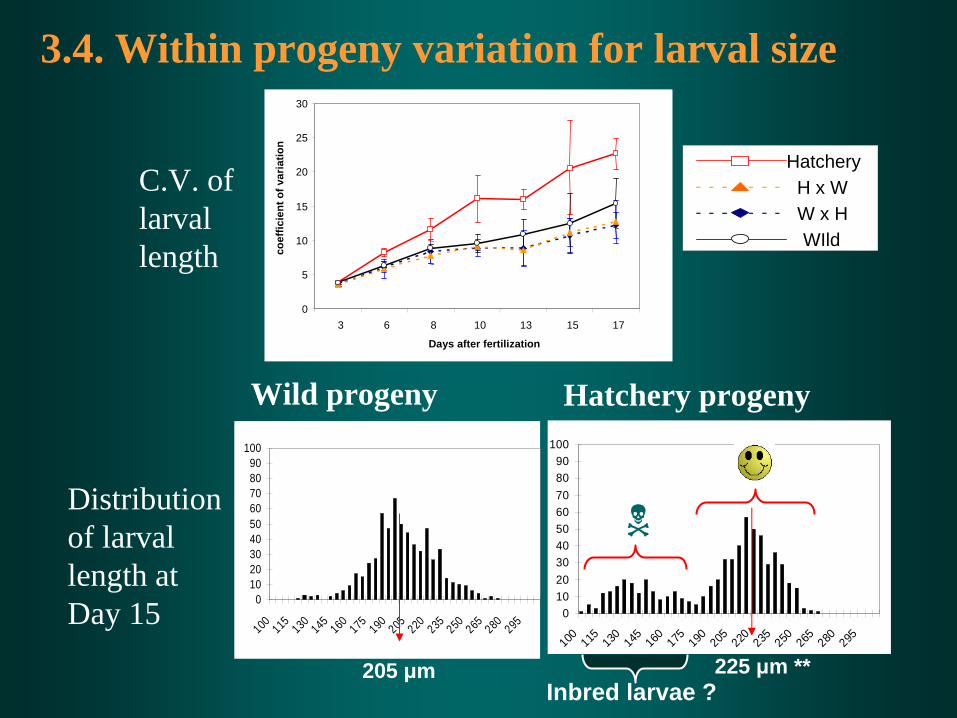
C.V. of larval length
0102030405060708090
100
100 115 130 145 160 175 190 205 220 235 250 265 280 295
Wild progeny
Inbred
larvae
?
0102030405060708090
100
100 115 130
145
160 175 190
205
220 235 250
265
280
295
205 μm 225 μm **
Hatchery progeny
Distribution of larval length at Day 15
3.4. Within progeny variation for larval size
HatcheryH x WW x HWIld
0
5
10
15
20
25
30
3 6 8 10 13 15 17
Days
after
fertilization
coef
ficie
ntof
var
iatio
n
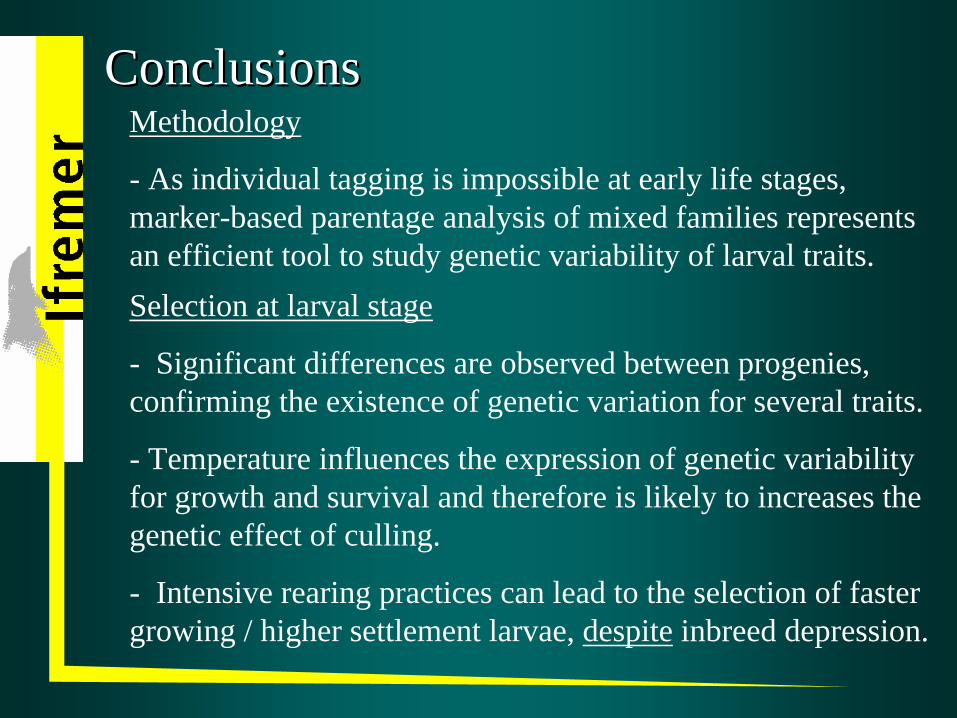
ConclusionsConclusionsMethodology
- As individual tagging is impossible at early life stages, marker-based parentage analysis of mixed families represents an efficient tool to study genetic variability of larval traits.Selection at larval stage
- Significant differences are observed between progenies, confirming the existence of genetic variation for several traits.
- Temperature influences the expression of genetic variability for growth and survival and therefore is likely to increases the genetic effect of culling.
- Intensive rearing practices can lead to the selection of faster growing / higher settlement larvae, despite inbreed depression.
Thanks
Recommended


![[PPT]Selective Breeding - Killeen Independent School · Web viewDomestication and Selective Breeding Domestication is the process whereby a population of animals or plants, through](https://img.pdfslide.us/doc/110x75/5aacf0387f8b9aa9488da60c/pptselective-breeding-killeen-independent-school-viewdomestication-and-selective.jpg)