WCGALPWCGALP 11TH
World Congress on Genetics applied to Livestock Production
February 11 -16 | Auckland, New Zealand
Genetic analysis of heat tolerance for production and health traits in US Holstein cows
A. Sigdel1, I. Aguilar2, R. Abdollahi-Arpanahi1,3 and F. Peñagaricano1
1Department of Animal Sciences, University of Florida, USA2Instituto Nacional de Investigación Agropecuaria, Uruguay
3Department of Animal and Poultry Science, University of Tehran, Iran
www.wcgalp.com

Introduction
Cows are most efficient at 40 to 70 0F
Daily temperature above 85 0F leads to heat stress in dairy cows
High temperature and high humidity has profound effects on dairy cows
-
reduces DMI-
decreases milk yield
-
depresses fertility
-
increases incidence of health disorders

Introduction
Temperature-humidity index (THI) determines heat stress potential in dairy cattle
Derived by an equation from RH and air temperature for a particular dayTHI (t, rh) = (1.8 x t oc+ 32) – (0.55 -0.0055 X rh) x (1.8 x t o
c – 26)Minimum heat stress threshold of 68
for high producing dairy cows ( ≥
35 kg/day)

Heat Stress in the United States
Annual loss to American Dairy Industry is $897 MILLION to $1,500
MILLION !St-Pierre et al., 2003 J. Dairy Sci. E52-E77

Heat Stress Management
Different cooling and nutritional strategies are used to alleviate effects of heat stress
However, production continues to decline during summer
Identifying
heat tolerant cows and understanding biological mechanism of thermotolerance is critical fordeveloping novel approach
Breeding for thermotolerance is permanent, cumulative and cost effective approach

Objectives
Estimate genetic components of milk yield (MY) and somatic cell score (SCS) across lactations considering heat stress
Identify and characterize genomic regions, and preferably individual genes and pathways responsible for heat tolerance in MY and SCS

Modeling Heat Stress
Aim: identify animals that under heat stress conditions show either none or low rates of performance decline
or delayed onset of performance decline
THI
Per
form
ance
Cow 1
Cow 2
Cow 3
THI
Per
form
ance
Cow 1
Cow 2Cow 3
different rates of performance decline differences on the onset of decline
Source: I. Misztall and collaborators (2000)

Materials and Methods
Phenotype
Genotype: 6k animals (1592 sires + 4770 cows) (60k SNP across the genome)
Pedigree : 31k animals ( A 5-generation pedigree from CDCB)
Merge Test day records with weather records: mean daily THI of 3 days prior
the test day (Bohmanova et al. (2007) )

Statistical Model
Statistical Analysis

GWAS and Gene set analysis
1.
assignment of SNPs to genes
criteria: SNP within the gene or at most 15kb either upstream/downstream the
gene
2.
assignment of genes to functional categories
databases: Gene Ontology, Medical Subject Headings (MeSH)
3.
association analysis between each functional term and the phenotype of
interest based on Fisher's exact test
ssGWAS: Genetic
variance
explained
by
2.0Mb
window
of
adjacent
SNPs
Gene set analysis

Results and Discussion
Variance component estimates
GWAS
Gene set analysis

MILK YIELD (MY)
Parameters Parity1 Parity2 Parity3σ2
a 9.26 10.03 10.55
100σ2v
0.94 1.56 1.6210σa.v
-1.21 -1.17 -2.31h2
f(10) 0.32 0.24 0.17
rG
(a,v) -0.41 -0.30 -0.55
Cor-ht(par1,parj) 0.78 0.65Cor-ht(par2,parj) 0.61
Cor-gen(par1,parj) 0.82 0.85Cor-gen(par2,parj) 0.92

MILK YIELD (MY)
Lac. 1
Lac. 2
Lac. 3
DGAT1
DGAT1
DGAT1
GHR
GHR
GHR
HSF1
HSF1
MAPK8IP1, PEX16
MAPK8IP1, PEX16
MAPK8IP1, PEX16

MILK YIELD (MY)
GO ID GO TERM No. of Genes
No. of Sig. Genes
P_value
GO:0034605 cellular response to heat 15 3 0.003GO:0009266 response to temperature stimulus 33 3 0.027GO:0080135 cellular response to stress 96 5 0.043GO:2001020 response to DNA damage stimulus 35 3 0.032GO:0050848 calcium-mediated signaling 15 3 0.003GO:0048016 Inositol
phosphate mediated signaling14 2 0.030
GO:0009065 glutamine family amino acid catabolic process
9 2 0.013
MeSH ID MeSH TermD018869 Heat-Shock Response 9 2 0.015D050886 HSP20 Heat-Shock Proteins 2 1 0.004D005982 Glutathione Transferase 50 4 0.002D054732 Calcium-Calmodulin-Dependent Protein
Kinase Type 213 2 0.002
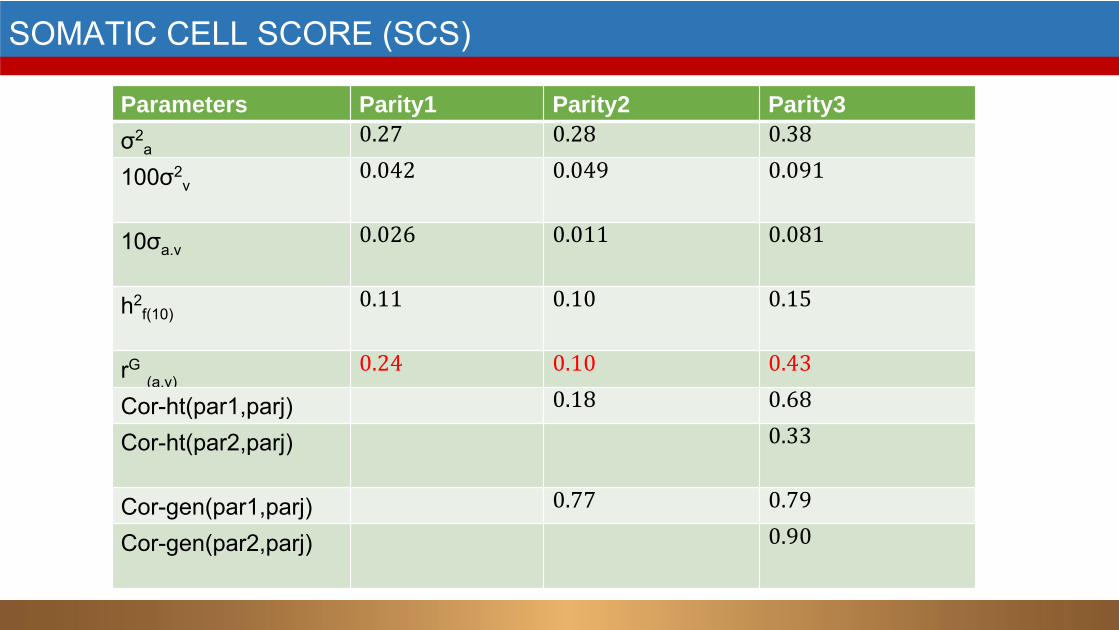
SOMATIC CELL SCORE (SCS)
Parameters Parity1 Parity2 Parity3σ2
a 0.27 0.28 0.38
100σ2v
0.042 0.049 0.09110σa.v
0.026 0.011 0.081h2
f(10) 0.11 0.10 0.15
rG
(a,v) 0.24 0.10 0.43
Cor-ht(par1,parj) 0.18 0.68Cor-ht(par2,parj) 0.33Cor-gen(par1,parj) 0.77 0.79Cor-gen(par2,parj) 0.90

SOMATIC CELL SCORE (SCS)
GC, NPFFR2
GC, NPFFR2
GC, NPFFR2
Lac. 1
Lac. 2
Lac. 3
DLX1, DLX2
DLX1, DLX2
STAT5A, STAT5B, CCR10
BoLA, CNPY3
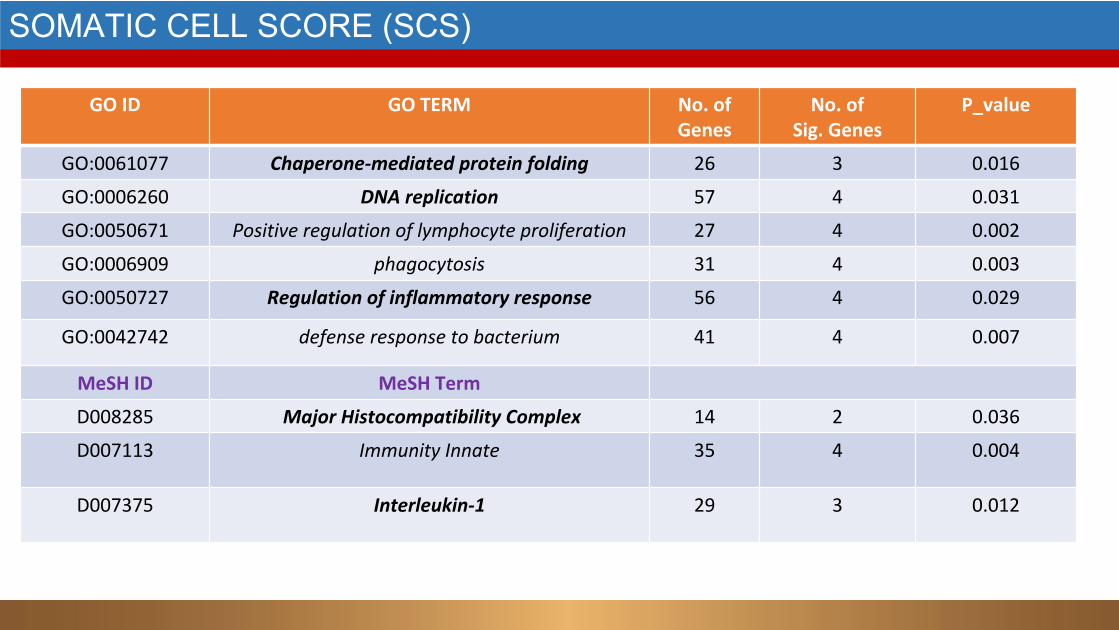
SOMATIC CELL SCORE (SCS)
GO ID GO TERM No. of Genes
No. of
Sig. GenesP_value
GO:0061077 Chaperone-mediated protein folding 26 3 0.016
GO:0006260 DNA replication 57 4 0.031
GO:0050671 Positive regulation of lymphocyte proliferation 27 4 0.002
GO:0006909 phagocytosis 31 4 0.003
GO:0050727 Regulation of inflammatory response 56 4 0.029
GO:0042742 defense response to bacterium 41 4 0.007
MeSH ID MeSH Term
D008285 Major Histocompatibility Complex 14 2 0.036
D007113 Immunity Innate 35 4 0.004
D007375 Interleukin-1 29 3 0.012
Conclusions
•
Reinforces the idea that relationship of production with thermotolerance is
antagonistic
•
Continued selection for general merit will result in greater susceptibility to heat
stress
•
GWAS and Gene set analysis: list of putative candidate regions and genes with
known roles in general merit and heat tolerance identified
Acknowledgments
Fernanda Rezende, Rocío Amorín, Julio Agustin
Department of Animal Sciences, UF
Thank you for your attention !
Recommended