Genesis, Morphology, and Classification of Mounded Soils in Eastern Oklahoma1
F. P. ALLGOOD AND FENTON GRAY2
ABSTRACT
Numerous small mounds are unique features of landscapesthat extend from the southern part of Missouri to the coast ofTexas. Many hectares of eastern Oklahoma are included in thisvast area. The mounds occur in densities of 8 to 16/ha.
These mounds were studied with special emphasis on thegenesis, morphology, and classification of associated soil pedons.Laboratory measurements included particle size distributions,bulk density, extractable cations, and organic matter ex-tractions.
Soil morphological features and laboratory analyses indicatedthat the development of the mounded soils differs from that ofthe associated intermound pedons by being highly altered bythe many organisms of the landscape that assemble in theselected elevated soil to escape seasonal wet soil conditions.
Mounded soils of Site I are classified as Aquic Paleudolls orAquic Argiudolls in the present system of soil classification(12). But most of the mounded soils which were studied wouldbe better classified with a vermic modifier.
Additional Index Words: Verma, Mima, Faleudoll, Haplu-dalf, Argiudoll.
NUMEROUS SMALL MOUNDS are unique features of land-scapes that extend over many hectares in eastern
Oklahoma. This is part of a vast area containing moundsthat extend from the southern part of Missouri to the coastof Texas. They occur in densities of 8 to 16/ha averagingabout 15 m in diameter and nearly 1 m in height and oc-cupy a volume of 75 to 100 m3. Representative moundedand intermound soils were investigated in east central Ok-lahoma (F. P. Allgood, 1972. Genesis and morphology ofmounded soils. M.S. Thesis. Oklahoma State University,Stillwater. It contains an extensive literature review). Theobjectives of this study were to relate the soil forming fac-tors and processes to the soil properties of mounded and
ALLGOOD & GRAY: MOUNDED SOILS IN EASTERN OKLAHOMA
97 102
747
LEGEND
WEST BOUNDARY OF — - - — —MOUNDED SOILS INOKLAHOMA. . . . . . . . .
NORMAL ANNUAL TOTALPRECIPITATION. .PP!....
S I T E - I STUDY AREA •
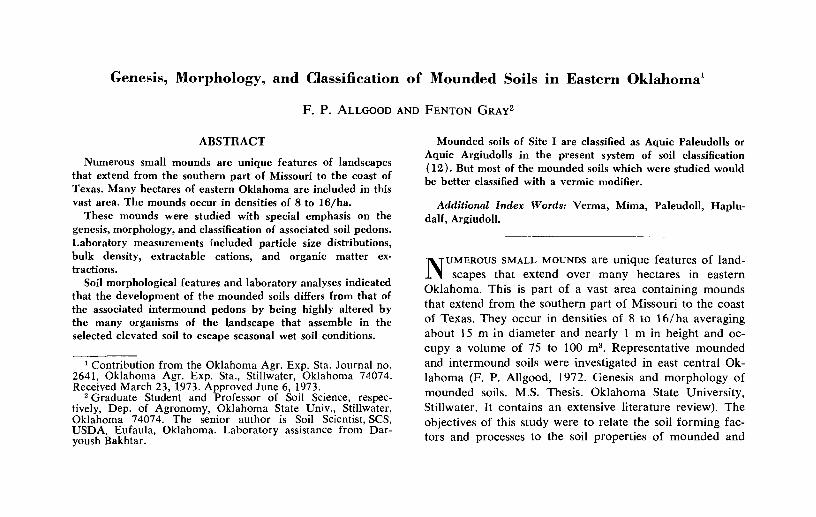
Fig. 1—Map showing mounded soil area relative to annual rainfall and location of study area.
intermound soils and to classify these soils accurately bya soil taxonomy system. The present mapping units ofmounded phases do not adequately describe these soils.
A companion paper will report the ecological relation-ships to the construction of these unique, small "verma"mounds.
Special attributes of the mounded soils in eastern Okla-homa may accommodate more specialized cropping thanthe associated intermound soils and should, therefore, becorrectly classified and mapped, thus, enhancing the inter-pretations for suitability potentials for both agricultural andengineering uses of these soils.
GEOGRAPHY OF THE STUDY AREAS
The field study of these unique mounds was conducted inMuskogee and Mclntosh Counties in Oklahoma (Fig. 1). Theelevation is approximately 180 ms above sea level. A mound ina 5.2 ha meadow in the southern part of Muskogee County wasused as the nucleus of the study and is referred to as Site I.
Relief—Common slopes associated with landscapes contain-ing mounds range from nearly level to gently sloping. Only oc-casionally are landscapes with slopes greater than 5% found tocontain mounds.
The general slope associated with Site I is nearly level. Run-off is medium to slow with no discernable drainage pattern.
Geology—Rocks that lie below the regolith in the landscapeof Site I are of the Boggy unit of the Des Moines series of thePennsylvanian geological system. The Boggy formation aver-ages about 150 m (500 feet) thick in the general area. It con-sists of medium grained, tan to brownish sandstone, siltstone,and gray to dark gray shale (1) (R. A. Meeks, 1957. The geol-ogy of the Onapa-Council Hill area, Muskogee and MclntoshCounties, Oklahoma. M.S. Thesis. Oklahoma University, Nor-man) Everett R. Neff, 1961. Surface geology of MclntoshCounty, Oklahoma. M.S. Thesis. University of Oklahoma, Nor-man.). Shale is encountered beneath the soil solum of Site I.
Climate—A. temperate, continental, moist, subhumid type ofclimate prevails in the area where the mounded soils were stud-ied (This is transitional to humid which prevails to the east.Described by Stanley G. Holbrook, State Climatologist of USDep. of Commerce Weather Bureau in Okmulgee County, SoilSurvey, 1968). The mean annual precipitation is 105.51 cmwith a mean annual temperature of 16.6C.
The mounds in Oklahoma are closely associated with the 102cm plus rainfall belt (Fig. 1). The soils of the intermound areasof Site I are saturated with water during the spring of each year.
As indicated by the degree of soil mottlings, the mounded soilsare not commonly saturated in the upper fringes of the mollicepipedon. The Thornthwaite annual P-E index is about 68 forthe location.
Plants—Soils occurring in the study area developed under acover of herbaceous plants consisting mostly of tall grasses. Thesmall upland streams that form the drainage system of the up-land prairies are generally surrounded by trees. Rough brokenareas that lie within 5 to 10 km are also forested with decidu-ous trees. Vegetation measurements were made of Site I whichshowed a greater production of forage on the mounds than onthe intermound soils.
Time—The elapse of time pertaining to soil weathering inthe mound and intermound pedons is considered a constant fac-tor. Knechtel (4) placed the age of the surface containingmounds in the associated region to be no older than late Pleis-tocene. However, enough time has evolved to permit the devel-opment of soils with strong horizonations. These well-developedB2t horizons indicate that soil materials have been subjected toleaching and weathering for a considerable length of time.
METHODS AND PROCEDURES
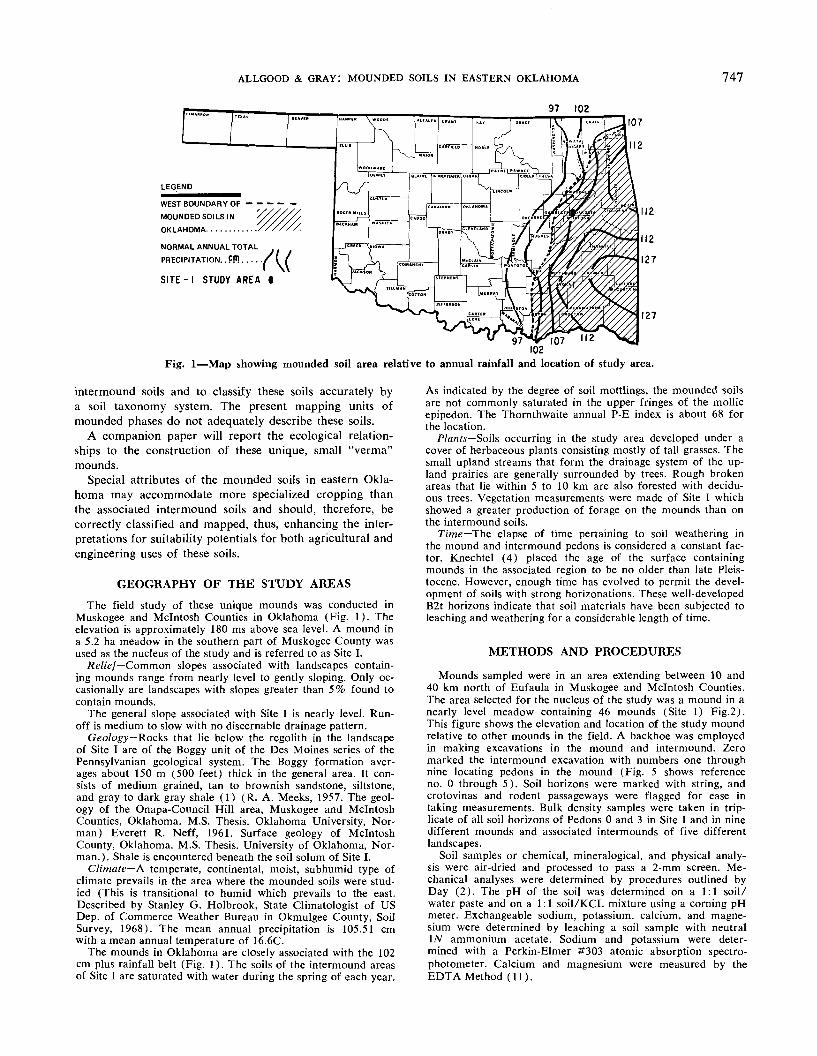
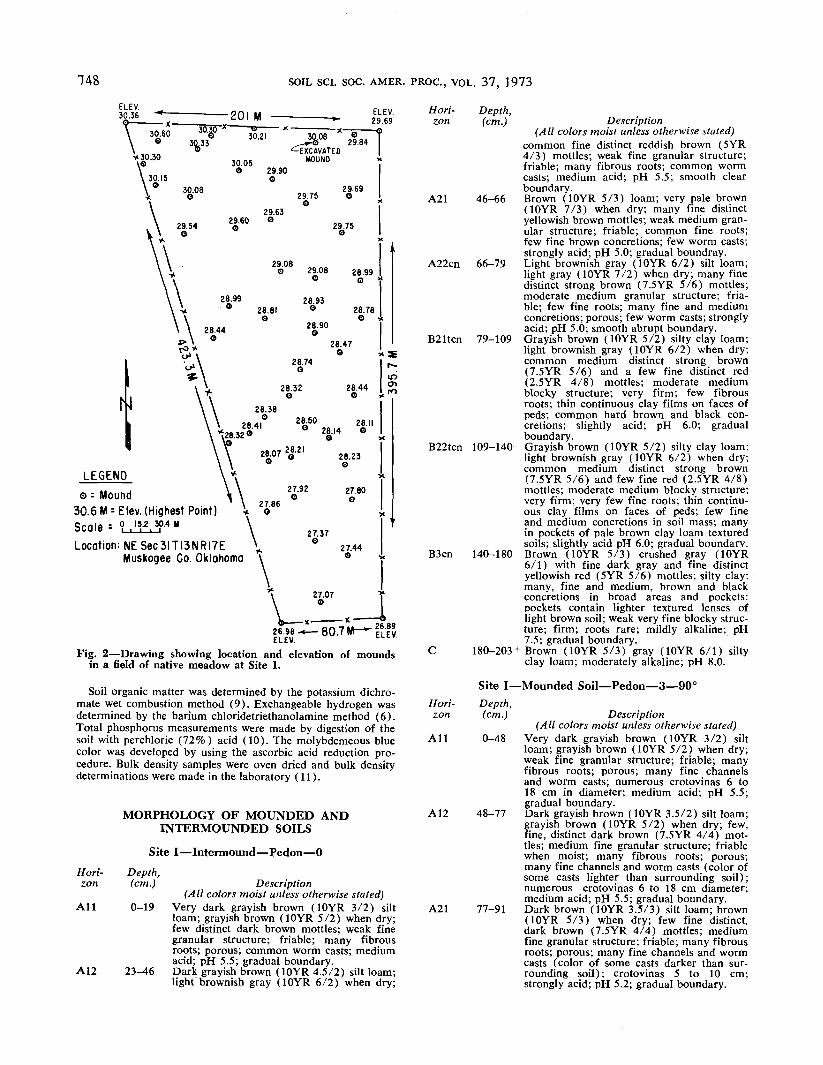
Mounds sampled were in an area extending between 10 and40 km north of Eufaula in Muskogee and Mclntosh Counties.The area selected for the nucleus of the study was a mound in anearly level meadow containing 46 mounds (Site I) Fig.2).This figure shows the elevation and location of the study moundrelative to other mounds in the field. A backhoe was employedin making excavations in the mound and intermound. Zeromarked the intermound excavation with numbers one throughnine locating pedons in the mound (Fig. 5 shows referenceno. 0 through 5). Soil horizons were marked with string, andcrotovinas and rodent passageways were flagged for ease intaking measurements. Bulk density samples were taken in trip-licate of all soil horizons of Pedons 0 and 3 in Site I and in ninedifferent mounds and associated intermounds of five differentlandscapes.
Soil samples or chemical, mineralogical, and physical analy-sis were air-dried and processed to pass a 2-mm screen. Me-chanical analyses were determined by procedures outlined byDay (2). The pH of the soil was determined on a 1:1 soil/water paste and on a 1:1 soil/KCL mixture using a corning pHmeter. Exchangeable sodium, potassium, calcium, and magne-sium were determined by leaching a soil sample with neutralIN ammonium acetate. Sodium and potassium were deter-mined with a Perkin-Elmer #303 atomic absorption spectro-photometer. Calcium and magnesium were measured by theEDTA Method (11).
148 SOIL SCI. SOC. AMER. PROC., VOL. 37, 1973
Hori-zon
Depth,(cm.)
oo: Mound
30.6 M = Elev. (Highest Point)Scale = 9. l!!-2.*>-4" \Location: NESec3ITI3NRI7E \
Muskogee Co. Oklahoma
27.3727.44o
27.07e
26.98—80.7 M-^ELEV.
Fig. 2—Drawing showing location and elevation of moundsin a field of native meadow at Site 1.
Soil organic matter was determined by the potassium dichro-mate wet combustion method (9). Exchangeable hydrogen wasdetermined by the barium chloridetriethanolamine method (6).Total phosphorus measurements were made by digestion of thesoil with perchloric (72%) acid (10). The molybdemeous bluecolor was developed by using the ascorbic acid reduction pro-cedure. Bulk density samples were oven dried and bulk densitydeterminations were made in the laboratory (11).
MORPHOLOGY OF MOUNDED ANDINTERMOUNDED SOILS
Site I—Intermound—Pedon—0Hori-zon
All
A12
Depth,(cm.)
0-19
23-46
Description(All colors moist unless otherwise stated)
Very dark grayish brown (10YR 3/2) siltloam; grayish brown (10YR 5/2) when dry;few distinct dark brown mottles; weak finegranular structure; friable; many fibrousroots; porous; common worm casts; mediumacid; pH 5.5; gradual boundary.Dark grayish brown (10YR 4.5/2) silt loam;light brownish gray (10YR 6/2) when dry;
Description(All colors moist unless otherwise stated)
common fine distinct reddish brown (SYR4/3) mottles; weak fine granular structure;friable; many fibrous roots; common wormcasts; medium acid; pH 5.5; smooth clearboundary.
A21 46-66 Brown (10YR 5/3) loam; very pale brown(10YR 7/3) when dry; many fine distinctyellowish brown mottles; weak medium gran-ular structure; friable; common fine roots;few fine brown concretions; few worm casts;strongly acid; pH 5.0; gradual boundray.
A22cn 66-79 Light brownish gray (10YR 6/2) silt loam;light gray (10YR 7/2) when dry; many finedistinct strong brown (7.5YR 5/6) mottles;moderate medium granular structure; fria-ble; few fine roots; many fine and mediumconcretions; porous; few worm casts; stronglyacid; pH 5.0; smooth abrupt boundary.
B21tcn 79-109 Grayish brown (10YR 5/2) silty clay loam;light brownish gray (10YR 6/2) when dry;common medium distinct strong brown(7.5YR 5/6) and a few fine distinct red(2.SYR 4/8) mottles; moderate mediumblocky structure; very firm; few fibrousroots; thin continuous clay films on faces ofpeds; common hard brown and black con-cretions; slightly acid; pH 6.0; gradualboundary.
B22tcn 109-140 Grayish brown (10YR 5/2) silty clay loam;light brownish gray (10YR 6/2) when dry;common medium distinct strong brown(7.5YR 5/6) and few fine red (2.5YR 4/8)mottles; moderate medium blocky structure;very firm; very few fine roots; thin continu-ous clay films on faces of peds; few fineand medium concretions in soil mass; manyin pockets of pale brown clay loam texturedsoils; slightly acid pH 6.0; gradual boundary.
B3cn 140-180 Brown (10YR 5/3) crushed gray (10YR6/1) with fine dark gray and fine distinctyellowish red (SYR 5/6) mottles; silty clay:many, fine and medium, brown and blackconcretions in broad areas and pockets:pockets contain lighter textured lenses oflight brown soil; weak very fine blocky struc-ture; firm; roots rare; mildly alkaline; pH7.5; gradual boundary.
C 180-203+ Brown (10YR 5/3) gray (10YR 6/1) siltyclay loam; moderately alkaline; pH 8.0.
Site I—Mounded Soil—Pedon—3—90°Hori- Depth,zon (cm.) Description
(All colors moist unless otherwise stated)All 0-48 Very dark grayish brown (10YR 3/2) silt
loam; grayish brown (10YR 5/2) when dry;weak fine granular structure; friable; manyfibrous roots; porous; many fine channelsand worm casts; numerous crotovinas 6 to18 cm in diameter; medium acid; pH 5.5;gradual boundary.
A12 48-77 Dark grayish brown (10YR 3.5/2) silt loam;grayish brown (10YR 5/2) when dry; few,fine, distinct dark brown (7.5YR 4/4) mot-tles; medium fine granular structure; friablewhen moist; many fibrous roots; porous;many fine channels and worm casts (color ofsome casts lighter than surrounding soil);numerous crotovinas 6 to 18 cm diameter;medium acid; pH 5.5; gradual boundary.
A21 77-91 Dark brown (10YR 3.5/3) silt loam; brown(10YR 5/3) when dry; few fine distinct,dark brown (7.SYR 4/4) mottles; mediumfine granular structure; friable; many fibrousroots; porous; many fine channels and wormcasts (color of some casts darker than sur-rounding soil); crotovinas 5 to 10 cm;strongly acid; pH 5.2; gradual boundary.
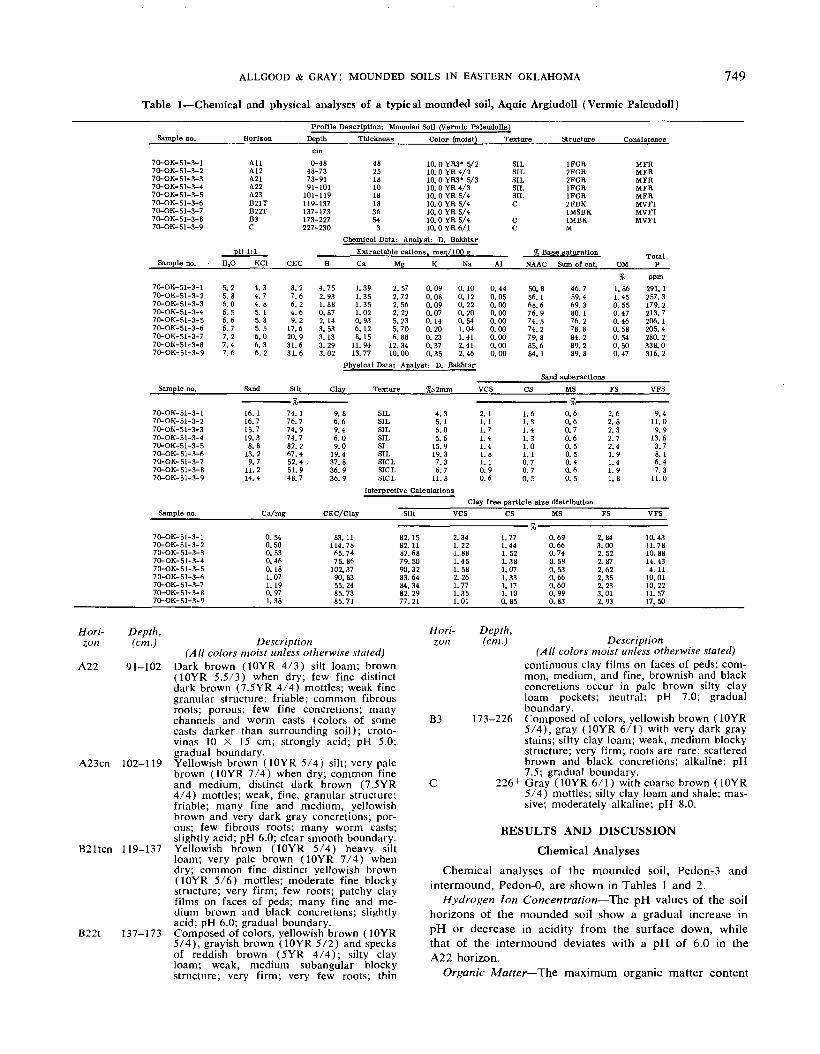
ALLGOOD & GRAY: MOUNDED SOILS IN EASTERN OKLAHOMA 749
Table 1—Chemical and physical analyses of a typical mounded soil, Aquic Argiudoll (Vermic Paleudoll)
Profile Description: Mounded Soli (VeSample no.
70-OK-51-3-170-OK-51-3-270-OK-51-3-370-OK-51-3-470-OK-51-3-570-OK-51-3-670-OK-S1-3-770-OK-51-3-870-OK-51-3-9
Sample no.
70-OK- 51-3-170-OK-51-3-2 .70-OK-51-3-370-OK-51-3-470-OK-51-3-570-OK-51-3-670-OK-51-3-770-OK-51-3-870-OK-51-3-9
Horizon
pHH20
5.25.86.06.56.66.77.27.47.6
AHA12A21A 22A 23B21TB22TB3C
111KC1
4.34.74.85. 15.35.56.06.36.2
Depth Thickness Colorrmlc Paleudolls)(moist)
cm
0-48 48 10. 0 YR3« 5/248-73 25 10. 0 YR 4/273-91 18 10.0YR3*5/391-101 10 10.0YR4/3
101-119 18 10.0YR5/4119-137 18 10.0 YR 5/4137-173 36 10.0YR5/4173-227 54 IO.OYR5/4227-230 3 10.0YR6/1
Chemical Data: Analyst: D. Bakhtar
Texture
SILSILSILSILSILC
CC
Extractable cations, meq/100 KCEC
8.27.66.24.69.2
17.620.931.631.6
H
4.752.931.880.872.143.533.133.293.02
Ca
1.391.351.351.020.936.128.15
11.9413.77
Mg
2.572.722.562.225.235.706.88
12.3410.00
K
0.090.080.090.070.140.200.230.370.35
Na
0.100.120.220.200.541.041.412.412.46
Al
0.440.050.000.000.000.000.000.000.00
Structure
1FGR2FGR2FGR1FGR1FGR2FBK1MSBK1MBKM
Consistence
MFRMFRMFRMFRMFRMVFIMVFIMVFI
% Base saturationNAAC
50.856.168.676.974.574.279.885.684.1
Sum of cat.
46.759.469.380. 176.278.884.289.289.8
OM
%1.861.450.550.470.460.580.540.500.47
Totalp
ppm291.1257.3179.2213.7206.1205.4280.2338.0316.2
Physical Data: Analyst; D. BakhtarSand suberactlons
Sample no.
70-OK-51-3-170-OK-51-3-270-OK-51-3-370-OK-51-3-470-OK-51-3-570-OK-51-3-670-OK-51-3-770-OK-51-3-870-OK-51-3-9
Sand
16.116.715.719.38.8
13.29.7
11.214.4
Silt
74.176.774.974.782.267.452. 4 ..51.948.7
Clay
9.86.69.46.09.0
19.437.836.936.9
Texture
SILSILSILSILSISILSICLSICLSICL
%>2mm
4.35.16.05.6
15.919.37.36.7
11.8
VCS
2.11. 11.71.41.41.81.10.90.6
CS
1.61.31.41.31.01.10.70.70.5
MSn7
0.60.60.70.60.50.50.40.60.5
FS
2.62.82.32.72.41.91.41.91.8
VFS
9.411.09.9
13.63.78. 16.47.3
11.0Interpretive Calculations
Clay free particle size distribution
Hori-zon
Sample no.
70-OK-51-3-170-OK-51-3-270-OK-51-3-370-OK-51-3-470-OK-51-3-570-OK-51-3-670-OK-51-3-770-OK-51-3-870-OK-51-3-9
Depth,(cm.)
Ca/mg
0.540.500.530.460.181.071.190.971.38
Description
CEC/Clay
83.11114.7865.7475.86
102.3790.8355.2485.7385.71
Slit
82.1582.1182.6879.5090.3283.6484.3482.2977.21
VCS
2.341.221.881.451.582.261.771.351.01
Hori-zon
cs
1.771.441.521.381.071.331.171. 100.85
Depth,(cm.)
MS
0.690.660.740.590.530.660.600.990.83
FS
2.843.002.522.872.622.352.233.012.93
VFS
10.4311.7810.8814.434.11
10.0110.2211.5717.50
Description(All colors moist unless otherwise stated)
A22 91-102 Dark brown (10YR 4/3) silt loam; brown(10YR 5.5/3) when dry; few fine distinctdark brown (7.SYR 4/4) mottles; weak finegranular structure; friable; common fibrousroots; porous; few fine concretions; manychannels and worm casts (colors of somecasts darker than surrounding soil); croto-vinas 10 X 15 cm; strongly acid; pH 5.0;gradual boundary.
A23cn 102-119 Yellowish brown (10YR 5/4) silt; very palebrown (10YR 7/4) when dry; common fineand medium, distinct dark brown (7.SYR4/4) mottles; weak, fine, granular structure;friable; many fine and medium, yellowishbrown and very dark gray concretions; por-ous; few fibrous roots; many worm casts;slightly acid; pH 6.0; clear smooth boundary.
B21tcn 119-137 Yellowish brown (10YR 5/4) heavy siltloam; very pale brown (10YR 7/4) whendry; common fine distinct yellowish brown(10YR 5/6) mottles; moderate fine blockystructure; very firm; few roots; patchy clayfilms on faces of peds; many fine and me-dium brown and black concretions; slightlyacid; pH 6.0; gradual boundary.
B22t 137-173 Composed of colors, yellowish brown (10YR5/4), grayish brown (10YR 5/2) and specksof reddish brown (SYR 4/4); silty clayloam; weak, medium subangular blockystructure; very firm; very few roots; thin
continuous clay films on faces of peds; com-mon, medium, and fine, brownish and blackconcretions occur in pale brown silty clayloam pockets; neutral; pH 7.0; gradualboundary.
B3 173-226 Composed of colors, yellowish brown (10YR5/4), gray (10YR 6/1) with very dark graystains; silty clay loam; weak, medium blockystructure; very firm; roots are rare; scatteredbrown and black concretions; alkaline; pH7.5; gradual boundary.
C 226+ Gray (10YR 6/1) with coarse brown (10YR5/4) mottles; silty clay loam and shale; mas-sive; moderately alkaline; pH 8.0.
RESULTS AND DISCUSSION
Chemical Analyses
Chemical analyses of the mounded soil, Pedon-3 andintermound, Pedon-0, are shown in Tables 1 and 2.
Hydrogen Ion Concentration—The pH values of the soilhorizons of the mounded soil show a gradual increase inpH or decrease in acidity from the surface down, whilethat of the intermound deviates with a pH of 6.0 in theA22 horizon.
Organic Matter—The maximum organic matter content
750 SOIL SCI. SOC. AMER. PROC., VOL. 37, 1973
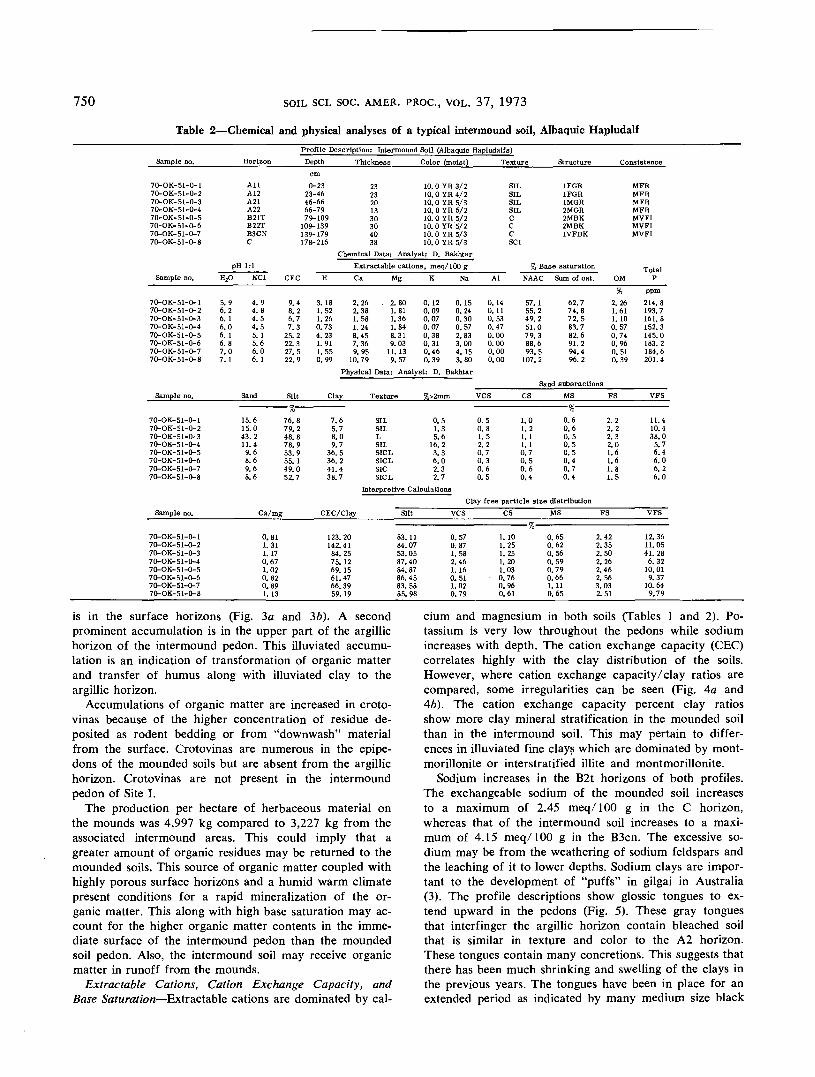
Table 2—Chemical and physical analyses of a typical intermound soil, Albaquic HapludalfProfile Description:
Sample no.
70-OK-51-0-170-OK-51-0-270-OK-51-0-370-OK-51-0-470-OK-51-0-570-OK-51-0-670-OK-51-0-770-OK-51-0-8
Sample no.
70-OK-51-0-170-OK-51-0-270-OK-51-0-370-OK-51-0-470-OK-51-0-570-OK-51-0-670-OK-51-0-770-OK-51-0-8
Horizon
AHA12A21A22B21TB22TB3CNC
pH lilH20 KC1
5. 9 4. 96. 2 4. 86. 1 4. 56. 0 4. 56. 1 5. 16. 8 5. 67. 0 6. 07. 1 6. 1
Intermound Soil (Albaquic Hapludalfs)Depth Thickness
cm0-23 23
23-46 2346-66 2066-79 1379-109 30
109-139 30139-179 40178-216 38
Chemical Data: Analyt
Color (moist)
10.0 YR 3/210.0 YH 4/210. 0 YR 5/310.0 YR 6/210. 0 YR 5/210. 0 YR5/210. 0 YR 5/310. 0 YR 5/3
rt: D. Bakhtar
Texture
SILSILSILSILCCCSCI
Extractable cations, meq/100 g % BiCEC
9.48.26.77.3
25.222.327.522.9
H Ca
3. 18 2. 261.52 2.381. 26 1. 580. 73 1. 244.23 8.451.91 7.361. 55 9. 950.99 10.79
Physical
Mg
. 2.801.811.361.848.319.03
11.139.57
K
0.120.090.070.070.380.310.460.39
Data: Analyst: D.
Na
0.150.240.300.572.833.004.153.80
Bakhtar
Al
0.140.110.530.470.000.000.000.00
NAAC
57.155.249.251.079.388.693.5
107.2
Structure
1FGR1FGR1MGR2MGR2MBK2MBK1VFBK
Consistence
MFRMFRMFKMFRMVFIMVFIMVFI
ase saturationSum of cat.
62.774.872.583.782.691.294.496.2
OM
%2.261.611.100.570.740.960.510.39
Totalp
ppm214.8193.7161.8152.3145.0183.2184.6201.4
Sand suberactlonsSample no.
70-OK-51-0-170-OK-51-0-270-OK-51-0-370-OK-51-0-470-OK-51-0-570-OK-51-0-670-OK-51-0-770-OK-51-0-8
Sand
15.615.043.211.49.68.69.68.6
Silt
-% ——76.879.248.878.953.955.149.052.7
Clay Texture
7.65.78.09.7
36.536.241.438.7
Inti
SILSILLSILSICLSICLSICSICL
%>2mm
0.51.35.6
16.23.36.02.32.7
VCS
0.50.81.52.20.70.30.60.5
CS
1.01.21. 11.10.70.50.60.4
MS
——— % ———0.60.60.50.50.50.40.70.4
FS
2.22.22.32.01.61.61.81.5
VFS
11.410.438.05.76.46.06.26.0
jrpretive CalculationsClay free particle size distribution
Sample no.
70-OK-51-0-170-OK-51-0-270-OK-51-0-370-OK-51-0-470-OK-51-0-570-OK-51-0-670-OK-51-0-770-OK-51-0-8
Ca/mg
0.811.311.170.671.020.820.891.13
CEC/Clay
123. 20142.4184.2575.1269.1561.4766.3959. 19
Silt
83.1184.0753.0587.4084.8786.4583.5885.98
VCS
0.570.871.582.461.160.511.020.79
CS
1.101.251.251.201.03
- 0.760.960.61
MS
0.650.620.560.590.790.661.110.65
FS
2.422.352.502.262.462.563.032.51
VFS
12.3611.0541.286.32
10.019.37
10.649.79
is in the surface horizons (Fig. 3a and 3b). A secondprominent accumulation is in the upper part of the argillichorizon of the intermound pedon. This illuviated accumu-lation is an indication of transformation of organic matterand transfer of humus along with illuviated clay to theargillic horizon.
Accumulations of organic matter are increased in croto-vinas because of the higher concentration of residue de-posited as rodent bedding or from "downwash" materialfrom the surface. Crotovinas are numerous in the epipe-dons of the mounded soils but are absent from the argillichorizon. Crotovinas are not present in the intermoundpedon of Site I.
The production per hectare of herbaceous material onthe mounds was 4,997 kg compared to 3,227 kg from theassociated intermound areas. This could imply that agreater amount of organic residues may be returned to themounded soils. This source of organic matter coupled withhighly porous surface horizons and a humid warm climatepresent conditions for a rapid mineralization of the or-ganic matter. This along with high base saturation may ac-count for the higher organic matter contents in the imme-diate surface of the intermound pedon than the moundedsoil pedon. Also, the intermound soil may receive organicmatter in runoff from the mounds.
Extractable Cations, Cation Exchange Capacity, andBase Saturation—Extractable cations are dominated by cal-
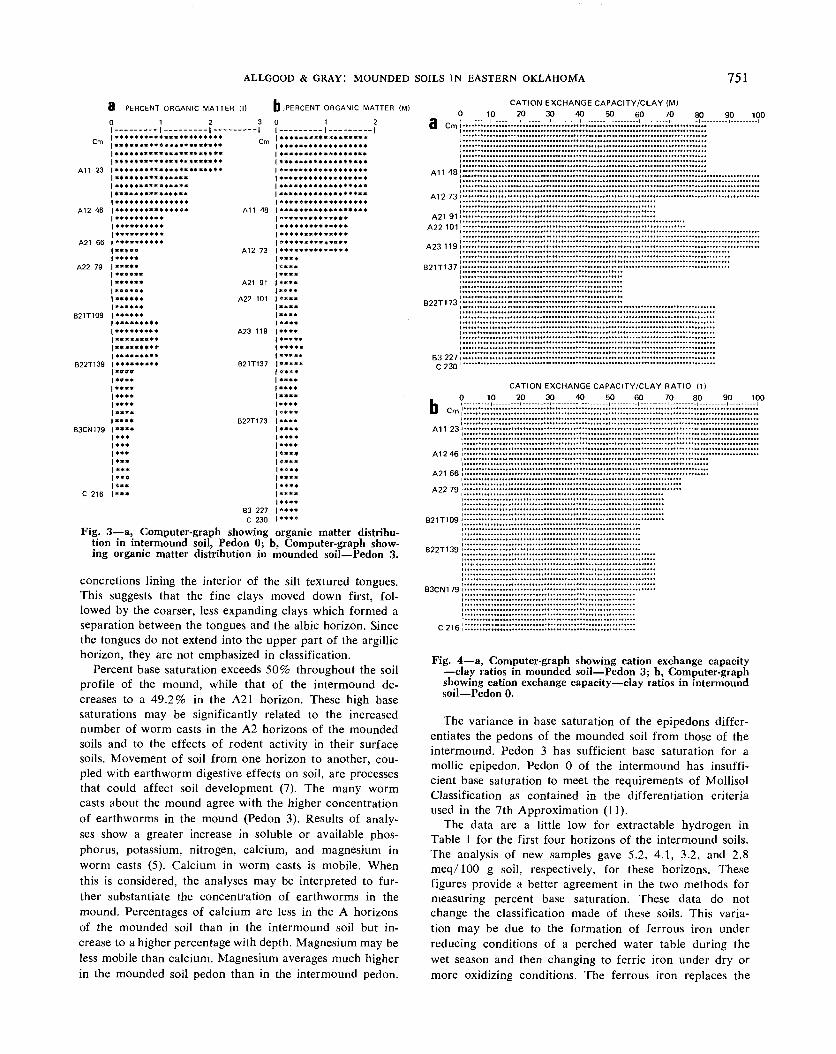
cium and magnesium in both soils (Tables 1 and 2). Po-tassium is very low throughout the pedons while sodiumincreases with depth. The cation exchange capacity (CEC)correlates highly with the clay distribution of the soils.However, where cation exchange capacity/clay ratios arecompared, some irregularities can be seen (Fig. 4a and4b). The cation exchange capacity percent clay ratiosshow more clay mineral stratification in the mounded soilthan in the intermound soil. This may pertain to differ-ences in illuviated fine clays which are dominated by mont-morillonite or interstratified illite and montmorillonite.
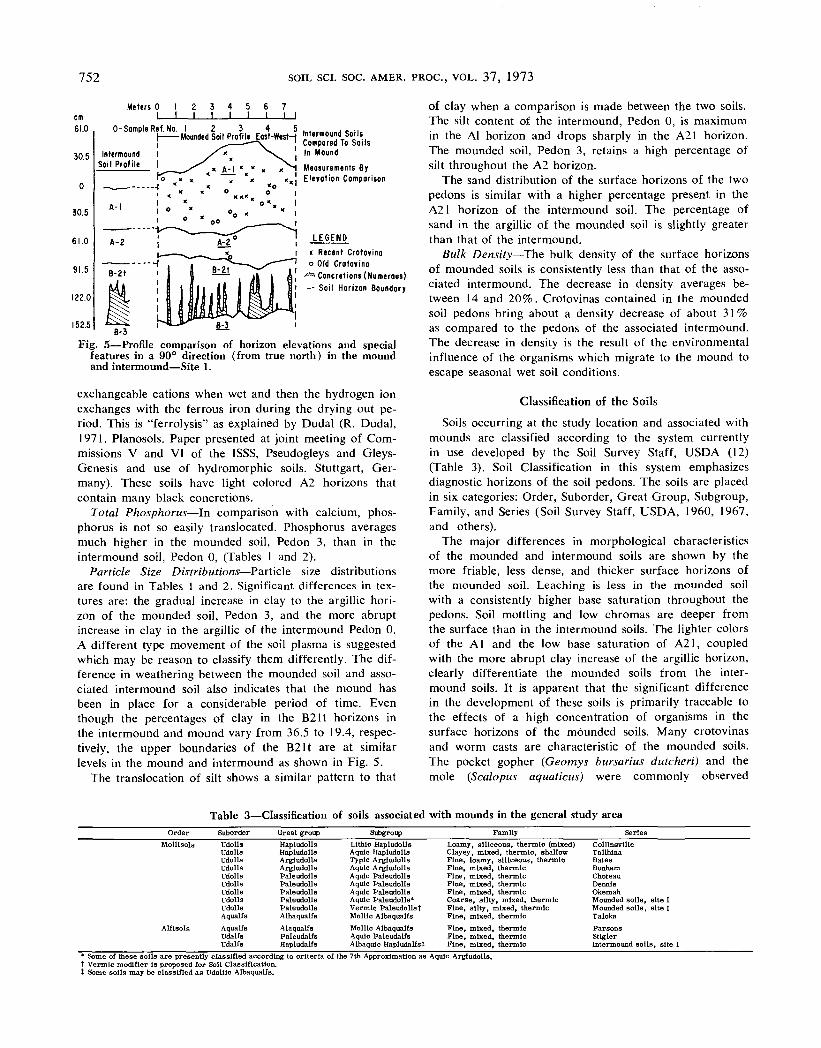
Sodium increases in the B2t horizons of both profiles.The exchangeable sodium of the mounded soil increasesto a maximum of 2.45 meq/100 g in the C horizon,whereas that of the intermound soil increases to a maxi-mum of 4.15 meq/100 g in the B3cn. The excessive so-dium may be from the weathering of sodium feldspars andthe leaching of it to lower depths. Sodium clays are impor-tant to the development of "puffs" in gilgai in Australia(3). The profile descriptions show glossic tongues to ex-tend upward in the pedons (Fig. 5). These gray tonguesthat interfinger the argillic horizon contain bleached soilthat is similar in texture and color to the A2 horizon.These tongues contain many concretions. This suggests thatthere has been much shrinking and swelling of the clays inthe previous years. The tongues have been in place for anextended period as indicated by many medium size black
ALLGOOD & GRAY: MOUNDED SOILS IN EASTERN OKLAHOMA 751
3 PERCENT ORGANIC MATTER (I) D .PERCENT ORGANIC MATTER (M)
0 1 2 30 1 210
CATION EXCHANGE CAPACITY/CLAY (M)20 30 40 50 60 70 80 90 100
A12 46
B21T109
B22T139
B3CN179
A21 91
A22 101
B22T173
83 227C 230
Fig. 3—a, Computer-graph showing organic matter distribu-tion in intermound soil, Pedon 0; b, Computer-graph show-ing organic matter distribution in mounded soil—Pedon 3.
concretions lining the interior of the silt textured tongues.This suggests that the fine clays moved down first, fol-lowed by the coarser, less expanding clays which formed aseparation between the tongues and the albic horizon. Sincethe tongues do not extend into the upper part of the argillichorizon, they are not emphasized in classification.
Percent base saturation exceeds 50% throughout the soilprofile of the mound, while that of the intermound de-creases to a 49.2% in the A21 horizon. These high basesaturations may be significantly related to the increasednumber of worm casts in the A2 horizons of the moundedsoils and to the effects of rodent activity in their surfacesoils. Movement of soil from one horizon to another, cou-pled with earthworm digestive effects on soil, are processesthat could affect soil development (7). The many wormcasts about the mound agree with the higher concentrationof earthworms in the mound (Pedon 3). Results of analy-ses show a greater increase in soluble or available phos-phorus, potassium, nitrogen, calcium, and magnesium inworm casts (5). Calcium in worm casts is mobile. Whenthis is considered, the analyses may be interpreted to fur-ther substantiate the concentration of earthworms in themound. Percentages of calcium are less in the A horizonsof the mounded soil than in the intermound soil but in-crease to a higher percentage with depth. Magnesium may beless mobile than calcium. Magnesium averages much higherin the mounded soil pedon than in the intermound pedon.
Cm i
AH
A 1 2 7 3 I
A21 91 iA22 101 i
A23119]
B21T137'i
B22T173'
B3227,..C230 1"
CATION EXCHANGE CAPACITY/CLAY RATIO 11]0 10 20 30 40 50 60 70 80 90 100
A11 23 >;•
A1246J| j
A21 66 !"i"A22 79 jjj
B21T109 jj;
B22T139JJJ
i"B3CN179J';'
i •<
C2i6|::
Fig. 4—a, Computer-graph showing cation exchange capacity—clay ratios in mounded soil—Pedon 3; b, Computer-graphshowing cation exchange capacity—clay ratios in intermoundsoil—Pedon 0.
The variance in base saturation of the epipedons differ-entiates the pedons of the mounded soil from those of theintermound. Pedon 3 has sufficient base saturation for amollic epipedon. Pedon 0 of the intermound has insuffi-cient base saturation to meet the requirements of MollisolClassification as contained in the differentiation criteriaused in the 7th Approximation (11).
The data are a little low for extractable hydrogen inTable 1 for the first four horizons of the intermound soils.The analysis of new samples gave 5.2, 4.1, 3.2, and 2.8meq/100 g soil, respectively, for these horizons. Thesefigures provide a better agreement in the two methods formeasuring percent base saturation. These data do notchange the classification made of these soils. This varia-tion may be due to the formation of ferrous iron underreducing conditions of a perched water table during thewet season and then changing to ferric iron under dry ormore oxidizing conditions. The ferrous iron replaces the
752 SOIL SCI. SOC. AMER. PROC., VOL. 37, 1973
Measurements ByElevation Comparison
LEGEND
x Recent Crofovinoo Old Crofovina
**** Concretions (Numerous)— Soil Horizon Boundary
Meters 0 Icm I——L61.0 0-Sample Ref.
30.5
0
30.5
61.0
91.5
122.0
152.5
Fig. 5—Profile comparison of horizon elevations and specialfeatures in a 90° direction (from true north) in the moundand intermound—Site 1.
exchangeable cations when wet and then the hydrogen ionexchanges with the ferrous iron during the drying out pe-riod. This is "ferrolysis" as explained by Dudal (R. Dudal,1971. Planosols. Paper presented at joint meeting of Com-missions V and VI of the ISSS, Pseudogleys and Gleys-Genesis and use of hydromorphic soils. Stuttgart, Ger-many). These soils have light colored A2 horizons thatcontain many black concretions.
Total Phosphorus—In comparison with calcium, phos-phorus is not so easily translocated. Phosphorus averagesmuch higher in the mounded soil, Pedon 3, than in theintermound soil, Pedon 0, (Tables 1 and 2).
Particle Size Distributions—Particle size distributionsare found in Tables 1 and 2. Significant differences in tex-tures are: the gradual increase in clay to the argillic hori-zon of the mounded soil, Pedon 3, and the more abruptincrease in clay in the argillic of the intermound Pedon 0.A different type movement of the soil plasma is suggestedwhich may be reason to classify them differently. The dif-ference in weathering between the mounded soil and asso-ciated intermound soil also indicates that the mound hasbeen in place for a considerable period of time. Eventhough the percentages of clay in the B21t horizons inthe intermound and mound vary from 36.5 to 19.4, respec-tively, the upper boundaries of the B21t are at similarlevels in the mound and intermound as shown in Fig. 5.
The translocation of silt shows a similar pattern to that
of clay when a comparison is made between the two soils.The silt content of the intermound, Pedon 0, is maximumin the Al horizon and drops sharply in the A21 horizon.The mounded soil, Pedon 3, retains a high percentage ofsilt throughout the A2 horizon.
The sand distribution of the surface horizons of the twopedons is similar with a higher percentage present in theA21 horizon of the intermound soil. The percentage ofsand in the argillic of the mounded soil is slightly greaterthan that of the intermound.
Bulk Density—The bulk density of the surface horizonsof mounded soils is consistently less than that of the asso-ciated intermound. The decrease in density averages be-tween 14 and 20%. Crotovinas contained in the moundedsoil pedons bring about a density decrease of about 31 %as compared to the pedons of the associated intermound.The decrease in density is the result of the environmentalinfluence of the organisms which migrate to the mound toescape seasonal wet soil conditions.
Classification of the SoilsSoils occurring at the study location and associated with
mounds are classified according to the system currentlyin use developed by the Soil Survey Staff, USDA (12)(Table 3). Soil Classification in this system emphasizesdiagnostic horizons of the soil pedons. The soils are placedin six categories: Order, Suborder, Great Group, Subgroup,Family, and Series (Soil Survey Staff, USDA, 1960, 1967.and others).
The major differences in morphological characteristicsof the mounded and intermound soils are shown by themore friable, less dense, and thicker surface horizons ofthe mounded soil. Leaching is less in the mounded soilwith a consistently higher base saturation throughout thepedons. Soil mottling and low chromas are deeper fromthe surface than in the intermound soils. The lighter colorsof the Al and the low base saturation of A21, coupledwith the more abrupt clay increase of the argillic horizon,clearly differentiate the mounded soils from the inter-mound soils. It is apparent that the significant differencein the development of these soils is primarily traceable tothe effects of a high concentration of organisms in thesurface horizons of the mounded soils. Many crotovinasand worm casts are characteristic of the mounded soils.The pocket gopher (Geomys bursarius dutcheri) and themole (Scalopus aquatlcus) were commonly observed
Table 3—Classification of soils associated with mounds in the general study areaOrder
Molltsols
A If i sols
SuborderUdollsUdollsUdollsUdollsUdollsUdollsUdollsUdollsUdollsAqualfsAqualfsUdalfsUdalfs
Great groupHapludollsHapludolleArgiudollsArgiudollsPale udollsPaleudollsPale udollsPaleudollsPaleudollsAlbaqualfsAlaqualfsPaleudalfsHapludalfs
SubgroupLlthic HapludollsAqulc HapludollsTypic ArgludollsAquic ArgludollsAqulc PaleudollsAqulc PaleudollsAqulc PaleudollsAqulc Paleudolls*Vermtc PaleudollstMollic AlbaqualfsMollic AlbaqualfsAqulc PaleudalfsAlbaqulc Hapludalfst
FamilyLoamy, siliceous, thermic (mixed)Clayey, mixed, thermic, shallowFine, loamy, siliceous, thermicFine, mixed, thermicFine, mixed, thermicFine, mixed, thermicFine, mixed, thermicCoarse, silty, mixed, thermicFine, silty, mixed, thermicFine, mixed, thermicFine, mixed, thermicFine, mixed, thermicFine, mixed, thermic
SeriesCollinsvllleTalihlnaBatesBonhamChoteauDennisOkemahMounded soils, site IMounded soils, site ITalokaParsonsStlglerIntermound soils, site I
' Some of these soils are presently classified according to criteria of the 7th Approximation as Aqulc Argiudolls.t Vermic modifier is proposed for Soil Classification.t Some soils may be classified as Udoltic Albaqualfs.
ALLGOOD & GRAY: MOUNDED SOILS IN EASTERN OKLAHOMA 753
about the mounds with a high population of earthworms(Lumbricus terrestris). A better soil classification couldrecognize these important biological influences. Vermicis suggested, especially at the subgroup level. Also, a bettername for these mounds would be Verrna. This is preferredto Mima (8). No vermic subgroup has been included inthe current soil classification system (12) with the tax-onomic great group classification.
The mounded soils, Pedon-3, are classified according toSoil Taxonomy as a coarse silty mixed, thermic AquicArgiudolls. They are distinguished from all other soils inthe vicinity of the study area at the Family level of classi-fication (Table 3). Soil series for the mounded soils havenot been recognized in the present mapping of landscapescontaining them.
In the intermound area of Site 1, Pedon-0 is separatedfrom the other soils mapped in the immediate area of theGreat Group level of classification. It is classified as afine, mixed, thermic Albaquic Hapludalf.
From the findings in this study and the results obtainedin other similar investigations of the mounds, it is evidentthat organisms alter the mounded soils in measurableamounts. The resulting effects establish a more highly fer-tile and porous surface soil with greater thickness thanthat of the associated intermound. These aspects are con-sistently observed and may be predicted with a high degreeof certainty in the locations studied. Also, better soil sur-vey interpretations for future crop uses will result from abetter understanding of the morphology, genesis, and clas-sification of mounded soils or soils of verma mounds inOklahoma and surrounding states.
SUMMARY AND CONCLUSION
Numerous small mounds form a unique soil arrange-ment that covers many acres in eastern Oklahoma. This ispart of a vast area containing mounds that extend fromthe southern part of Missouri to the coast of Texas. Themounds averaging about 15 m in diameter and less thanone m in height, occur in densities of 8 to 16/ha.
Mounded soils investigated in east central Oklahomacontained biological influences in soil formation whencompared to the associated intermound soils. Biologicalactivity was most common in mounded soils which haveless mottlings than the intermound soils. Soil densities werefound to be consistently less in the surface horizons ofmounded soils than in the associated intermound soils.
The friable, less dense Al horizon is an outstanding fea-ture of the mounded soils (8). Because it is a prominentmorphological characteristic, it deserves consideration inthe taxonomic system of soil classification. Soils in themound possess qualities required by differentia criteria ofthe 7th Approximation for a mollic epipedon (12). Adja-cent intermound pedons lack the required qualities whichby comparison indicate the significance of contributionsby organisms to the mounded soils. These characteristicssuggest the modifier vermic be added to the classificationof the mounded soils. These mounds would be betternamed as Verma mounds. Classification of the moundedsoils, according to the present differentia criteria of the 7thApproximation, is coarse silt, mixed, thermic family ofAquic Paleudolls or Aquic Argiudolls. The associated in-termound pedon is a member of the fine, mixed, thermicfamily of Albaquic Hapludalfs.
Recommended