GENDER DIMENSIONS IN RURAL-URBAN MIGRATION IN INDIA:
POLICY IMPERATIVES
Introduction:
A gender perspective on migration attempts to overcome the limited attention
paid to the presence of women in the migration stock and their contribution. While many
women accompany or join family members, of late, more and more women are migrating
on their own. Though research studies on migration claim that they are gender-neutral , in
fact they are not. Often they end up utilizing models of migration based on the experience
of men. Women even if considered are treated as dependents and their contributions are
ignored. (U.N.2005). In many poor migrant households women are the principal wage
earners. In such a context a gender perspective on migration examines the gender specific
causes of migration.the vulnerability as well as the potential for empowerment of migrant
women and the consequences of internal/international migration. Though globalisation
has opened up a range of new opportunities for women still women predominate and tend
to work in female occupations including domestic work garment industry nursing and
teaching. Whether they are in traditional or modern job, migration itself can be an
empowering experience for women since they move away from situations where they
were under traditional patriarchal authority to situations in which they can exercise
greater autonomy over their own lives. (Hugo 2000 p-299) When women get empowered
they benefit themselves and the larger community. ‘The expansion of women’s
capabilities not only enhances women’s own freedom and well-being but also has many
other effects on the lives of all. An enhancement of women’s active agency can in many
circumstances contribute substantially to the lives of all people. –men as well as women,
children as well as adults’.(Sen 2001 p-100 ) In the Indian context women in the migrant
households do play an important role in family survival but unfortunately they remain
invisible in the official data beause of the way the concepts are defined and data is
collected. This research piece tries to have a gender perspective to rural- rural , rural-
urban migration and analyse the labour force participation of women in migrant
households. Through indirect indicators , it tries to arrive at the extent of and inter-state
variations in independent (autonomous) female migration. Section I deals with trends in
urbanization in India and male female composition in inter state and intra state migration.
Section II deals with household level data to assess the extent of women’s participation in
the labour force in the case of associational migration for Tamil Nadu , a sourthern state
in India where female migration is quite high. This study concludes that females do play
an active role in family maintenance in the destination area and since independent
migration of females is on the increase ,policy planners should be pro-active in
addressing the multifarious problems faced by them and also in molding public opinion
in favour of female migration.
Section I
Urbanisation and Migration in India:
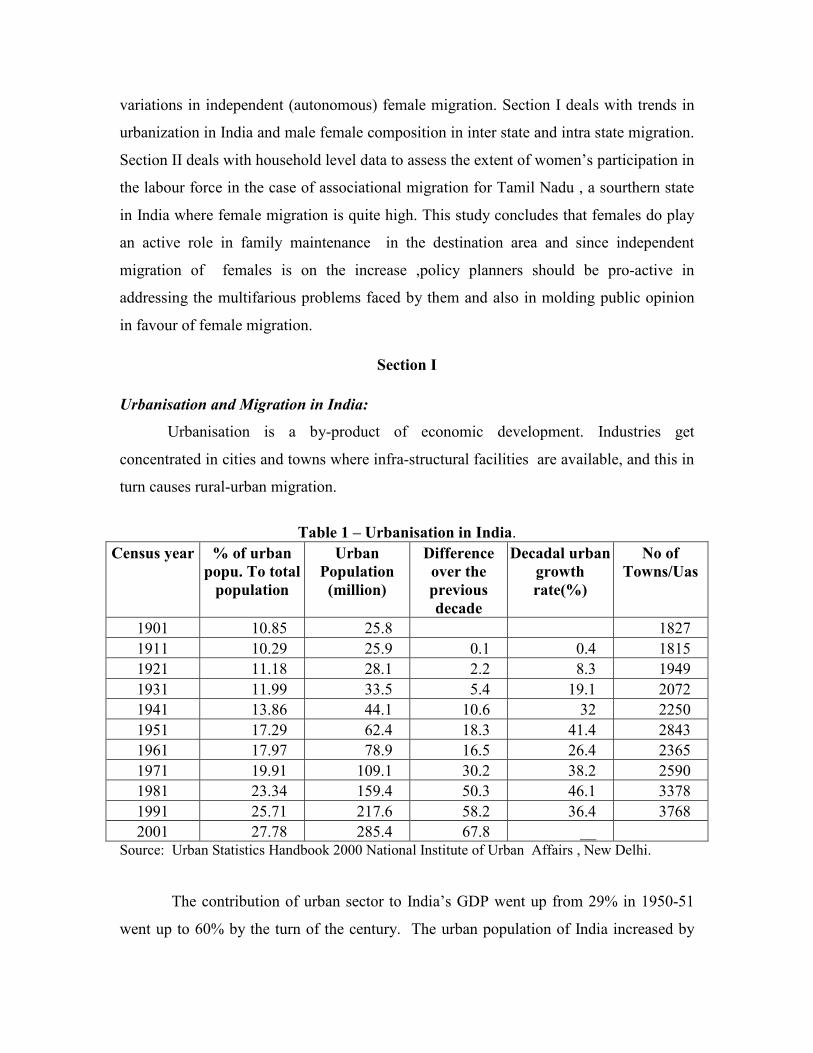
Urbanisation is a by-product of economic development. Industries get
concentrated in cities and towns where infra-structural facilities are available, and this in
turn causes rural-urban migration.
Table 1 – Urbanisation in India.
Census year % of urban
popu. To total
population
Urban
Population
(million)
Difference
over the
previous
decade
Decadal urban
growth
rate(%)
No of
Towns/Uas
1901 10.85 25.8 1827
1911 10.29 25.9 0.1 0.4 1815
1921 11.18 28.1 2.2 8.3 1949
1931 11.99 33.5 5.4 19.1 2072
1941 13.86 44.1 10.6 32 2250
1951 17.29 62.4 18.3 41.4 2843
1961 17.97 78.9 16.5 26.4 2365
1971 19.91 109.1 30.2 38.2 2590
1981 23.34 159.4 50.3 46.1 3378
1991 25.71 217.6 58.2 36.4 3768
2001 27.78 285.4 67.8 __ Source: Urban Statistics Handbook 2000 National Institute of Urban Affairs , New Delhi.
The contribution of urban sector to India’s GDP went up from 29% in 1950-51
went up to 60% by the turn of the century. The urban population of India increased by
more than eight times from 25.8 million in 1901 to 285.4 million in 2001 (Table 1). The
increment is much higher in the last four decades . Though rapid urbanization is
welcomed for its positive effects, it has also imposed increasing pressures on the level of
services in the urban centers.1 But the process of urbanization in India is likely to persist
atleast until 2030 A.D. when India will achieve a 50% level of urbanization . (Mathur
2004:14)
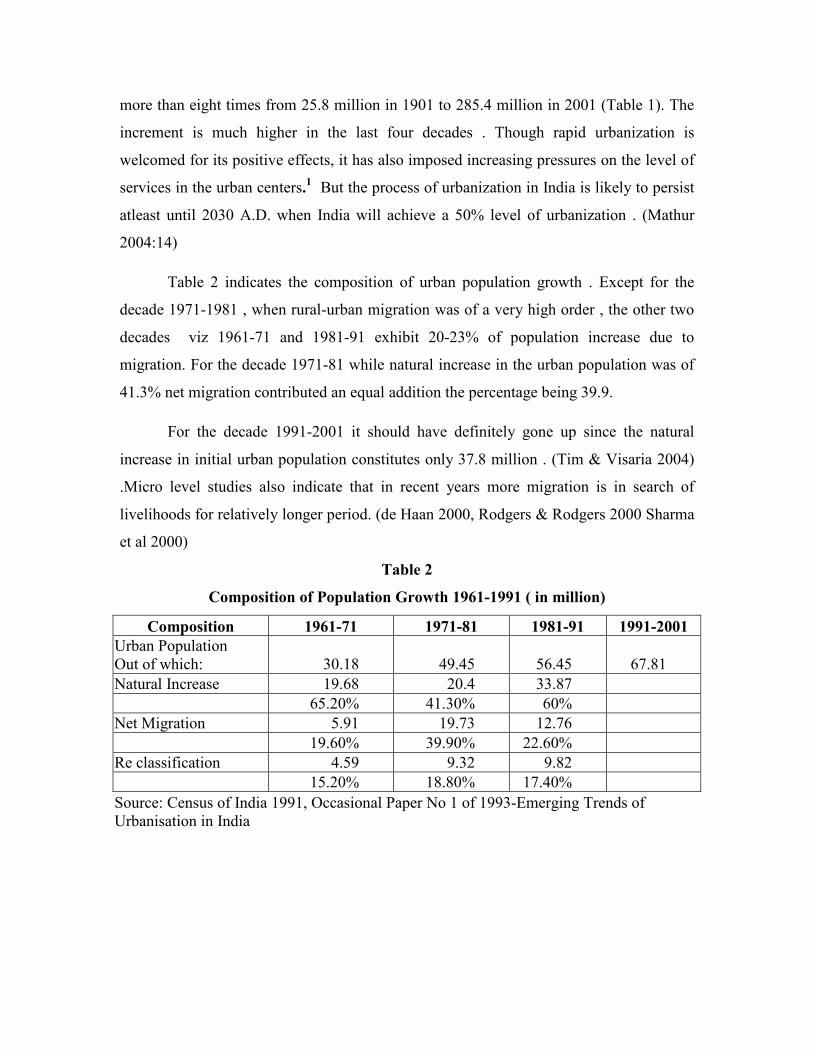
Table 2 indicates the composition of urban population growth . Except for the
decade 1971-1981 , when rural-urban migration was of a very high order , the other two
decades viz 1961-71 and 1981-91 exhibit 20-23% of population increase due to
migration. For the decade 1971-81 while natural increase in the urban population was of
41.3% net migration contributed an equal addition the percentage being 39.9.
For the decade 1991-2001 it should have definitely gone up since the natural
increase in initial urban population constitutes only 37.8 million . (Tim & Visaria 2004)
.Micro level studies also indicate that in recent years more migration is in search of
livelihoods for relatively longer period. (de Haan 2000, Rodgers & Rodgers 2000 Sharma
et al 2000)
Table 2
Composition of Population Growth 1961-1991 ( in million)
Composition 1961-71 1971-81 1981-91 1991-2001
Urban Population
Out of which: 30.18 49.45 56.45 67.81
Natural Increase 19.68 20.4 33.87
65.20% 41.30% 60%
Net Migration 5.91 19.73 12.76
19.60% 39.90% 22.60%
Re classification 4.59 9.32 9.82
15.20% 18.80% 17.40%
Source: Census of India 1991, Occasional Paper No 1 of 1993-Emerging Trends of
Urbanisation in India
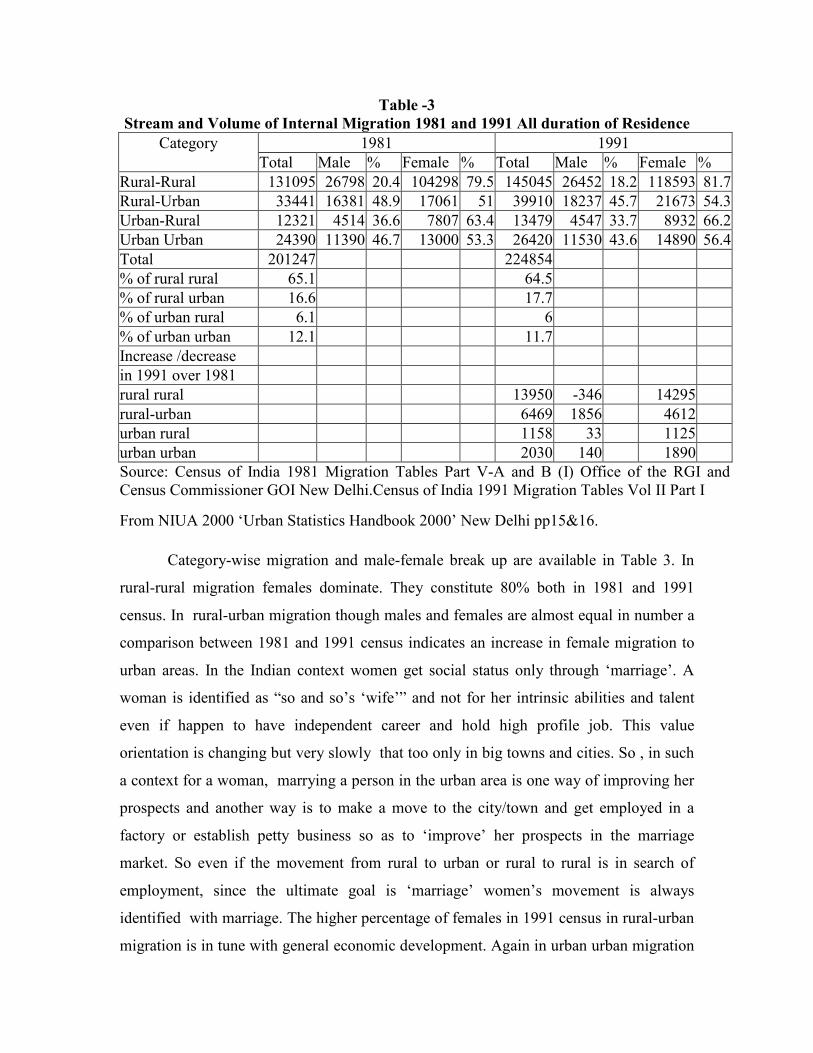
Table -3
Stream and Volume of Internal Migration 1981 and 1991 All duration of Residence
1981 1991 Category
Total Male % Female % Total Male % Female %
Rural-Rural 131095 26798 20.4 104298 79.5 145045 26452 18.2 118593 81.7
Rural-Urban 33441 16381 48.9 17061 51 39910 18237 45.7 21673 54.3
Urban-Rural 12321 4514 36.6 7807 63.4 13479 4547 33.7 8932 66.2
Urban Urban 24390 11390 46.7 13000 53.3 26420 11530 43.6 14890 56.4
Total 201247 224854
% of rural rural 65.1 64.5
% of rural urban 16.6 17.7
% of urban rural 6.1 6
% of urban urban 12.1 11.7
Increase /decrease
in 1991 over 1981
rural rural 13950 -346 14295
rural-urban 6469 1856 4612
urban rural 1158 33 1125
urban urban 2030 140 1890
Source: Census of India 1981 Migration Tables Part V-A and B (I) Office of the RGI and
Census Commissioner GOI New Delhi.Census of India 1991 Migration Tables Vol II Part I
From NIUA 2000 ‘Urban Statistics Handbook 2000’ New Delhi pp15&16.
Category-wise migration and male-female break up are available in Table 3. In
rural-rural migration females dominate. They constitute 80% both in 1981 and 1991
census. In rural-urban migration though males and females are almost equal in number a
comparison between 1981 and 1991 census indicates an increase in female migration to
urban areas. In the Indian context women get social status only through ‘marriage’. A
woman is identified as “so and so’s ‘wife’” and not for her intrinsic abilities and talent
even if happen to have independent career and hold high profile job. This value
orientation is changing but very slowly that too only in big towns and cities. So , in such
a context for a woman, marrying a person in the urban area is one way of improving her
prospects and another way is to make a move to the city/town and get employed in a
factory or establish petty business so as to ‘improve’ her prospects in the marriage
market. So even if the movement from rural to urban or rural to rural is in search of
employment, since the ultimate goal is ‘marriage’ women’s movement is always
identified with marriage. The higher percentage of females in 1991 census in rural-urban
migration is in tune with general economic development. Again in urban urban migration

women have improved their share in 1991census over 1981. Urban-rural migration which
occupies the last rank in terms of its magnitude in total migration, again witnesses a
larger proportion for females mainly due to ‘marriage’ since majority women migrate
only on marriage.
Table 4
Regional Variations in Development and Migration
. Major states Poverty
rate
Rank Popu. Growth
(1991-
2002)% per
year
Rank SDP per
capita 1997-
98 (Rs per
year)
Rank Net migration
rate (per 1000
population)
Andhra Pradesh 18.8 6 1.21 3 10590 9 1
Assam 39.6 15 - - - - -5
Bihar 46.9 17 2.43 13 4654 15 -31
Gujarat 15.4 4 2.05 9 16251 4 19
Haryana 11.8 1 2.50 14 17626 2 79
Himachal Pradesh 17.5 5 1.63 6 10777 10 -
Karnataka 25.6 9 1.60 5 11693 7 -8
Kerala 14.5 3 1.01 1 11936 6 6
Madhya Pradesh 36.8 14 2.07 11 8114 12 10
Maharashtra 28.7 11 2.06 10 18365 3 44
Orissa 46.3 16 1.49 4 6767 14 6
Punjab 11.8 1 1.82 8 19500 1 25
Rajasthan 20.4 8 2.53 15 9356 11 7
Tamil Nadu 20.1 7 1.07 2 12989 5 -2
Uttar Pradesh 33.0 13 2.29 12 7263 13 -8
West Bengal 32.1 12 1.66 7 10636 8 27
Note: Net migration refers to the difference between in-migration and out-migration . If it
is negative then it means out-migrants are larger and the state is losing to other states and
vice versa.
Source: Migration in India 1999-2000 Report No 470 NSSO 55th Round July 1999-June
2000. Sep 2001 p-20
Poverty rate, Population growth rate and SDP percapita were taken from Cassen Robert
and Kirsty McNay ‘ The Condition of the People’ in ed Tim Dyson, Robert Cassen and
Leela Visaria 2004 ‘Twenty First Century India: Population , Economy, Human
Development and the Environment, OUP
Punjab , Haryana and Maharashtra which top the list in SDP percapita and where
the poverty percentage is low attract migrants from other states whereas Bihar which has
high population growth rate, high levels of poverty and poor SDP ,loses , outmigration
exceeding in-migration by 31 for every 1000 persons. 2 West Bengal is another state
which receives migrants from other states. It has porus borders and hence receives
migrants from Bangladesh as well. In the case of Tamil Nadu , the high rate of
unemployment could be the reason for outmigration exceeding in-migration. The
educated unemployed is also high in Tamil Nadu. Other studies also indicate that
Maharashtra attracts or pulls migrants from all over the country especially from U.P. and
Karnataka. Gujarat is another state which attracts migrants. West Bengal initially
attracted lot of migrants but now the tempo has come down. Migrant streams out of U.P.
and Bihar are of long standing. The inter-state migration is to be attributed to spatial un-
eveness in urban growth. There is wide variation in the level of urbanization and role of
urban population growth between states. Haryana , Punjab and Tamil Nadu whose level
of urbanization is higher than the national average growth rate continue to experience
higher than national average growth rate while states with low level of urbanization
continue to remain in the same status. This has deepened the disparities among states. 3
(Studies conclude that though in recent decades economic disparities between states has
increased this has not generated a rise in out-migration rates from poor states or in-
migration rates to better-off states. (Kundu & S.Gupta 2000).)
But the fact to be remembered here is, majority migration is within the state.
While rural-rural migration is mostly in response to development initiatives ( such as
irrigation or public works programmes) and are of shorter duration and for reasons of
seasonal employment, urban to urban migration is mostly identified with seekers of
permanent employment or for higher education. The migration trend indicates that rural
to rural and urban to rural flows are becoming less important while urban to urban and
rural to urban migration are becoming more prominent.
The NSSO 55th Round provides estimated number of persons whose place of
enumeration was their usual place of Residence but who stayed away from their
villages/towns for 60 days or more for employment or in search of employment. This
may include circular migration and permanent migration. This we treat as employment
oriented migration.
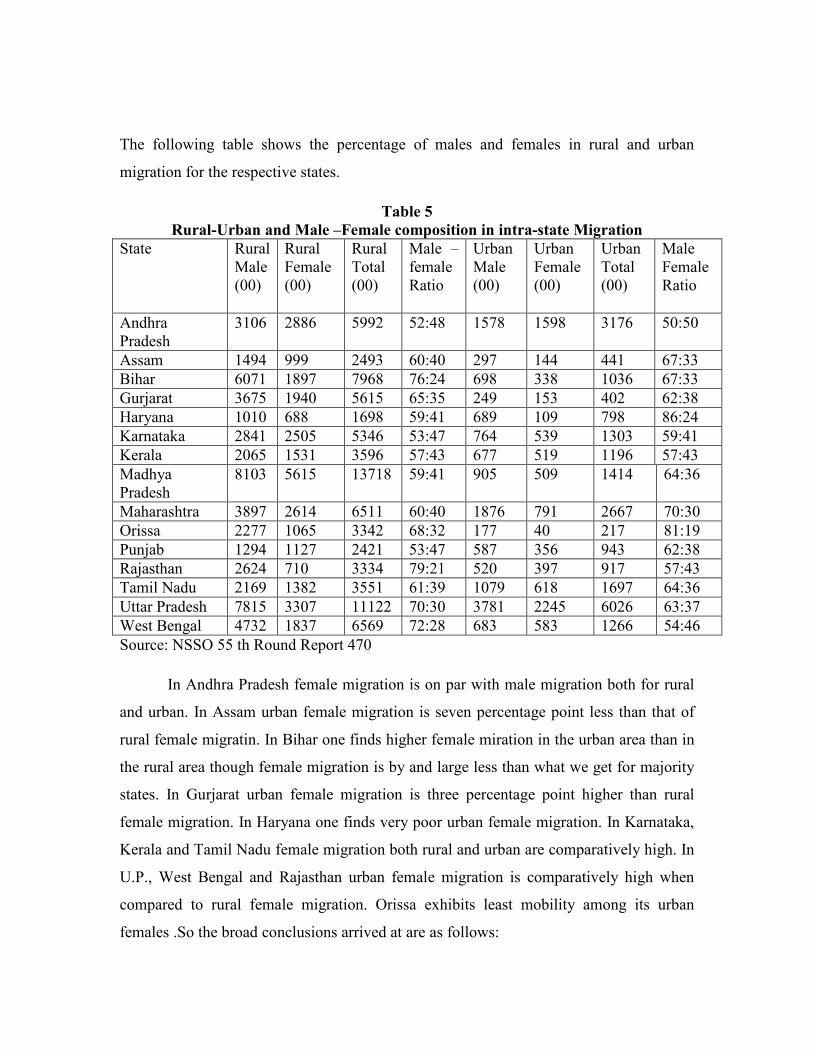
The following table shows the percentage of males and females in rural and urban
migration for the respective states.
Table 5
Rural-Urban and Male –Female composition in intra-state Migration
State Rural
Male
(00)
Rural
Female
(00)
Rural
Total
(00)
Male –
female
Ratio
Urban
Male
(00)
Urban
Female
(00)
Urban
Total
(00)
Male
Female
Ratio
Andhra
Pradesh
3106 2886 5992 52:48 1578 1598 3176 50:50
Assam 1494 999 2493 60:40 297 144 441 67:33
Bihar 6071 1897 7968 76:24 698 338 1036 67:33
Gurjarat 3675 1940 5615 65:35 249 153 402 62:38
Haryana 1010 688 1698 59:41 689 109 798 86:24
Karnataka 2841 2505 5346 53:47 764 539 1303 59:41
Kerala 2065 1531 3596 57:43 677 519 1196 57:43
Madhya
Pradesh
8103 5615 13718 59:41 905 509 1414 64:36
Maharashtra 3897 2614 6511 60:40 1876 791 2667 70:30
Orissa 2277 1065 3342 68:32 177 40 217 81:19
Punjab 1294 1127 2421 53:47 587 356 943 62:38
Rajasthan 2624 710 3334 79:21 520 397 917 57:43
Tamil Nadu 2169 1382 3551 61:39 1079 618 1697 64:36
Uttar Pradesh 7815 3307 11122 70:30 3781 2245 6026 63:37
West Bengal 4732 1837 6569 72:28 683 583 1266 54:46
Source: NSSO 55 th Round Report 470
In Andhra Pradesh female migration is on par with male migration both for rural
and urban. In Assam urban female migration is seven percentage point less than that of
rural female migratin. In Bihar one finds higher female miration in the urban area than in
the rural area though female migration is by and large less than what we get for majority
states. In Gurjarat urban female migration is three percentage point higher than rural
female migration. In Haryana one finds very poor urban female migration. In Karnataka,
Kerala and Tamil Nadu female migration both rural and urban are comparatively high. In
U.P., West Bengal and Rajasthan urban female migration is comparatively high when
compared to rural female migration. Orissa exhibits least mobility among its urban
females .So the broad conclusions arrived at are as follows:
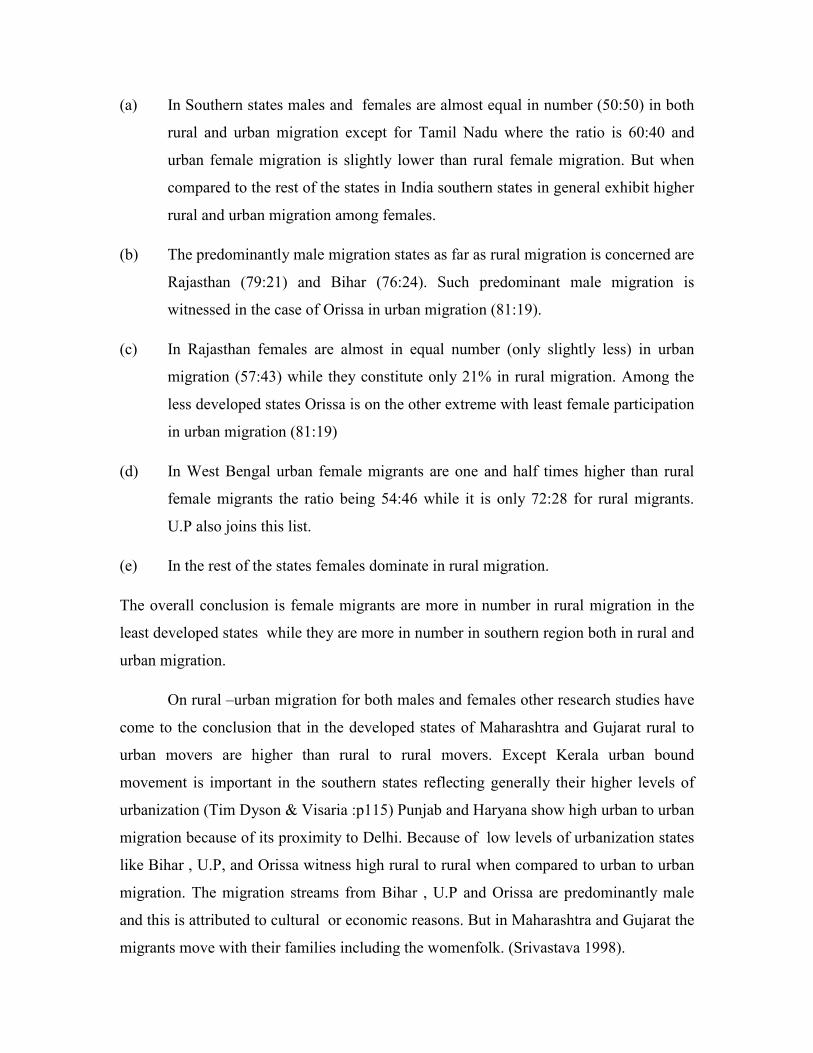
(a) In Southern states males and females are almost equal in number (50:50) in both
rural and urban migration except for Tamil Nadu where the ratio is 60:40 and
urban female migration is slightly lower than rural female migration. But when
compared to the rest of the states in India southern states in general exhibit higher
rural and urban migration among females.
(b) The predominantly male migration states as far as rural migration is concerned are
Rajasthan (79:21) and Bihar (76:24). Such predominant male migration is
witnessed in the case of Orissa in urban migration (81:19).
(c) In Rajasthan females are almost in equal number (only slightly less) in urban
migration (57:43) while they constitute only 21% in rural migration. Among the
less developed states Orissa is on the other extreme with least female participation
in urban migration (81:19)
(d) In West Bengal urban female migrants are one and half times higher than rural
female migrants the ratio being 54:46 while it is only 72:28 for rural migrants.
U.P also joins this list.
(e) In the rest of the states females dominate in rural migration.
The overall conclusion is female migrants are more in number in rural migration in the
least developed states while they are more in number in southern region both in rural and
urban migration.
On rural –urban migration for both males and females other research studies have
come to the conclusion that in the developed states of Maharashtra and Gujarat rural to
urban movers are higher than rural to rural movers. Except Kerala urban bound
movement is important in the southern states reflecting generally their higher levels of
urbanization (Tim Dyson & Visaria :p115) Punjab and Haryana show high urban to urban
migration because of its proximity to Delhi. Because of low levels of urbanization states
like Bihar , U.P, and Orissa witness high rural to rural when compared to urban to urban
migration. The migration streams from Bihar , U.P and Orissa are predominantly male
and this is attributed to cultural or economic reasons. But in Maharashtra and Gujarat the
migrants move with their families including the womenfolk. (Srivastava 1998).
Section II Gender Dimensions in Labour Migration
The Objective of this section is to throw light on labour force participation of
women after migration using household level data of NSSO 55 th Round for the state of
Tamil Nadu which is one among the few urbanized states in India and where female
mobility is high. Though it is difficult to capture ‘autonomous migration’ i.e. independent
migration of females we have attempted to use indirect indicators to capture this reality.
In the case of ‘associational migration’ the data clearly indicates that though majority
women move on account of marriage, their labour force participation increases steeply
after migration .Among the unemployed women, the percentage who have ‘sought work’
is quite high indicating that they need a job but are unable to find one. Issues relating to
female labour migration which have lot of policy implications are raised in Section III for
purposes of debate and dissemination.
Studies on Female Migration: An Over-view:
Over the years the literature on migraton has grown in volume and variety in
response to the unfolding complexities of migratory processes. Though women’s
employment oriented migration is on the increase, only few studies discuss the
movement of women in detail especially in relation to poverty. The work of Connell et al
(1976) the earliest of the studies in migration contains a detailed discussion on women’s
migration. Fernandez-Kelly (1983) and Khoo (1984) concentrate on women and work
both migrant and non-migrant in the world’s labour force. They discuss the problem in
the wider context of problem of feminisation of the work force , de-skilling and
devaluation of manufacturing work.
In recent literature female migration is linked to gender specific patterns of labour
demand in cities. In both South East Asian and Latin American cities plenty of
opportunities are available to women in the services and industrial sectors especially
with the rise of export processing in these regions. (Fernandez –Kelly 1983, Hayzer 1982,
Khoo 1984 and studies on South East Asian Labour migration) It has been established
that women are no longer mere passive movers who followed the household head
(Fawcett et al 1984, Rao 1986) . In fact daughters are sent to towns to work as domestic
servants (Arizpe 1981) . From an early age girls become economically independent living
on their own in the cities and sending remittances home. This kind of move has been
characterised by Veena Thadani and Michael Todaro (1984) as ‘autonomous female
migration ‘and has resulted in Thadani-Todaro model of migration 4 However studies
indicate that the independent movement of young women in South Asia and Middle East
as labour migrants is very rare and associated with derogatory status connotations.
(Connell et al 1976, Fawcett et al 1984).
But with trade liberalization and new economic policies , gender specific labour
demand has motivated many young Asian women to join the migration streams in groups
or with their families to “cash- in” the opportunity. 5 Kabeer (2000) in her study finds
Bangladeshi women (with a long tradition of female seclusion) taking up jobs in garment
factories and joining the labour markets of Middle East and South East Asian Countries.
A study of 387 female labour migrants from South East Asia, Thailand, the Philippines
and China finds positive impacts on women. (Chantavanich 2001). Another research
(Gamburd 2000) concludes that despite some unpleasant situations, none of the women
she interviewed felt that the risks of going abroad outweighed the benefits. Recent
migration research shows that female migrants consitute roughly half of all internal
migrants in developing countries. In some regions they even predominate men. (Hugo
1993)
In India with the entry of more and more young women in the export processing
zones , market segmentation is being accentuated , female dominant jobs are being
devalued , degraded and least paid. Though this does not augur well with women
development it has not deterred women from contributing to family survival and studies
are not wanting which highlight that it is women who settle down in the labour market as
flower/fruit vendors , domestic servants and allow the men to find a suitable job leisurely
or improve their skill. (Shanthi .K.1993)
Case studies indicate that it is the males who were’associational migrants’ and
not the women . Families had migrated in response to female economic opportunity ( as
domestic servants, as vegetable vendors, flower vendors in front of the temple etc etc)
and they are the primary or equal earners , male employment often being irregular and
uncertain. 6
While entry barriers are many in male jobs ( in the form of ‘informal
property rights) and the waiting period is long, it is not so in the case of female jobs
where they have easy entry and exit in domestic service and personalized services. (Premi
2001, Meher 1994, Shanthi.K. 1993 1991 )Their earnings may be low but crucial for
family survival. They get paid in ‘kind’ as well, which help to combat malnutrition
especially among infants.
Causes for invisibility of women in National Surveys:
But it is a pity that national level large scale surveys are unable to capture the
above reality. With the result women are treated still as secondary earners, invisible in the
official data system, and consequently no policy measures are directed to alleviate the
sufferings of these migrant women who lack even basic amenities in the destination area.
Why large scale national surveys underscore female migration is attributed to certain
reasons. The respondents are required to give only one reason for migration and in the
case of women invariably the reason for migration is identified with marriage. The
woman may be working prior to marriage and intend to get married with an urbanite to
enhance her potential for employment but it does not get captured . Moreover in the
Indian cultural setting it is inappropriate for a woman to emphasise her economic role
especially if the interviewer is a stranger and a male. When male members answer the
question, women’s employment is underplayed. Moreover the emphasis on primary and
full time work and longer reference period often lead to underestimation of female
employment. If women’s jobs are extensions of domestic jobs then they are not even
acknowledged as ‘jobs’. Depending on the respondent’s and enumerator’s perception and
gender sensitivity, women’s work force participation and economic contribution get
captured or not.Questions as to who migrated first, whether the male or the female and in
associational migration whether women’s employment opportunity was reckoned or not
at the time of migration etc are not posed to the sample population and hence it is
difficult to identify ‘autonomous female migrants’. Despite these shortcomings ,in the
absence of any other data on migration, one has to necessarily depend on the Census and
the NSSO the two sources of data for migration. The 2001 Census data on Migration is
yet to be published and so NSSO 55th Round data is the latest that is available for
purposes of research.
The National Sample Survey Organisation of Government of India carried out an
all-India survey on the situation of employment and unemployment in India during the
period July 1999-June 2000. This 55th Round Data was published in August 2001. In this
survey, data was collected on Migrants as well and the results of the same had been
published as Report 470. This report defines migrants as ‘a member of the sample
household if he/she had stayed continuously for atleast six months or more in a place
(village/town) other than the village/town where he/she was enumerated’. These long
term migrants were identified through Column 13 of Block 4 of Schedule 10 of the
Household Slips if the answer is ‘yes’ for the question ‘whether the place of enumeration
differs from last usual place of residence’. Once the migrant households had been
identified based on the reasons for migration the percentage of employment oriented
migration was calculated For purposes of analysis we restricted our sample size to those
falling in the age group 15-60 (both years inclusive) so that the dependents can be
eliminated and the working age group can be effectively studied.
Total number of sample who fall in the age group 15-60 for the state of Tamil
Nadu is 27764. Women and men are on equal proportion the percentage being 49.7 for
males and 50.3 for females. Migrants constitute 38% and the rest are non-migrants. But
among the migrants the sex ratio is in favour of women (70.9%) while males are only one
third.This should be attributed to the custom of women moving out from their natal home
on marriage. This is evident from the NSSO data where 90% of female mobility is
‘associational’ either as ‘spouse’ or as ‘dependent daughter’.
Since the NSSO asks for only one reason to be stated and there is no provision to
state more than one reason in order of priority women’s employment oriented migration
is under-estimated in national surveys. . Here the fact that is often forgotten is females do
work at the place of origin either as family workers in their own land/enterprise or as
agricultural labourers and also work at the place of destination. Migration tends to
increase the labour force participation of women especially if the destination area offers
scope for self employment or wage work and also due to the fact that the restrictions on
unmarried girls are more in the village. Once these women are in the town/city now they
are in the status of ‘married’ on whom the restrictions for outside work are less. Irregular
nature of work of the males further encourages the women to opt for wage work to
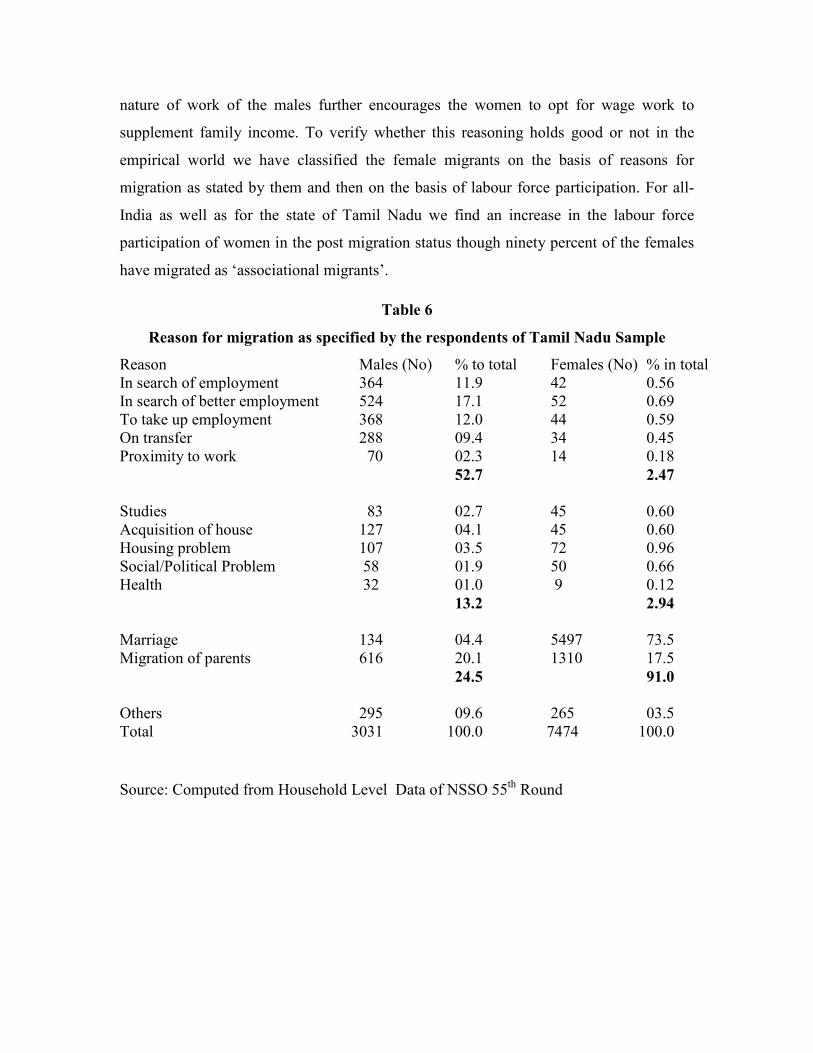
supplement family income. To verify whether this reasoning holds good or not in the
empirical world we have classified the female migrants on the basis of reasons for
migration as stated by them and then on the basis of labour force participation. For all-
India as well as for the state of Tamil Nadu we find an increase in the labour force
participation of women in the post migration status though ninety percent of the females
have migrated as ‘associational migrants’.
Table 6
Reason for migration as specified by the respondents of Tamil Nadu Sample
Reason Males (No) % to total Females (No) % in total
In search of employment 364 11.9 42 0.56
In search of better employment 524 17.1 52 0.69
To take up employment 368 12.0 44 0.59
On transfer 288 09.4 34 0.45
Proximity to work 70 02.3 14 0.18
52.7 2.47
Studies 83 02.7 45 0.60
Acquisition of house 127 04.1 45 0.60
Housing problem 107 03.5 72 0.96
Social/Political Problem 58 01.9 50 0.66
Health 32 01.0 9 0.12
13.2 2.94
Marriage 134 04.4 5497 73.5
Migration of parents 616 20.1 1310 17.5
24.5 91.0
Others 295 09.6 265 03.5
Total 3031 100.0 7474 100.0
Source: Computed from Household Level Data of NSSO 55th Round
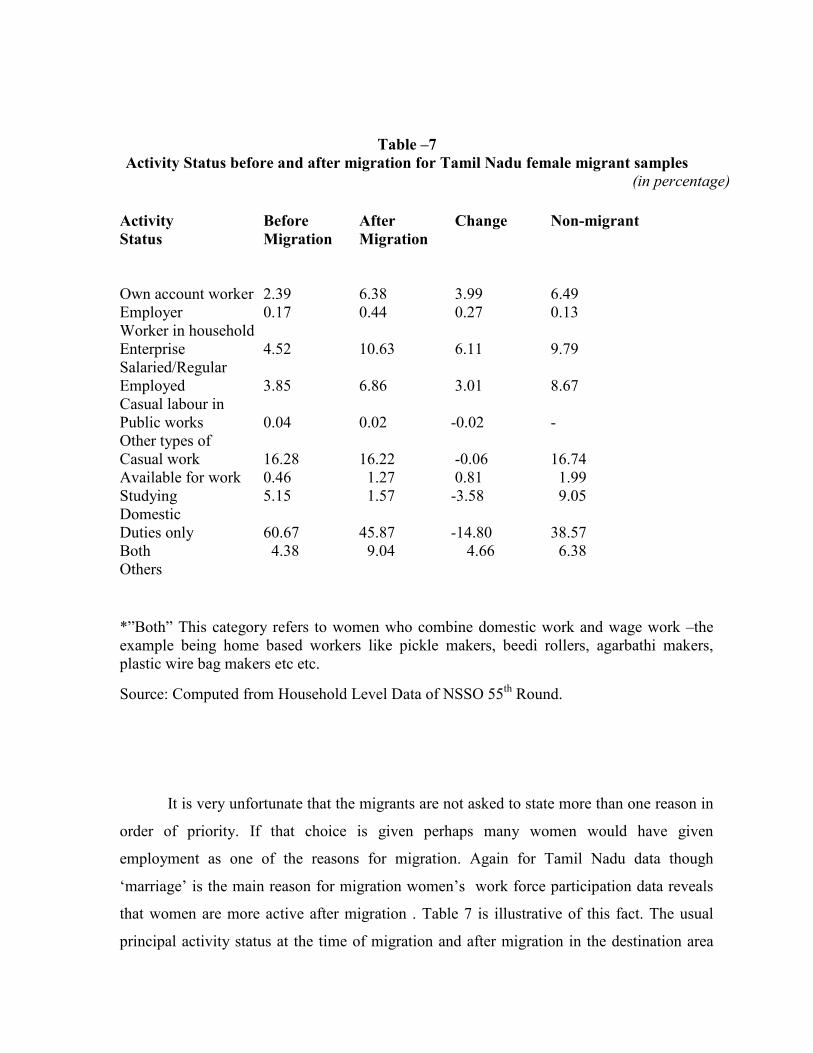
Table –7
Activity Status before and after migration for Tamil Nadu female migrant samples
(in percentage)
Activity Before After Change Non-migrant
Status Migration Migration
Own account worker 2.39 6.38 3.99 6.49
Employer 0.17 0.44 0.27 0.13
Worker in household
Enterprise 4.52 10.63 6.11 9.79
Salaried/Regular
Employed 3.85 6.86 3.01 8.67
Casual labour in
Public works 0.04 0.02 -0.02 -
Other types of
Casual work 16.28 16.22 -0.06 16.74
Available for work 0.46 1.27 0.81 1.99
Studying 5.15 1.57 -3.58 9.05
Domestic
Duties only 60.67 45.87 -14.80 38.57
Both 4.38 9.04 4.66 6.38
Others
*”Both” This category refers to women who combine domestic work and wage work –the
example being home based workers like pickle makers, beedi rollers, agarbathi makers,
plastic wire bag makers etc etc.
Source: Computed from Household Level Data of NSSO 55th Round.
It is very unfortunate that the migrants are not asked to state more than one reason in
order of priority. If that choice is given perhaps many women would have given
employment as one of the reasons for migration. Again for Tamil Nadu data though
‘marriage’ is the main reason for migration women’s work force participation data reveals
that women are more active after migration . Table 7 is illustrative of this fact. The usual
principal activity status at the time of migration and after migration in the destination area
for females reveal that ‘attending domestic duties only’ was the main occupation for 60.7%
of females . But after migration this has fallen to 45.8% .
The increase is almost double for the own account worker, worker in household
enterprises and salaried/Regular employment category. This again shows that women put
up their own business however small it is like fruit or vegetable or flower vending and
breakfast selling. They also accept wage employment. The percentage of women who
combine productive activity with domestic work (the category of ‘both’) goes up from
4.4% to 9.0%. This means migration definitely makes a difference in the lives of
women. Their work may be intermittent , due to child birth and other reasons, but it
always comes ‘handy’ whenever male unemployment is high due to the seasonality of
the job (like construction , agriculture) or in cases of irresponsibility of males of the
household.
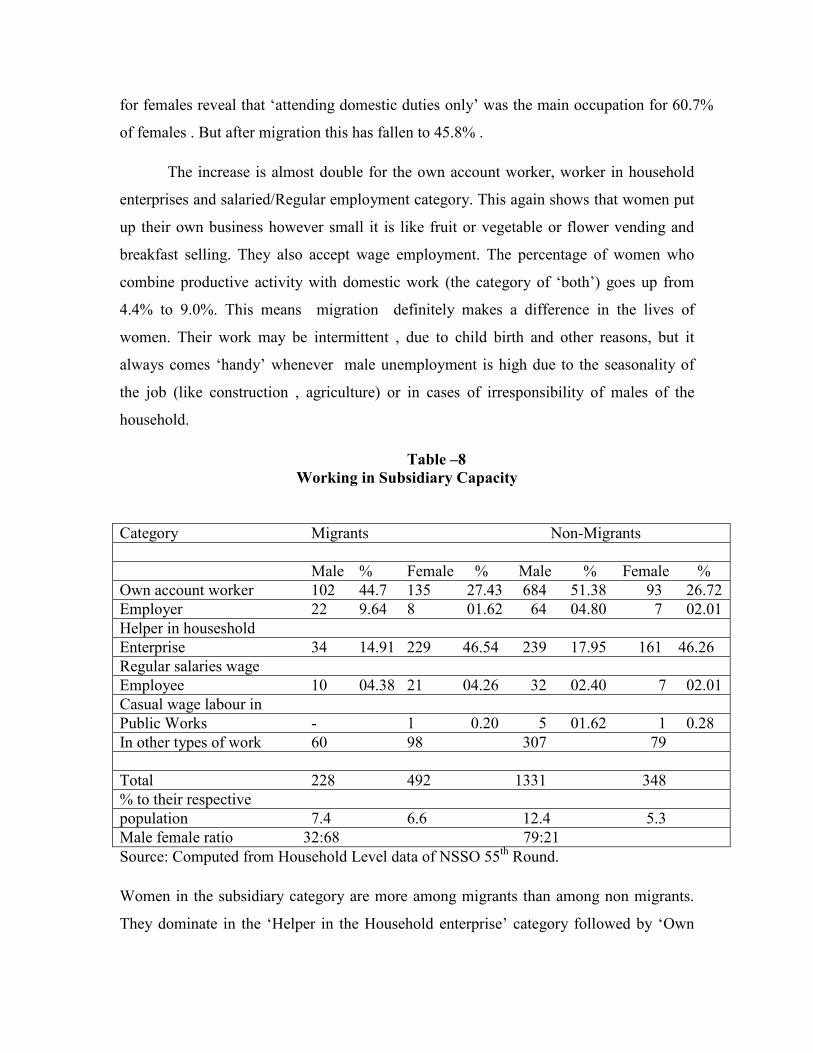
Table –8
Working in Subsidiary Capacity
Category Migrants Non-Migrants
Male % Female % Male % Female %
Own account worker 102 44.7 135 27.43 684 51.38 93 26.72
Employer 22 9.64 8 01.62 64 04.80 7 02.01
Helper in houseshold
Enterprise 34 14.91 229 46.54 239 17.95 161 46.26
Regular salaries wage
Employee 10 04.38 21 04.26 32 02.40 7 02.01
Casual wage labour in
Public Works - 1 0.20 5 01.62 1 0.28
In other types of work 60 98 307 79
Total 228 492 1331 348
% to their respective
population 7.4 6.6 12.4 5.3
Male female ratio 32:68 79:21
Source: Computed from Household Level data of NSSO 55th Round.
Women in the subsidiary category are more among migrants than among non migrants.
They dominate in the ‘Helper in the Household enterprise’ category followed by ‘Own
Account Worker’ category. Though their percentage is very small (6.6) in the female
sample population the male female ratio reveals that females dominate in the subsidiary
category in tune with their secondary status.
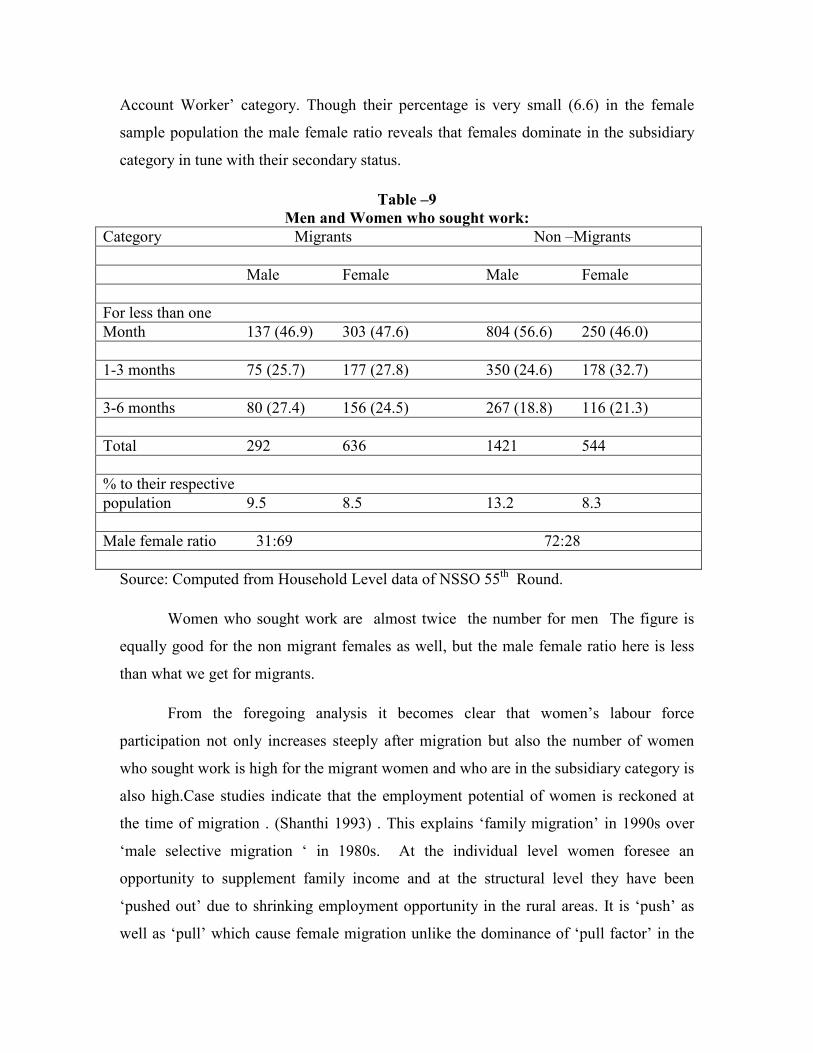
Table –9
Men and Women who sought work:
Category Migrants Non –Migrants
Male Female Male Female
For less than one
Month 137 (46.9) 303 (47.6) 804 (56.6) 250 (46.0)
1-3 months 75 (25.7) 177 (27.8) 350 (24.6) 178 (32.7)
3-6 months 80 (27.4) 156 (24.5) 267 (18.8) 116 (21.3)
Total 292 636 1421 544
% to their respective
population 9.5 8.5 13.2 8.3
Male female ratio 31:69 72:28
Source: Computed from Household Level data of NSSO 55th Round.
Women who sought work are almost twice the number for men The figure is
equally good for the non migrant females as well, but the male female ratio here is less
than what we get for migrants.
From the foregoing analysis it becomes clear that women’s labour force
participation not only increases steeply after migration but also the number of women
who sought work is high for the migrant women and who are in the subsidiary category is
also high.Case studies indicate that the employment potential of women is reckoned at
the time of migration . (Shanthi 1993) . This explains ‘family migration’ in 1990s over
‘male selective migration ‘ in 1980s. At the individual level women foresee an
opportunity to supplement family income and at the structural level they have been
‘pushed out’ due to shrinking employment opportunity in the rural areas. It is ‘push’ as
well as ‘pull’ which cause female migration unlike the dominance of ‘pull factor’ in the
case of male migration. With trade liberalization and export oriented economic
development in India there is greater demand for female labour and hence the ‘pull
factor’ is causing independent movement of young women which is being termed as’
autonomous female migration’ by Thadani and Todaro. But how ‘autonomous ‘ is this
migration is not clear since in India women are not allowed to take decisions
independently and also hardly have any control over the income they earn. But of late
young girls do migrate either with peer groups and resort to group living or they are
accompanied by elderly relatives who control their movement and activities. Such
women invariably are subjected to long hours of work under undesirable working
conditions for low wages. (Swaminathan 2002,2004). Micro level case studies indicate an
increasing trend in such autonomous female migration but national level surveys do not
capture them since no questions are posed as to who migrated first (whether the male or
the female) or migrated alone. But one can have an indirect estimate by using proxies
such as ‘headship’ and ‘marital status’.
Unattached or independent female migrants:
The marital status of the women in the age group 15-59 for the major fourteen
states in India reveals that both for high income and low income states 90-94% of the
women are married. (Table 10) .The middle income states of Tamil Nadu, Andhra
Pradesh , Karnataka, Kerala and West Bengal exhibit a lower figure. The unmarried
women constitute an insignificant percentage among the target group in low income
states.
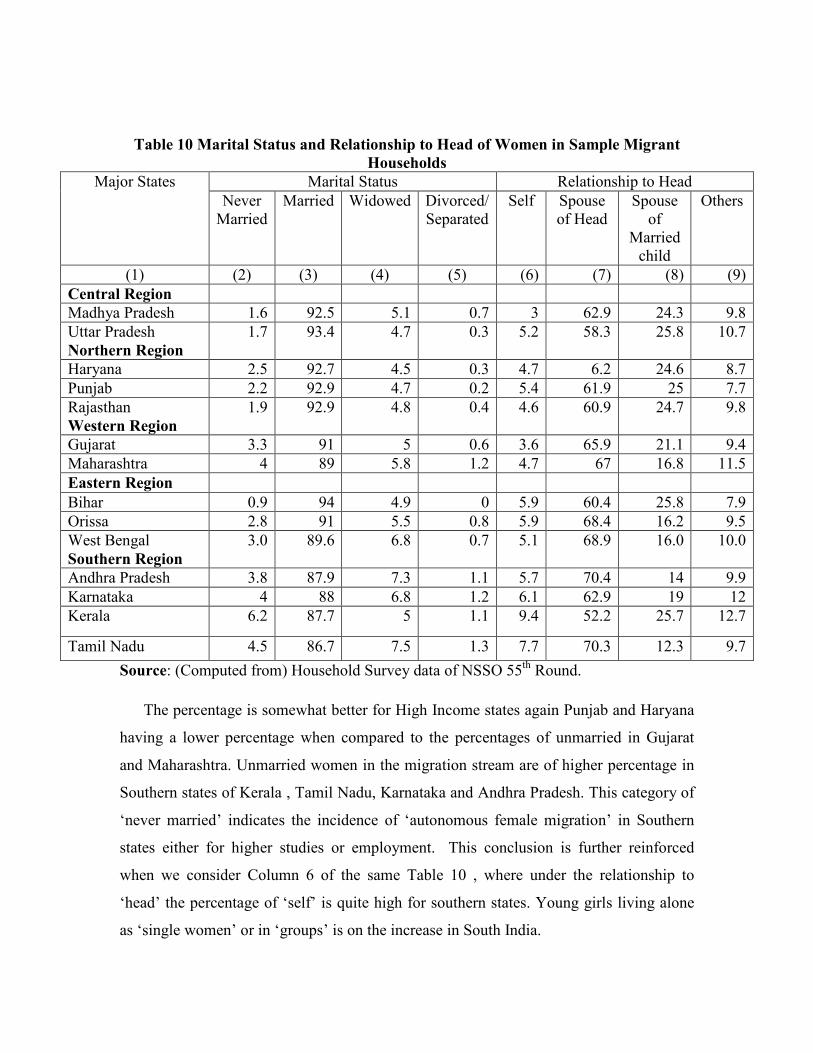
Table 10 Marital Status and Relationship to Head of Women in Sample Migrant
Households
Marital Status Relationship to Head Major States
Never
Married
Married Widowed Divorced/
Separated
Self Spouse
of Head
Spouse
of
Married
child
Others
(1) (2) (3) (4) (5) (6) (7) (8) (9)
Central Region
Madhya Pradesh 1.6 92.5 5.1 0.7 3 62.9 24.3 9.8
Uttar Pradesh
Northern Region
1.7 93.4 4.7 0.3 5.2 58.3 25.8 10.7
Haryana 2.5 92.7 4.5 0.3 4.7 6.2 24.6 8.7
Punjab 2.2 92.9 4.7 0.2 5.4 61.9 25 7.7
Rajasthan
Western Region
1.9 92.9 4.8 0.4 4.6 60.9 24.7 9.8
Gujarat 3.3 91 5 0.6 3.6 65.9 21.1 9.4
Maharashtra 4 89 5.8 1.2 4.7 67 16.8 11.5
Eastern Region
Bihar 0.9 94 4.9 0 5.9 60.4 25.8 7.9
Orissa 2.8 91 5.5 0.8 5.9 68.4 16.2 9.5
West Bengal
Southern Region
3.0 89.6 6.8 0.7 5.1 68.9 16.0 10.0
Andhra Pradesh 3.8 87.9 7.3 1.1 5.7 70.4 14 9.9
Karnataka 4 88 6.8 1.2 6.1 62.9 19 12
Kerala 6.2 87.7 5 1.1 9.4 52.2 25.7 12.7
Tamil Nadu 4.5 86.7 7.5 1.3 7.7 70.3 12.3 9.7
Source: (Computed from) Household Survey data of NSSO 55th Round.
The percentage is somewhat better for High Income states again Punjab and Haryana
having a lower percentage when compared to the percentages of unmarried in Gujarat
and Maharashtra. Unmarried women in the migration stream are of higher percentage in
Southern states of Kerala , Tamil Nadu, Karnataka and Andhra Pradesh. This category of
‘never married’ indicates the incidence of ‘autonomous female migration’ in Southern
states either for higher studies or employment. This conclusion is further reinforced
when we consider Column 6 of the same Table 10 , where under the relationship to
‘head’ the percentage of ‘self’ is quite high for southern states. Young girls living alone
as ‘single women’ or in ‘groups’ is on the increase in South India.
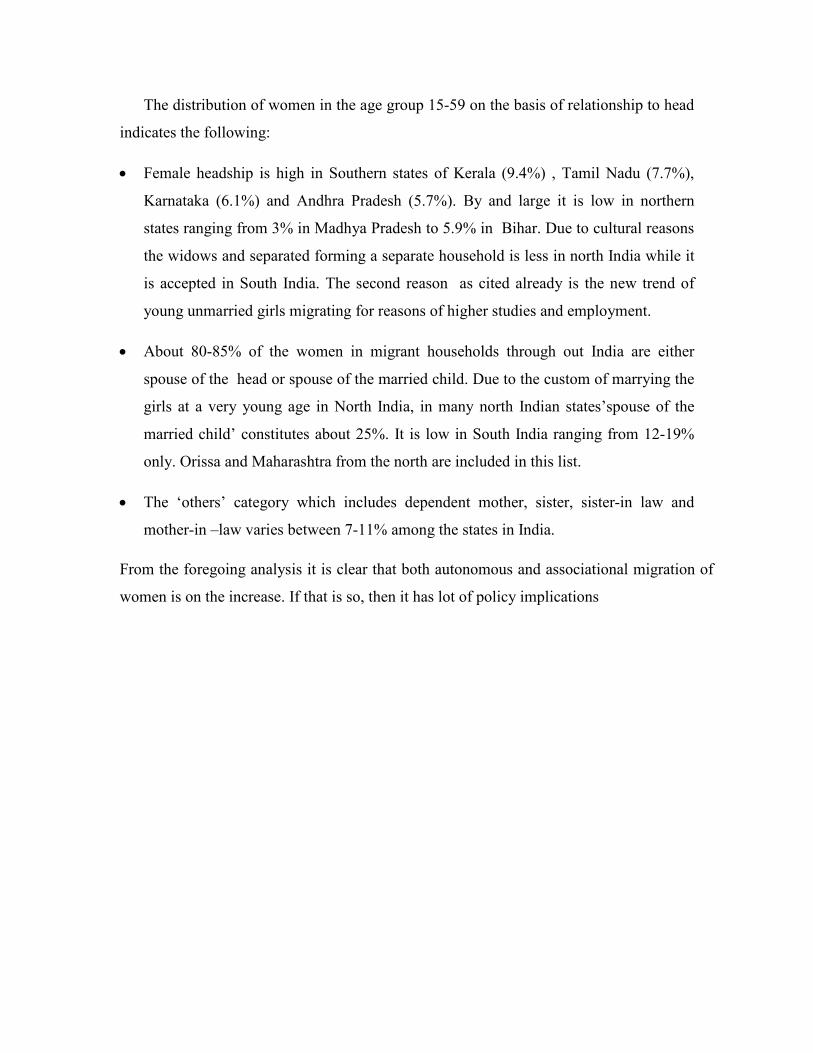
The distribution of women in the age group 15-59 on the basis of relationship to head
indicates the following:
• Female headship is high in Southern states of Kerala (9.4%) , Tamil Nadu (7.7%),
Karnataka (6.1%) and Andhra Pradesh (5.7%). By and large it is low in northern
states ranging from 3% in Madhya Pradesh to 5.9% in Bihar. Due to cultural reasons
the widows and separated forming a separate household is less in north India while it
is accepted in South India. The second reason as cited already is the new trend of
young unmarried girls migrating for reasons of higher studies and employment.
• About 80-85% of the women in migrant households through out India are either
spouse of the head or spouse of the married child. Due to the custom of marrying the
girls at a very young age in North India, in many north Indian states’spouse of the
married child’ constitutes about 25%. It is low in South India ranging from 12-19%
only. Orissa and Maharashtra from the north are included in this list.
• The ‘others’ category which includes dependent mother, sister, sister-in law and
mother-in –law varies between 7-11% among the states in India.
From the foregoing analysis it is clear that both autonomous and associational migration of
women is on the increase. If that is so, then it has lot of policy implications
Section III
Issues and Policy Imperatives
Migration is generally expected to have empowering impact on women in terms
of increased labour force participation, decline in fertility, economic independence and
higher self esteem. But this does not always happen. Female rural to urban migrants
continue to be vulnerable to gender based discrimination in wages and labour market
segmentation which reserve the most repetitive , unskilled, monotonous jobs for women.
They mostly work in the informal sector and experience long working hours for a very
low income, unhealthy and or dangerous working conditions, and psychological, physical
and sexual aggression. While men normally work in groups women go for individualized
work environments (eg. Domestic service) where there is greater isolation with the least
possibility of establishing networks of information and social support . So measures
designed to ‘protect’ migrants must be accompanied by measures that empower them.
In female labour migration the issues to be addressed are many
(a) How safe are the autonomous female migrants ? Do they fall prey in the hands of
traffickers ? Have they benefited due to migration ? Would they prefer to go back
if employment opportunities cease to exist in the destination area ?
(b) In the case of associational migrants , are they overburdened with work in the
absence of traditional kith and kin support systems? Do the men share the
household chores ? Do the women get toilet facility in the destination area ? How
do they perceive their new role- empowering or disempowering ?
(c) In the case of male migration and family left behind in the rural area how do the
women cope with the farm /non farm work in the village ? Are the remittances
adequate ? Do they work to supplement the meager remittances and if so how are
they valued for their contribution ? How do they perceive the change ? What
happens to those households where the males have severed their connections with
the rural household and remarried in the destination area to form a new
household ?
(d) What happens to the elderly especially the female elderly who are left behind in
the village of origin in majority of the above cases ?
Conclusion:
Micro level case studies indicate high levels of rural urban migration among
females for reasons of employment. From the secondary data it is unable to prove it since
autonomous and associational migration are clubbed and moreover the reason for
migration is identified with marriage. But unlike in earlier years where male selective
migration was predominant , the latest trend is one of family migration where both the
male and female migrate in search of employment . This is ascertained through the labour
force participation data for women before and after migration using the latest migration
data of NSSO 55 th Round. Since 2001 Census data is yet to be made available there is
no way of affirming our conclusions by rechecking with the broad trends of Census data.
In view of rising urban -ward migration and increased labour force participation of
women after migration, questions related to sanitation, water, housing. educational and
infrastructural needs require greater attention at the level of policy planning and
implementation. Since women are a highly heterogeneous group migration among
females should not only be understood as a poverty reducing strategy but also as a
strategy of economic diversification , upward mobility and desire for personal growth and
autonomy.
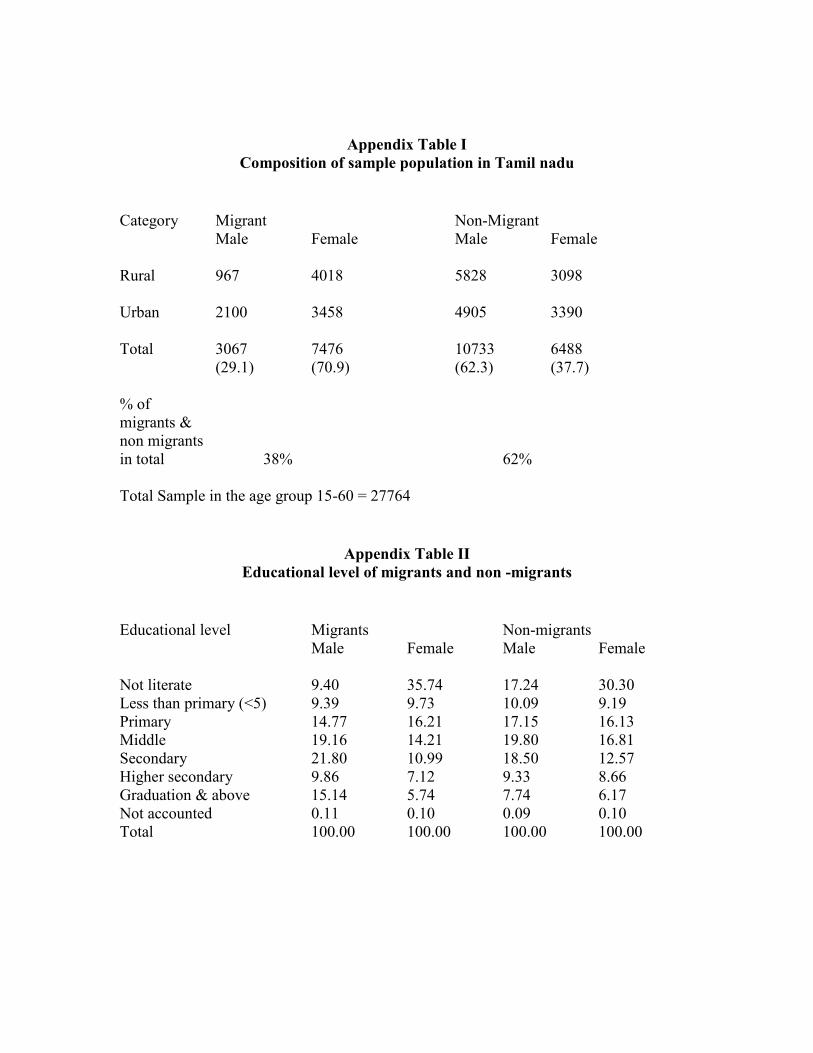
Appendix Table I
Composition of sample population in Tamil nadu
Category Migrant Non-Migrant
Male Female Male Female
Rural 967 4018 5828 3098
Urban 2100 3458 4905 3390
Total 3067 7476 10733 6488
(29.1) (70.9) (62.3) (37.7)
% of
migrants &
non migrants
in total 38% 62%
Total Sample in the age group 15-60 = 27764
Appendix Table II
Educational level of migrants and non -migrants
Educational level Migrants Non-migrants
Male Female Male Female
Not literate 9.40 35.74 17.24 30.30
Less than primary (<5) 9.39 9.73 10.09 9.19
Primary 14.77 16.21 17.15 16.13
Middle 19.16 14.21 19.80 16.81
Secondary 21.80 10.99 18.50 12.57
Higher secondary 9.86 7.12 9.33 8.66
Graduation & above 15.14 5.74 7.74 6.17
Not accounted 0.11 0.10 0.09 0.10
Total 100.00 100.00 100.00 100.00
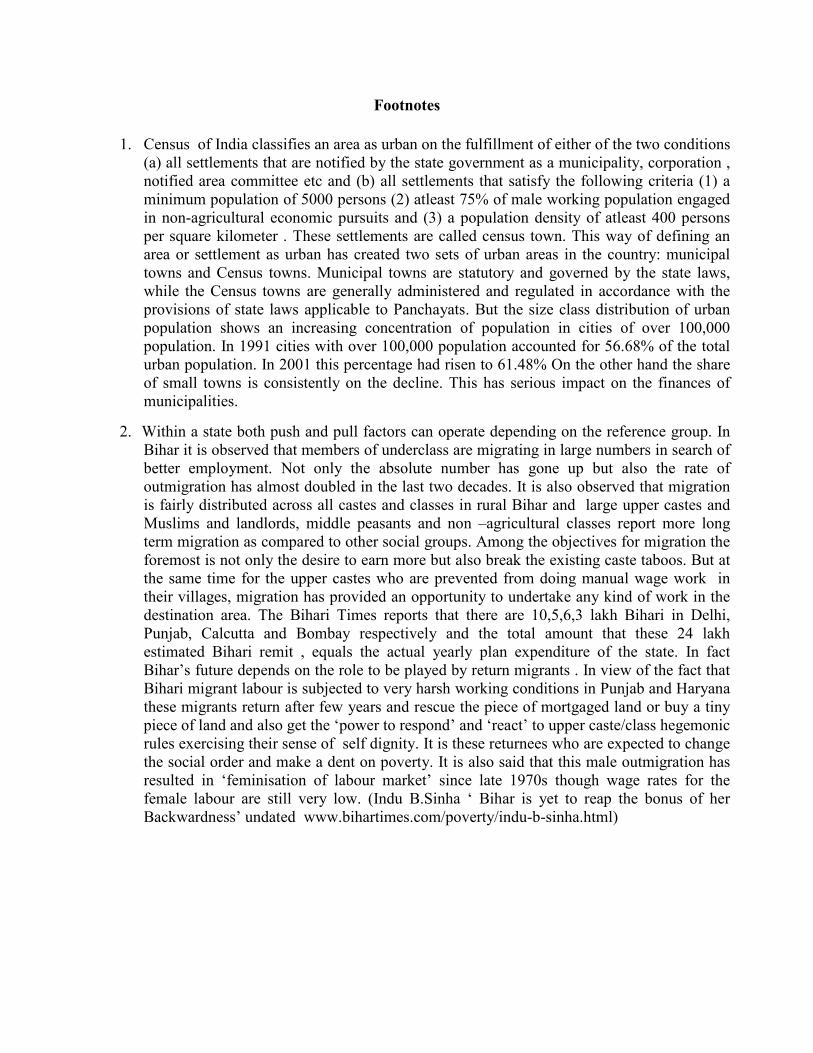
Footnotes
1. Census of India classifies an area as urban on the fulfillment of either of the two conditions
(a) all settlements that are notified by the state government as a municipality, corporation ,
notified area committee etc and (b) all settlements that satisfy the following criteria (1) a
minimum population of 5000 persons (2) atleast 75% of male working population engaged
in non-agricultural economic pursuits and (3) a population density of atleast 400 persons
per square kilometer . These settlements are called census town. This way of defining an
area or settlement as urban has created two sets of urban areas in the country: municipal
towns and Census towns. Municipal towns are statutory and governed by the state laws,
while the Census towns are generally administered and regulated in accordance with the
provisions of state laws applicable to Panchayats. But the size class distribution of urban
population shows an increasing concentration of population in cities of over 100,000
population. In 1991 cities with over 100,000 population accounted for 56.68% of the total
urban population. In 2001 this percentage had risen to 61.48% On the other hand the share
of small towns is consistently on the decline. This has serious impact on the finances of
municipalities.
2. Within a state both push and pull factors can operate depending on the reference group. In
Bihar it is observed that members of underclass are migrating in large numbers in search of
better employment. Not only the absolute number has gone up but also the rate of
outmigration has almost doubled in the last two decades. It is also observed that migration
is fairly distributed across all castes and classes in rural Bihar and large upper castes and
Muslims and landlords, middle peasants and non –agricultural classes report more long
term migration as compared to other social groups. Among the objectives for migration the
foremost is not only the desire to earn more but also break the existing caste taboos. But at
the same time for the upper castes who are prevented from doing manual wage work in
their villages, migration has provided an opportunity to undertake any kind of work in the
destination area. The Bihari Times reports that there are 10,5,6,3 lakh Bihari in Delhi,
Punjab, Calcutta and Bombay respectively and the total amount that these 24 lakh
estimated Bihari remit , equals the actual yearly plan expenditure of the state. In fact
Bihar’s future depends on the role to be played by return migrants . In view of the fact that
Bihari migrant labour is subjected to very harsh working conditions in Punjab and Haryana
these migrants return after few years and rescue the piece of mortgaged land or buy a tiny
piece of land and also get the ‘power to respond’ and ‘react’ to upper caste/class hegemonic
rules exercising their sense of self dignity. It is these returnees who are expected to change
the social order and make a dent on poverty. It is also said that this male outmigration has
resulted in ‘feminisation of labour market’ since late 1970s though wage rates for the
female labour are still very low. (Indu B.Sinha ‘ Bihar is yet to reap the bonus of her
Backwardness’ undated www.bihartimes.com/poverty/indu-b-sinha.html)
3. Studies conclude that though in recent decades economic disparities between states
has increased this has not generated a rise in out-migration rates from poor states or
in-migration rates to better-off states. (Kundu & S.Gupta 2000).
4. The conceptual framework to analyse female migration behaviour as developed by Thadani
and Todaro calls for judicious combination of quantitative as well as qualitative
information. In their model, migration of women (both unattached and associational)
irrespective of their education is assumed to be determined jointly by economic and social
forces while being constrained by cultural , sex-role prescriptions.
5. The setting up of export processing zones not only changed the pattern of female migration
but also increased the proportion of women in the labour force who are mainly in paid
employment. The preference for woman employees was mainly because they accepted
lower than reservation wage, were not unionised and do not protest much against
unpleasant working conditions. All this has resulted in poorer health conditions and further
worsening of work burden on women.
6. Case studies indicate that it is the males who were’associational migrants’ and not the
women . Families had migrated ir response to female economic opportunity ( as domestic
servants, as vegetable vendors, flower vendors A study on domestic workers by Neetha
comes to the conclusion that migration for domestic service is largely a female driven
phenomenon based on personal and social relationships. Social networking, largely female
centered ,influences migration decisions , the process of migration and also the day to day
lives of the migrants. Refer Neetha.N. 2002 ‘Migration Social Networking and
Employment: A Study of Domestic Workers in Delhi’. NLI R.S.No 037/2002
Reference:
Arizpe,Lourdes (1981) ‘Relay Migration and the Survival of the Peasant Household’ (ed)
Jorge Balan ‘Why People Move’ UNESCO Press, Paris.
Breman.J.(1985)’Of Peasants.Migrants and Paupers: Rural Labour Circulation and Capitalist
Production in Western India’OxfordUniversityPress New Delhi.
Chantavanich.S. 2001 ‘Female Labour Migration in South East Asia :Change and Continuity’
ARCM, Institute of Asian Studies , Chulanlongkorn University p-4
Connell.J.B. Das Gupta,Laish Ley& M.Lipton(1976) ‘Migration from Rural Areas:The
Evidence from Village Studies, Oxford University Press,New Delhi.
De Hann (1999)’Livelihoods and Poverty : The Role of Migration- A critical Review of
Migration Literature’ Journal of Development Studies ‘ Vol 36 No2
Fawcett.J.T.,Khoo.S. & Smith P.C. (1984)’Women in the Cities of Asia:Migration and Urban
Adaptation ‘ Westview Press Boulder Colorado.
Fernandez-Kelly & Maria Patricia (1983) ‘Mexican Border, Industrialisation ,Female Labour
Force Participation and Migration’ in June Nash, Maria Patricia & Fernandex-Kelly
(ed)’Women, Men and International Division of Labour’ State University of New
York Press, Albany, New York pp 205-223.
Gamburd .M. 2000 ‘The Kitchen Spoon’s Handle: Transnationalism and Sri Lanka’s Migrant
Housemaids, New York, Cornell University Press.
Haan de Arjan 2000’Migrants , Livelihoods and Rights : The Relevance of Migration in
Development Policies’ Social Development W.P.No 4 Feb.
Hugo .G. 2000 ‘Migration and Women’s Empowerment ‘ in (ed) H.B.Pressler & G.Sen
‘Women’s Empowerment and Demographic Processes’ Oxford University Press,
Oxford.
Hugo Graeme 1993 ‘Migration and Rural-Urban Linkages in the ESCAP Region ‘Migration
and Urbanisation in Asia and the Pacific: Interreltionships with Socio-economic
Development and Evolving Policy Issues, United Nations , New York.
Heyzer.N. (1982) ‘From Rural Subsistence to an Industrial Peripheral Workforce: An
Examination of Female Malaysian Migrants and Capital Accumulation in Singapore’
in L.Baneria (ed)’ Women and Development’ Praeger for IlO, Geneva.
Kabeer.N. 2000 ‘The Power to Choose, Bangladeshi Women and Labour Market Decisions
in London and Dhaka ‘ London and New York Verso Press
Karlekar Malavika 1995 ‘Gender Dimensions in Labour Migration: An Over-view’ in
Schenk Sandbergen (ed) ‘Women and Seasonal Labour Migration’ IDPAD Sage ,
New Delhi.
Khoo Siew-Ean (1984) ‘Urbanward Migration and Employment of Women in South East and
East Asian Cities: Patterns and Policy Issues’ in Gavin W.Jones (ed)’ Women in the
Urban and Industrial Workforce:’ Southeast and East Asia Development Studies
Centre Monograph No 33 Australian National University Canberra pp 277-292.
Kundu& S.Gupta 2000 ‘Declining Population Mobility, Liberalisation and Growing Regional
Imbalances , the Indian Case’ in A.Kundu (ed) ‘Inequality, Mobility and
Urbanisation’ New Delhi ICSSER and Manak Publications pp 257-74.
Kundu Amitabh & Shalini Gupta 1996 ‘Migration , Urbanisation and Regional Inequality’
EPW Dec 29 pp 3391-3398
Mathur Om Prakash 2004 ‘India’s Municipal Sector: A Study for the Twelfth Finance
Commission ‘ NIPF&P New Delhi.
Meher Rajkishor 1994 ‘The Migrant Female Breadwinners- Women in the Informal
Secondary Sector of Rourkela , Orissa’ Indian Journal of Labour Economics , Vol 37
No 3 July- Sep.
Premi K.Mahendra 2001 ‘Who Migrates to Delhi’ Demography India Vol 30 No 1 pp 49-59.
Rao. M.S.A. (1986) (Ed) Studies in Differentiation: Internal and International Migration in
India , Manohar Publications New Delhi,
Rodgers Gerry and Ja nine Rodgers 2000’Semi Feudalism Meets the Market: A Report from
Purnea ‘ W.P Series No 6 Institute for Human Development , New Delhi.
Saradamoni.K. 1995 ‘Crisis in the Fishing Industry and Women’s Migration: The Case of
Kerala’ in Schenk Sandbergen (ed) Women and Seasonal Labour Migration’
IDPAD Sage New Delhi.
Sassen Koob (1984) ‘Notes on the Incorporation of Third World Women into Wage Labour
through Imigration and Off-shore Production’ International Migration Review
18,68,pp 144-67
Sen, Amartya 2001 ‘Many faces of Gender Inequality’ Frontline Vol 18 No 22 Oct/Nov.
Shanthi.K. 1991’Issues relating to Economic Migration of Females’ The Indian Journal of
Labour Economics. Vol 34 No 4 pp 335-346.
Shanthi.K. 1993 ‘Female Mobility andGender Dimensions in Labour Migration’ Institute for
Economic Development Discussion Paper Series No 32. Nov. Boston University,
Boston.
Sharma A.N. et al 2000 ‘Dynamics of Employment, Poverty and Human Development in
Rural Bihar , Institute for Human Development New Delhi (Memio)
Singh A.M. (1978) ‘Rural Urban Migration of Women among the Urban Poor in India:
Causes and Consequences . Social Action Vol 24 nNo 3
Singh A.M. (1984) ‘Rural to Urban Migration of Women in India : Patterns and Implications’
in Fawcett (1984) op cit
Srivastava Ravi Sanghita Bhattacharyya 2003 ‘Globalization ., Reforms and Internal Labour
Mobility: Analysis of Recent Indian Trends’ Labour and Development Vol 9 No 2
Dec.
Srivastava Ravi 1998 ‘ Migration and Labour Market in India’ Indian Journal of labour
Economics Vol 41 No 4 Oct –Dec 1998.
Shukla Sandhya 1997 ‘’Feminisms of the Diaspora Both Local and Global : The Politics of
South Asian Women Against Domestic Violence’ in Women Question Politics (ed)
Cathy Cohen , Kathleen Jones and Joan Tronto New York University Press , New
York 269-83.
Stark Oded J. 1991 ‘Relative Deprivation and Migration: Theory Evidence and Policy
Implications ‘ in ‘Determinants of Emigration from Mexico , Central America and
the Caribbean’ (ed) Sergio Diaz-Briquets and Sidney Weintraub Boulder Westview
Colorado 121-44.
Swaminathan , P. (2002). “Labor-Intensive Industries But Units Without ‘Workers’: Where
Will ILO’s Social Dialogue Begin?” Working Paper No. 168, Madras Institute of
Development Studies, Chennai, April.
Swaminathan P. (2004). “The Trauma of ‘Wage Employment’ and the ‘Burden of Work’ for
Women in India: Evidences and Experiences Working Paper No. 186, Madras
Institute of Development Studies, Chennai, April.
Thadani .V. & Todaro .M. (1984) ‘Female Migration : A Conceptual Framework’ in Fawcett
et al (1984).
Teerink Rensje 1995 ‘Migration and its impact on Khandeshi Women in the Sugarcane
Harvest’ in Schenk Sandbergen (ed)’ Women and Seasonal Labour Migration’
IDPAD Sage New Delhi.
Tim Dyson and Pravin Visaria 2004 ‘Migration and Urbanisation : Retrospect and Prospect’
in (ed) Tim Dyson , Robert Cassen and Leela Visaria ‘ Twenty First Century India :
Population, Economy, Human Development and the Environment London OUP
United Nations 2005 ‘2004 World Survey on the Role of Women in Development:Women
and International Migration ‘ Department of economic and Social Affairs , Division
for the Advancement of Women.
United Nations 2004’Report of the Consultative Meeting on Migration and Mobility and
How This Movement Affects Women’ New York.
Zhou Min 1992 ‘Chinatown: The Socio Economic Potential of an Urban Enclave ‘ Temple
University Press. Philadelphia.
Recommended