GE 178 Lecture 5: Principles of Aerial Photography and Photo Scale Determination
Aerial Photo (Image) vs Map
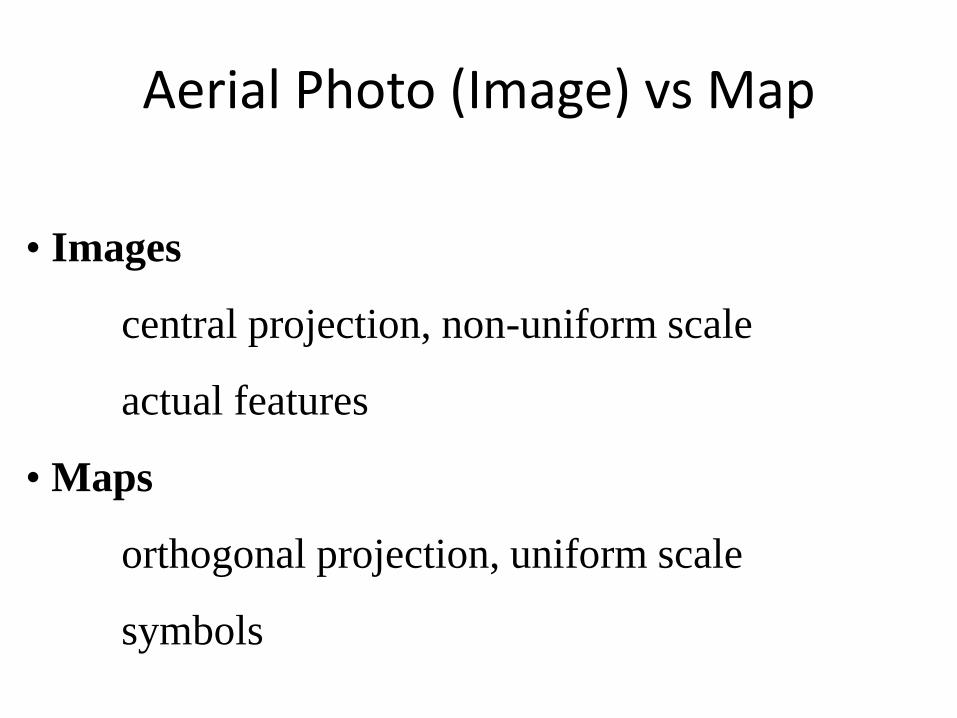
• Images
central projection, non-uniform scale
actual features
• Maps
orthogonal projection, uniform scale
symbols
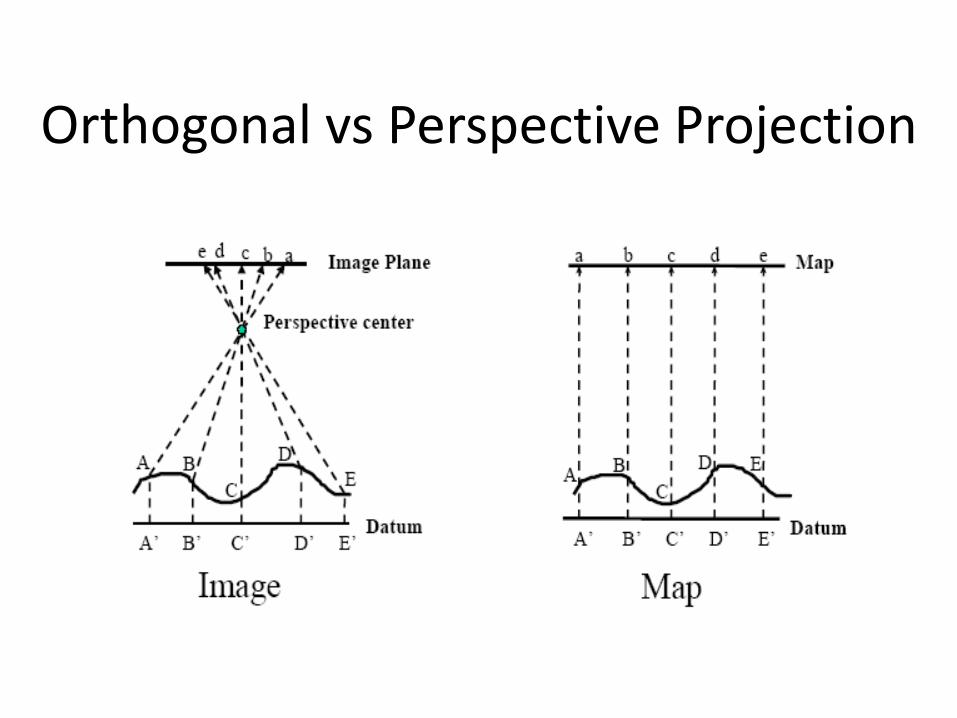
Orthogonal vs Perspective Projection
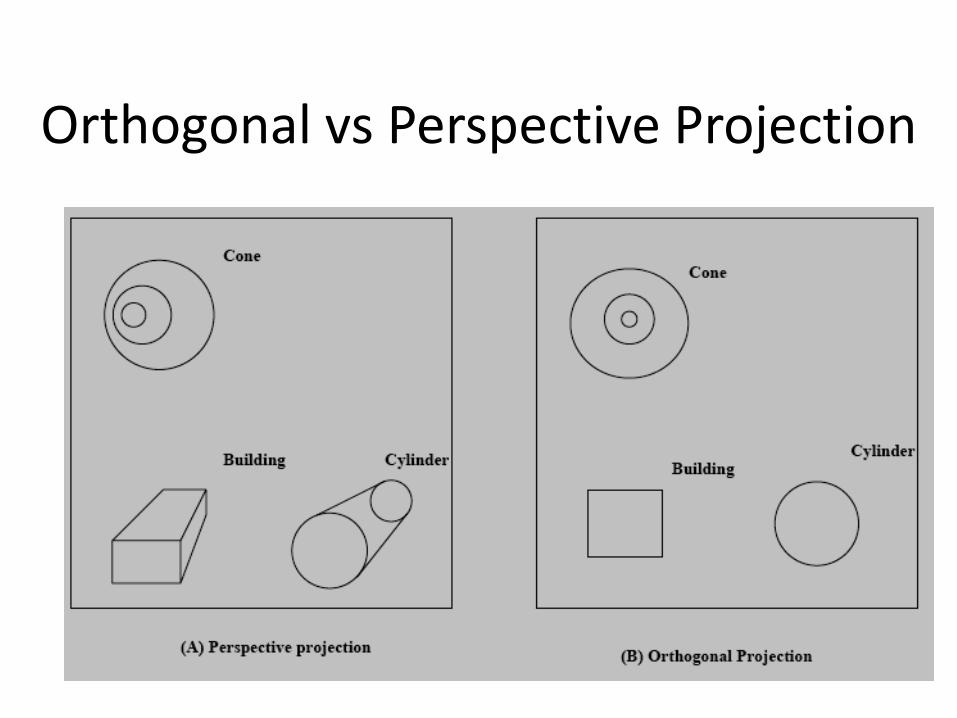
Orthogonal vs Perspective Projection
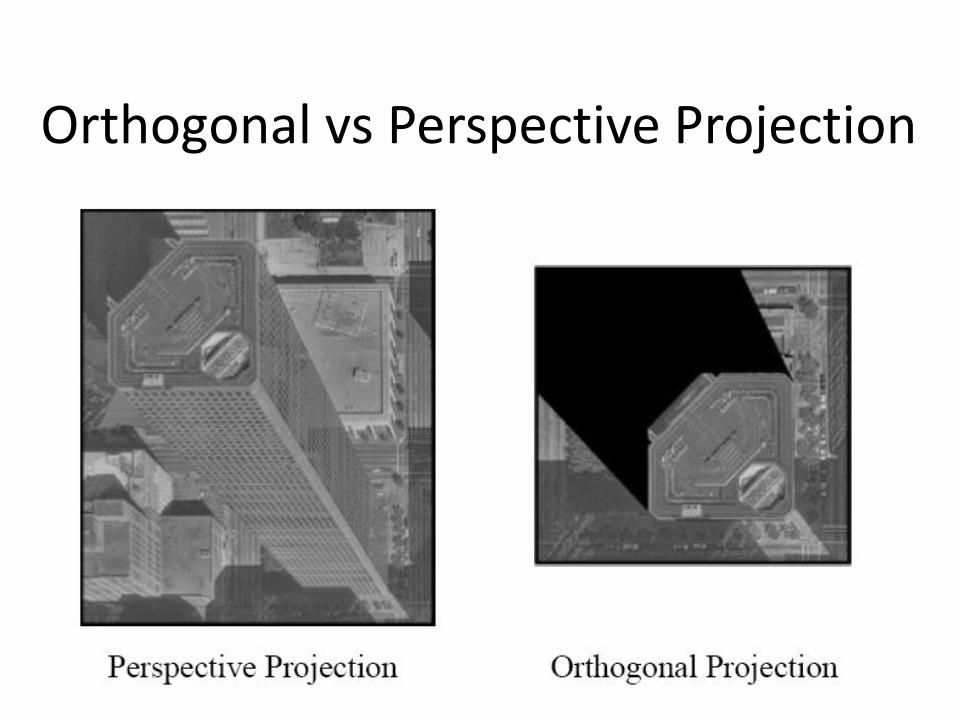
Orthogonal vs Perspective Projection
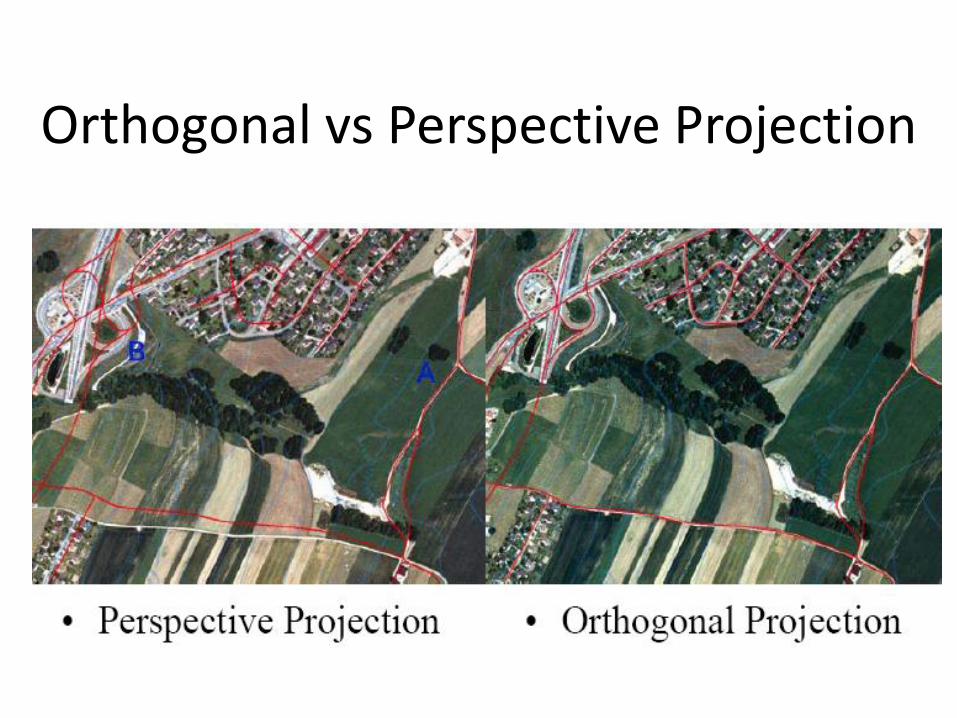
Orthogonal vs Perspective Projection
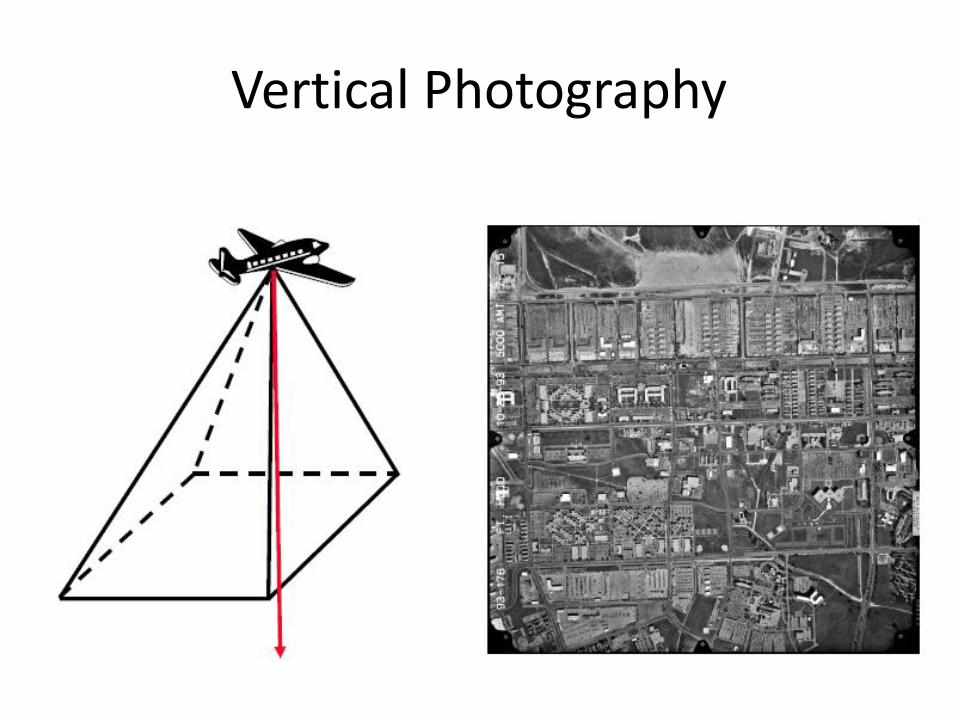
Vertical Photography
Vertical Aerial Photograph
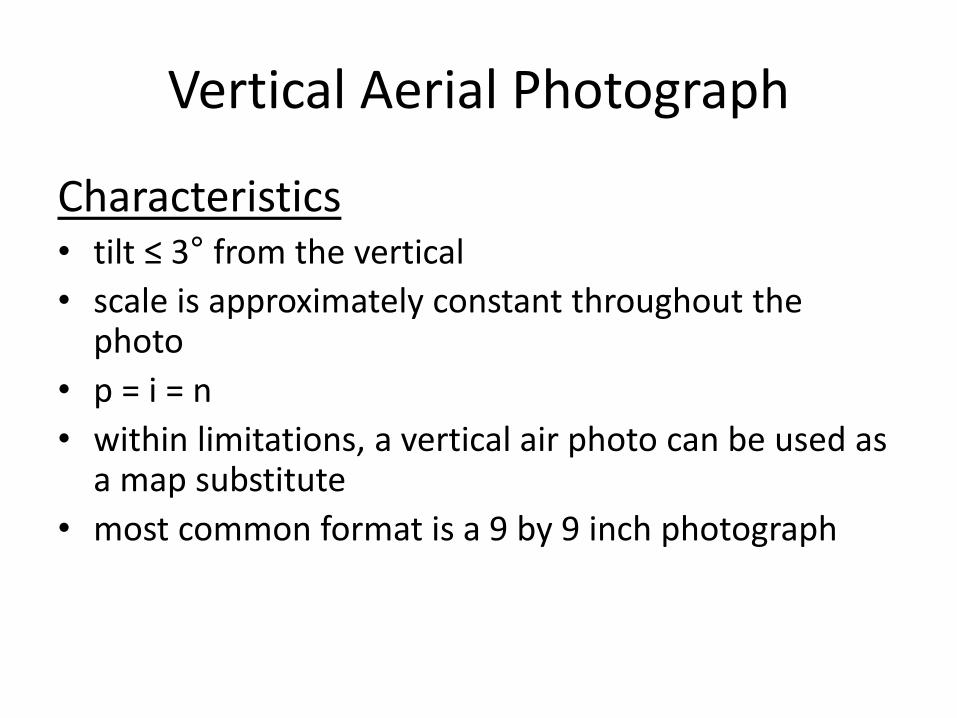
Characteristics • tilt ≤ 3° from the vertical
• scale is approximately constant throughout the photo
• p = i = n
• within limitations, a vertical air photo can be used as a map substitute
• most common format is a 9 by 9 inch photograph
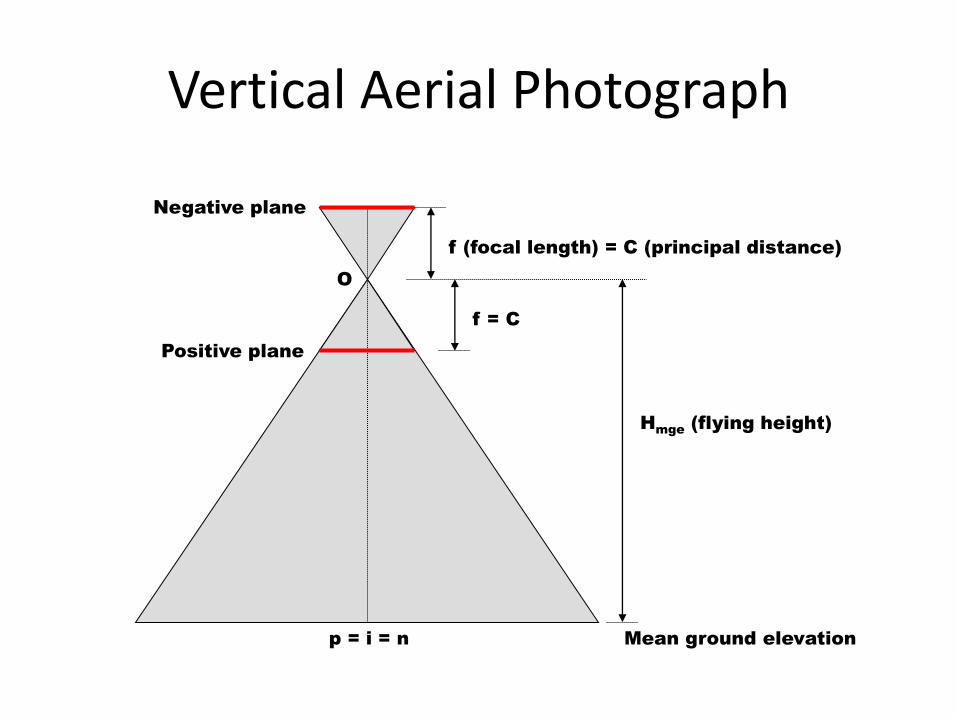
Negative plane
Positive plane
Mean ground elevation
f (focal length) = C (principal distance)
Hmge
(flying height)
f = C
O
p = i = n
Vertical Aerial Photograph
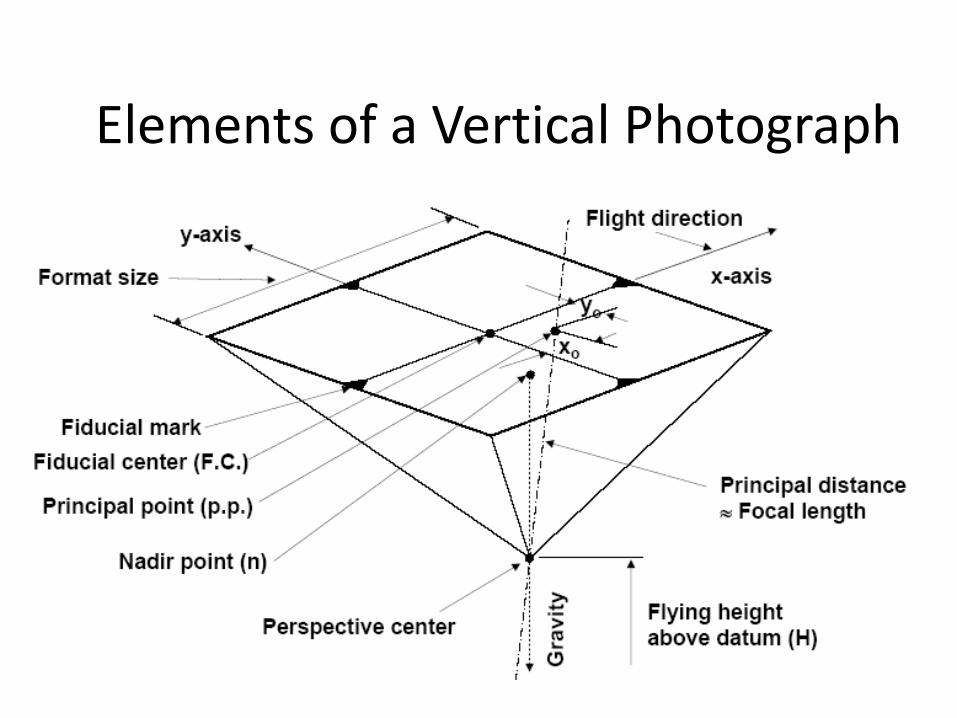
Elements of a Vertical Photograph
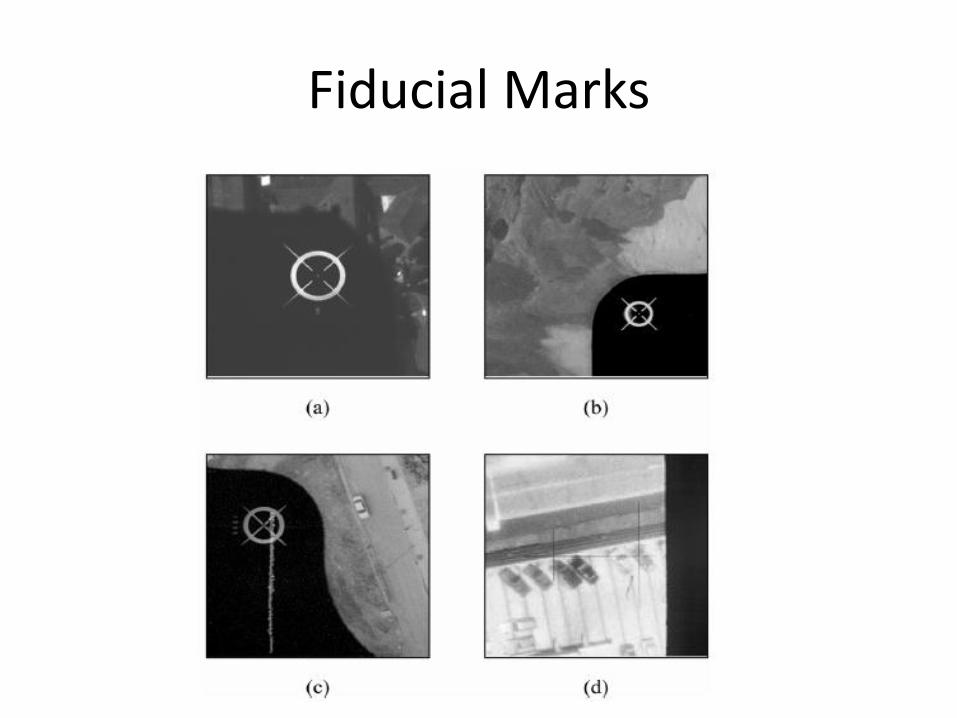
Fiducial Marks
• optically projected geometric figures located at either the four corners of a photograph, or on the four sides of a photograph
• define the coordinate axes and geometric center of a single aerial photograph
• Intersection represents the principal point of the photograph
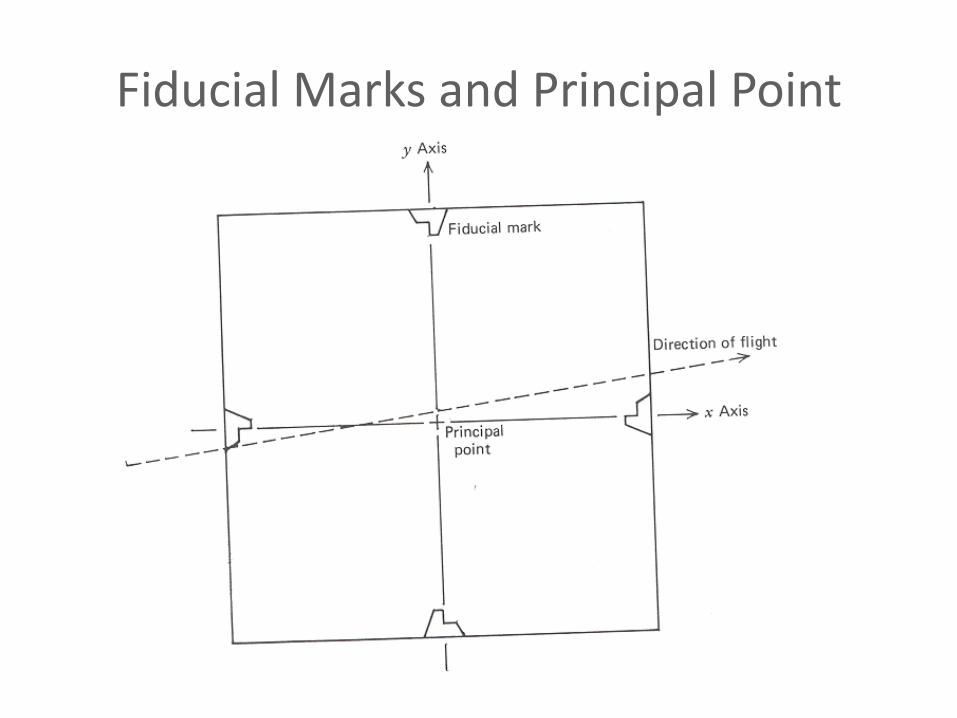
Fiducial Marks and Principal Point
Fiducial Marks
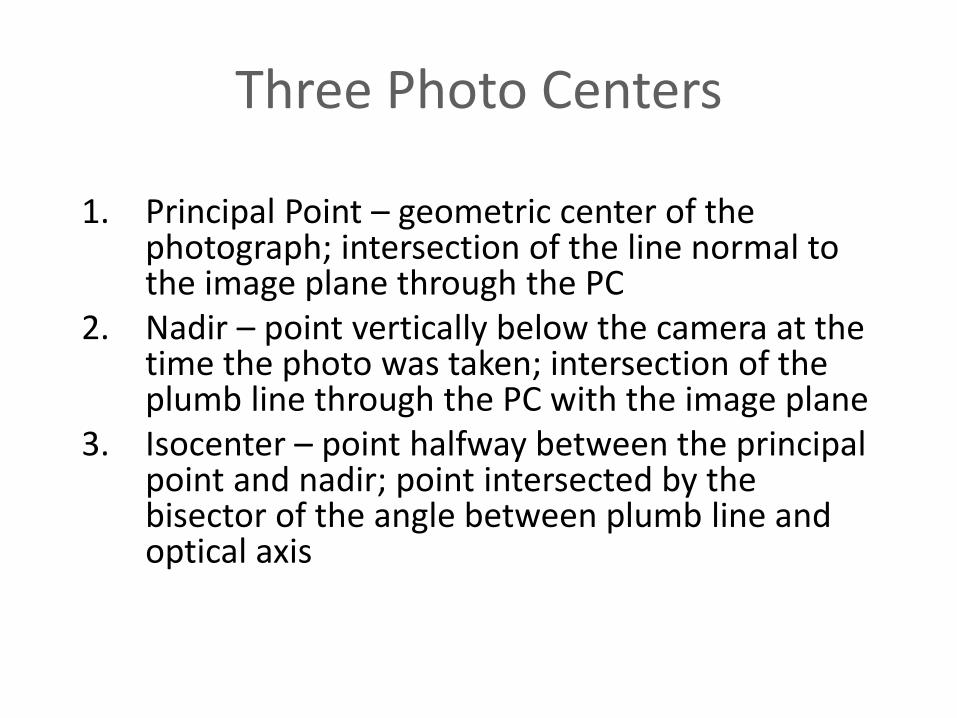
Three Photo Centers
1. Principal Point – geometric center of the photograph; intersection of the line normal to the image plane through the PC
2. Nadir – point vertically below the camera at the time the photo was taken; intersection of the plumb line through the PC with the image plane
3. Isocenter – point halfway between the principal point and nadir; point intersected by the bisector of the angle between plumb line and optical axis
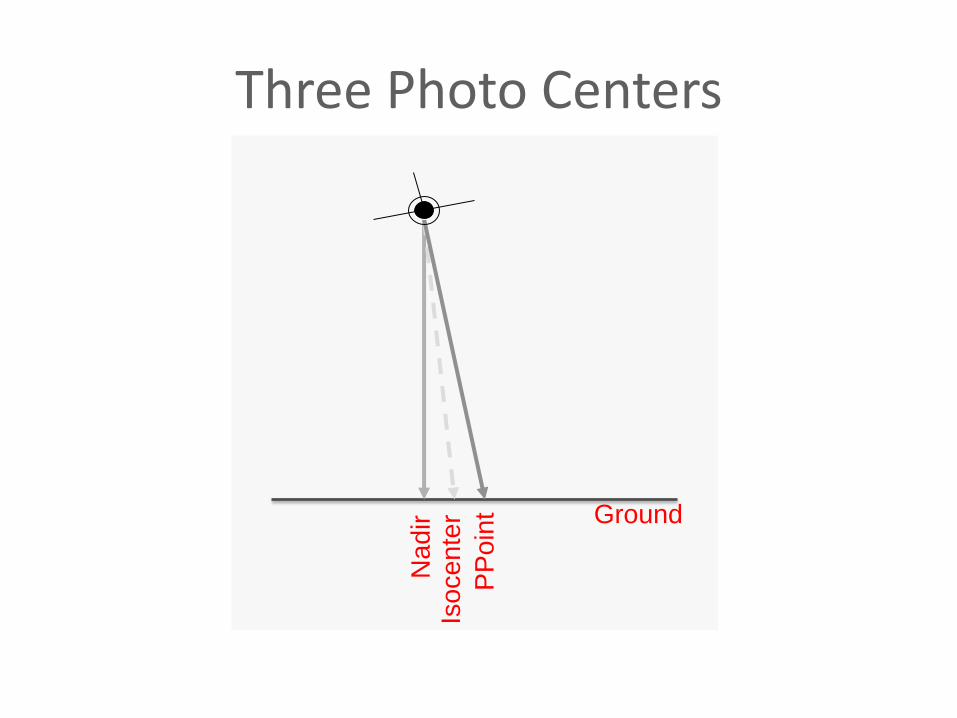
Three Photo Centers
Ground
Na
dir
Is
oce
nte
r
PP
oin
t
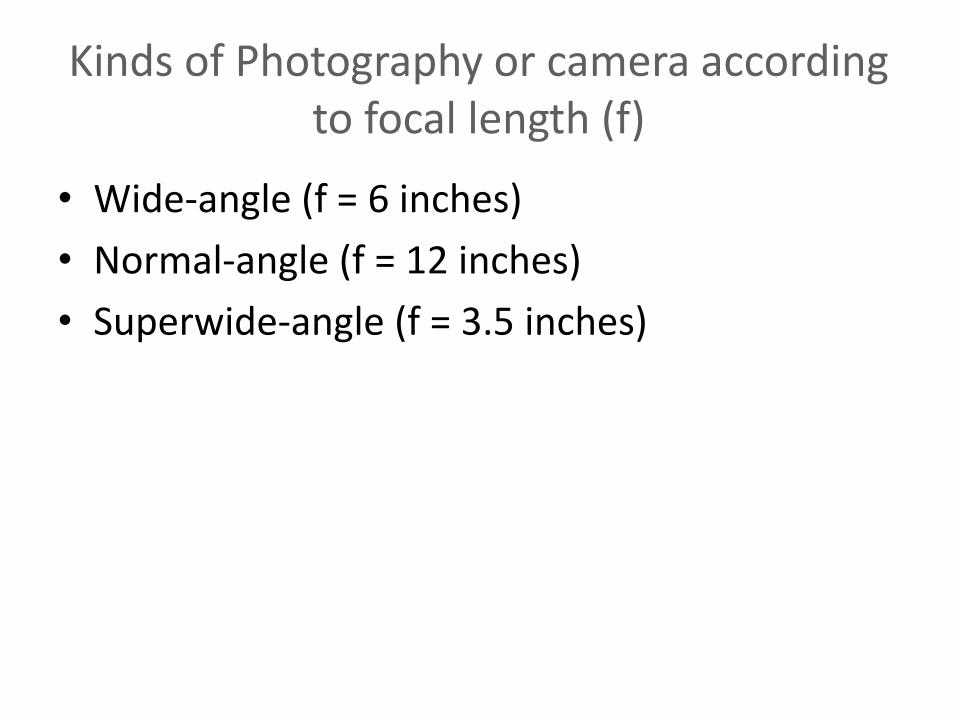
Kinds of Photography or camera according to focal length (f)
• Wide-angle (f = 6 inches)
• Normal-angle (f = 12 inches)
• Superwide-angle (f = 3.5 inches)
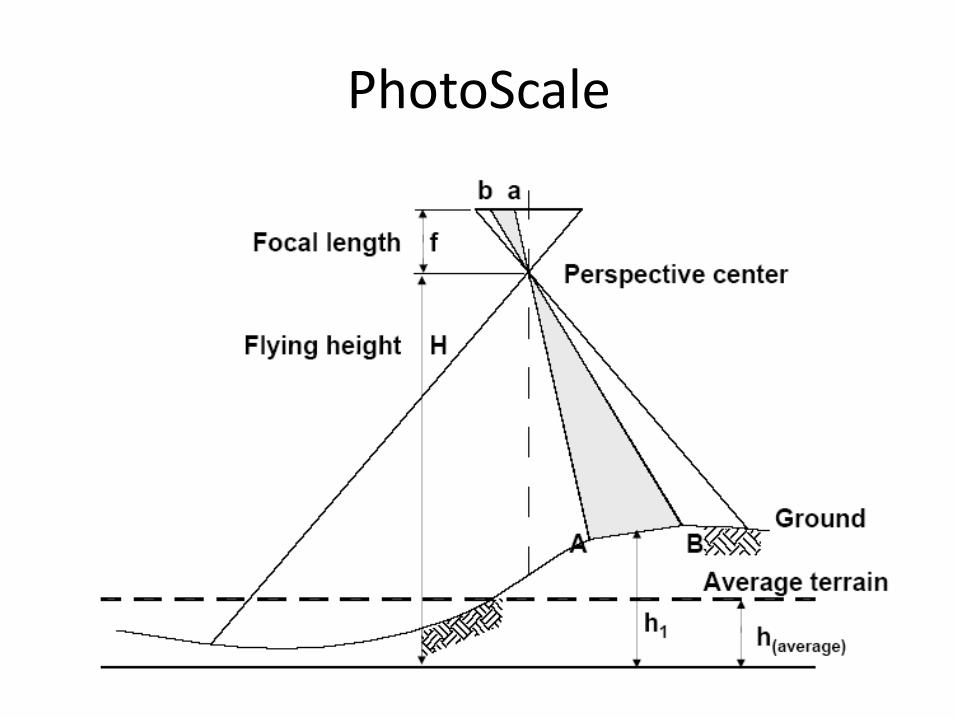
PhotoScale
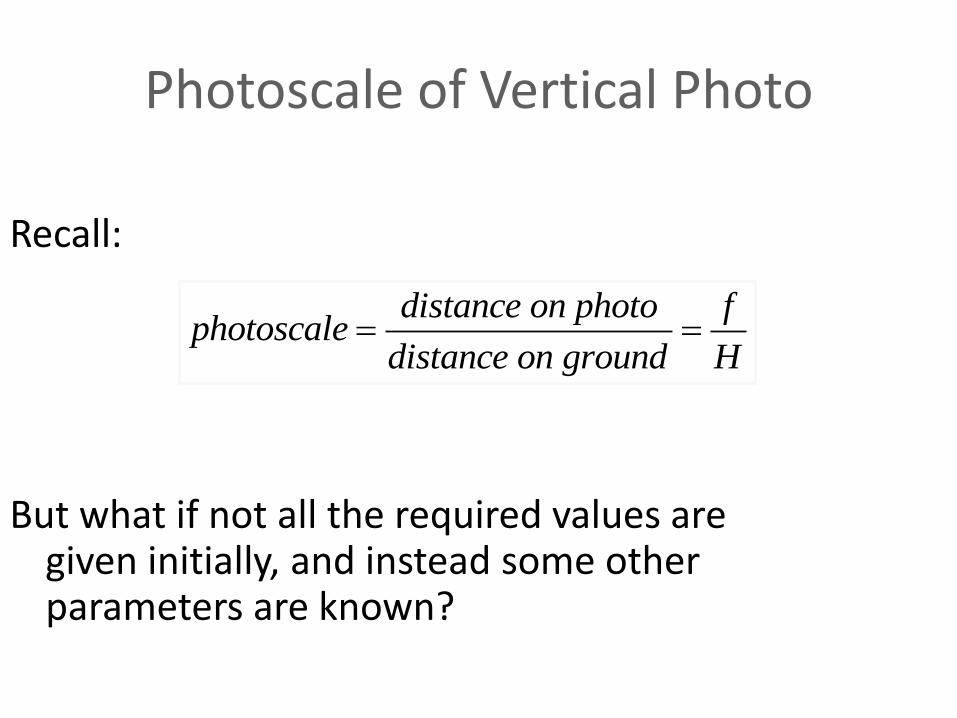
Photoscale of Vertical Photo
distance on photo fphotoscale
distance on ground H
Recall:
But what if not all the required values are given initially, and instead some other parameters are known?
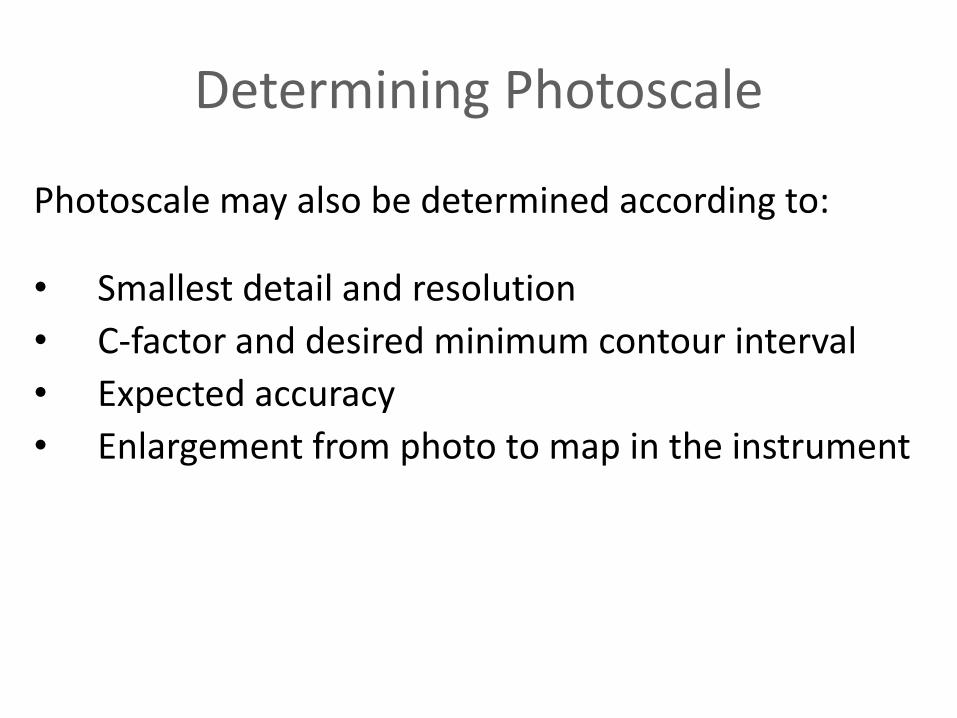
Determining Photoscale
Photoscale may also be determined according to:
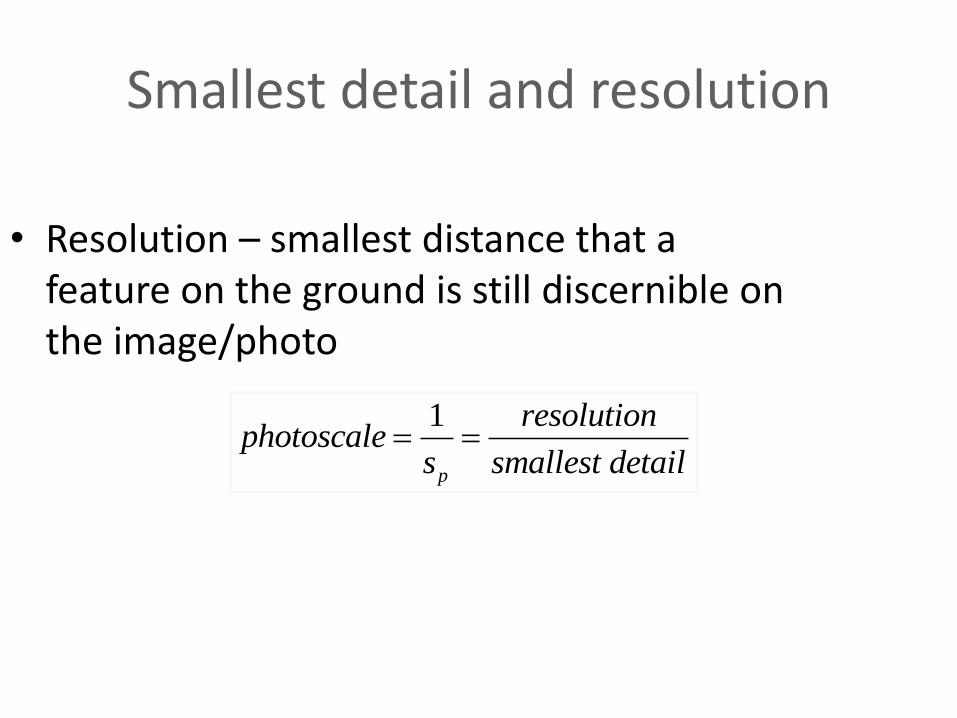
• Smallest detail and resolution
• C-factor and desired minimum contour interval
• Expected accuracy
• Enlargement from photo to map in the instrument
Smallest detail and resolution
1
p
resolutionphotoscale
s smallest detail
• Resolution – smallest distance that a feature on the ground is still discernible on the image/photo
Smallest detail and resolution
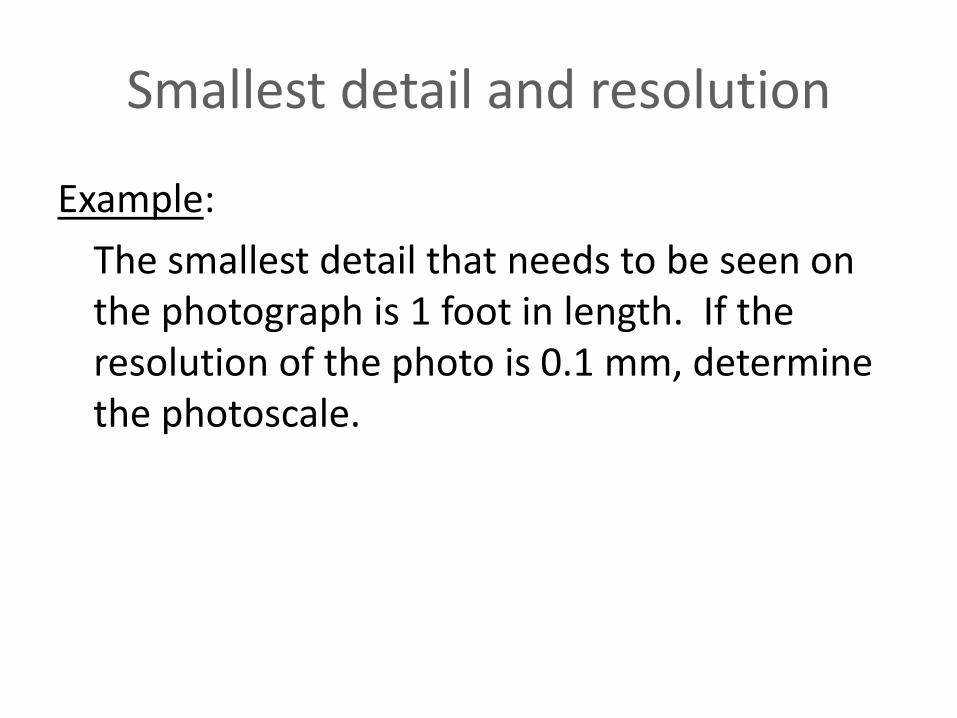
Example:
The smallest detail that needs to be seen on the photograph is 1 foot in length. If the resolution of the photo is 0.1 mm, determine the photoscale.
Smallest detail and resolution
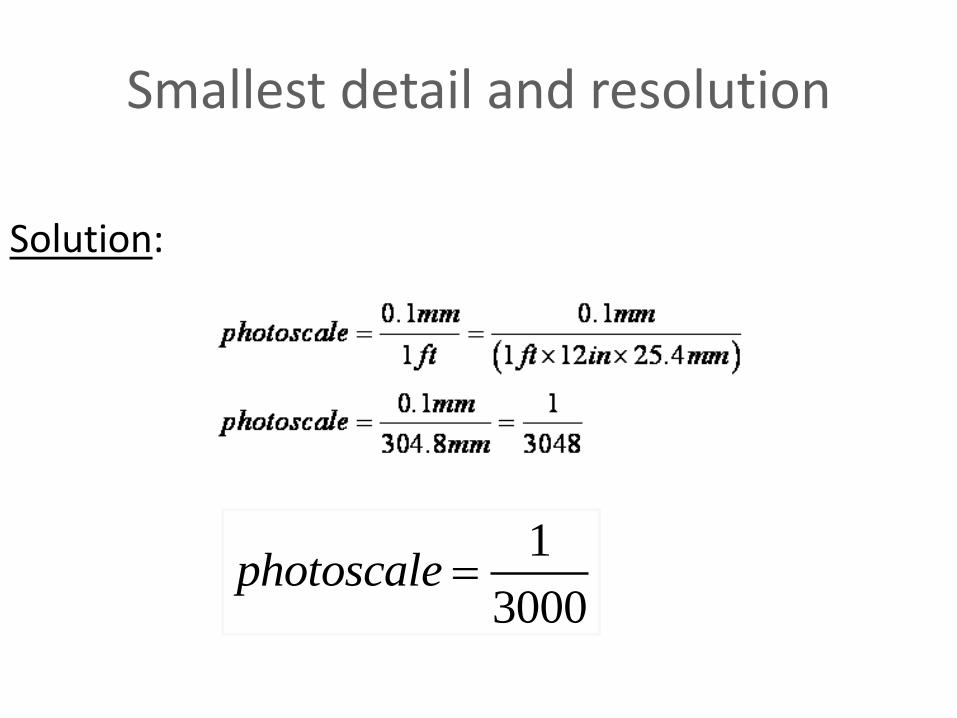
Solution:
1
3000photoscale
C-factor and desired minimum contour interval
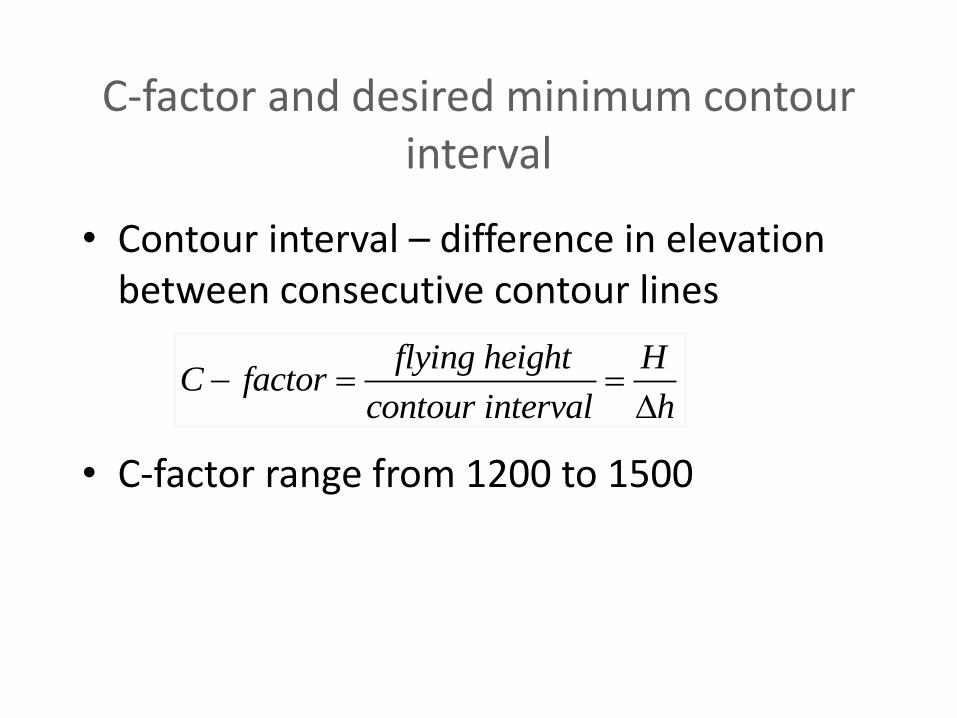
• Contour interval – difference in elevation between consecutive contour lines
• C-factor range from 1200 to 1500
flying height HC factor
contour interval h
C-factor and desired minimum contour interval
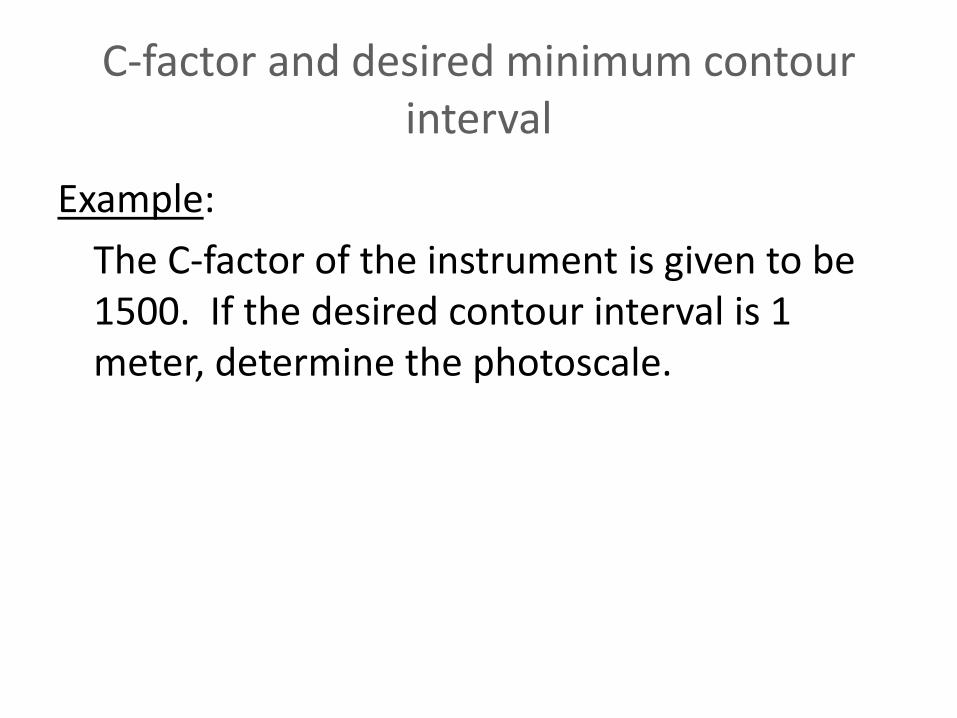
Example:
The C-factor of the instrument is given to be 1500. If the desired contour interval is 1 meter, determine the photoscale.
C-factor and desired minimum contour interval
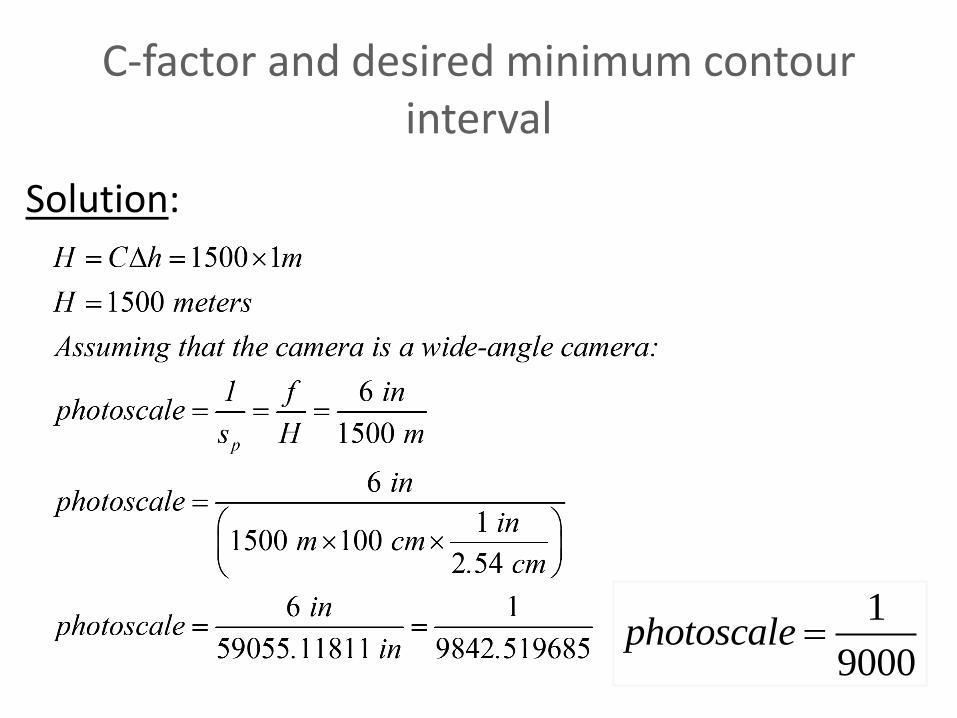
Solution:
1
9000photoscale
Expected Accuracy
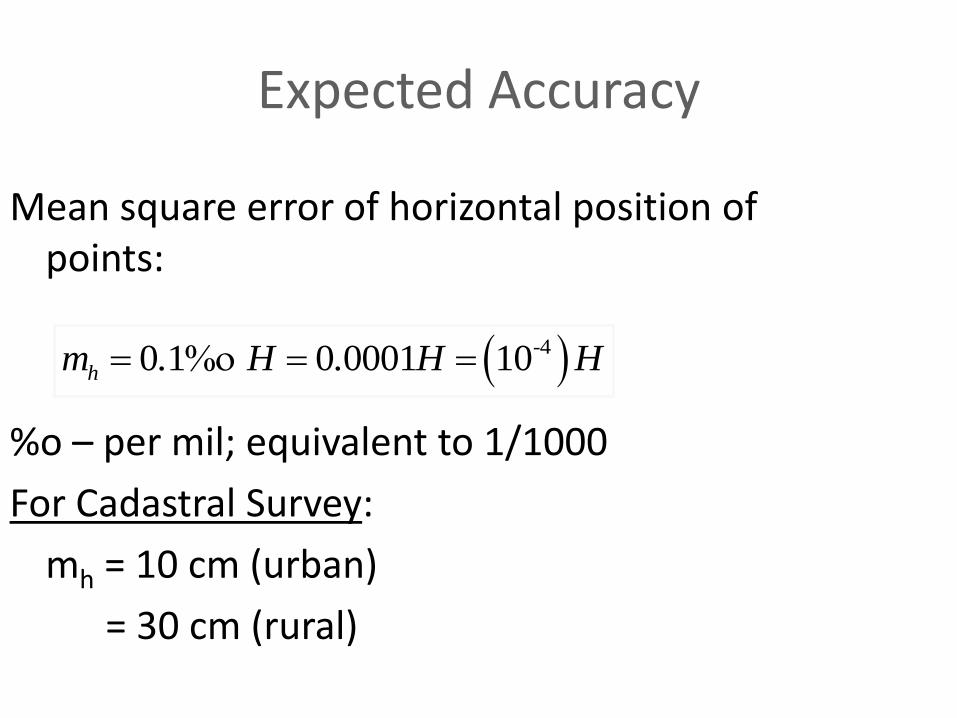
40 1 0 0001 10-
hm . H . H H
Mean square error of horizontal position of points:
%ο – per mil; equivalent to 1/1000
For Cadastral Survey:
mh = 10 cm (urban)
= 30 cm (rural)
Expected Accuracy
Example:
Determine the photoscale for an urban area if the camera to be used is a wide-angle camera.
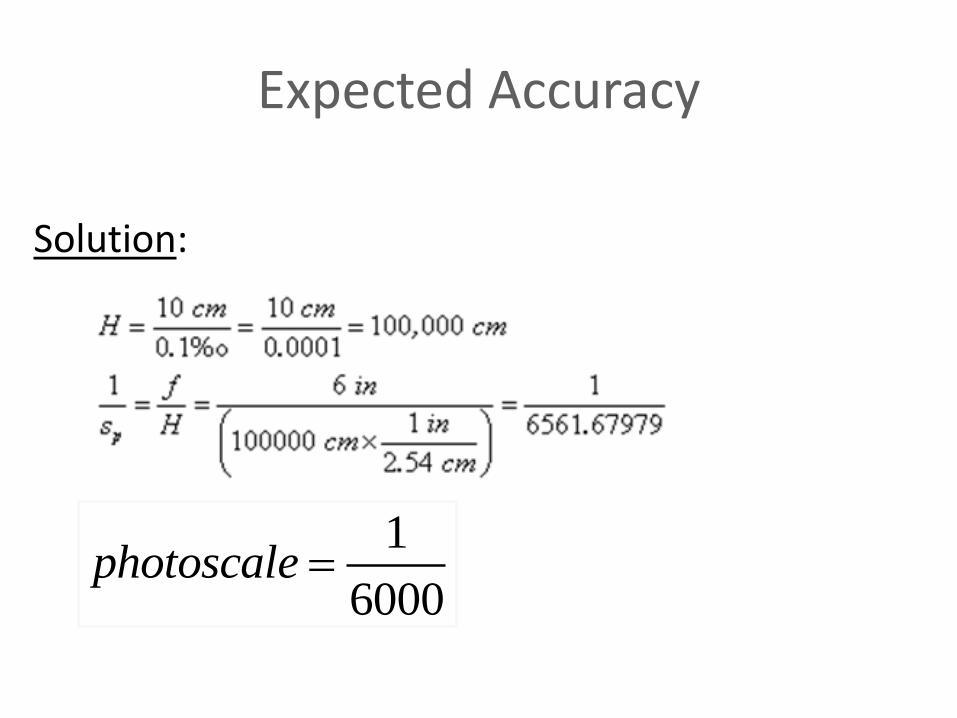
Expected Accuracy
Solution:
1
6000photoscale
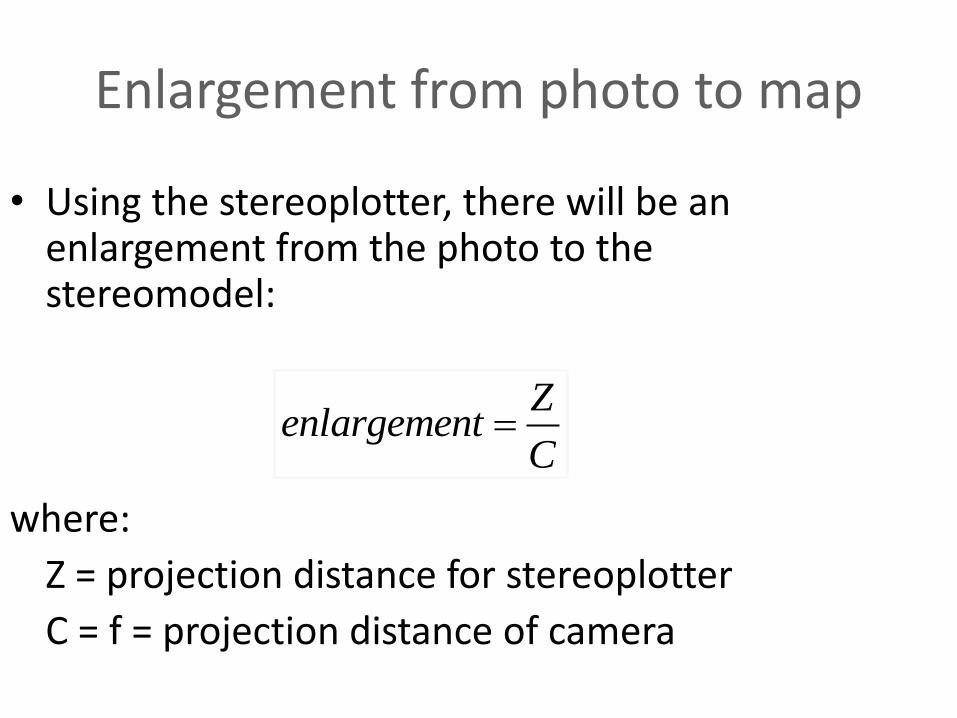
Enlargement from photo to map
Zenlargement
C
• Using the stereoplotter, there will be an enlargement from the photo to the stereomodel:
where:
Z = projection distance for stereoplotter
C = f = projection distance of camera
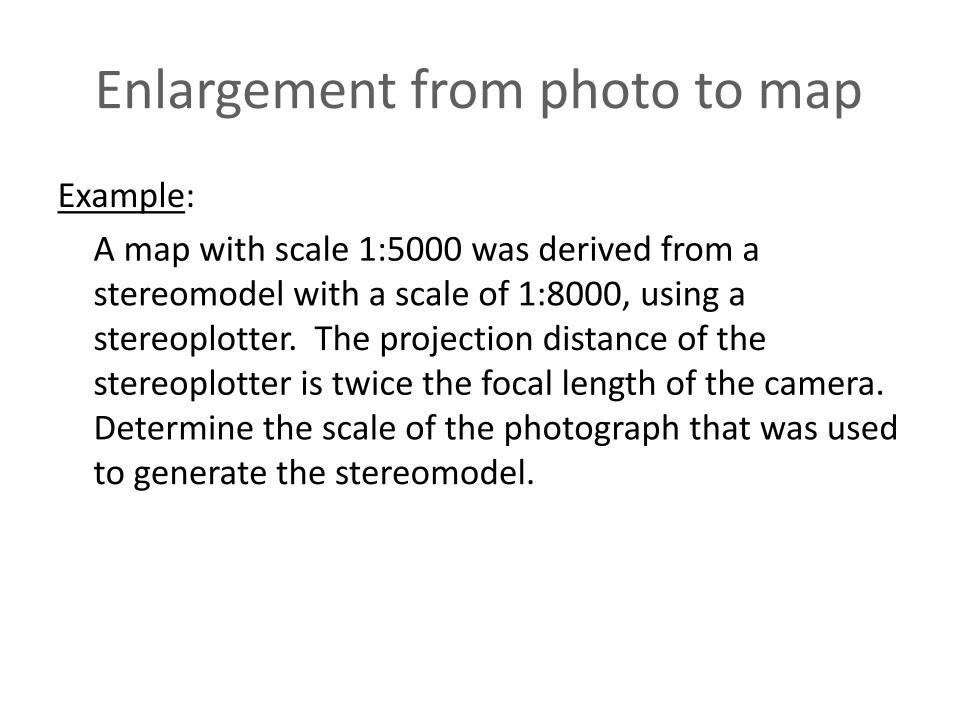
Enlargement from photo to map
Example:
A map with scale 1:5000 was derived from a stereomodel with a scale of 1:8000, using a stereoplotter. The projection distance of the stereoplotter is twice the focal length of the camera. Determine the scale of the photograph that was used to generate the stereomodel.
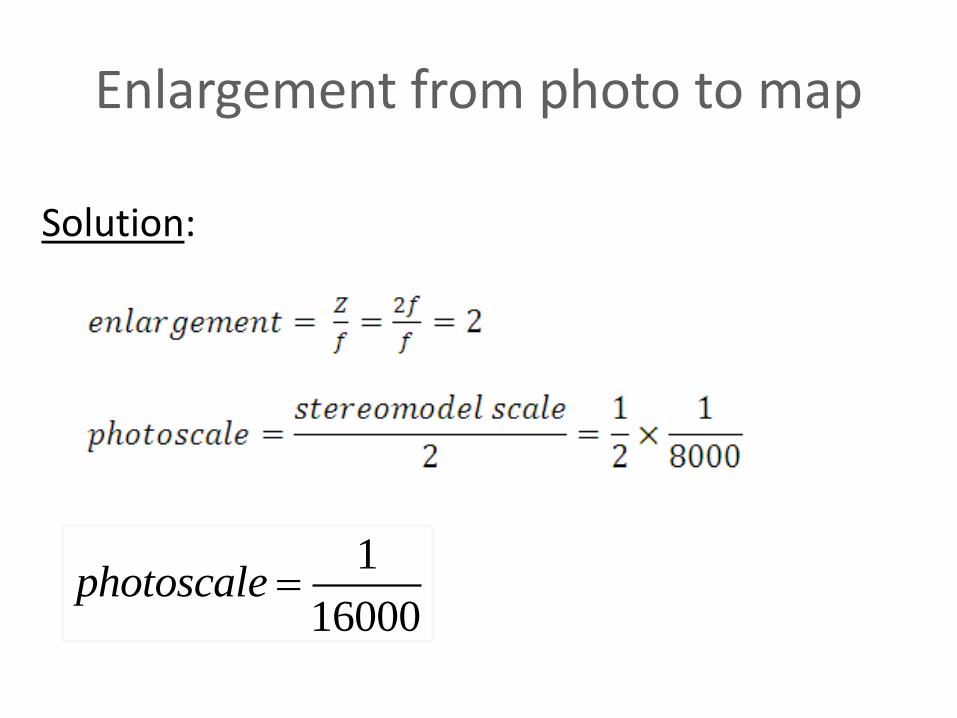
Enlargement from photo to map
Solution:
1
16000photoscale

END OF LECTURE
Recommended