Artisan High Income Fund
5 February 2020 Artisan Partners Global Equity TeamMark Yockey, CFA
This is an offering of shares of an Artisan Fund and does not create a relationship between the investor and Artisan Partners. The Notes and Disclosures section of this presentation contains important information. Readers are encouraged to review it carefully.
Jason Kantor Daniel Reagan
HEALTH CARE
Claudia Corra Brice Vandamme Steven Foundos, CFA
FINANCIALS
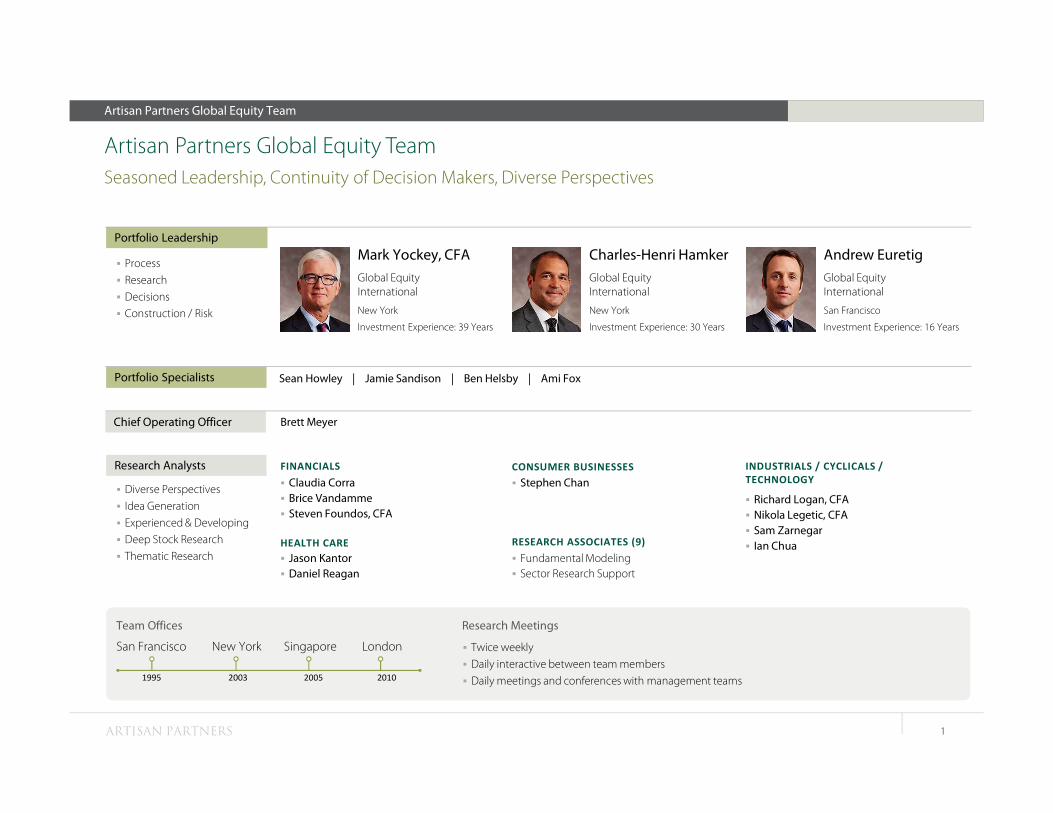
Artisan Partners Global Equity TeamSeasoned Leadership, Continuity of Decision Makers, Diverse Perspectives
Portfolio Leadership
Artisan Partners Global Equity Team
Stephen Chan
Richard Logan, CFA Nikola Legetic, CFA Sam Zarnegar Ian Chua
Research Analysts
Portfolio Specialists
Diverse Perspectives
Idea Generation
Experienced & Developing Deep Stock Research
Thematic Research
CONSUMER BUSINESSES INDUSTRIALS / CYCLICALS / TECHNOLOGY
RESEARCH ASSOCIATES (9) Fundamental Modeling Sector Research Support
Sean Howley | Jamie Sandison | Ben Helsby | Ami Fox
Brett MeyerChief Operating Officer
Process
Research
Decisions Construction / Risk
Charles-Henri Hamker
Global EquityInternational
New York
Investment Experience: 30 Years
Andrew Euretig
Global EquityInternational
San Francisco
Investment Experience: 16 Years
Mark Yockey, CFA
Global EquityInternational
New York
Investment Experience: 39 Years
Team Offices Research Meetings
San Francisco New York Singapore London Twice weekly
Daily interactive between team members
Daily meetings and conferences with management teams1995 2003 2005 2010
ARTISAN PARTNERS 1

Artisan Partners Global Equity Team
Investment Process—Quality, Growth and Valuation
Quality Growth
InvestmentOpportunities
Valuation
Invest in well-managed businesses, generating sustainable earnings growth at reasonable prices
Themes
ARTISAN PARTNERS 2

Investment Process—Global Themes
Artisan Partners Global Equity Team
Sustainable Growth
InvestmentOpportunities
ARTISAN PARTNERS
Demographics Health Care
EM Consumer
Technology E-commerce
Mobile
Search
Secure Payments
IoT/Big Data
Colocation Services
Artificial Intelligence
Environment Electric Vehicles
Clean Energy
Financial Services Exchanges
Life Insurance
Banking
Outsourcing Facilities
Maintenance/Security
Logistics
Health Care Platform Companies
Infrastructure Broadband
Transportation
Construction
Real Estate
Identify long-term growth themes with the objective of investing in companies having meaningful exposure to these trends
3

Artisan Partners Global Equity Team
Sustainable Growth factors outlined above apply to the investment selection criteria.
Sustainable Competitive Advantage
Dominant market position
High barriers to entry
Brand strength
Pricing power
Unique assets
Superior Business Model Significant free cash flow
High/improving profit margins
Strong financial position
High/improving return on equity
High-Quality Management Team Focused leadership
Clear business strategy
Proven track record
Alignment of interests
Sustainable Growth
Investment Process—Identifying Sustainable Growth
ARTISAN PARTNERS 4

Artisan International Fund
Investment Results—Average Annual Total Returns
Past performance does not guarantee and is not a reliable indicator of future results. Investment returns and principal values will fluctuate so that an investor's shares, when redeemed, may be worth more or less than theiroriginal cost. Current performance may be lower or higher than that shown. Call 800.344.1770 for current to most recent month-end performance.Source: MSCI. Returns less than one year are not annualized. Institutional Class performance is that of the Investor Class from 28 Dec 1995 through the inception of the Institutional Class on 1 Jul 1997, and actual Institutional Class performance thereafter. Advisor Classperformance is that of the Investor Class from 28 Dec 1995 through the inception of the Advisor Class on 1 Apr 2015, and actual Advisor Class performance thereafter. Investor Class inception: 28 Dec 1995. Performance has not been adjusted to reflect the expenses of theAdvisor and Institutional Classes for the periods prior to their inceptions, and each Class’s performance results would differ if such expenses were reflected. Investor Class represents the oldest share class in the Fund and generally has higher expenses and lower minimuminvestments. MSCI ACWI ex USA Index performance represents the MSCI ACWI ex USA (Gross) Index from inception to 31 Dec 2000 and the MSCI ACWI ex USA (Net) Index from 1 Jan 2001 forward.
(%) as of 31 Dec 2019 QTD 1 Yr 3 Yr 5 Yr 7 Yr 10 Yr Inception Investor Class: ARTIX 7.82 29.20 14.69 5.56 7.18 7.18 9.06
Advisor Class: APDIX 7.88 29.36 14.85 5.72 7.30 7.26 9.09
Institutional Class: APHIX 7.90 29.46 14.94 5.80 7.42 7.43 9.28
MSCI EAFE Index 8.17 22.01 9.56 5.67 6.35 5.50 4.91
MSCI ACWI ex USA Index 8.92 21.51 9.87 5.51 5.44 4.97 5.32
0%
5%
10%
15%
20%
25%
30%
Annual Report1 / Prospectus2
Expense Ratio—Investor Shares 1.19% / 1.19%Expense Ratio—Advisor Shares 1.04% / 1.04%Expense Ratio—Institutional Shares 0.96% / 0.97%1Audited. For the fiscal year ended 30 Sep 2019. 2See prospectus for further details.
ARTISAN PARTNERS 5

Artisan Global Equity Fund
Investment Results—Average Annual Total Returns
(%) as of 31 Dec 2019 QTD 1 Yr 3 Yr 5 Yr 7 Yr Inception Investor Class: ARTHX 7.45 31.13 18.49 10.55 12.00 12.35
Institutional Class: APHHX 7.53 31.39 18.76 10.78 12.17 12.47
MSCI All Country World Index 8.95 26.60 12.44 8.41 9.73 8.68
0%
5%
10%
15%
20%
25%
30%
35%
Past performance does not guarantee and is not a reliable indicator of future results. Investment returns and principal values will fluctuate so that an investor's shares, when redeemed, may be worth more or less than theiroriginal cost. Current performance may be lower or higher than that shown. Call 800.344.1770 for current to most recent month-end performance. Performance may reflect agreements to limit a Fund’s expenses, whichwould reduce performance if not in effect.Source: MSCI. Returns less than one year are not annualized. Institutional Class performance is that of the Investor Class from 29 Mar 2010 through the inception of the Institutional Class on 15 Oct 2015, and actual Institutional Class performance thereafter. Investor Classinception: 29 Mar 2010. Performance has not been adjusted to reflect the expenses of the Institutional Class for the period prior to the Class's inception, and Institutional Class performance results would differ if such expenses were reflected. Investor Class represents the oldestshare class in the Fund and generally has higher expenses and lower minimum investments.
ARTISAN PARTNERS 6
Annual Report1 / Prospectus2
Expense Ratio—Investor Shares 1.38% / 1.28%Expense Ratio—Institutional Shares 1.16% / 1.07%1Audited. For the fiscal year ended 30 Sep 2019. 2Reflects a reduction in management fees,effective as of 15 Nov 2019. See prospectus for further details.

Top 10 Holdings
Source: Artisan Partners. As of 31 Dec 2019. Securities of the same issuer are aggregated to determine the weight in the portfolio.
Artisan Partners Global Equity Team
ARTISAN PARTNERS 7
Company % of total portfolio Company % of total portfolio
Linde PLC 6.4 Deutsche Boerse AG 4.3
Deutsche Boerse AG 6.1 Linde PLC 4.0
Petroleo Brasileiro SA 4.2 Fidelity National Information Services Inc 3.8
Air Liquide SA 4.0 Amazon.com Inc 3.1
Airbus SE 3.8 Alphabet Inc 3.0
AIA Group Ltd 3.7 Intercontinental Exchange Inc 3.0
Nestle SA 3.7 Petroleo Brasileiro SA 2.4
Aon PLC 3.2 Mastercard Inc 2.3
Deutsche Post AG 2.9 Lonza Group AG 2.2
Allianz SE 2.7 Air Liquide SA 2.1
Total 40.6% 30.3%
Artisan International Fund Artisan Global Equity Fund
0% 20% 40% 60% 80%
Europe
Americas
Emerging Markets
Pacific Basin ex Japan
Japan
Middle East
Artisan International Fund MSCI EAFE Index
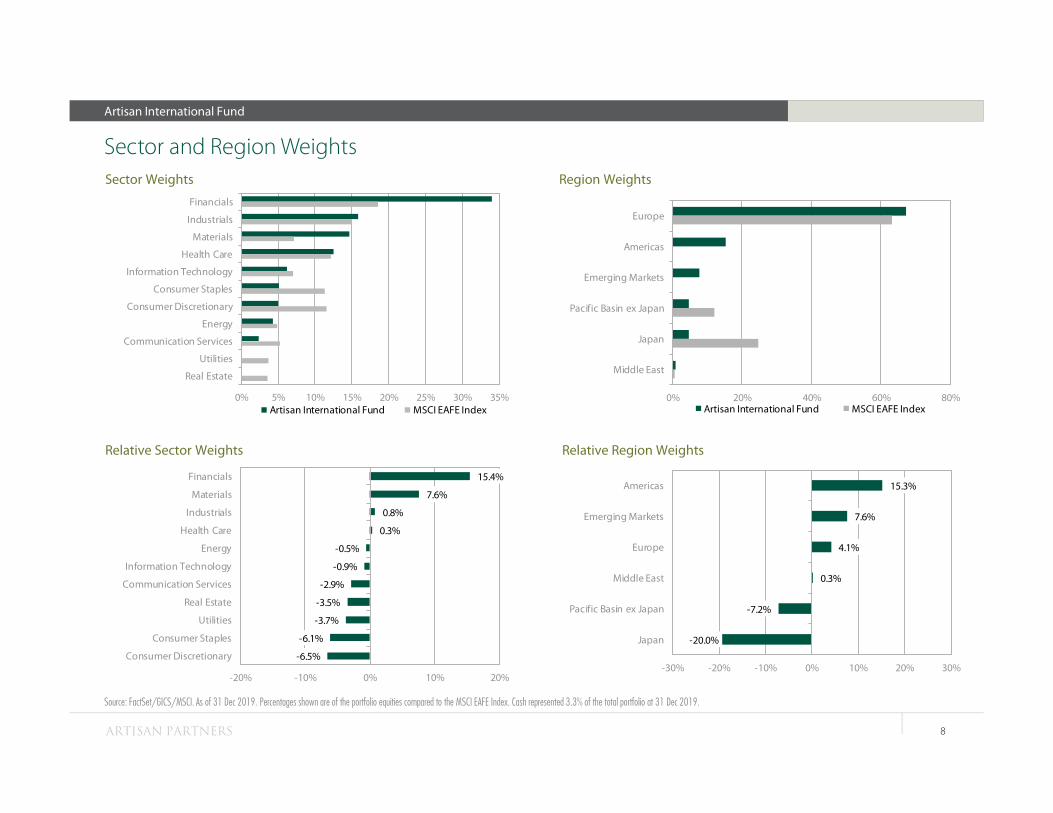
15.4%
7.6%
0.8%
0.3%
-0.5%
-0.9%
-2.9%
-3.5%
-3.7%
-6.1%
-6.5%
-20% -10% 0% 10% 20%
Financials
Materials
Industrials
Health Care
Energy
Information Technology
Communication Services
Real Estate
Utilities
Consumer Staples
Consumer Discretionary
15.3%
7.6%
4.1%
0.3%
-7.2%
-20.0%
-30% -20% -10% 0% 10% 20% 30%
Americas
Emerging Markets
Europe
Middle East
Pacific Basin ex Japan
Japan
0% 5% 10% 15% 20% 25% 30% 35%
Financials
Industrials
Materials
Health Care
Information Technology
Consumer Staples
Consumer Discretionary
Energy
Communication Services
Utilities
Real Estate
Artisan International Fund MSCI EAFE Index
Artisan International Fund
Sector and Region Weights
Source: FactSet/GICS/MSCI. As of 31 Dec 2019. Percentages shown are of the portfolio equities compared to the MSCI EAFE Index. Cash represented 3.3% of the total portfolio at 31 Dec 2019.
Sector Weights Region Weights
Relative Region Weights Relative Sector Weights
ARTISAN PARTNERS 8

0% 5% 10% 15% 20% 25%
Health Care
Information Technology
Financials
Consumer Discretionary
Industrials
Materials
Communication Services
Consumer Staples
Energy
Utilities
Real Estate
Artisan Global Equity Fund MSCI All Country World Index
11.7%
1.4%
1.3%
1.2%
0.4%
0.4%
-2.8%
-3.2%
-3.3%
-3.4%
-3.8%
-15% -10% -5% 0% 5% 10% 15%
Health Care
Financials
Materials
Information Technology
Industrials
Consumer Discretionary
Energy
Real Estate
Utilities
Consumer Staples
Communication Services
0% 10% 20% 30% 40% 50% 60%
Americas
Europe
Japan
Emerging Markets
Pacific Basin ex Japan
Middle East
Artisan Global Equity Fund MSCI All Country World Index
17.1%
-0.2%
-1.7%
-1.9%
-5.3%
-7.9%
-20% -10% 0% 10% 20%
Europe
Middle East
Pacific Basin ex Japan
Japan
Americas
Emerging Markets
Artisan Global Equity Fund
Sector and Region WeightsSector Weights Region Weights
Relative Region Weights Relative Sector Weights
ARTISAN PARTNERS
Source: FactSet/GICS/MSCI. As of 31 Dec 2019. Percentages shown are of the portfolio equities compared to the MSCI All Country World Index. Cash represented 0.5% of the total portfolio at 31 Dec 2019.
9

-50%
0%
50%
100%
150%
200%
250%
2010
2011
2012
2013
2014
2015
2016
2017
2018
2019
Artisan Global Equity Fund MSCI All Country World Index
-100%
0%
100%
200%
300%
400%
500%
600%
700%
800%
1996
1997
1998
1999
2000
2001
2002
2003
2004
2005
2006
2007
2008
2009
2010
2011
2012
2013
2014
2015
2016
2017
2018
2019
Artisan International Fund MSCI EAFE Index
Artisan Partners Global Equity Team
Long-Term Alpha Generation
Past performance does not guarantee and is not a reliable indicator of future results. Investment returns and principal values will fluctuate so that an investor's shares, when redeemed, may be worth more or less than theiroriginal cost. Current performance may be lower or higher than that shown. Call 800.344.1770 for current to most recent month-end performance. Performance may reflect agreements to limit a Fund’s expenses, which wouldreduce performance if not in effect.Source: Artisan Partners/MSCI. Performance data shown for the Investor Class. Investor Class represents the oldest share class in the Fund and generally has higher expenses and lower minimum investments.
Artisan International Fund Cumulative Returns Artisan Global Equity Fund Cumulative Returns
(%) as of 31 Dec 2019 Investor Class Status 1 Yr 3 Yr 5 Yr 10 Yr Inception
Artisan International Fund (28 Dec 1995) ARTIX Open 29.20 14.69 5.56 7.18 9.06MSCI EAFE Index 22.01 9.56 5.67 5.50 4.91Artisan Global Equity Fund (29 Mar 2010) ARTHX Open 31.13 18.49 10.55 --- 12.35MSCI All Country World Index 26.60 12.44 8.41 --- 8.68
(Inception)
Average Annual Total Returns
10

Artisan International Fund
Portfolio Holdings (% of total portfolio)
Source: GICS. As of 31 Dec 2019. Cash represented 3.3% of the total portfolio at 31 Dec 2019. Securities of the same issuer are aggregated to determine the weight in the portfolio.
11
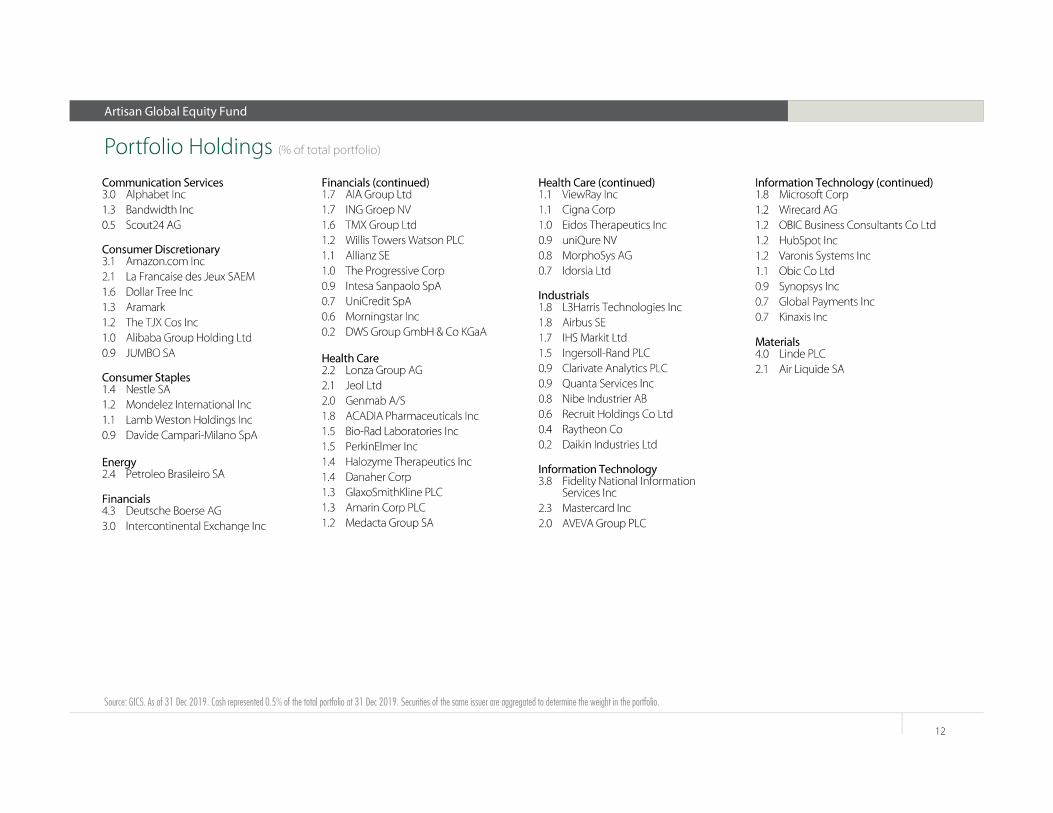
Artisan Global Equity Fund
Portfolio Holdings (% of total portfolio)
Source: GICS. As of 31 Dec 2019. Cash represented 0.5% of the total portfolio at 31 Dec 2019. Securities of the same issuer are aggregated to determine the weight in the portfolio.
12

For Financial Advisor Use Only. Not for Distribution to the Public.
Notes and Disclosures
Artisan Partners
This section of this presentation contains information important to a complete understanding of the material presented. Please review it carefully.
Carefully consider the Fund’s investment objective, risks and charges and expenses. This and other important information is contained in the Fund's prospectus and summaryprospectus, which can be obtained by visiting www.artisanpartners.com/prospectus. Read carefully before investing.These materials are presented in connection with an offer of the shares of a Fund in the series of Artisan Partners Funds, Inc. These materials are not an offer for any other mutual fund mentioned. A purchase of shares of an Artisan Partners Fund does not create an investment advisoryrelationship between the investor and Artisan Partners Limited Partnership, the investment adviser to the Fund. In addition to acting as investment adviser to the Fund, Artisan Partners provides institutional investment management services.
Artisan International Fund
International investments involve special risks, including currency fluctuation, lower liquidity, different accounting methods and economic and political systems, and higher transaction costs. These risks typically are greater in emerging markets. Securities of small- andmedium-sized companies tend to have a shorter history of operations, be more volatile and less liquid and may have underperformed securities of large companies during some periods. Growth securities may underperform other asset types during a given period.
Artisan Global Equity Fund
International investments involve special risks, including currency fluctuation, lower liquidity, different accounting methods and economic and political systems, and higher transaction costs. These risks typically are greater in emerging markets. Securities of small- andmedium-sized companies tend to have a shorter history of operations, be more volatile and less liquid and may have underperformed securities of large companies during some periods. Growth securities may underperform other asset types during a given period.
MSCI EAFE Index measures the performance of developed markets, excluding the US and Canada. MSCI All Country World ex USA Index measures the performance of developed and emerging markets, excluding the US. MSCI All Country World Index measures the performance of developedand emerging markets. The benchmark index(es) presented are unmanaged, market-weighted indices whose returns include net reinvested dividends, but, unlike the portfolio's returns, do not reflect the payment of sales commissions or other expenses incurred in the purchase or sale of thesecurities included in the indices. An investment cannot be made directly into an index.
MSCI makes no express or implied warranties or representations and shall have no liability whatsoever with respect to any MSCI data contained herein. The MSCI data may not be further redistributed or used to create indices or financial products. This report is not approved or produced byMSCI.
Totals may not sum due to rounding. All data shown is in USD unless otherwise indicated.
Sector Allocation: Sector exposure percentages reflect sector designations as currently classified by GICS. The Global Industry Classification Standard (GICS®) is the exclusive intellectual property of MSCI Inc. (MSCI) and Standard & Poor’s Financial Services, LLC (S&P). Neither MSCI, S&P,their affiliates, nor any of their third party providers (“GICS Parties”) makes any representations or warranties, express or implied, with respect to GICS or the results to be obtained by the use thereof, and expressly disclaim all warranties, including warranties of accuracy, completeness,merchantability and fitness for a particular purpose. The GICS Parties shall not have any liability for any direct, indirect, special, punitive, consequential or any other damages (including lost profits) even if notified of such damages.
Country Allocation: Historical country exposure percentages reflect country designations as classified by MSCI as of the date shown. Securities not classified by MSCI reflect country designations as of the date the report was generated.
This material may include the views of the portfolio manager and other information relating to the portfolio and portfolio securities. While we believe the data accurately reflects the investment process, this information is presented as of the date indicated and will change over time.
Portfolio Holdings: For the purpose of determining the portfolio's holdings, securities of the same issuer are aggregated to determine the weight in the portfolio. For an index, the largest holdings are calculated at the security level and do not aggregate securities held by an issuer. Holdingsinformation is not intended to represent or predict portfolio investment performance or as a recommendation of any individual security. A complete list of the securities held by portfolio, other than cash and cash equivalents unless otherwise noted, as of the date indicated is included. Securitiesnamed in this material, but not listed within the portfolio holdings page were not held as of the date reported. Portfolio holdings are subject to change without notice. This listing is for informational purposes only and may not be identical to the official books and records of the Fund. Securitynames may not represent the official legal corporate name. Please refer to the Fund's most recent Annual Report for an audited portfolio holdings list.
Alpha is a quantitative measure of the volatility of the portfolio relative to a designated index. A positive alpha of 1.0 means the fund has outperformed its designated index by 1%. Correspondingly, a similar negative alpha would indicate an underperformance of 1%.Free cash flow is a measure of financial performance calculated as operating cash flow minus capital expenditures.Return on Equity (ROE) is a profitability ratio that measures the amount of net income returned as a percentage of shareholders equity.This material is provided for informational purposes without regard to your particular investment needs. This material shall not be construed as investment or tax advice on which you may rely for your investment decisions. Investors should consult their financial and tax adviser before making investments in order to determine the appropriateness of any investment product discussed herein.
Artisan Partners Funds offered through Artisan Partners Distributors LLC (APDLLC), member FINRA. APDLLC is a wholly owned broker/dealer subsidiary of Artisan Partners Holdings LP. Artisan Partners Limited Partnership, an investment advisory firm and adviser to Artisan Partners Funds, iswholly owned by Artisan Partners Holdings LP.
© 2020 Artisan Partners. All rights reserved.
ARTISAN PARTNERS 13
Recommended