May 12, 2016
Company name : Nissan Motor Co., Ltd. <Tokyo Stock Exchange in Japan>
Code no : 7201 (URL http://www.nissan-global.com/EN/IR/)
Representative : Carlos Ghosn, President
Contact person : Joji Tagawa, Corporate Vice President, IR Department Tel. (045) 523 - 5523
Scheduled date of the general meeting of shareholders : To be determined Scheduled date of payment of cash dividends : To be determined
Scheduled date of filing Yukashoken-Houkokusho : To be determined
The additional materials of the Financial Results for FY2015 : Yes
The briefing session of the Financial Results for FY2015 : Yes
(Amounts less than one million yen are rounded)
1. Consolidated Financial Results for FY2015 (April 1, 2015 through March 31, 2016)
<1> Consolidated operating results
(Percent indications show percentage of changes from corresponding figures for the previous period.)
FY2015
FY2014
(Note): Comprehensive income : 75,107 million yen for FY2015, -89.6% : 719,903 million yen for FY2014, -9.6%
yen yen % % %
FY2015
FY2014
(Reference): Equity in earnings (losses) of affiliates : 122,524 million yen for FY2015 and 106,513 million yen for FY2014
<2> Consolidated financial position
% yen
FY2015
FY2014
(Reference): Net assets excluding share subscription rights and non-controlling interests: 4,721,265 million yen as of March 31, 2016,
4,834,416 million yen as of March 31, 2015
<3> Consolidated cash flows
FY2015
FY2014
2. Dividends
Millions of yen % %
FY2014
FY2015
FY2016 forecast
Note: For FY2016 forecast, allocation of cash dividends per share between 2nd quarter end and fiscal year end has not yet been determined.
3. Forecast of consolidated operating results for FY2016 (April 1, 2016 through March 31, 2017)
(Percent indications show percentage of changes from corresponding figures for the previous period.)
% % % %
FY2016 (3.2) (10.5) (7.2) 0.211,800,000 710,000 800,000 525,000 131.35
Net sales Operating income Ordinary incomeNet income
attributable to ownersof parent
Net income per share
Millions of yen Millions of yen Millions of yen Millions of yen yen
― ― ― ― 48.00 36.5
138,372 30.2 3.0
― 21.00 ― 21.00 42.00 175,584 33.6 3.7
yen yen yen yen yen
― 16.50 ― 16.50 33.00
Payout ratioCash dividends as
a percentage ofnet assets
(Consolidated)at 1st quarter end at 2nd quarter end at 3rd quarter end at fiscal year end Total (Annual) (Consolidated)
692,747 (1,022,025) 245,896 802,612
Annual cash dividends per shareTotal cashdividends
Millions of yen Millions of yen Millions of yen Millions of yen
927,013 (1,229,280) 530,606 992,095
17,045,659 5,247,262 28.4 1,152.83
Cash flows fromoperating activities
Cash flows frominvesting activities
Cash flows fromfinancing activities
Cash and cashequivalents
at the end of period
Millions of yen Millions of yen
17,373,643 5,140,745 27.2 1,132.61
109.15 10.0 4.4 5.2
Total assets Net assets
Net assets excluding sharesubscription rights and non-
controlling interests as apercentage of total assets
Net assets excluding sharesubscription rights and non-
controlling interests per share
109.14
Net incomeper share-basic
Net incomeper share-diluted
Net assets excluding sharesubscription rights and non-
controlling interests as apercentage of total assets
Ordinary income as apercentage of total
assets
Operating income as apercentage of net
sales
125.00 124.99 11.0 5.0 6.5
12,189,519 7.2 793,278 34.6 862,272 24.2 523,841 14.5
11,375,207 8.5 589,561 18.3 694,232 31.7 457,574 17.6
FY2015 Consolidated Financial Results
Net sales Operating income Ordinary incomeNet income attributable to
owners of parentMillions of yen % Millions of yen % Millions of yen % Millions of yen %

※ Notes
<1> Significant changes in scope of consolidation: None
In : - ( Company Name : ) Out : - (Company Name : )
<2> Changes in accounting policies, accounting estimation change and restatement
<2>-1 Changes in accounting policies due to the revision of the accounting standards: Yes
<2>-2 Changes in accounting policies except for those in <2>-1: Yes
<2>-3 Changes due to accounting estimation change: None
<2>-4 Restatement: None
Note: See attached page17 "4. CONSOLIDATED FINANCIAL STATEMENTS (7) Changes in accounting policies (8) Additional information."
<3> Number of shares issued
<3>-1 Number of shares issued at the fiscal year end (including treasury stocks)
<3>-2 Number of treasury shares at the fiscal year end
<3>-3 The average number of shares issued during the fiscal year
(Reference) Non-Consolidated Financial Results
Results of FY2015 (April 1, 2015 through March 31, 2016)
1 Results of non-consolidated operations for the year ended March 31, 2016(Percent indications show percentage of changes from corresponding figures for the previous period.)
% % % %
FY2015 (0.7) 30.5 (28.0) (48.9)
FY2014 (5.9) (24.9) 18.1 15.5
FY2015FY2014
2 Non-consolidated financial position
% yen
FY2015FY2014
(Reference): Net assets excluding share subscription rights : 2,490,482 million yen as of March 31, 2016 and 2,470,657 million yen as of March 31, 2015
※ Implementation status of Financial Audit This Financial Results report for FY2015 was exempt from financial audit which was based on Financial Instruments and Exchange Law of
Japan. As of the FY2015 disclosing, Financial Audit for FY2015 financial statements is in progress.
※ Explanation regarding the appropriate use of forecasts of business results
The financial forecast is based on judgments and estimates that have been made on the basis of currently available information.
By nature, such financial forecast is subject to uncertainty and risk. Therefore, you are advised that the final results might be significantly different from
the aforementioned forecast due to changes in economic environments related to our business, market trends and exchange rate, etc.
4,993,336 2,472,951 49.5 550.20
109.48
Millions of yen Millions of yen
4,961,612 2,490,984 50.2 557.81
109.48
Total assets Net assetsNet assets excluding share
subscription rights as apercentage of total assets
Net assets per share
Net income pershare - basic
Net income pershare - diluted
yen yen55.92 55.92
3,493,419 183,522 388,799 251,0093,516,415 140,602 540,154 491,570
Millions of yen Millions of yen Millions of yen Millions of yen
FY2015 4,190,789,033 shares FY2014 4,192,309,319 shares
Net sales Operating income Ordinary income Net income
FY2015 4,494,715,112 shares FY2014 4,520,715,112 shares
FY2015 326,219,157 shares FY2014 327,195,781 shares

【Table of Content of material】
1. ANALYSIS OF BUSINESS PERFORMANCE AND FINANCIAL POSITION ・・・・・・・・・・・・・・・・・・・・・・・・・・・・・・・・・・・・・・・ 2
(1) Analysis of Business Performance・・・・・・・・・・・・・・・・・・・・・・・・・・・・・・・・・・・・・・・・・・・・・・・・・・・・・・・・・・・・・・・・・・・・・・・・ 2① Fiscal Year 2015 Business Performance・・・・・・・・・・・・・・・・・・・・・・・・・・・・・・・・・・・・・・・・・・・・・・・・・・・・・・・・・・・・・・・・ 2② Fiscal Year 2016 Financial Forecast・・・・・・・・・・・・・・・・・・・・・・・・・・・・・・・・・・・・・・・・・・・・・・・・・・・・・・・・・・・・・・・・・・・・ 3
(2) Financial Position・・・・・・・・・・・・・・・・・・・・・・・・・・・・・・・・・・・・・・・・・・・・・・・・・・・・・・・・・・・・・・・・・・・・・・・・・・・・・・・・・・・・ 4① Balance Sheet・・・・・・・・・・・・・・・・・・・・・・・・・・・・・・・・・・・・・・・・・・・・・・・・・・・・・・・・・・・・・・・・・・・・・・・・・・・・・・・・・・・・・ 4② Cash Flows・・・・・・・・・・・・・・・・・・・・・・・・・・・・・・・・・・・・・・・・・・・・・・・・・・・・・・・・・・・・・・・・・・・・・・・・・・・・・・・・・・・・・・・ 4
(3) Dividend Policy・・・・・・・・・・・・・・・・・・・・・・・・・・・・・・・・・・・・・・・・・・・・・・・・・・・・・・・・・・・・・・・・・・・・・・・・・・・・・・・・・・・・・・ 5
2. MANAGEMENT POLICY・・・・・・・・・・・・・・・・・・・・・・・・・・・・・・・・・・・・・・・・・・・・・・・・・・・・・・・・・・・・・・・・・・・・・・・・・・・・・・・・・ 6
(1) Management Policy of the Company・・・・・・・・・・・・・・・・・・・・・・・・・・・・・・・・・・・・・・・・・・・・・・・・・・・・・・・・・・・・・・・・・・・・・・ 6(2) Medium and Long-term Strategies, Management Target and Issues to be Tackled・・・・・・・・・・・・・・・・・・・・・・・・・・・・・・・・・・ 6
3. BASIC RATIONALE ON SELECTION OF ACCOUNTING STANDARDS・・・・・・・・・・・・・・・・・・・・・・・・・・・・・・・・・・・・・・・・・・ 6
4. CONSOLIDATED FINANCIAL STATEMENTS・・・・・・・・・・・・・・・・・・・・・・・・・・・・・・・・・・・・・・・・・・・・・・・・・・・・・・・・・・・・・・・ 7
(1) Consolidated Balance Sheets・・・・・・・・・・・・・・・・・・・・・・・・・・・・・・・・・・・・・・・・・・・・・・・・・・・・・・・・・・・・・・・・・・・・・・・・・・・・ 7(2) Consolidated Statements of Income and Consolidated Statements of Comprehensive Income・・・・・・・・・・・・・・・・・・・・・・・・・・ 9
Consolidated Statements of Income・・・・・・・・・・・・・・・・・・・・・・・・・・・・・・・・・・・・・・・・・・・・・・・・・・・・・・・・・・・・・・・・・・・・・・・ 9Consolidated Statements of Comprehensive Income・・・・・・・・・・・・・・・・・・・・・・・・・・・・・・・・・・・・・・・・・・・・・・・・・・・・・・・・・・ 11
(3) Consolidated Statements of Changes in Net Assets・・・・・・・・・・・・・・・・・・・・・・・・・・・・・・・・・・・・・・・・・・・・・・・・・・・・・・・・・・・ 12(4) Consolidated Statements of Cash Flows・・・・・・・・・・・・・・・・・・・・・・・・・・・・・・・・・・・・・・・・・・・・・・・・・・・・・・・・・・・・・・・・・・・・ 14(5) Events and Conditions which indicate there could be Substantial Doubt about Going Concern Assumption・・・・・・・・・・・・・・・ 16(6) Basis of Consolidated Financial Statements・・・・・・・・・・・・・・・・・・・・・・・・・・・・・・・・・・・・・・・・・・・・・・・・・・・・・・・・・・・・・・・・・ 16(7) Changes in accounting policies・・・・・・・・・・・・・・・・・・・・・・・・・・・・・・・・・・・・・・・・・・・・・・・・・・・・・・・・・・・・・・・・・・・・・・・・・・ 17(8) Additional information・・・・・・・・・・・・・・・・・・・・・・・・・・・・・・・・・・・・・・・・・・・・・・・・・・・・・・・・・・・・・・・・・・・・・・・・・・・・・・・・・ 17(9) Notes to Consolidated Financial Statements・・・・・・・・・・・・・・・・・・・・・・・・・・・・・・・・・・・・・・・・・・・・・・・・・・・・・・・・・・・・・・・・ 18
① For Consolidated statements of changes in net assets・・・・・・・・・・・・・・・・・・・・・・・・・・・・・・・・・・・・・・・・・・・・・・・・・・・・・・ 18② For Consolidated statements of cash flows・・・・・・・・・・・・・・・・・・・・・・・・・・・・・・・・・・・・・・・・・・・・・・・・・・・・・・・・・・・・・・・ 19③ Segments of an enterprise and related information・・・・・・・・・・・・・・・・・・・・・・・・・・・・・・・・・・・・・・・・・・・・・・・・・・・・・・・・・ 20④ Amount per share・・・・・・・・・・・・・・・・・・・・・・・・・・・・・・・・・・・・・・・・・・・・・・・・・・・・・・・・・・・・・・・・・・・・・・・・・・・・・・・・・・ 31⑤ Significant subsequent events・・・・・・・・・・・・・・・・・・・・・・・・・・・・・・・・・・・・・・・・・・・・・・・・・・・・・・・・・・・・・・・・・・・・・・・・・ 31
(10) Production and sales・・・・・・・・・・・・・・・・・・・・・・・・・・・・・・・・・・・・・・・・・・・・・・・・・・・・・・・・・・・・・・・・・・・・・・・・・・・・・・・・・・・ 33① Consolidated production volume・・・・・・・・・・・・・・・・・・・・・・・・・・・・・・・・・・・・・・・・・・・・・・・・・・・・・・・・・・・・・・・・・・・・・・ 33② Consolidated sales volume by region・・・・・・・・・・・・・・・・・・・・・・・・・・・・・・・・・・・・・・・・・・・・・・・・・・・・・・・・・・・・・・・・・・・ 34
【Reference】 Quarterly Consolidated Statements of Income and Quarterly Consolidated Statements of Comprehensive Income・・・ 35The Three-month Period Ended March 31・・・・・・・・・・・・・・・・・・・・・・・・・・・・・・・・・・・・・・・・・・・・・・・・・・・・・・・・・・・・・・・・・・ 35
Quarterly Consolidated Statements of Income・・・・・・・・・・・・・・・・・・・・・・・・・・・・・・・・・・・・・・・・・・・・・・・・・・・・・・・・・・・・ 35Quarterly Consolidated Statements of Comprehensive Income・・・・・・・・・・・・・・・・・・・・・・・・・・・・・・・・・・・・・・・・・・・・・・・ 37
5. NON-CONSOLIDATED FINANCIAL STATEMENTS・・・・・・・・・・・・・・・・・・・・・・・・・・・・・・・・・・・・・・・・・・・・・・・・・・・・・・・・・・ 38
(1) Non-Consolidated Balance Sheets・・・・・・・・・・・・・・・・・・・・・・・・・・・・・・・・・・・・・・・・・・・・・・・・・・・・・・・・・・・・・・・・・・・・・・・・ 38(2) Non-Consolidated Statements of Income・・・・・・・・・・・・・・・・・・・・・・・・・・・・・・・・・・・・・・・・・・・・・・・・・・・・・・・・・・・・・・・・・・・ 41(3) Non-Consolidated Statements of Changes in Net Assets・・・・・・・・・・・・・・・・・・・・・・・・・・・・・・・・・・・・・・・・・・・・・・・・・・・・・・・ 42
(4) Events and Conditions which indicate there could be Substantial Doubt about Going Concern Assumption・・・・・・・・・・・・・・・ 44
(5) Changes in accounting policies・・・・・・・・・・・・・・・・・・・・・・・・・・・・・・・・・・・・・・・・・・・・・・・・・・・・・・・・・・・・・・・・・・・・・・・・・・ 44
(6) Additional Information・・・・・・・・・・・・・・・・・・・・・・・・・・・・・・・・・・・・・・・・・・・・・・・・・・・・・・・・・・・・・・・・・・・・・・・・・・・・・・・・・ 44
(7) Significant subsequent events・・・・・・・・・・・・・・・・・・・・・・・・・・・・・・・・・・・・・・・・・・・・・・・・・・・・・・・・・・・・・・・・・・・・・・・・・・・・ 44
(8) Others・・・・・・・・・・・・・・・・・・・・・・・・・・・・・・・・・・・・・・・・・・・・・・・・・・・・・・・・・・・・・・・・・・・・・・・・・・・・・・・・・・・・・・・・・・・・・・ 45
6. OTHER・・・・・・・・・・・・・・・・・・・・・・・・・・・・・・・・・・・・・・・・・・・・・・・・・・・・・・・・・・・・・・・・・・・・・・・・・・・・・・・・・・・・・・・・・・・・・・・・・ 46
(1) Directors and statutory auditors changes・・・・・・・・・・・・・・・・・・・・・・・・・・・・・・・・・・・・・・・・・・・・・・・・・・・・・・・・・・・・・・・・・・・ 46(2) Other・・・・・・・・・・・・・・・・・・・・・・・・・・・・・・・・・・・・・・・・・・・・・・・・・・・・・・・・・・・・・・・・・・・・・・・・・・・・・・・・・・・・・・・・・・・・・・・ 46
Nissan Motor Co., Ltd. (7201) FY2015 Consolidated Financial Results
- 1 -

1. ANALYSIS OF BUSINESS PERFORMANCE AND FINANCIAL POSITION
(1) Analysis of Business Performance① Fiscal Year 2015 Business Performance
In fiscal year 2015, the global industry volume ("TIV") increased by 2.1% to 87.15 million units. Nissan's global sales amounted to 5,423,000 units, a 2.0% increase year-on-year. Our market share was 6.2% and the same level as the prior fiscal year.
In Japan, TIV decreased by 6.8% year-on-year to 4.94 million units. Our sales reached 573,000 units, down 8.1% from the prior fiscal year despite the contribution of X-trail. Nissan's market share was down 0.2 points to 11.6%.
In China, TIV increased by 6.0% to 23.68 million units. Our sales units in China resulted in 1,250,000 units, by contribution ofX-trail and Sylphy series, accounting for a market share of 5.3%, the same level as the prior fiscal year.
In North America, including Mexico and Canada, TIV increased by 5.8% to 20.94 million units. Our sales in North America increased by 9.9% to 2,011,000 units. Meanwhile, in the United States of America, TIV increased by 5.2% to 17.60 million units. We sold 1,517,000 units, up 8.4% from the prior fiscal year by contribution of Altima and Rogue, and our market share increased by 0.2 points to 8.6%.
In Europe, TIV increased by 3.5% to 18.40 million units. We sold 637,000 units, up 9.4% from the prior fiscal year excluding Russia by contribution of Qashqai and Juke, accounting for a market share of 3.8% the same level as the prior fiscal year. Our sales in Russia decreased by 32.6% to 116,000 units.
In other markets, our sales volumes decreased by 5.9% to 835,000 units. Our sales volume in Asia and Oceania decreased by 1.7% to 357,000 units. Our sales volume in Latin America decreased by 6.7% to 171,000 units. In Middle East area, our sales volume decreased by 12.4% to 208,000 units. Our sales volume in Africa decreased by 4.1% to 99,000 units.
Consolidated net sales in the fiscal year 2015 increased by ¥814.3 billion (7.2%) to ¥12,189.5 billion. Consolidated operating income totaled 793.3 billion yen, yielding a 6.5% operating margin, which increased by 203.7 billion yen (34.6%) from the prior fiscal year. The variance of operating income was mainly attributable to purchasing cost reductions and sales volume increase.Consolidated net non-operating income of ¥69.0 billion was recorded, decreased by ¥35.6 billion from the prior fiscal year. This result was primarily due to the unfavorable effects of foreign exchange rate movements. As a result, consolidated ordinary income increased by ¥168.1 billion (24.2%) from the prior fiscal year to ¥862.3 billion. Consolidated net special losses of ¥129.4 billion were recorded, deteriorating by ¥122.6 billion from the prior fiscal year. Income before income taxes of ¥732.9 billion was recorded, a profit increase of ¥45.5 billion (6.6%) from the prior fiscal year. As a result, net incomeattributable to owners of parent of ¥523.8 billion was recorded, a profit increase of ¥66.2 billion (14.5%) from the prior fiscal year.
For fiscal year 2015, automotive free cash flow reached 481.2 billion yen positive. As a result, our net automotive debt continued to be in a net cash position, finishing the year with ¥1,502.9 billion.
Nissan Motor Co., Ltd. (7201) FY2015 Consolidated Financial Results
- 2 -

② Fiscal Year 2016 Financial Forecast
For fiscal year 2016, Nissan anticipates total industry volumes will rise by 2.6% to 89.40 million units. In that period, we expect Nissan to improve with retail volumes by 3.3% to 5.6 million units. This would equate to a record of global market share of 6.3%.
Under the foreign exchange rate assumption of ¥105 to the dollar and ¥120 to the euro, we anticipate consolidated net revenues decreasing by 3.2% to ¥11.8 trillion for the year ending March 31, 2017. Consolidated operating income is forecast to reach ¥710.0 billion – representing a margin of 6.0% and a decrease of 10.5% compared with fiscal year 2015. Consolidated net income attributable to owners of parent is expected to reach ¥525.0 billion, an increase of 0.2%.
Looking at the year-over-year change in consolidated operating income, we anticipate:
・ An improvement in sales and marketing of ¥60.0 billion;・ ¥111.7 billion improvement in monozukuri and others;・ A negative foreign exchange movement of ¥255.0 billion.
Based on our outlook and our expectations for continued solid automotive free cash flow generation for fiscal year 2016, we are forecasting a 14.3% increase in the dividend to ¥48 per share.
Nissan Motor Co., Ltd. (7201) FY2015 Consolidated Financial Results
- 3 -

(2) Financial Position① Balance Sheet
② Cash Flows
■AssetsCurrent assets have increased by 4.2% to ¥10,747.6 billion compared to March 31, 2015. This was mainly attributable to increasesin sales finance receivables by ¥340.4 billion and cash on hand and in banks by ¥157.7 billion. Fixed assets have decreased by 1.5% to ¥6,626.1 billion compared to March 31, 2015. This was mainly due to decreases in investment securities by ¥95.0 billion and construction in progress by ¥68.4 billion despite an increase in machinery, equipmentand vehicles, net by ¥60.9 billion. As a result, Total assets have increased by 1.9% to ¥17,373.6 billion compared to March 31, 2015.
■ LiabilitiesCurrent liabilities have increased by 5.4% to ¥6,764.2 billion compared to March 31, 2015. This was mainly due to increases in commercial papers by ¥299.2 billion and current portion of bonds by ¥141.1 billion.Long-term liabilities have increased by 1.6% to ¥5,468.7 billion compared to March 31, 2015. This was mainly due to increases innet defined benefit liability by ¥87.9 billion, long-term borrowings by ¥38.4 billion and deferred tax liabilities by ¥18.3 billion despite a decrease in bonds by ¥125.5 billion. As a result, Total liabilities have increased by 3.7% to ¥12,232.9 billion compared to March 31, 2015.
■ Net AssetsNet assets have decreased by 2.0% to ¥5,140.7 billion compared to ¥5,247.3 billion as of March 31, 2015. This was mainly due to increases in translation adjustments (loss) by ¥335.6 billion and remeasurements of defined benefit plans (loss) by ¥73.8 billion and a decrease in unrealized holding gain and loss on securities by ¥31.6 billion despite an increase in retained earnings by ¥338.9 billion.
Cash and cash equivalents at the end of fiscal year 2015 increased by ¥189.5 billion or 23.6% to ¥992.1 billion, attributable to increases in inflows from operating activities and financing activities despite of an increase of cash outflows of investing activities.
■ Operating ActivitiesCash and cash equivalents provided by operating activities amounted to ¥927.0 billion in fiscal year 2015, an increase of ¥234.3billion from ¥692.7 billion provided in the prior fiscal year. This was mainly attributable to an increase in proceeds from business operations, a decrease in trade notes and accounts receivables and growth of increase in accounts payable despite anincrease in sales finance receivables.
■ Investing ActivitiesCash and cash equivalents used in investing activities amounted to ¥1,229.3 billion in fiscal year 2015, an increase of ¥207.3billion from ¥1,022.0 billion used in the prior fiscal year. This was mainly due to an increase in net payments from purchase and sales of leased vehicles despite an increase in proceeds from a decrease in restricted cash.
■ Financing ActivitiesCash and cash equivalents provided by financing activities amounted to ¥530.6 billion in fiscal year 2015, an increase of ¥284.7billion from the inflows of ¥245.9 billion in the prior fiscal year. This was mainly due to an increase in net proceeds from borrowing and refund of long-term borrowings despite a decrease in proceeds from issuance of bonds and increases in purchase of treasury stock and cash dividends paid.
Nissan Motor Co., Ltd. (7201) FY2015 Consolidated Financial Results
- 4 -
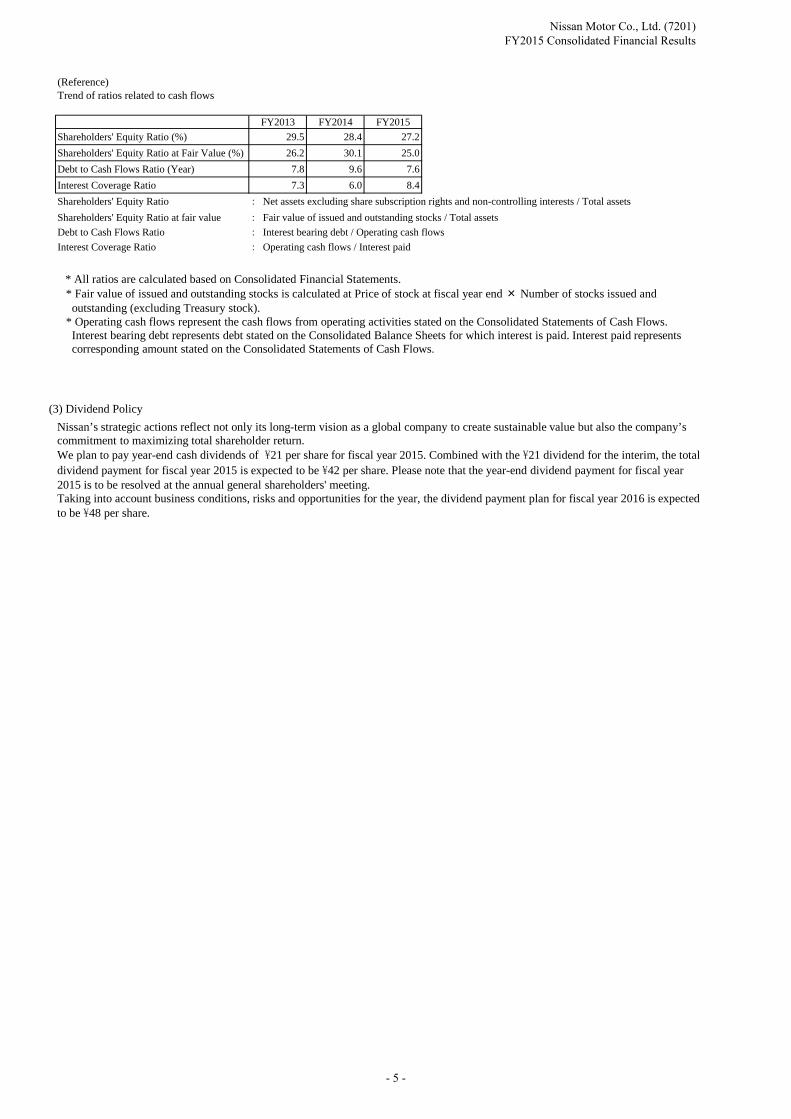
(Reference)Trend of ratios related to cash flows
FY2013 FY2014 FY2015
Shareholders' Equity Ratio (%) 29.5 28.4 27.2
Shareholders' Equity Ratio at Fair Value (%) 26.2 30.1 25.0
Debt to Cash Flows Ratio (Year) 7.8 9.6 7.6
Interest Coverage Ratio 7.3 6.0 8.4
Shareholders' Equity Ratio : Net assets excluding share subscription rights and non-controlling interests / Total assets
Shareholders' Equity Ratio at fair value : Fair value of issued and outstanding stocks / Total assets
Debt to Cash Flows Ratio : Interest bearing debt / Operating cash flows
Interest Coverage Ratio : Operating cash flows / Interest paid
(3) Dividend Policy
Nissan’s strategic actions reflect not only its long-term vision as a global company to create sustainable value but also the company’s commitment to maximizing total shareholder return. We plan to pay year-end cash dividends of ¥21 per share for fiscal year 2015. Combined with the ¥21 dividend for the interim, the total dividend payment for fiscal year 2015 is expected to be ¥42 per share. Please note that the year-end dividend payment for fiscal year 2015 is to be resolved at the annual general shareholders' meeting.Taking into account business conditions, risks and opportunities for the year, the dividend payment plan for fiscal year 2016 is expected to be ¥48 per share.
* All ratios are calculated based on Consolidated Financial Statements.* Fair value of issued and outstanding stocks is calculated at Price of stock at fiscal year end × Number of stocks issued and
outstanding (excluding Treasury stock).* Operating cash flows represent the cash flows from operating activities stated on the Consolidated Statements of Cash Flows. Interest bearing debt represents debt stated on the Consolidated Balance Sheets for which interest is paid. Interest paid represents corresponding amount stated on the Consolidated Statements of Cash Flows.
Nissan Motor Co., Ltd. (7201) FY2015 Consolidated Financial Results
- 5 -

2. MANAGEMENT POLICY
(1) Management Policy of the Company
(2) Medium and Long-term Strategies, Management Target and Issues to be Tackled
3. BASIC RATIONALE ON SELECTION OF ACCOUNTING STANDARDS
Guided by the vision of Enriching People's Lives, Nissan is aiming to provide unique and innovative automotive products and services that deliver superior measurable values to all stakeholders in alliance with Renault.
Nissan is operating its business based on the mid-term plan, “NISSAN POWER 88” for the fiscal years 2011 through 2016.“Power” derives its significance from the strengths and efforts we will apply to our brands and sales. Our commitment is to renew our focus on the overall customer experience, elevating Nissan’s brand power and ensuring quality excellence for every person who buys a Nissan car.“88” denotes the measurable rewards from achieving our plan. We aim to achieve a global market share of 8% from 5.8% in fiscal year 2010, and we will increase our corporate operating profit to a sustainable 8% from 6.1% in fiscal year 2010.
Nissan is implementing six strategies under "NISSAN POWER 88":
① Strengthening brand power② Enhancing sales power③ Improvement in quality④ Zero-emission leadership⑤ Business expansion⑥ Cost leadership
Together with a stronger brand, investments in products, technologies and global capacity, we aim to achieve "Nissan Power 88" and grow further beyond.
We are currently in the process of studying the adoption of International Financial Reporting Standards (IFRS) for the purpose of disclosure of financial information.
Nissan Motor Co., Ltd. (7201) FY2015 Consolidated Financial Results
- 6 -

4. CONSOLIDATED FINANCIAL STATEMENTS
(1) Consolidated Balance Sheets
(in millions of yen)
FY2014 FY2015(As of March 31, 2015) (As of March 31, 2016)
Assets Current assets Cash on hand and in banks 761,074 918,771 Trade notes and accounts receivable 888,814 837,704 Sales finance receivables 6,312,874 6,653,237 Securities 41,651 73,384 Merchandise and finished goods 853,962 857,818 Work in process 90,811 86,313 Raw materials and supplies 365,224 330,435 Deferred tax assets 226,891 251,689 Other 851,168 825,080 Allowance for doubtful accounts (75,124) (86,858) Total current assets 10,317,345 10,747,573 Fixed assets Property, plant and equipment Buildings and structures, net 661,979 645,945 Machinery, equipment and vehicles, net 3,121,627 3,182,514 Land 643,940 625,152 Construction in progress 265,119 196,718 Other, net 573,574 566,573 Total property, plant and equipment 5,266,239 5,216,902 Intangible fixed assets 114,456 130,877 Investments and other assets Investment securities 988,733 893,688 Long-term loans receivable 14,569 7,747 Net defined benefit assets 10,078 4,691 Deferred tax assets 140,669 187,106 Other 195,927 186,962 Allowance for doubtful accounts (2,357) (1,903) Total investments and other assets 1,347,619 1,278,291 Total fixed assets 6,728,314 6,626,070 Total assets 17,045,659 17,373,643
Nissan Motor Co., Ltd. (7201) FY2015 Consolidated Financial Results
- 7 -

(in millions of yen)FY2014 FY2015
(As of March 31, 2015) (As of March 31, 2016)
Liabilities Current liabilities Trade notes and accounts payable 1,554,399 1,479,689 Short-term borrowings 1,022,613 1,037,271 Current portion of long-term borrowings 1,376,780 1,350,894 Commercial papers 200,692 499,875 Current portion of bonds 216,942 357,998 Lease obligations 23,043 14,916 Accrued expenses 908,909 981,989 Deferred tax liabilities 64 51 Accrued warranty costs 112,989 106,536 Other 1,001,064 934,968 Total current liabilities 6,417,495 6,764,187 Long-term liabilities Bonds 1,095,518 969,987 Long-term borrowings 2,717,478 2,755,896 Lease obligations 18,167 14,460 Deferred tax liabilities 673,521 691,809 Accrued warranty costs 129,365 138,107 Net defined benefit liability 336,261 424,123 Other 410,592 474,329 Total long-term liabilities 5,380,902 5,468,711 Total liabilities 11,798,397 12,232,898Net assets Shareholders’ equity Common stock 605,814 605,814 Capital surplus 804,567 805,646 Retained earnings 3,811,848 4,150,740 Treasury stock (148,239) (148,684) Total shareholders’ equity 5,073,990 5,413,516 Accumulated other comprehensive income Unrealized holding gain and loss on securities 95,600 64,030 Unrealized gain and loss from hedging instruments 7,185 (4,486) Adjustment for revaluation of the accounts of the consolidated subsidiaries based on general price level accounting
(13,945) (13,945)
Translation adjustments (246,776) (582,363) Remeasurements of defined benefit plans (81,638) (155,487) Total accumulated other comprehensive income (239,574) (692,251) Share subscription rights 2,294 502 Non-controlling interests 410,552 418,978 Total net assets 5,247,262 5,140,745Total liabilities and net assets 17,045,659 17,373,643
Nissan Motor Co., Ltd. (7201) FY2015 Consolidated Financial Results
- 8 -

(2) Consolidated Statements of Income and Consolidated Statements of Comprehensive IncomeConsolidated Statements of Income
(in millions of yen)FY2014 FY2015
(From April 1, 2014 (From April 1, 2015To March 31, 2015) To March 31, 2016)
Net sales 11,375,207 12,189,519Cost of sales 9,241,341 9,796,998Gross profit 2,133,866 2,392,521Selling, general and administrative expenses Advertising expenses 336,792 342,213 Service costs 93,606 130,530 Provision for warranty costs 133,567 137,941 Other selling expenses 255,044 234,456 Salaries and wages 392,969 393,739 Retirement benefit expenses 17,511 16,137 Supplies 4,222 3,901 Depreciation and amortization 44,826 45,056 Provision for doubtful accounts 52,079 63,586 Amortization of goodwill 1,837 5,111 Other 211,852 226,573 Total selling, general and administrative expenses 1,544,305 1,599,243Operating income 589,561 793,278Non-operating income Interest income 25,323 26,467 Dividends income 6,425 5,966 Equity in earnings of affiliates 106,513 122,524 Derivative income ― 37,683 Exchange gain 66,185 ― Miscellaneous income 17,813 11,726 Total non-operating income 222,259 204,366Non-operating expenses Interest expense 29,167 24,806 Derivative loss 58,379 ― Exchange loss ― 96,452 Amortization of net retirement benefit obligation at transition 9,098 ― Miscellaneous expenses 20,944 14,114 Total non-operating expenses 117,588 135,372Ordinary income 694,232 862,272
Nissan Motor Co., Ltd. (7201) FY2015 Consolidated Financial Results
- 9 -

(in millions of yen)FY2014 FY2015
(From April 1, 2014 (From April 1, 2015To March 31, 2015) To March 31, 2016)
Special gains Gain on sales of fixed assets 20,008 9,011 Gain on sales of investment securities 2,022 23,338 Gain on contribution of securities to retirement benefit trust 17,725 ― Insurance income ― 5,287 Other 4,147 4,762 Total special gains 43,902 42,398Special losses Loss on sales of fixed assets 3,299 4,937 Loss on disposal of fixed assets 17,069 13,274 Impairment loss 16,103 42,087 Quality related costs ― 90,700 Other 14,242 20,738 Total special losses 50,713 171,736Income before income taxes 687,421 732,934 Income taxes-current 224,010 149,920 Income taxes-deferred (26,686) 30,221Total income taxes 197,324 180,141Net income 490,097 552,793Net income attributable to non-controlling interests 32,523 28,952Net income attributable to owners of parent 457,574 523,841
Nissan Motor Co., Ltd. (7201) FY2015 Consolidated Financial Results
- 10 -
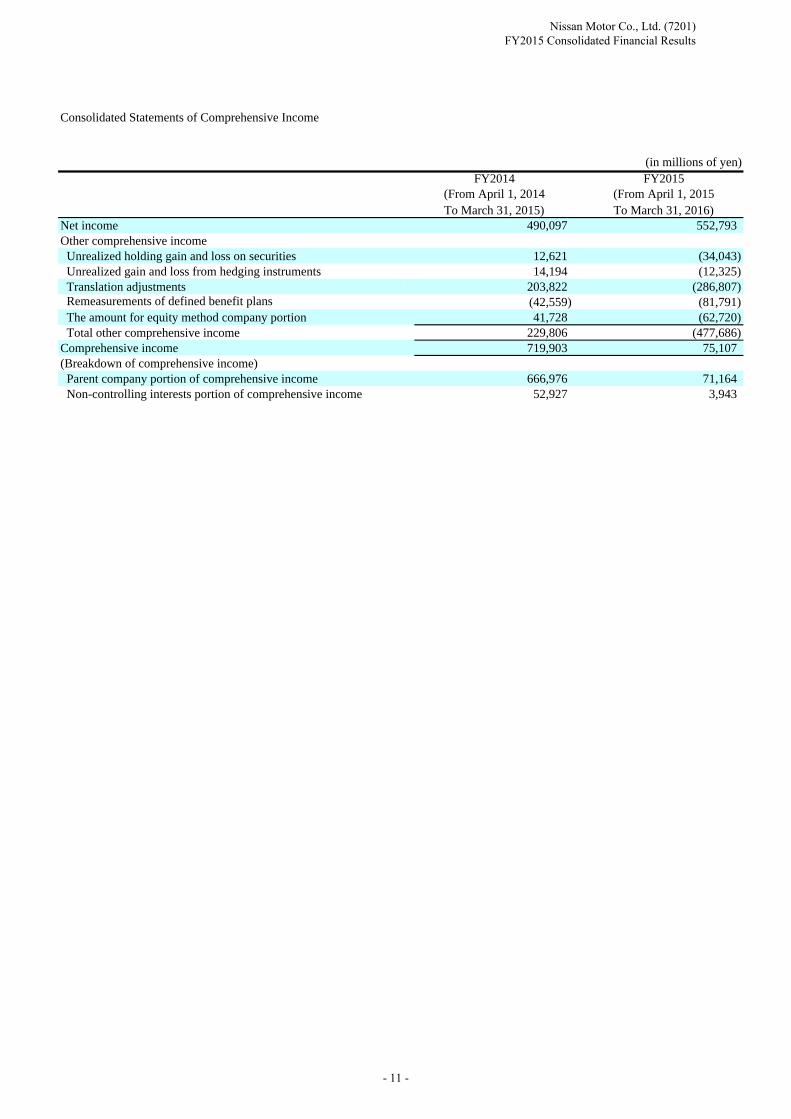
Consolidated Statements of Comprehensive Income
(in millions of yen)FY2014 FY2015
(From April 1, 2014 (From April 1, 2015To March 31, 2015) To March 31, 2016)
Net income 490,097 552,793Other comprehensive income Unrealized holding gain and loss on securities 12,621 (34,043) Unrealized gain and loss from hedging instruments 14,194 (12,325) Translation adjustments 203,822 (286,807) Remeasurements of defined benefit plans (42,559) (81,791) The amount for equity method company portion 41,728 (62,720) Total other comprehensive income 229,806 (477,686)Comprehensive income 719,903 75,107(Breakdown of comprehensive income) Parent company portion of comprehensive income 666,976 71,164 Non-controlling interests portion of comprehensive income 52,927 3,943
Nissan Motor Co., Ltd. (7201) FY2015 Consolidated Financial Results
- 11 -

Balance at the beginning ofcurrent period 605,814 804,485 3,526,646 (149,315) 4,787,630 81,630 (7,015)
Cumulative effect of changesin accounting policies (40,132) (40,132)
Restated balance 605,814 804,485 3,486,514 (149,315) 4,747,498 81,630 (7,015)
Changes of items during theperiod
Cash dividends paid (132,054) (132,054)
Net income attributable to owners of parent 457,574 457,574
Purchase of treasury stock (208) (208)
Disposal of treasury stock 82 1,284 1,366
Changes in the scope of consolidation (186) (186)
Net changes of items other than those in shareholders’ equity
13,970 14,200
Total changes of items during theperiod 82 325,334 1,076 326,492 13,970 14,200
Balance at the end of currentperiod 605,814 804,567 3,811,848 (148,239) 5,073,990 95,600 7,185
Balance at the beginning ofcurrent period (13,945) (469,202) (40,444) (448,976) 2,401 330,473 4,671,528
Cumulative effect of changesin accounting policies 192 (39,940)
Restated balance (13,945) (469,202) (40,444) (448,976) 2,401 330,665 4,631,588
Changes of items during theperiod
Cash dividends paid (132,054)
Net income attributable to owners of parent 457,574
Purchase of treasury stock (208)
Disposal of treasury stock 1,366
Changes in the scope of consolidation (186)
Net changes of items other than those in shareholders’ equity
222,426 (41,194) 209,402 (107) 79,887 289,182
Total changes of items during theperiod 222,426 (41,194) 209,402 (107) 79,887 615,674
Balance at the end of currentperiod (13,945) (246,776) (81,638) (239,574) 2,294 410,552 5,247,262
Accumulated other comprehensive income
Share subscription rights Non-controlling interests Total net assets
Adjustment forrevaluation of the accounts
of the consolidatedsubsidiaries based on general price level
accounting
Translation adjustmentsRemeasurements ofdefined benefit plans
Total accumulated othercomprehensive income
(3) Consolidated Statements of Changes in Net Assets
FY 2014 (From April 1, 2014 To March 31, 2015)(in millions of yen)
Shareholders' equity Accumulated other comprehensive income
Common stock Capital surplus Retained earnings Treasury stockTotal shareholders'
equity
Unrealized holdinggain and loss on
securities
Unrealized gain andloss from hedging
instruments
Nissan Motor Co., Ltd. (7201) FY2015 Consolidated Financial Results
- 12 -

Balance at the beginning ofcurrent period 605,814 804,567 3,811,848 (148,239) 5,073,990 95,600 7,185
Changes of items during theperiod
Cash dividends paid (157,239) (157,239)
Net income attributable to owners of parent 523,841 523,841
Purchase of treasury stock (28,907) (28,907)
Disposal of treasury stock 1,157 1,173 2,330
Retirement of treasury stock (138) (27,151) 27,289
Changes in the scope of consolidation (88) (88)
Others 60 (471) (411)
Net changes of items other than those in shareholders’ equity
(31,570) (11,671)
Total changes of items during theperiod 1,079 338,892 (445) 339,526 (31,570) (11,671)
Balance at the end of currentperiod 605,814 805,646 4,150,740 (148,684) 5,413,516 64,030 (4,486)
Balance at the beginning ofcurrent period (13,945) (246,776) (81,638) (239,574) 2,294 410,552 5,247,262
Changes of items during theperiod
Cash dividends paid (157,239)
Net income attributable to owners of parent 523,841
Purchase of treasury stock (28,907)
Disposal of treasury stock 2,330
Retirement of treasury stock
Changes in the scope of consolidation (88)
Others (411)
Net changes of items other than those in shareholders’ equity
(335,587) (73,849) (452,677) (1,792) 8,426 (446,043)
Total changes of items during theperiod (335,587) (73,849) (452,677) (1,792) 8,426 (106,517)
Balance at the end of currentperiod (13,945) (582,363) (155,487) (692,251) 502 418,978 5,140,745
Accumulated other comprehensive income
Share subscription rights Non-controlling interests Total net assets
Adjustment forrevaluation of the accounts
of the consolidatedsubsidiaries based on general price level
accounting
Translation adjustmentsRemeasurements ofdefined benefit plans
Total accumulated othercomprehensive income
FY 2015 (From April 1, 2015 To March 31, 2016)(in millions of yen)
Shareholders' equity Accumulated other comprehensive income
Common stock Capital surplus Retained earnings Treasury stockTotal shareholders'
equity
Unrealized holdinggain and loss on
securities
Unrealized gain andloss from hedging
instruments
Nissan Motor Co., Ltd. (7201) FY2015 Consolidated Financial Results
- 13 -

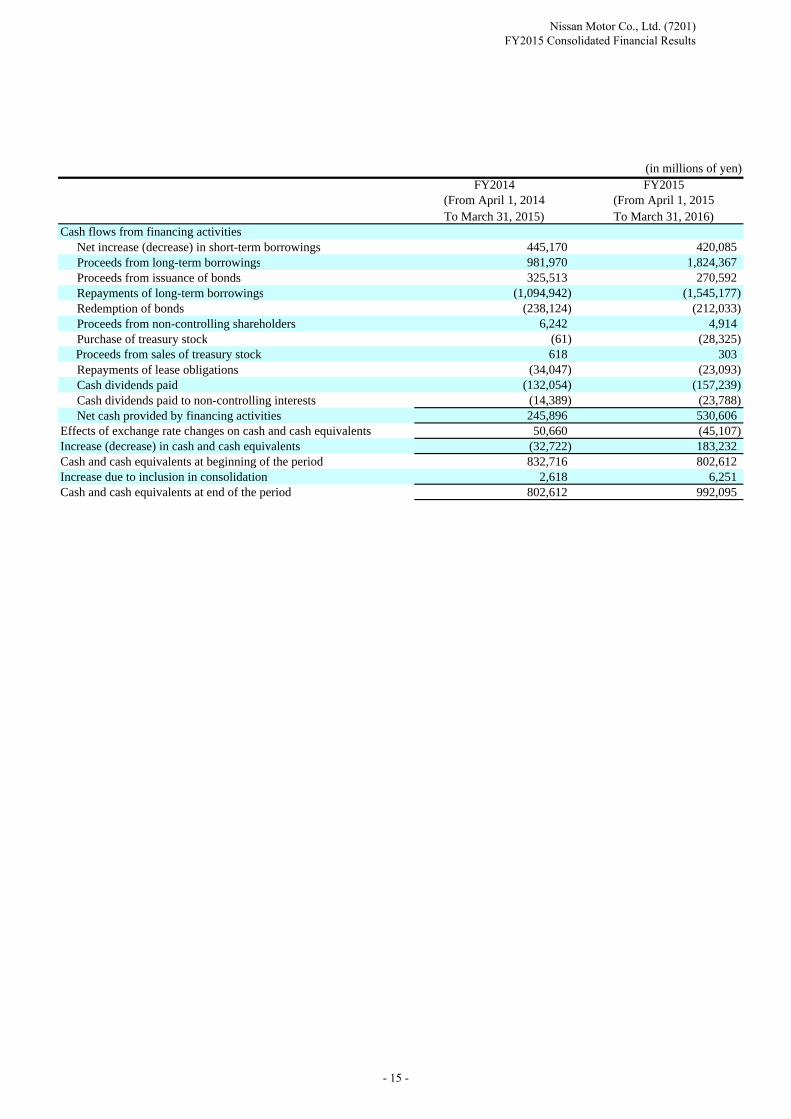
(4) Consolidated Statements of Cash Flows
(in millions of yen)FY2014 FY2015
(From April 1, 2014 (From April 1, 2015To March 31, 2015) To March 31, 2016)
Cash flows from operating activities Income before income taxes 687,421 732,934 Depreciation and amortization (for fixed assets excluding leased vehicles) 398,982 424,881 Depreciation and amortization (for long term prepaid expenses) 28,003 18,666 Depreciation and amortization (for leased vehicles) 355,292 389,339 Impairment loss 16,103 42,087 Gain on contribution of securities to retirement benefit trust (17,725) ― Increase (decrease) in allowance for doubtful receivables 13,471 16,669
Provision for residual value risk of leased vehicles (net changes) 41,911 53,737 Quality related costs ― 90,700 Interest and dividend income (31,748) (32,433) Interest expense 112,823 111,906 Equity in losses (earnings) of affiliates (106,513) (122,524) Loss (gain) on sales of fixed assets (16,709) (4,074) Loss on disposal of fixed assets 17,069 13,274 Loss (gain) on sales of investment securities (2,022) (23,338) Decrease (increase) in trade notes and accounts receivable (64,118) 15,171 Decrease (increase) in sales finance receivables (707,321) (830,209) Decrease (increase) in inventories (82,435) (17,244) Increase (decrease) in trade notes and accounts payable 125,840 217,587 Other 65,444 39,705 Subtotal 833,768 1,136,834 Interest and dividends received 25,793 33,222
Proceeds from dividends income from affiliates accounted for by equity method 145,780 144,961 Interest paid (114,695) (110,439) Income taxes paid (197,899) (277,565) Net cash provided by operating activities 692,747 927,013Cash flows from investing activities Net decrease (increase) in short-term investments 3,405 4,855 Purchase of fixed assets (513,268) (531,251) Proceeds from sales of fixed assets 88,318 80,320 Purchase of leased vehicles (1,070,654) (1,385,990) Proceeds from sales of leased vehicles 537,721 560,861 Payments of long-term loans receivable (534) (3,018) Collection of long-term loans receivable 310 8,285 Purchase of investment securities (25,591) (24,869) Proceeds from sales of investment securities 6,104 25,192
Proceeds from (payments for) sales of subsidiaries' shares resulting in changes in the scope of consolidation (156) ―Proceeds from (payments for) purchase of subsidiaries' shares resulting in changes in the scope of consolidation ― (6,354)
Net decrease (increase) in restricted cash (36,258) 44,839 Other (11,422) (2,150) Net cash used in investing activities (1,022,025) (1,229,280)
Nissan Motor Co., Ltd. (7201) FY2015 Consolidated Financial Results
- 14 -
(in millions of yen)FY2014 FY2015
(From April 1, 2014 (From April 1, 2015To March 31, 2015) To March 31, 2016)
Cash flows from financing activities Net increase (decrease) in short-term borrowings 445,170 420,085 Proceeds from long-term borrowings 981,970 1,824,367 Proceeds from issuance of bonds 325,513 270,592 Repayments of long-term borrowings (1,094,942) (1,545,177) Redemption of bonds (238,124) (212,033) Proceeds from non-controlling shareholders 6,242 4,914 Purchase of treasury stock (61) (28,325) Proceeds from sales of treasury stock 618 303 Repayments of lease obligations (34,047) (23,093) Cash dividends paid (132,054) (157,239) Cash dividends paid to non-controlling interests (14,389) (23,788) Net cash provided by financing activities 245,896 530,606Effects of exchange rate changes on cash and cash equivalents 50,660 (45,107)Increase (decrease) in cash and cash equivalents (32,722) 183,232Cash and cash equivalents at beginning of the period 832,716 802,612Increase due to inclusion in consolidation 2,618 6,251Cash and cash equivalents at end of the period 802,612 992,095
Nissan Motor Co., Ltd. (7201) FY2015 Consolidated Financial Results
- 15 -

Not applicable.
(6) Basis of Consolidated Financial Statements
① Number of Consolidated Subsidiaries and Companies Accounted for by the Equity Method
(1) Consolidated subsidiaries: 208 companies (Domestic 75, Overseas 133)
Subsidiaries other than the above companies were excluded from consolidation because the effect of not consolidating
them was immaterial to the Company's consolidated financial statements.
(2) Companies Accounted for by the Equity Method
Unconsolidated subsidiaries: 19 companies (Domestic 12, Overseas 7)
Affiliates: 33 companies (Domestic 19, Overseas 14)
Subsidiaries and affiliates other than the above companies were not accounted for by the equity method
because the effect of not adopting the equity method to them was immaterial to the Company's consolidated net income,
retained earnings and others.
(3) Change in the Scope of Consolidation and Equity Method
The change in the scope of consolidation and equity method compared with that at the year ended March 31, 2015 was
summarized as follows:
Number of companies newly included in the scope of consolidation; 16 companies
Number of companies excluded from the scope of consolidation; 1 company
Number of companies newly accounted for by the equity method; 2 companies
Number of companies ceased to be accounted for by the equity method; 2 companies
The increase in the number of consolidated subsidiaries was primarily attributable to those that were newly established,
or became material to the consolidated financial statements, and the decrease was mainly due to liquidation and sales
of their shares.
② Fiscal Period of Consolidated Subsidiaries
(1) The fiscal year of the following consolidated subsidiaries is different from that of the Company (March 31)
December 31 year end companies: Yulon Nissan Motor Co., Ltd.,
Nissan Mexicana, S.A. De C.V. and 25 other overseas subsidiaries
(2) Nissan Mexicana, S.A. De C.V. and 12 other companies whose fiscal year end is December 31 close their
books of account at March 31 for consolidation reporting purpose.
With respect to Yulon Nissan Motor Co., Ltd. and 13 other companies, the necessary adjustments
were made in consolidation to reflect any significant transactions from January 1 to March 31.
(5) Events and Conditions which indicate there could be Substantial Doubt about Going Concern Assumption
Nissan Motor Co., Ltd. (7201) FY2015 Consolidated Financial Results
- 16 -

(7) Changes in accounting policies
(8) Additional information
ASBJ Statement No. 21, “Revised Accounting Standard for Business Combinations” (released on September 13, 2013, hereinafter the “Accounting Standard for Business Combinations”), ASBJ Statement No. 22, “Revised Accounting Standard for Consolidated Financial Statements” (released on September 13, 2013, hereinafter the “Consolidated Accounting Standard”), ASBJ Statement No. 7, “Revised Accounting Standard for Business Divestitures” (released on September 13, 2013, hereinafter the “Accounting Standard for Business Divestitures”) and others have been appliedeffective from the fiscal year ending March 31, 2016. As a result, any change resulting from the Company’s ownership interests in its subsidiary when the Company retains control over the subsidiary is accounted for as capital surplus, and acquisition related costs are expensed in the year in which the costs are incurred. For any business combinations on or after the beginning of the fiscal year ending March 31, 2016, subsequent measurement of the provisional amount recognized based on the purchase price allocation due to the completion of accounting for the business combination is reflected in the consolidated financial statements for the period to which the date of that business combination occurs. In addition, the presentation method of net income was amended as well as “Minority interests” to “Non-controlling interests.” To reflect these changes in presentation, adjustments have been made to the consolidated financial statements for the fiscal year ending March 31, 2015 presented herein. In the consolidated statements of cash flows for the fiscal year ending March 31, 2016, cash flows from changes in ownership interests in subsidiaries that do not result in change in scope of consolidation are recognized under “cash flows from financing activities,” whereas cash flows concerning the costs related to the purchase of ownership interests in subsidiaries that result in a change in the scope of consolidation or the expenses incurred in relation to changes in ownership interests in subsidiaries that do not result in change in scope of consolidation are recognized under “cash flows from operating activities.”The aforementioned accounting standards are adopted on or after the beginning of the fiscal year ending March 31, 2016 and thereafter, according to the transitional treatment provided for in Paragraph 58-2 (4) of the Accounting Standard for Business Combinations, Paragraph 44-5 (4) of the Consolidated Accounting Standard and Paragraph 57-4 (4) of the Accounting Standard for Business Divestitures.The effect of these changes on income before income taxes for the fiscal year ending March 31, 2016, capital surplus as of the end of the fiscal year ending March 31, 2016 and the amount per share is immaterial.
ASBJ Guidance No. 26, “Implementation Guidance on Recoverability of Deferred Tax Assets” (released on March 28, 2016) has been earlyapplied to the consolidated financial statements relating to the end of the current fiscal year.
Nissan Motor Co., Ltd. (7201) FY2015 Consolidated Financial Results
- 17 -

(9) Notes to Consolidated Financial Statements
① For Consolidated statements of changes in net assets
(1) Shares issued and outstanding
(Outline of changes)
Detail of the decrease is as follows:Decrease due to retirement of treasury stock 26,000 thousand shares
(2) Treasury Stock
(Outline of changes)
Details of the increase are as follows:Increase due to purchase of treasury stock thousand sharesIncrease in stocks held by affiliates accounted for by the equity method thousand sharesIncrease due to purchase of stocks less than a standard unit thousand shares
Details of the decrease are as follows:Decrease due to retirement of treasury stock 26,000 thousand sharesDecrease in stocks held by affiliates accounted for by the equity method 1,724 thousand sharesDecrease due to exercising stock options 309 thousand shares
(3) Share subscription rights
(4) Dividends ① Dividends paid
Annual general meetingof the shareholderson June 23, 2015
Meeting of the Board ofDirectors on
November 2, 2015
Note: Total dividends were obtained by deducting the amount corresponding to the equity of Renault shares held by the Company.
② Dividends of which cutoff date was in FY2015 and effective date will be in the next fiscal year
Type of shares Common stockResources of dividends Retained earningsTotal dividends \87,540 million (Dividends per share: \21)Cutoff date March 31, 2016Effective date Undetermined
Note: Total dividends were obtained by deducting the amount corresponding to the equity of Renault shares held by the Company.
Number of shares at theend of current fiscal year
Type of sharesNumber of shares at the
beginning of current fiscal yearIncrease Decrease
Number of shares at theend of current fiscal year
Common stock(in thousands)
4,520,715 ― (26,000) 4,494,715
26,000
Type of sharesNumber of shares at the
beginning of current fiscal yearIncrease Decrease
Common stock(in thousands)
327,196 27,056 (28,033) 326,219
Parent company Subscription rights as stock options ― 502
1,03521
Company DescriptionType of
shares to beissued
Number of shares to be issued (in thousands)At the end of current fiscal
year (in millions of yen)
At thebeginning ofcurrent fiscal
year
Increase DecreaseAt the end ofcurrent fiscal
year
June 24, 2015
Total ― 502
ResolutionType ofshares
Total dividends Dividends per shareCutoff date Effective date
(in millions of yen) (yen)
Commonstock
69,195 16.5
November 26, 2015
March 31, 2015
Commonstock
88,044 21 September 30, 2015
Nissan Motor Co., Ltd. (7201) FY2015 Consolidated Financial Results
- 18 -

② For Consolidated statements of cash flows
Cash and cash equivalents as of the year end are reconciled to the accounts reported in the consolidated balance sheets as follows:
(in millions of yen)
FY2014(From April 1, 2014To March 31, 2015)
FY2015(From April 1, 2015To March 31, 2016)
Cash on hand and in banks 761,074 918,771
Time deposits with maturities of more than three months (113) (60)
Cash equivalents included in securities (*) 41,651 73,384
Cash and cash equivalents 802,612 992,095
* These represent short-term highly liquid investments readily convertible into cash held by foreign subsidiaries.
Nissan Motor Co., Ltd. (7201) FY2015 Consolidated Financial Results
- 19 -

③ Segments of an enterprise and related information
(Segment information)1. General information about reportable segments
2. Calculation method of net sales, profits or losses, assets and other items by reportable segments
The reportable segments of the Group are components for which discrete financial information is available and whose operating results are regularly reviewed by the Executive Committee to make decision about resource allocation and to assess their performance.Businesses of the Group are segmented into Automobile and Sales Financing based on feature of products and services. The Automobile business includes manufacturing and sales of vehicles and related parts. The Sales Financing business provides sales finance service and leasing to support sales activities of the above business.
The accounting method for the reportable segments is the same as basis of preparation for the consolidated financial statements. The segment profits are based on operating income. Inter-segment sales are based on the price in arms-lengths transaction. The segment assets are based on total assets.
Nissan Motor Co., Ltd. (7201) FY2015 Consolidated Financial Results
- 20 -

3. Net sales, profits or losses, assets and other items by reportable segmentsThe Year Ended March 31, 2015 (From April 1, 2014 To March 31, 2015) (in millions of yen)
Net sales
Sales to third parties 10,594,206 781,001 11,375,207 ― 11,375,207
Inter-segment sales or transfers 105,425 30,329 135,754 (135,754) ―
10,699,631 811,330 11,510,961 (135,754) 11,375,207
Segment profits 374,847 195,497 570,344 19,217 589,561
Segment assets 9,666,338 9,281,313 18,947,651 (1,901,992) 17,045,659
Other items
Depreciation and amortization expense 419,126 363,151 782,277 ― 782,277
Amortization of goodwill 1,837 ― 1,837 ― 1,837
Interest expense (Cost of sales) ― 112,399 112,399 (28,743) 83,656
Investment amounts to equity method companies 705,403 10,271 715,674 ― 715,674
Increase amounts of fixed assets and intangible fixed assets 469,858 1,121,134 1,590,992 ― 1,590,992
Prior Fourth Quarter (From January 1, 2015 To March 31, 2015) (in millions of yen)
Net sales
Sales to third parties 3,072,906 213,795 3,286,701 ― 3,286,701
Inter-segment sales or transfers 33,369 8,764 42,133 (42,133) ―
3,106,275 222,559 3,328,834 (42,133) 3,286,701
Segment profits 113,205 54,635 167,840 3,803 171,643
Total
Total
Reportable segments Elimination ofinter-segmenttransactions
Prior FourthQuarterAutomobile Sales Financing Total
Reportable segments Elimination ofinter-segmenttransactions
The year endedMarch 31, 2015Automobile Sales Financing Total
Nissan Motor Co., Ltd. (7201) FY2015 Consolidated Financial Results
- 21 -

The Year Ended March 31, 2016 (From April 1, 2015 To March 31, 2016) (in millions of yen)
Net sales
Sales to third parties 11,265,880 923,639 12,189,519 ― 12,189,519
Inter-segment sales or transfers 115,222 41,235 156,457 (156,457) ―
11,381,102 964,874 12,345,976 (156,457) 12,189,519
Segment profits 540,014 232,111 772,125 21,153 793,278
Segment assets 9,458,723 9,719,929 19,178,652 (1,805,009) 17,373,643
Other items
Depreciation and amortization expense 399,162 433,724 832,886 ― 832,886
Amortization of goodwill 5,111 ― 5,111 ― 5,111
Interest expense (Cost of sales) ― 122,070 122,070 (34,969) 87,101
Investment amounts to equity method companies 673,428 4,907 678,335 ― 678,335
Increase amounts of fixed assets and intangible fixed assets 477,731 1,441,926 1,919,657 ― 1,919,657
Current Fourth Quarter (From January 1, 2016 To March 31, 2016) (in millions of yen)
Net sales
Sales to third parties 3,018,255 228,238 3,246,493 ― 3,246,493
Inter-segment sales or transfers 32,378 14,767 47,145 (47,145) ―
3,050,633 243,005 3,293,638 (47,145) 3,246,493
Segment profits 145,087 56,974 202,061 3,682 205,743
Total
Total
Reportable segments Elimination ofinter-segmenttransactions
Current FourthQuarterAutomobile Sales Financing Total
Reportable segments Elimination ofinter-segmenttransactions
The year endedMarch 31, 2016Automobile Sales Financing Total
Nissan Motor Co., Ltd. (7201) FY2015 Consolidated Financial Results
- 22 -
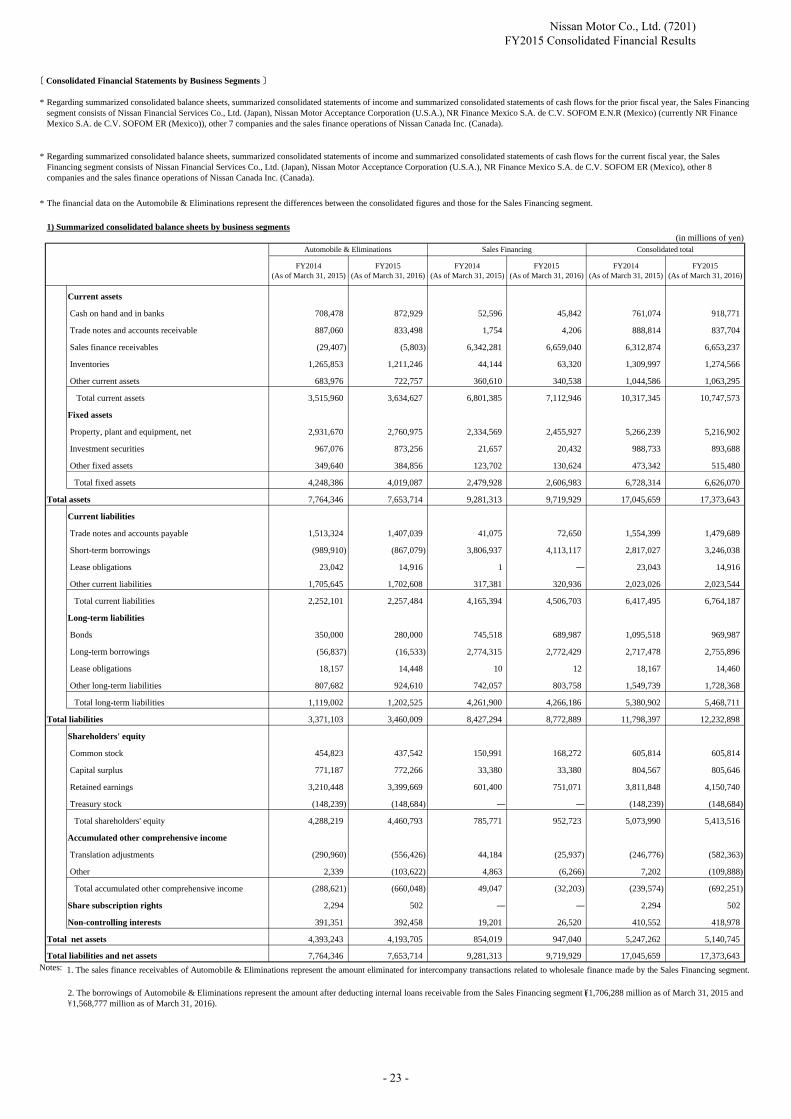
〔 Consolidated Financial Statements by Business Segments 〕
*
*
*
1) Summarized consolidated balance sheets by business segments(in millions of yen)
FY2014(As of March 31, 2015)
FY2015(As of March 31, 2016)
FY2014(As of March 31, 2015)
FY2015(As of March 31, 2016)
FY2014(As of March 31, 2015)
FY2015(As of March 31, 2016)
Current assets
Cash on hand and in banks 708,478 872,929 52,596 45,842 761,074 918,771
Trade notes and accounts receivable 887,060 833,498 1,754 4,206 888,814 837,704
Sales finance receivables (29,407) (5,803) 6,342,281 6,659,040 6,312,874 6,653,237
Inventories 1,265,853 1,211,246 44,144 63,320 1,309,997 1,274,566
Other current assets 683,976 722,757 360,610 340,538 1,044,586 1,063,295
Total current assets 3,515,960 3,634,627 6,801,385 7,112,946 10,317,345 10,747,573
Fixed assets
Property, plant and equipment, net 2,931,670 2,760,975 2,334,569 2,455,927 5,266,239 5,216,902
Investment securities 967,076 873,256 21,657 20,432 988,733 893,688
Other fixed assets 349,640 384,856 123,702 130,624 473,342 515,480
Total fixed assets 4,248,386 4,019,087 2,479,928 2,606,983 6,728,314 6,626,070
Total assets 7,764,346 7,653,714 9,281,313 9,719,929 17,045,659 17,373,643
Current liabilities
Trade notes and accounts payable 1,513,324 1,407,039 41,075 72,650 1,554,399 1,479,689
Short-term borrowings (989,910) (867,079) 3,806,937 4,113,117 2,817,027 3,246,038
Lease obligations 23,042 14,916 1 ― 23,043 14,916
Other current liabilities 1,705,645 1,702,608 317,381 320,936 2,023,026 2,023,544
Total current liabilities 2,252,101 2,257,484 4,165,394 4,506,703 6,417,495 6,764,187
Long-term liabilities
Bonds 350,000 280,000 745,518 689,987 1,095,518 969,987
Long-term borrowings (56,837) (16,533) 2,774,315 2,772,429 2,717,478 2,755,896
Lease obligations 18,157 14,448 10 12 18,167 14,460
Other long-term liabilities 807,682 924,610 742,057 803,758 1,549,739 1,728,368
Total long-term liabilities 1,119,002 1,202,525 4,261,900 4,266,186 5,380,902 5,468,711
Total liabilities 3,371,103 3,460,009 8,427,294 8,772,889 11,798,397 12,232,898
Shareholders' equity
Common stock 454,823 437,542 150,991 168,272 605,814 605,814
Capital surplus 771,187 772,266 33,380 33,380 804,567 805,646
Retained earnings 3,210,448 3,399,669 601,400 751,071 3,811,848 4,150,740
Treasury stock (148,239) (148,684) ― ― (148,239) (148,684)
Total shareholders' equity 4,288,219 4,460,793 785,771 952,723 5,073,990 5,413,516
Accumulated other comprehensive income
Translation adjustments (290,960) (556,426) 44,184 (25,937) (246,776) (582,363)
Other 2,339 (103,622) 4,863 (6,266) 7,202 (109,888)
Total accumulated other comprehensive income (288,621) (660,048) 49,047 (32,203) (239,574) (692,251)
Share subscription rights 2,294 502 ― ― 2,294 502
Non-controlling interests 391,351 392,458 19,201 26,520 410,552 418,978
Total net assets 4,393,243 4,193,705 854,019 947,040 5,247,262 5,140,745
Total liabilities and net assets 7,764,346 7,653,714 9,281,313 9,719,929 17,045,659 17,373,643Notes:
2. The borrowings of Automobile & Eliminations represent the amount after deducting internal loans receivable from the Sales Financing segment (\1,706,288 million as of March 31, 2015 and\1,568,777 million as of March 31, 2016).
Regarding summarized consolidated balance sheets, summarized consolidated statements of income and summarized consolidated statements of cash flows for the prior fiscal year, the Sales Financingsegment consists of Nissan Financial Services Co., Ltd. (Japan), Nissan Motor Acceptance Corporation (U.S.A.), NR Finance Mexico S.A. de C.V. SOFOM E.N.R (Mexico) (currently NR FinanceMexico S.A. de C.V. SOFOM ER (Mexico)), other 7 companies and the sales finance operations of Nissan Canada Inc. (Canada).
Regarding summarized consolidated balance sheets, summarized consolidated statements of income and summarized consolidated statements of cash flows for the current fiscal year, the SalesFinancing segment consists of Nissan Financial Services Co., Ltd. (Japan), Nissan Motor Acceptance Corporation (U.S.A.), NR Finance Mexico S.A. de C.V. SOFOM ER (Mexico), other 8companies and the sales finance operations of Nissan Canada Inc. (Canada).
The financial data on the Automobile & Eliminations represent the differences between the consolidated figures and those for the Sales Financing segment.
Automobile & Eliminations Sales Financing Consolidated total
1. The sales finance receivables of Automobile & Eliminations represent the amount eliminated for intercompany transactions related to wholesale finance made by the Sales Financing segment.
Nissan Motor Co., Ltd. (7201) FY2015 Consolidated Financial Results
- 23 -

( Interest bearing debt by business segments )
(in millions of yen)
FY2014(As of March 31,
2015)
FY2015(As of March 31,
2016)
FY2014(As of March 31,
2015)
FY2015(As of March 31,
2016)
FY2014(As of March 31,
2015)
FY2015(As of March 31,
2016)
183,763 453,577 2,633,264 2,792,461 2,817,027 3,246,038
(1,173,673) (1,320,656) 1,173,673 1,320,656 ― ―
(989,910) (867,079) 3,806,937 4,113,117 2,817,027 3,246,038
350,000 280,000 745,518 689,987 1,095,518 969,987
475,778 231,588 2,241,700 2,524,308 2,717,478 2,755,896
(532,615) (248,121) 532,615 248,121 ― ―
(56,837) (16,533) 2,774,315 2,772,429 2,717,478 2,755,896
41,199 29,364 11 12 41,210 29,376
13,820 15,523 (13,820) (15,523) ― ―
(641,728) (558,725) 7,312,961 7,560,022 6,671,233 7,001,297
748,417 944,212 54,195 47,883 802,612 992,095
(1,390,145) (1,502,937) 7,258,766 7,512,139 5,868,621 6,009,202
2) Summarized consolidated statements of income by business segments(in millions of yen)
FY2014(From April 1, 2014To March 31, 2015)
FY2015(From April 1, 2015To March 31, 2016)
FY2014(From April 1, 2014To March 31, 2015)
FY2015(From April 1, 2015To March 31, 2016)
FY2014(From April 1, 2014To March 31, 2015)
FY2015(From April 1, 2015To March 31, 2016)
Net sales 10,563,877 11,224,645 811,330 964,874 11,375,207 12,189,519
Cost of sales 8,717,387 9,181,145 523,954 615,853 9,241,341 9,796,998
Gross profit 1,846,490 2,043,500 287,376 349,021 2,133,866 2,392,521
Operating income as a percentage of net sales 3.7% 5.0% 24.1% 24.1% 5.2% 6.5%
Operating income 394,064 561,167 195,497 232,111 589,561 793,278
Financial income / expenses, net 2,448 7,532 133 95 2,581 7,627
Other non-operating income and expenses, net 99,454 62,522 2,636 (1,155) 102,090 61,367
Ordinary income 495,966 631,221 198,266 231,051 694,232 862,272
487,397 502,924 200,024 230,010 687,421 732,934
Net income attributable to owners of parent 330,550 373,413 127,024 150,428 457,574 523,841
Short-term borrowings (per B/S)
Automobile & Eliminations Sales Financing Consolidated total
Short-term borrowings from third parties
Internal loans to Sales Financing
Sales Financing Consolidated total
Bonds
Long-term borrowings from third parties
Internal loans to Sales Financing
Long-term borrowings (per B/S)
Lease obligations
Internal loans from Sales Financing
Income before income taxes
Total interest bearing debt
Cash and cash equivalent
Net interest bearing debt
Automobile & Eliminations
Nissan Motor Co., Ltd. (7201) FY2015 Consolidated Financial Results
- 24 -

3) Summarized consolidated statements of cash flows by business segments(in millions of yen)
FY2014(From April 1, 2014To March 31, 2015)
FY2015(From April 1, 2015To March 31, 2016)
FY2014(From April 1, 2014To March 31, 2015)
FY2015(From April 1, 2015To March 31, 2016)
FY2014(From April 1, 2014To March 31, 2015)
FY2015(From April 1, 2015To March 31, 2016)
Cash flows from operating activities
Income before income taxes 487,397 502,924 200,024 230,010 687,421 732,934
Depreciation and amortization 419,126 399,162 363,151 433,724 782,277 832,886
Decrease (increase) in sales finance receivables 2,072 (23,369) (709,393) (806,840) (707,321) (830,209)
Others (101,030) 12,548 31,400 178,854 (69,630) 191,402
Subtotal 807,565 891,265 (114,818) 35,748 692,747 927,013
Cash flows from investing activities
Proceeds from sales of investment securities 3,691 25,192 2,257 ― 5,948 25,192
Purchase of fixed assets (453,281) (445,407) (59,987) (85,844) (513,268) (531,251)
Proceeds from sales of fixed assets 42,149 30,017 46,169 50,303 88,318 80,320
Purchase of leased vehicles (142) (33) (1,070,512) (1,385,957) (1,070,654) (1,385,990)
Proceeds from sales of leased vehicles 64 21 537,657 560,840 537,721 560,861
Others (34,218) (19,834) (35,872) 41,422 (70,090) 21,588
Subtotal (441,737) (410,044) (580,288) (819,236) (1,022,025) (1,229,280)
Cash flows from financing activities
Net increase (decrease) in short-term borrowings 201,448 280,965 243,722 139,120 445,170 420,085
Net changes in long-term borrowings and redemption of bonds (520,522) (288,722) 169,426 355,879 (351,096) 67,157
Proceeds from issuance of bonds 119,739 ― 205,774 270,592 325,513 270,592
Others (184,386) (237,177) 10,695 9,949 (173,691) (227,228)
Subtotal (383,721) (244,934) 629,617 775,540 245,896 530,606
Effect of exchange rate changes on cash and cash equivalents 47,383 (40,493) 3,277 (4,614) 50,660 (45,107)
Increase (decrease) in cash and cash equivalents 29,490 195,794 (62,212) (12,562) (32,722) 183,232
Cash and cash equivalents at beginning of the period 717,379 748,417 115,337 54,195 832,716 802,612
Increase due to inclusion in consolidation 1,548 1 1,070 6,250 2,618 6,251
Cash and cash equivalents at end of the period 748,417 944,212 54,195 47,883 802,612 992,095
2. The net change in long-term borrowings and redemption of bonds of Automobile & Eliminations includes the amounts eliminated for net increase (\229,711 million for the year endedMarch 31, 2015 and \153,100 million for the year ended March 31, 2016) in internal loans receivables from the Sales Financing segment.
Automobile & Eliminations Sales Financing Consolidated total
Notes: 1. The increase (decrease) in short-term borrowings of Automobile & Eliminations includes the amounts eliminated for net decrease (\267,575 million for the year ended March 31, 2015and \163,093 million for the year ended March 31, 2016) in internal loans receivables from the Sales Financing segment.
Nissan Motor Co., Ltd. (7201) FY2015 Consolidated Financial Results
- 25 -

〔 Net sales and profits or losses by region 〕
The Year Ended March 31, 2015 (From April 1, 2014 To March 31, 2015) (in millions of yen)
Japan Europe AsiaOther
overseascountries
Total Eliminations Consolidated
(1) Sales to third parties 2,173,459 5,235,620 1,706,675 1,109,832 1,149,621 11,375,207 ― 11,375,207
(2) Inter-segment sales 2,342,538 379,669 219,918 625,566 8,449 3,576,140 (3,576,140) ―
Total 4,515,997 5,615,289 1,926,593 1,735,398 1,158,070 14,951,347 (3,576,140) 11,375,207
244,068 295,729 (25,792) 55,676 (18,930) 550,751 38,810 589,561
Prior Fourth Quarter (From January 1, 2015 To March 31, 2015) (in millions of yen)
Japan Europe AsiaOther
overseascountries
Total Eliminations Consolidated
(1) Sales to third parties 646,960 1,543,269 443,169 325,718 327,585 3,286,701 ― 3,286,701
(2) Inter-segment sales 605,103 106,111 56,527 172,877 1,619 942,237 (942,237) ―
Total 1,252,063 1,649,380 499,696 498,595 329,204 4,228,938 (942,237) 3,286,701
62,903 79,864 (10,613) 21,591 (336) 153,409 18,234 171,643
Notes:
(1) North America : The United States of America, Canada and Mexico
(2) Europe : France, The United Kingdom, Spain, Russia and other European countries
(3) Asia : China, Thailand, India and other Asian countries
(4) Other overseas countries : Oceania, Middle East, Central and South America excluding Mexico and South Africa
1. Regions are representing the location of the Company and its group companies.
2. Areas are segmented based on their geographical proximity and their mutual operational relationship.
3. Major countries and areas which belong to segments other than Japan are as follows:
NorthAmerica
Net sales
Operating income (loss)
NorthAmerica
Net sales
Operating income (loss)
Nissan Motor Co., Ltd. (7201) FY2015 Consolidated Financial Results
- 26 -

The Year Ended March 31, 2016 (From April 1, 2015 To March 31, 2016) (in millions of yen)
Japan Europe AsiaOther
overseascountries
Total Eliminations Consolidated
(1) Sales to third parties 2,201,323 6,032,468 1,678,133 1,116,640 1,160,955 12,189,519 ― 12,189,519
(2) Inter-segment sales 2,302,967 467,967 237,329 670,814 7,779 3,686,856 (3,686,856) ―
Total 4,504,290 6,500,435 1,915,462 1,787,454 1,168,734 15,876,375 (3,686,856) 12,189,519
303,596 399,084 (14,222) 87,456 5,977 781,891 11,387 793,278
Current Fourth Quarter (From January 1, 2016 To March 31, 2016) (in millions of yen)
Japan Europe AsiaOther
overseascountries
Total Eliminations Consolidated
(1) Sales to third parties 631,479 1,558,209 477,815 303,574 275,416 3,246,493 ― 3,246,493
(2) Inter-segment sales 531,092 108,110 49,013 160,499 2,201 850,915 (850,915) ―
Total 1,162,571 1,666,319 526,828 464,073 277,617 4,097,408 (850,915) 3,246,493
59,902 106,653 (11,418) 28,754 (2,737) 181,154 24,589 205,743
Notes:
(1) North America : The United States of America, Canada and Mexico
(2) Europe : France, The United Kingdom, Spain, Russia and other European countries
(3) Asia : China, Thailand, India and other Asian countries
(4) Other overseas countries : Oceania, Middle East, Central and South America excluding Mexico and South Africa
1. Regions are representing the location of the Company and its group companies.
2. Areas are segmented based on their geographical proximity and their mutual operational relationship.
3. Major countries and areas which belong to segments other than Japan are as follows:
NorthAmerica
Net sales
Operating income (loss)
NorthAmerica
Net sales
Operating income (loss)
Nissan Motor Co., Ltd. (7201) FY2015 Consolidated Financial Results
- 27 -

【Related information】1. Information about geographical area
(1) Net sales
The Year Ended March 31, 2015 (From April 1, 2014 To March 31, 2015) (in millions of yen)
5,063,298 4,191,022 1,745,837 1,374,551 1,338,521 11,375,207
Prior Fourth Quarter (From January 1, 2015 To March 31, 2015) (in millions of yen)
1,495,065 1,258,186 461,449 395,188 375,630 3,286,701
Notes: 1. Regions are representing customers' location.
2. Areas are segmented based on their geographical proximity and their mutual operational relationship.
3. Major countries and areas which belong to segments other than Japan are as follows:
(1) North America : The United States of America, Canada and Mexico
(2) Europe : France, The United Kingdom, Spain, Russia and other European countries
(3) Asia : China, Thailand, India and other Asian countries
(4) Other overseas countries : Oceania, Middle East, Central and South America excluding Mexico, South Africa, etc.
The Year Ended March 31, 2016 (From April 1, 2015 To March 31, 2016) (in millions of yen)
5,861,732 4,862,037 1,748,122 1,443,889 1,336,126 12,189,519
Current Fourth Quarter (From January 1, 2016 To March 31, 2016) (in millions of yen)
1,516,773 1,272,131 499,200 376,126 319,555 3,246,493
Notes: 1. Regions are representing customers' location.
2. Areas are segmented based on their geographical proximity and their mutual operational relationship.
3. Major countries and areas which belong to segments other than Japan are as follows:
(1) North America : The United States of America, Canada and Mexico
(2) Europe : France, The United Kingdom, Spain, Russia and other European countries
(3) Asia : China, Thailand, India and other Asian countries
(4) Other overseas countries : Oceania, Middle East, Central and South America excluding Mexico, South Africa, etc.
Total
U.S.A.
JapanNorth America
Europe AsiaOther overseas
countries
1,853,000
JapanNorth America
Europe Asia Total
U.S.A.
559,369
JapanNorth America
Europe AsiaOther overseas
countriesTotal
U.S.A.
Other overseascountries
Total
U.S.A.
534,839
1,799,650
JapanNorth America
Europe AsiaOther overseas
countries
Nissan Motor Co., Ltd. (7201) FY2015 Consolidated Financial Results
- 28 -

(2) Property, plant and equipmentThe Year Ended March 31, 2015 (As of March 31, 2015) (in millions of yen)
3,002,760 2,531,017 294,209 335,449 81,267 5,266,239
Notes: 1. Regions are representing location of the Company and its group companies.
2. Areas are segmented based on their geographical proximity and their mutual operational relationship.
3. Major countries and areas which belong to segments other than Japan are as follows:
(1) North America : The United States of America, Canada and Mexico
(2) Europe : France, The United Kingdom, Spain, Russia and other European countries
(3) Asia : China, Thailand, India and other Asian countries
(4) Other overseas countries : Oceania, Middle East, Central and South America excluding Mexico and South Africa
The Year Ended March 31, 2016 (As of March 31, 2016) (in millions of yen)
3,040,249 2,577,887 301,010 282,428 69,254 5,216,902
Notes: 1. Regions are representing location of the Company and its group companies.
2. Areas are segmented based on their geographical proximity and their mutual operational relationship.
3. Major countries and areas which belong to segments other than Japan are as follows:
(1) North America : The United States of America, Canada and Mexico
(2) Europe : France, The United Kingdom, Spain, Russia and other European countries
(3) Asia : China, Thailand, India and other Asian countries
(4) Other overseas countries : Oceania, Middle East, Central and South America excluding Mexico and South Africa
Total
U.S.A.
JapanNorth America
Europe AsiaOther overseas
countries
Total
U.S.A.
1,523,961
1,552,554
JapanNorth America
Europe AsiaOther overseas
countries
Nissan Motor Co., Ltd. (7201) FY2015 Consolidated Financial Results
- 29 -

2. Information about the impairment loss on fixed assets by reportable segments
The Year Ended March 31, 2015 (From April 1, 2014 To March 31, 2015) (in millions of yen)
Automobile Sales Financing Total
Impairment loss 16,103 ― 16,103 ― 16,103
The Year Ended March 31, 2016 (From April 1, 2015 To March 31, 2016) (in millions of yen)
Automobile Sales Financing Total
Impairment loss 41,517 570 42,087 ― 42,087
3. Information about the amortization of goodwill and unamortized balance by reportable segments
The Year Ended March 31, 2015 (From April 1, 2014 To March 31, 2015) (in millions of yen)
Automobile Sales Financing Total
Amortization of goodwill 1,837 ― 1,837 ― 1,837
Balance at the end of the year 17,381 ― 17,381 ― 17,381
The Year Ended March 31, 2016 (From April 1, 2015 To March 31, 2016) (in millions of yen)
Automobile Sales Financing Total
Amortization of goodwill 5,111 ― 5,111 ― 5,111
Balance at the end of the year 15,546 ― 15,546 ― 15,546
4. Information about the gain recognized on negative goodwill by reportable segments
The Year Ended March 31, 2015 (From April 1, 2014 To March 31, 2015)
This information is not provided due to its low materiality.
The Year Ended March 31, 2016 (From April 1, 2015 To March 31, 2016)
This information is not provided due to its low materiality.
Reportable segments Elimination ofinter-segmenttransactions
Total
Reportable segments Elimination ofinter-segmenttransactions
Total
Reportable segments Elimination ofinter-segmenttransactions
Total
Reportable segments Elimination ofinter-segmenttransactions
Total
Nissan Motor Co., Ltd. (7201) FY2015 Consolidated Financial Results
- 30 -

④ Amount per share
(yen)
Net assets per share
Basic net income per share
Diluted net income per share
Note: 1. The bases for calculation of basic net income per share and diluted net income per share are as follows:
(Exercise of warrants(Thousand of shares))
(Exercise of share subscription rights(Thousand of shares))
⑤ Significant subsequent events
1. Issuance of bonds
On April 15, 2016, the Company issued unsecured bonds. The terms and conditions of these bonds are summarized as follows:(1) ① Name of the bond 59th unsecured bonds
② Principal amount \80,000 million③ Interest rate 0.150% per annum④ Issue price \100 for a par value of \100⑤ Maturity date March 19, 2021⑥ Payment due date April 15, 2016⑦ Use of proceeds To be appropriated as redemption funds for bonds and a part of repayment of
long-term borrowings due through FY2016.
(2) ① Name of the bond 60th unsecured bonds ② Principal amount \25,000 million③ Interest rate 0.220% per annum④ Issue price \100 for a par value of \100⑤ Maturity date March 20, 2023⑥ Payment due date April 15, 2016⑦ Use of proceeds To be appropriated as redemption funds for bonds and a part of repayment of
long-term borrowings due through FY2016.
(3) ① Name of the bond 61st unsecured bonds ② Principal amount \20,000 million③ Interest rate 0.330% per annum④ Issue price \100 for a par value of \100⑤ Maturity date March 19, 2026⑥ Payment due date April 15, 2016⑦ Use of proceeds To be appropriated as redemption funds for bonds and a part of repayment of
long-term borrowings due through FY2016.
1,152.83 1,132.61
FY2014 FY2015
(From April 1, 2014To March 31, 2015)
(From April 1, 2015To March 31, 2016)
109.15 125.00
109.14 124.99
FY2014 FY2015
(From April 1, 2014To March 31, 2015)
(From April 1, 2015To March 31, 2016)
Basic net income per share
Average number of shares of common stock during the fiscalyear(Thousand of shares)
4,192,309 4,190,789
120 361
Diluted net income per share
Increase in shares of common stock(Thousand of shares)
120 361
― ―
Nissan Motor Co., Ltd. (7201) FY2015 Consolidated Financial Results
- 31 -

2. Homologation issue caused at vehicles produced by Mitsubishi Motors Corporation
The Company has suspended sales of DAYZ and DAYZ Roox series of mini-cars produced by Mitsubishi Motors Corporation (MMC) from April 20, 2016. This is a result of MMC’s announcement about the homologation issue for applicable models on the same day. MMC acknowledges its responsibility for the issue and the Company intends to recharge the adverse impact to MMC. However, considering current uncertain situation for the adverse impact on the Company, it is difficult to reasonably estimate the effects on the Company’s financial position, operating results and cash flows in the current fiscal year and onwards.
Nissan Motor Co., Ltd. (7201) FY2015 Consolidated Financial Results
- 32 -
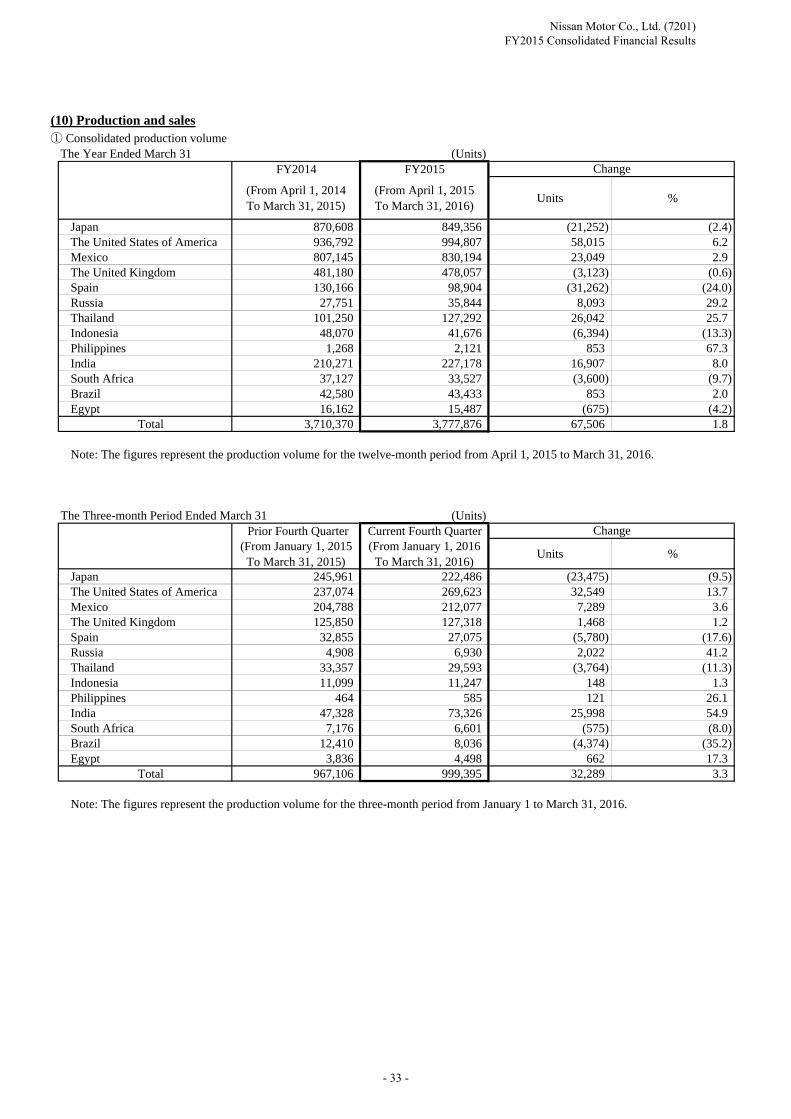
(10) Production and sales① Consolidated production volume
The Year Ended March 31 (Units)FY2014 FY2015
(From April 1, 2014To March 31, 2015)
(From April 1, 2015To March 31, 2016)
Units %
Japan 870,608 849,356 (21,252) (2.4)The United States of America 936,792 994,807 58,015 6.2Mexico 807,145 830,194 23,049 2.9The United Kingdom 481,180 478,057 (3,123) (0.6)Spain 130,166 98,904 (31,262) (24.0)Russia 27,751 35,844 8,093 29.2Thailand 101,250 127,292 26,042 25.7Indonesia 48,070 41,676 (6,394) (13.3)Philippines 1,268 2,121 853 67.3India 210,271 227,178 16,907 8.0South Africa 37,127 33,527 (3,600) (9.7)Brazil 42,580 43,433 853 2.0Egypt 16,162 15,487 (675) (4.2)
Total 3,710,370 3,777,876 67,506 1.8
Note: The figures represent the production volume for the twelve-month period from April 1, 2015 to March 31, 2016.
The Three-month Period Ended March 31 (Units) Prior Fourth Quarter Current Fourth Quarter
(From January 1, 2015To March 31, 2015)
(From January 1, 2016To March 31, 2016)
Units %
Japan 245,961 222,486 (23,475) (9.5)The United States of America 237,074 269,623 32,549 13.7Mexico 204,788 212,077 7,289 3.6The United Kingdom 125,850 127,318 1,468 1.2Spain 32,855 27,075 (5,780) (17.6)Russia 4,908 6,930 2,022 41.2Thailand 33,357 29,593 (3,764) (11.3)Indonesia 11,099 11,247 148 1.3Philippines 464 585 121 26.1India 47,328 73,326 25,998 54.9South Africa 7,176 6,601 (575) (8.0)Brazil 12,410 8,036 (4,374) (35.2)Egypt 3,836 4,498 662 17.3
Total 967,106 999,395 32,289 3.3
Note: The figures represent the production volume for the three-month period from January 1 to March 31, 2016.
Change
Change
Nissan Motor Co., Ltd. (7201) FY2015 Consolidated Financial Results
- 33 -

The Year Ended March 31 (Units)FY2014 FY2015
(From April 1, 2014To March 31, 2015)
(From April 1, 2015To March 31, 2016)
Units %
Japan 590,432 552,485 (37,947) (6.4)North America 1,836,790 1,996,165 159,375 8.7
(The United States of America included therein) 1,412,321 1,501,808 89,487 6.3Europe 770,838 748,681 (22,157) (2.9)Asia 321,386 322,907 1,521 0.5Other overseas countries 593,482 548,309 (45,173) (7.6)
Total 4,112,928 4,168,547 55,619 1.4
and Taiwan) represent the vehicles sold for the twelve-month period from April 1, 2015 to March 31, 2016.
The Three-month Period Ended March 31 (Units)Prior Fourth Quarter Current Fourth Quarter
(From January 1, 2015To March 31, 2015)
(From January 1, 2016To March 31, 2016)
Units %
Japan 194,121 176,199 (17,922) (9.2)North America 505,738 528,581 22,843 4.5
(The United States of America included therein) 391,657 402,256 10,599 2.7Europe 209,011 219,562 10,551 5.0Asia 89,864 96,617 6,753 7.5Other overseas countries 155,921 137,284 (18,637) (12.0)
Total 1,154,655 1,158,243 3,588 0.3
and Taiwan) represent the vehicles sold for the three-month period from January 1 to March 31, 2016. October 1 to December 31, 2015. Those sold in Japan, North America, Europe, Other overseas countries and Asia (excluding China
② Consolidated sales volume by region
Change
Note: The figures in China and Taiwan, which are included in “Asia” represent the sales volume for the twelve-month period from January 1 to December 31, 2015. Those sold in Japan, North America, Europe, Other overseas countries and Asia (excluding China
Change
Note: The figures in China and Taiwan, which are included in “Asia” represent the sales volume for the three-month period from
Nissan Motor Co., Ltd. (7201) FY2015 Consolidated Financial Results
- 34 -

Quarterly Consolidated Statements of Income (in millions of yen)Prior Fourth Quarter Current Fourth Quarter
(From January 1, 2015 (From January 1, 2016To March 31, 2015) To March 31, 2016)
Net sales 3,286,701 3,246,493Cost of sales 2,598,294 2,589,601Gross profit 688,407 656,892Selling, general and administrative expenses Advertising expenses 101,059 88,569 Service costs 43,385 59,977 Provision for warranty costs 41,017 34,973 Other selling expenses 114,763 77,500 Salaries and wages 114,396 91,097 Retirement benefit expenses 4,491 4,537 Supplies 917 801 Depreciation and amortization 11,928 11,773 Provision for doubtful accounts 20,137 20,743 Amortization of goodwill 454 455 Other 64,217 60,724 Total selling, general and administrative expenses 516,764 451,149Operating income 171,643 205,743Non-operating income Interest income 7,222 4,533 Dividends income 580 49 Equity in earnings of affiliates 30,622 53,476 Derivative income 19,022 52,775 Miscellaneous income 5,773 4,719 Total non-operating income 63,219 115,552Non-operating expenses Interest expense 6,513 6,399 Exchange loss 13,353 79,200 Amortization of net retirement benefit obligation at transition 2,221 ― Miscellaneous expenses 14,904 4,449 Total non-operating expenses 36,991 90,048Ordinary income 197,871 231,247
【Reference】 Quarterly Consolidated Statements of Income and Quarterly Consolidated Statements of Comprehensive IncomeThe Three-month Period Ended March 31
Nissan Motor Co., Ltd. (7201) FY2015 Consolidated Financial Results
- 35 -

(in millions of yen)Prior Fourth Quarter Current Fourth Quarter
(From January 1, 2015 (From January 1, 2016To March 31, 2015) To March 31, 2016)
Special gains Gain on sales of fixed assets 17,156 1,869 Gain on sales of investment securities 1,986 23,031 Gain on contribution of securities to retirement benefit trust 17,725 ― Insurance income ― 5,287 Other 2,140 1,451 Total special gains 39,007 31,638Special losses Loss on sales of fixed assets 1,993 1,407 Loss on disposal of fixed assets 12,516 6,370 Impairment loss 14,487 28,861 Quality related costs ― 90,700 Other 10,878 15,850 Total special losses 39,874 143,188Income before income taxes 197,004 119,697Income taxes 65,036 38,526Net income 131,968 81,171Net income attributable to non-controlling interests 13,207 10,165Net income attributable to owners of parent 118,761 71,006
Nissan Motor Co., Ltd. (7201) FY2015 Consolidated Financial Results
- 36 -

Quarterly Consolidated Statements of Comprehensive Income
(in millions of yen)
Prior fourth quarter Current fourth quarter(From January 1, 2015 (From January 1, 2016
To March 31, 2015) To March 31, 2016)Net income 131,968 81,171Other comprehensive income Unrealized holding gain and loss on securities 9,697 (16,646) Unrealized gain and loss from hedging instruments 9,369 (1,040) Translation adjustments (14,937) (145,290) Remeasurements of defined benefit plans (29,930) (91,161) The amount for equity method company portion 38,326 (18,397) Total other comprehensive income 12,525 (272,534)Comprehensive income 144,493 (191,363)(Breakdown of comprehensive income) Parent company portion of comprehensive income 126,400 (186,222) Non-controlling interests portion of comprehensive income 18,093 (5,141)
Nissan Motor Co., Ltd. (7201) FY2015 Consolidated Financial Results
- 37 -

5. NON-CONSOLIDATED FINANCIAL STATEMENTS【Non-Consolidated】
(1) Non-Consolidated Balance Sheets
(in millions of yen)FY2014 FY2015
(As of March 31, 2015) (As of March 31, 2016)Assets Current assets Cash on hand and in banks 24,365 238,148 Trade accounts receivable 522,904 514,322 Finished goods 61,396 67,798 Work in process 26,072 27,426 Raw materials and supplies 86,379 80,325 Prepaid expenses 19,729 23,999 Deferred tax assets 98,209 101,485 Short-term loans receivable from subsidiaries and affiliates 535,902 1,151,536 Other 166,600 197,257 Allowance for doubtful accounts (19,043) (18,687) Total current assets 1,522,517 2,383,614 Fixed assets Property, plant and equipment Buildings 214,572 209,423 Structures 31,276 29,830 Machinery and equipment 136,860 131,522 Vehicles 29,034 12,457 Tools, furniture and fixtures 79,507 68,479 Land 132,889 127,232 Construction in progress 12,994 18,666 Total property, plant and equipment 637,136 597,613 Intangible fixed assets 56,000 63,861 Investments and other assets Investment securities 199,394 148,459 Investments in subsidiaries and affiliates 1,708,651 1,558,474 Long-term loans receivable from subsidiaries and affiliates 846,315 187,483 Other 23,518 22,257 Allowance for doubtful accounts (198) (152) Total investments and other assets 2,777,681 1,916,522 Total fixed assets 3,470,818 2,577,998 Total assets 4,993,336 4,961,612
Nissan Motor Co., Ltd. (7201) FY2015 Consolidated Financial Results
- 38 -

【Non-Consolidated】
(in millions of yen)FY2014 FY2015
(As of March 31, 2015) (As of March 31, 2016)Liabilities Current liabilities Trade notes payable 7,023 15 Electronically recorded obligations - operating 255,383 197,240 Trade accounts payable 428,670 430,989 Short-term borrowings 309,033 385,041 Current portion of long-term borrowings 76,350 187,315 Commercial papers ― 125,000 Current portion of bonds 50,000 70,000 Lease obligations 18,551 12,000 Accounts payable-other 28,927 34,337 Accrued expenses 308,724 302,573 Income taxes payable 53,712 1,703 Deposits received 79,638 63,357 Accrued warranty costs 24,507 22,613 Other 663 32,815 Total current liabilities 1,641,184 1,865,002 Long-term liabilities Bonds 350,000 280,000 Long-term borrowings 303,462 107,908 Lease obligations 22,529 18,717 Deferred tax liabilities 52,685 41,688 Accrued warranty costs 51,064 45,008 Accrued retirement benefits 77,705 63,133 Other 21,755 49,169 Total long-term liabilities 879,200 605,625 Total liabilities 2,520,384 2,470,627
Nissan Motor Co., Ltd. (7201) FY2015 Consolidated Financial Results
- 39 -

【Non-Consolidated】
(in millions of yen)FY2014 FY2015
(As of March 31, 2015) (As of March 31, 2016)Net assets Shareholders' equity Common stock 605,813 605,813 Capital surplus Legal capital surplus 804,470 804,470 Other capital surplus 96 ― Total capital surplus 804,566 804,470 Retained earnings Legal reserve 53,838 53,838 Other retained earnings Reserve for reduction of replacement cost of specified properties 58,274 54,078 Reserve for special depreciation 30 24 Unappropriated retained earnings 895,741 955,404 Total retained earnings 1,007,884 1,063,347 Treasury stock (30,702) (31,424) Total shareholders' equity 2,387,562 2,442,206 Valuation, translation adjustments and others Unrealized holding gain and loss on securities 83,210 49,368 Unrealized gain and loss from hedging instruments (115) (1,092) Total valuation, translation adjustments and others 83,094 48,275 Share subscription rights 2,293 502 Total net assets 2,472,951 2,490,984Total liabilities and net assets 4,993,336 4,961,612
Nissan Motor Co., Ltd. (7201) FY2015 Consolidated Financial Results
- 40 -
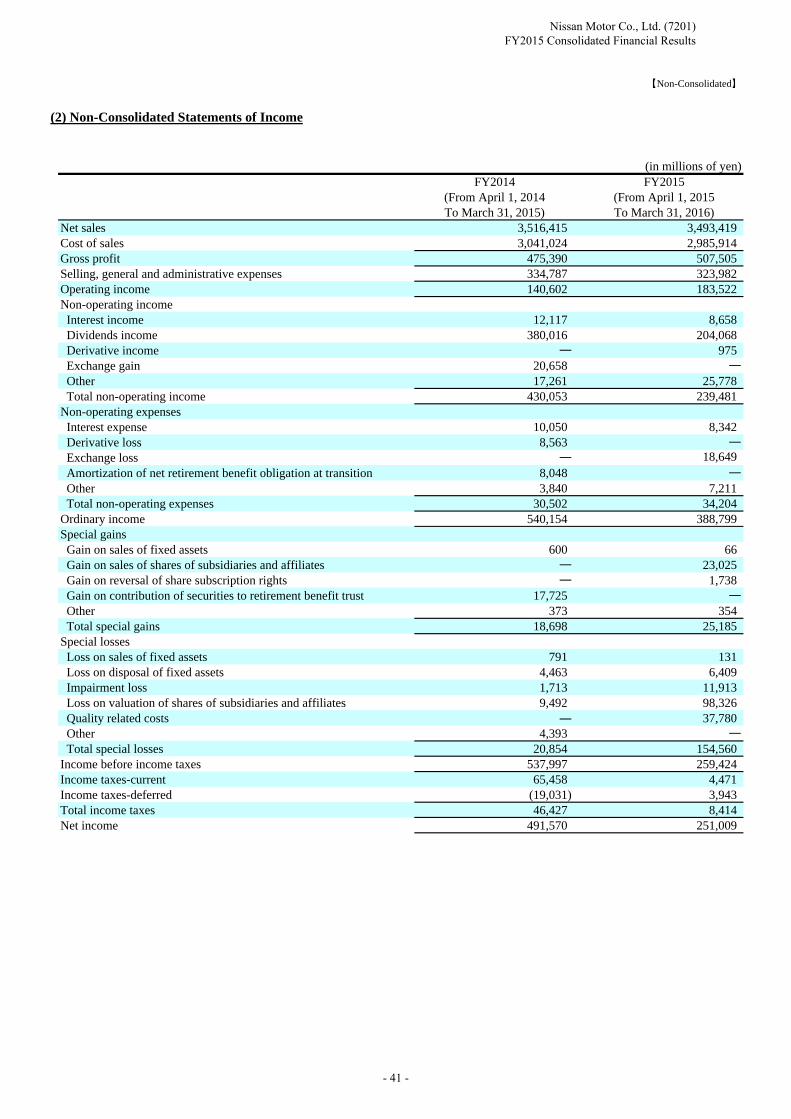
【Non-Consolidated】
(2) Non-Consolidated Statements of Income
(in millions of yen)FY2014 FY2015
(From April 1, 2014 (From April 1, 2015To March 31, 2015) To March 31, 2016)
Net sales 3,516,415 3,493,419Cost of sales 3,041,024 2,985,914Gross profit 475,390 507,505Selling, general and administrative expenses 334,787 323,982Operating income 140,602 183,522Non-operating income Interest income 12,117 8,658 Dividends income 380,016 204,068 Derivative income ― 975 Exchange gain 20,658 ― Other 17,261 25,778 Total non-operating income 430,053 239,481Non-operating expenses Interest expense 10,050 8,342 Derivative loss 8,563 ― Exchange loss ― 18,649 Amortization of net retirement benefit obligation at transition 8,048 ― Other 3,840 7,211 Total non-operating expenses 30,502 34,204Ordinary income 540,154 388,799Special gains Gain on sales of fixed assets 600 66 Gain on sales of shares of subsidiaries and affiliates ― 23,025 Gain on reversal of share subscription rights ― 1,738 Gain on contribution of securities to retirement benefit trust 17,725 ― Other 373 354 Total special gains 18,698 25,185Special losses Loss on sales of fixed assets 791 131 Loss on disposal of fixed assets 4,463 6,409 Impairment loss 1,713 11,913 Loss on valuation of shares of subsidiaries and affiliates 9,492 98,326 Quality related costs ― 37,780 Other 4,393 ― Total special losses 20,854 154,560Income before income taxes 537,997 259,424Income taxes-current 65,458 4,471Income taxes-deferred (19,031) 3,943Total income taxes 46,427 8,414Net income 491,570 251,009
Nissan Motor Co., Ltd. (7201) FY2015 Consolidated Financial Results
- 41 -

【Non-Consolidated】
(3) Non-Consolidated Statements of Changes in Net Assets
FY 2014 (From April 1,2014 To March 31, 2015)(in millions of yen)
605,813 804,470 15 804,485 53,838 59,418 67 578,999 692,324
Cumulative effect of changes in accounting policies (34,578) (34,578)
605,813 804,470 15 804,485 53,838 59,418 67 544,421 657,746
Cash dividends paid (141,432) (141,432)
Provision of reserve for reduction entry of replacedproperties
2,910 (2,910) ―
Reversal of reserve for reduction entry of replacedproperties
(4,054) 4,054 ―
Provision of reserve for special depreciation 5 (5) ―
Reversal of reserve for special depreciation (43) 43 ―
Net income 491,570 491,570
Purchases of treasury stock
Disposal of treasury stock 81 81
Net changes of items other than those inshareholders’ equity
81 81 (1,143) (37) 351,320 350,138
605,813 804,470 96 804,566 53,838 58,274 30 895,741 1,007,884
(31,285) 2,071,337 70,707 (163) 70,543 2,400 2,144,281
Cumulative effect of changes in accounting policies (34,578) (34,578)
(31,285) 2,036,759 70,707 (163) 70,543 2,400 2,109,703
Cash dividends paid (141,432) (141,432)
Provision of reserve for reduction entry of replacedpropertiesReversal of reserve for reduction entry of replacedproperties
Provision of reserve for special depreciation
Reversal of reserve for special depreciation
Net income 491,570 491,570
Purchases of treasury stock (61) (61) (61)
Disposal of treasury stock 644 725 725
Net changes of items other than those inshareholders’ equity
12,503 48 12,551 (107) 12,444
583 350,803 12,503 48 12,551 (107) 363,247
(30,702) 2,387,562 83,210 (115) 83,094 2,293 2,472,951
Changes of items during the period
Shareholders' equity
Commonstock
Capital surplus Retained earnings
Legal capitalsurplus
Other capital surplus
Total capitalsurplus
Legalreserve
Other retained earnings
Totalretainedearnings
Reserve forreduction of
replacement costof specifiedproperties
Reserve forspecial
depreciation
Unappropriatedretained earnings
Balance at the beginning of current period
Restated Balance
Sharesubscription
rights
Totalnet assets
Treasury stockTotal
shareholders'equity
Unrealizedholding gain andloss on securities
Unrealized gainand loss from
hedginginstruments
Balance at the end of current period
Total changes of items during the period
Balance at the end of current period
Shareholders' equity Valuation, translation adjustments and others
Total valuation,translation
adjustments andothers
Balance at the beginning of current period
Restated Balance
Changes of items during the period
Total changes of items during the period
Nissan Motor Co., Ltd. (7201) FY2015 Consolidated Financial Results
- 42 -

【Non-Consolidated】
FY 2015 (From April 1, 2015 To March 31, 2016)(in millions of yen)
605,813 804,470 96 804,566 53,838 58,274 30 895,741 1,007,884
Cash dividends paid (168,396) (168,396)
Provision of reserve for reduction entry of replacedproperties
1,192 (1,192) ―
Reversal of reserve for reduction entry of replacedproperties
(5,388) 5,388 ―
Provision of reserve for special depreciation 12 (12) ―
Reversal of reserve for special depreciation (18) 18 ―
Net income 251,009 251,009
Purchases of treasury stock
Disposal of treasury stock 41 41
Retirement of treasury stock (138) (138) (27,150) (27,150)
Net changes of items other than those inshareholders’ equity
(96) (96) (4,195) (5) 59,663 55,462
605,813 804,470 ― 804,470 53,838 54,078 24 955,404 1,063,347
(30,702) 2,387,562 83,210 (115) 83,094 2,293 2,472,951
Cash dividends paid (168,396) (168,396)
Provision of reserve for reduction entry of replacedpropertiesReversal of reserve for reduction entry of replacedproperties
Provision of reserve for special depreciation
Reversal of reserve for special depreciation
Net income 251,009 251,009
Purchases of treasury stock (28,325) (28,325) (28,325)
Disposal of treasury stock 313 355 355
Retirement of treasury stock 27,289 ―
Net changes of items other than those inshareholders’ equity
(33,842) (976) (34,818) (1,791) (36,610)
(722) 54,643 (33,842) (976) (34,818) (1,791) 18,033
(31,424) 2,442,206 49,368 (1,092) 48,275 502 2,490,984
Balance at the beginning of current period
Changes of items during the period
Total changes of items during the period
Balance at the end of current period
Balance at the end of current period
Shareholders' equity Valuation, translation adjustments and others
Sharesubscription
rights
Totalnet assets
Treasury stockTotal
shareholders'equity
Unrealizedholding gain andloss on securities
Unrealized gainand loss from
hedginginstruments
Total valuation,translation
adjustments andothers
Total changes of items during the period
Shareholders' equity
Commonstock
Capital surplus Retained earnings
Legal capitalsurplus
Other capital surplus
Total capitalsurplus
Legalreserve
Other retained earnings
Totalretainedearnings
Reserve forreduction of
replacement costof specifiedproperties
Reserve forspecial
depreciation
Unappropriatedretained earnings
Balance at the beginning of current period
Changes of items during the period
Nissan Motor Co., Ltd. (7201) FY2015 Consolidated Financial Results
- 43 -

(4) Events and Conditions which indicate there could be Substantial Doubt about Going Concern Assumption
Not applicable.
(5) Changes in Accounting Policies
(6) Additional Information
(7) Significant Subsequent Events
① Issuance of bonds
On April 15, 2016, the Company issued unsecured bonds. The terms and conditions of these bonds are summarized as follows:
(1) 1) Name of the bond 59th unsecured bonds2) Principal amount \80,000 million3) Interest rate 0.150% per annum4) Issue price \100 for a par value of \1005) Maturity date March 19, 20216) Payment due date April 15, 20167) Use of proceeds To be appropriated as redemption funds for bonds and a part of repayment of long-term borrowings due through FY2016
(2) 1) Name of the bond 60th unsecured bonds2) Principal amount \25,000 million3) Interest rate 0.220% per annum4) Issue price \100 for a par value of \1005) Maturity date March 20, 20236) Payment due date April 15, 20167) Use of proceeds To be appropriated as redemption funds for bonds and a part of repayment of long-term borrowings due through FY2016
(3) 1) Name of the bond 61st unsecured bonds2) Principal amount \20,000 million3) Interest rate 0.330% per annum4) Issue price \100 for a par value of \1005) Maturity date March 19, 20266) Payment due date April 15, 20167) Use of proceeds To be appropriated as redemption funds for bonds and a part of repayment of long-term borrowings due through FY2016
ASBJ Statement No. 21, "Revised Accounting Standard for Business combinations" (released on September 13, 2013, hereinafter the "Accounting Standard for Business Combinations"), ASBJ Statement No. 7, "Revised Accounting Standard for Business Divestitures" (released on September 13, 2013, hereinafter the "Accounting Standard for Business Divestitures") and others have been applied effective from the fiscal year ending March 31, 2016. As a result, acquisition related costs are expensed in the year in which the costs are incurred. For any business combination on or after the beginning of the fiscal year ending March 31, 2016, subsequent measurement of the provisional amount recognized based on the purchase price allocation due to the completion of accounting for the business combination is reflected in the financial statements for the period to which the date of that business combination occurs. The aforementioned accounting standards are adopted on or after the beginning of the fiscal year ending March 31, 2016 and thereafter, according to the transitional treatment provided for in Paragraph 58-2 (4) of the Accounting Standard for Business Combination and Paragraph 57-4 (4) of the Accounting Standard for Business Divestitures. The effect of these changes on the current financial statements and the amount per share is none.
ASBJ Guidance No. 26, “Implementation Guidance on Recoverability of Deferred Tax Assets” (released on March 28, 2016) has been early applied to the financial statements relating to the end of the current fiscal year.
Nissan Motor Co., Ltd. (7201) FY2015 Consolidated Financial Results
- 44 -

② Homologation issue caused at vehicles produced by Mitsubishi Motors Corporation
(8) Others
①Vehicle Production (Units)
FY2014 FY2015
(From April 1, 2014To March 31, 2015)
(From April 1, 2015To March 31, 2016)
Units %
Domestic 870,608 849,356 (21,252) (2.4)
②Vehicle Wholesales (Units)
FY2014 FY2015
(From April 1, 2014To March 31, 2015)
(From April 1, 2015To March 31, 2016)
Units %
Total vehicle wholesales 1,140,443 1,071,984 (68,459) (6.0)
Domestic 638,936 581,599 (57,337) (9.0)
Export 501,507 490,385 (11,122) (2.2)
③Net Sales (in millions of yen)
FY2014 FY2015
(From April 1, 2014To March 31, 2015)
(From April 1, 2015To March 31, 2016)
Amount %
Vehicles 2,195,875 2,169,158 (26,716) (1.2)
Domestic 941,669 888,124 (53,545) (5.7)
Export 1,254,205 1,281,033 26,828 2.1
Parts and components
for overseas production 548,745 482,017 (66,727) (12.2)
Domestic ― ― ― ―
Export 548,745 482,017 (66,727) (12.2)
Automotive parts 309,157 306,711 (2,445) (0.8)
Domestic 204,741 203,183 (1,558) (0.8)
Export 104,416 103,528 (887) (0.9)
Other 462,636 535,531 72,894 15.8
Domestic 4,327 4,895 568 13.1
Export 458,308 530,635 72,326 15.8
Total net sales 3,516,415 3,493,419 (22,995) (0.7)
Domestic 1,150,738 1,096,203 (54,534) (4.7)
Export 2,365,676 2,397,216 31,539 1.3
Note: "Other" consists of royalty income and sales of equipment and tools for production.
Change
Change
Change
The Company has suspended sales of DAYZ and DAYZ Roox series of mini-cars produced by Mitsubishi Motors Corporation (MMC) from April 20, 2016. This is a result of MMC’s announcement about the homologation issue for applicable models on the same day. MMC acknowledges its responsibility for the issue and the Company intends to recharge the adverse impact to MMC.However, considering current uncertain situation for the adverse impact on the Company, it is difficult to reasonablyestimate the effects on the Company’s financial position, operating results and cash flows in the current fiscal year and onwards.
Nissan Motor Co., Ltd. (7201) FY2015 Consolidated Financial Results
- 45 -

6. OTHER
(1) Directors and Statutory Auditors Changes
The Company has already announced the changes in directors and statutory auditors on March 9, 2016.
(2) Other
Not applicable.
Nissan Motor Co., Ltd. (7201) FY2015 Consolidated Financial Results
- 46 -
Recommended