PEPFAR
FY 17 PEPFAR Indonesia COP Review COP Approval Session with Amb. Birx
S/GAC Chair: Mamadi Yilla Reviewer: Diana Frymus (USAID)
PEPFAR Interagency Lead: Jonathan Ross
March 2nd, 2017
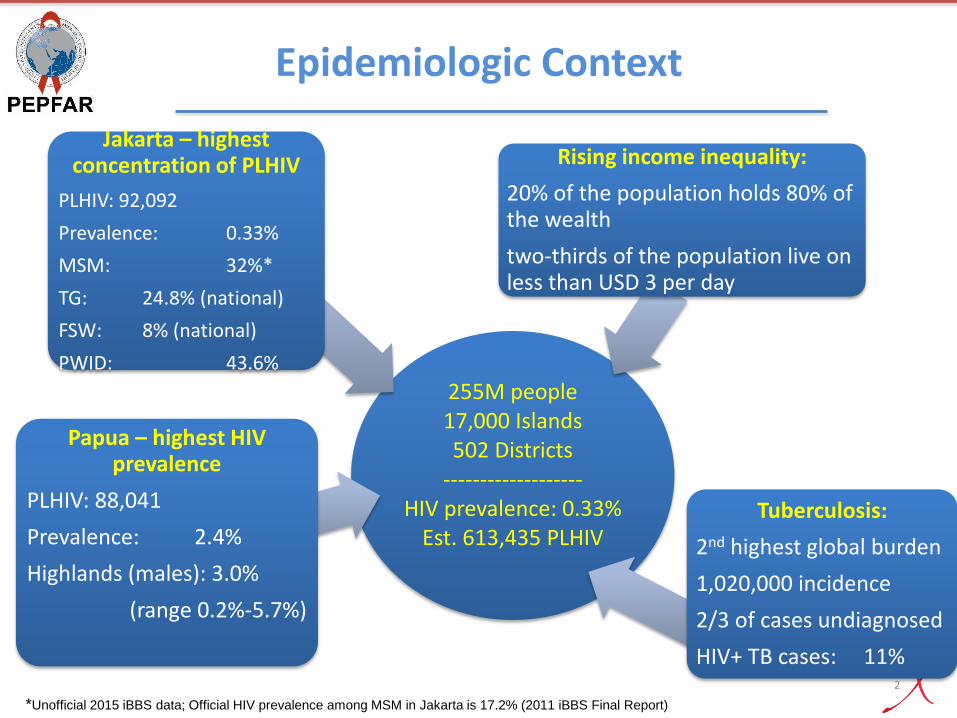
Epidemiologic Context
255M people 17,000 Islands 502 Districts
------------------- HIV prevalence: 0.33%
Est. 613,435 PLHIV
Papua – highest HIV prevalence
PLHIV: 88,041
Prevalence: 2.4%
Highlands (males): 3.0%
(range 0.2%-5.7%)
Jakarta – highest concentration of PLHIV
PLHIV: 92,092
Prevalence: 0.33%
MSM: 32%*
TG: 24.8% (national)
FSW: 8% (national)
PWID: 43.6%
Rising income inequality:
20% of the population holds 80% of the wealth
two-thirds of the population live on less than USD 3 per day
Tuberculosis:
2nd highest global burden
1,020,000 incidence
2/3 of cases undiagnosed
HIV+ TB cases: 11% 2
*Unofficial 2015 iBBS data; Official HIV prevalence among MSM in Jakarta is 17.2% (2011 iBBS Final Report)
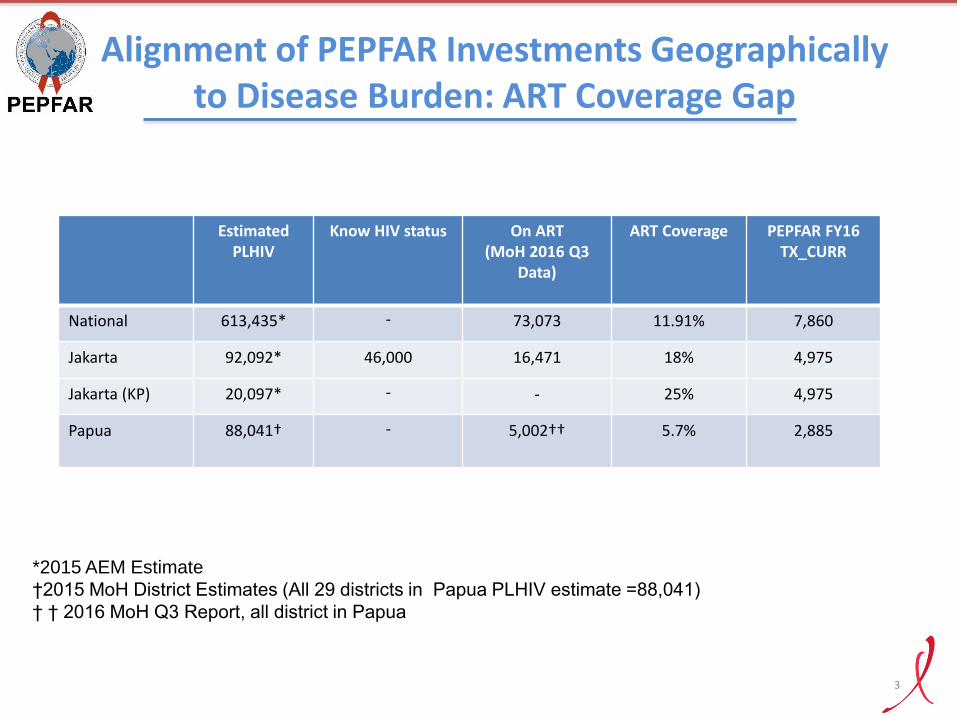
Alignment of PEPFAR Investments Geographically to Disease Burden: ART Coverage Gap
Estimated
PLHIV Know HIV status On ART
(MoH 2016 Q3 Data)
ART Coverage PEPFAR FY16 TX_CURR
National 613,435* - 73,073 11.91% 7,860
Jakarta 92,092* 46,000 16,471 18% 4,975
Jakarta (KP) 20,097* - - 25% 4,975
Papua 88,041† - 5,002†† 5.7% 2,885
*2015 AEM Estimate
†2015 MoH District Estimates (All 29 districts in Papua PLHIV estimate =88,041)
† † 2016 MoH Q3 Report, all district in Papua
3
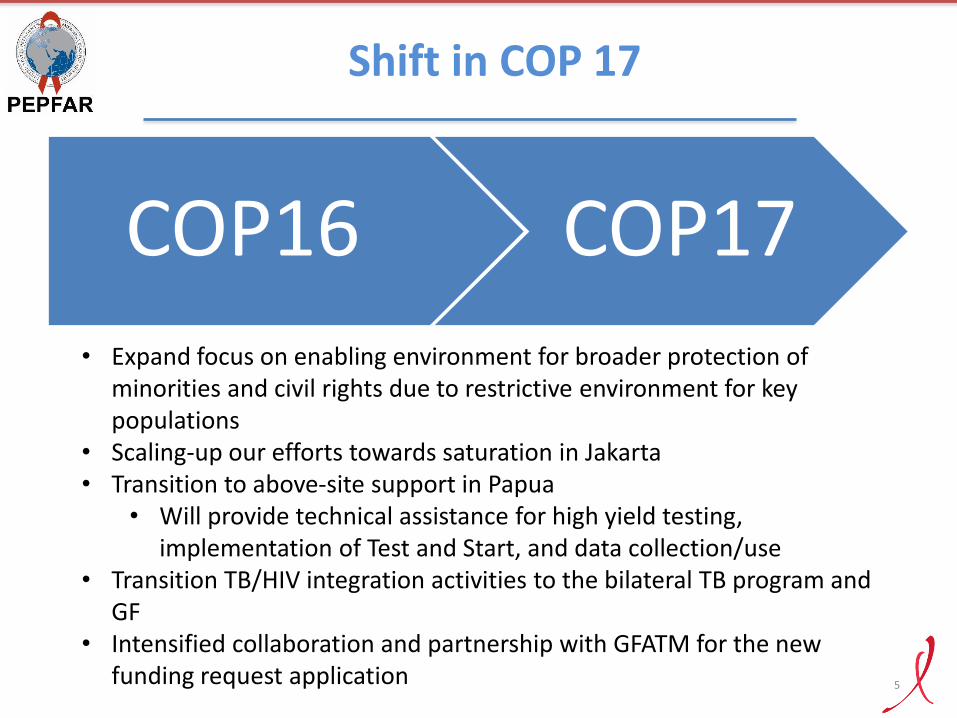
COP16 COP17
• Expand focus on enabling environment for broader protection of minorities and civil rights due to restrictive environment for key populations
• Scaling-up our efforts towards saturation in Jakarta • Transition to above-site support in Papua
• Will provide technical assistance for high yield testing, implementation of Test and Start, and data collection/use
• Transition TB/HIV integration activities to the bilateral TB program and GF
• Intensified collaboration and partnership with GFATM for the new funding request application
Shift in COP 17
5
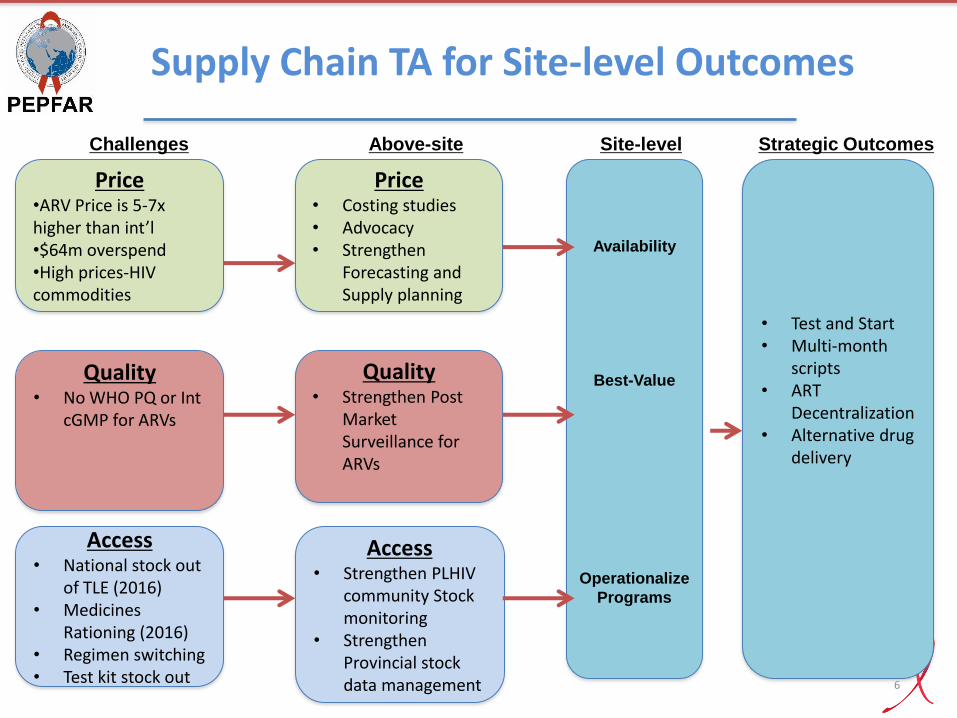
Supply Chain TA for Site-level Outcomes
Price •ARV Price is 5-7x higher than int’l •$64m overspend •High prices-HIV commodities
Quality • No WHO PQ or Int
cGMP for ARVs
Access • National stock out
of TLE (2016) • Medicines
Rationing (2016) • Regimen switching • Test kit stock out
Price • Costing studies • Advocacy • Strengthen
Forecasting and Supply planning
Quality • Strengthen Post
Market Surveillance for ARVs
Access • Strengthen PLHIV
community Stock monitoring
• Strengthen Provincial stock data management
• Test and Start • Multi-month
scripts • ART
Decentralization • Alternative drug
delivery
Challenges Above-site Site-level Strategic Outcomes
Availability
Best-Value
Operationalize
Programs
6
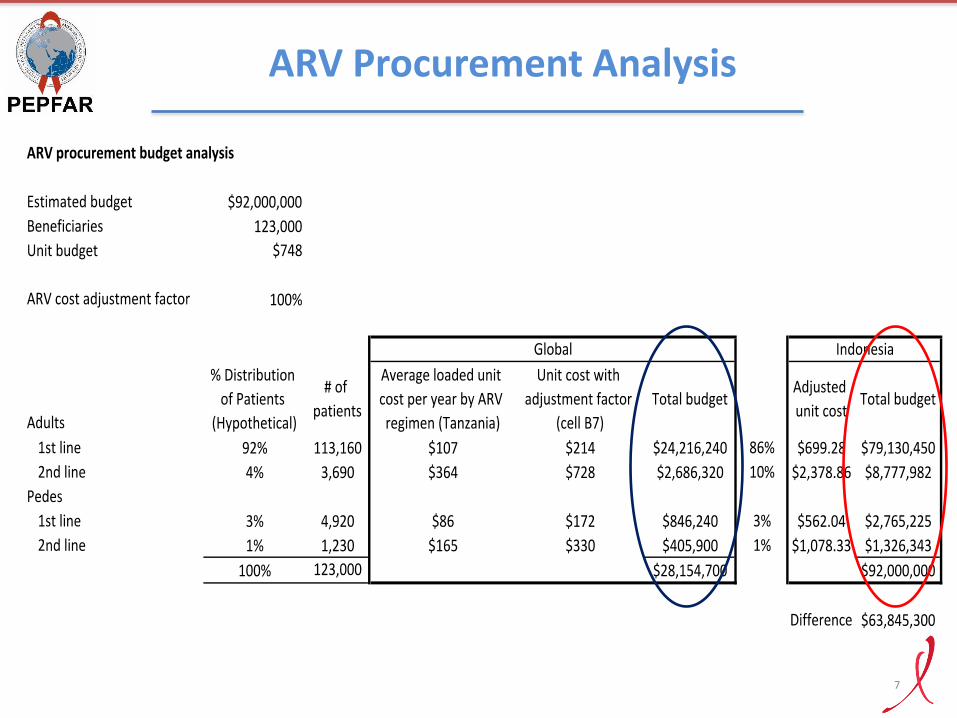
ARV Procurement Analysis
7
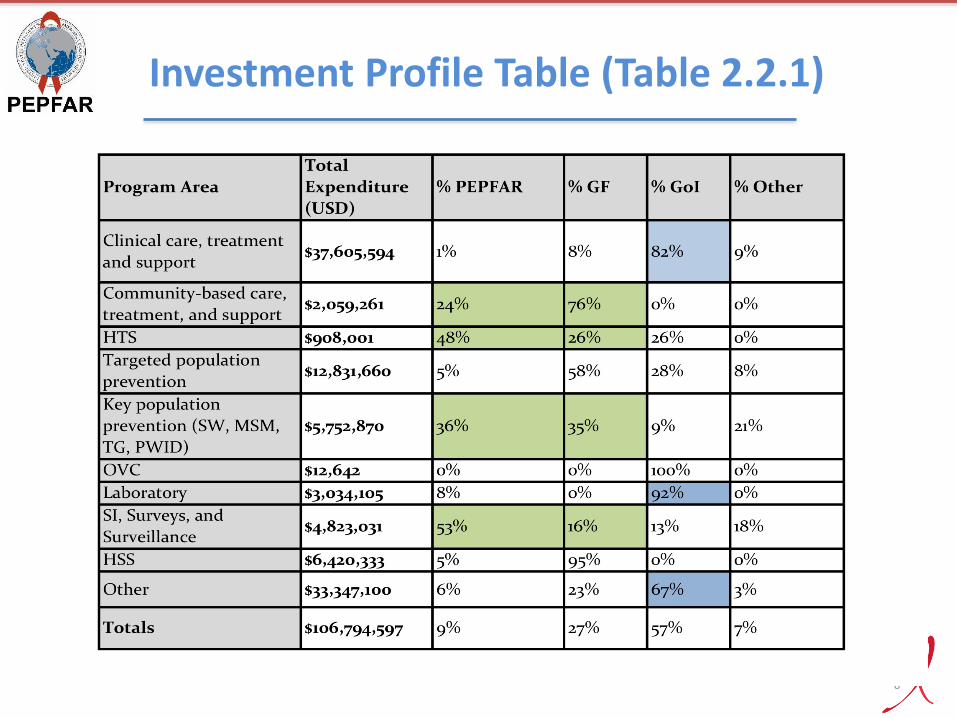
Investment Profile Table (Table 2.2.1)
8
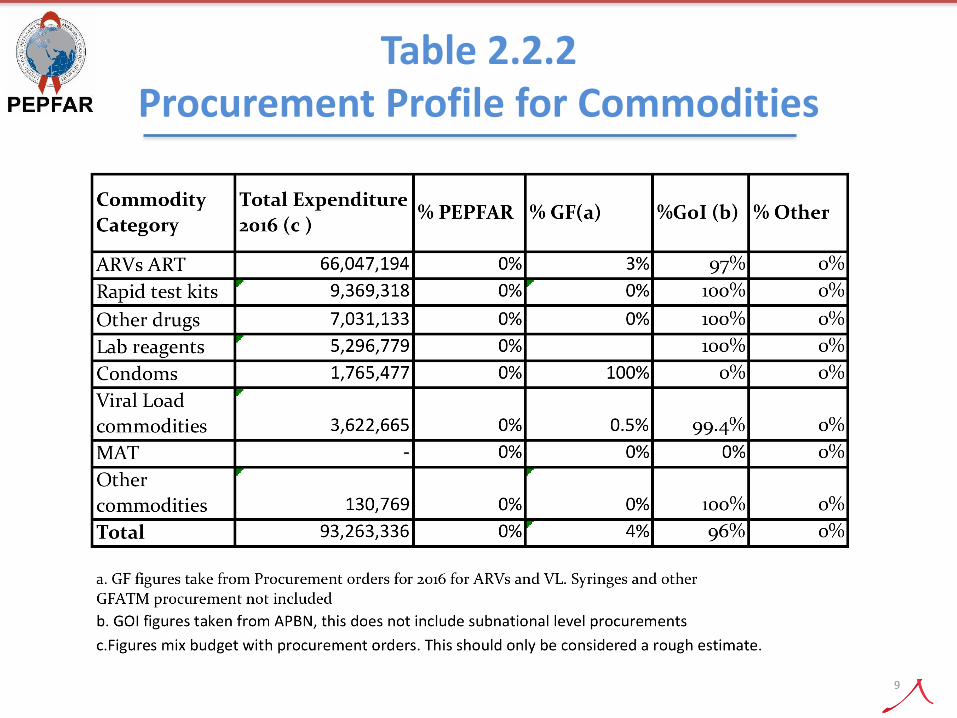
Table 2.2.2 Procurement Profile for Commodities
9
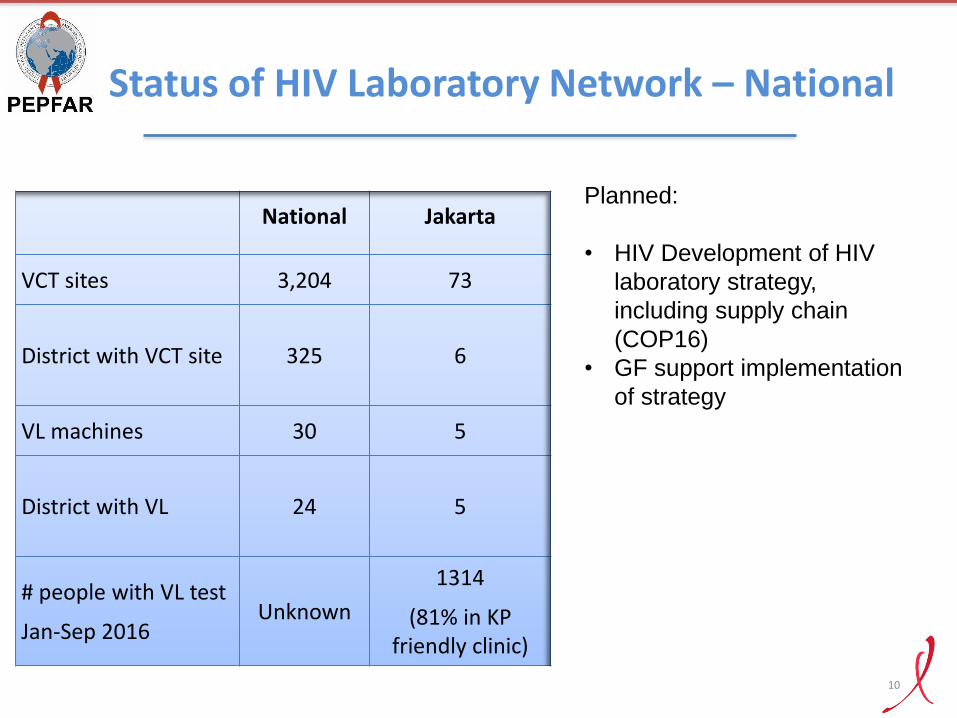
National Jakarta
VCT sites 3,204 73
District with VCT site 325 6
VL machines 30 5
District with VL 24 5
# people with VL test
Jan-Sep 2016 Unknown
1314
(81% in KP friendly clinic)
Status of HIV Laboratory Network – National
Planned:
• HIV Development of HIV
laboratory strategy,
including supply chain
(COP16)
• GF support implementation
of strategy
10
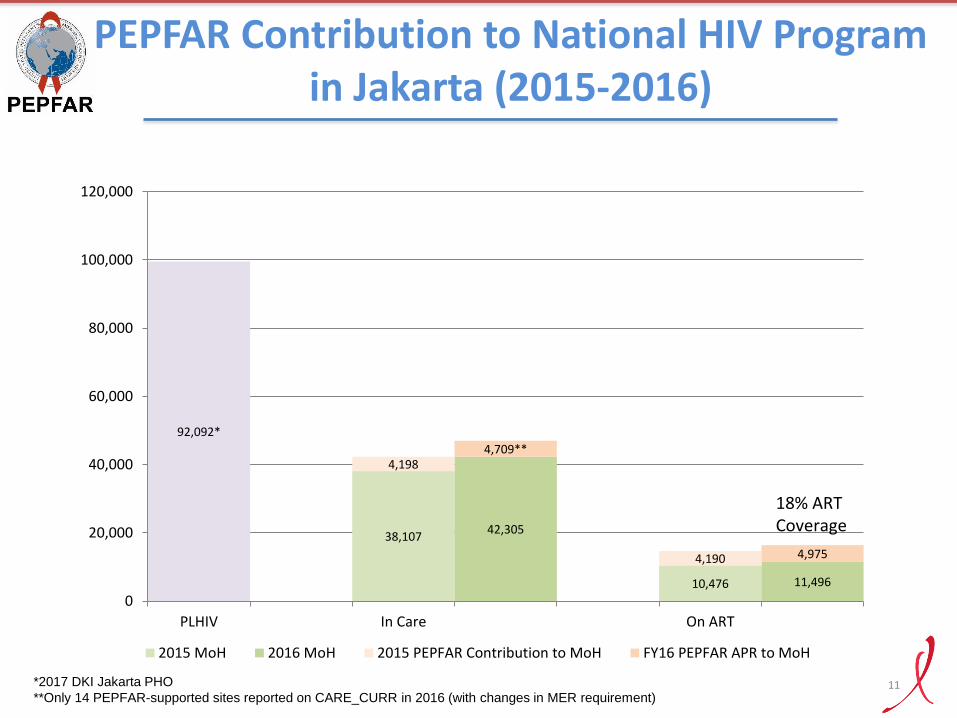
PEPFAR Contribution to National HIV Program in Jakarta (2015-2016)
92,092*
38,107
10,476
42,305
11,496
4,198
4,190
4,709**
4,975
0
20,000
40,000
60,000
80,000
100,000
120,000
PLHIV In Care On ART
2015 MoH 2016 MoH 2015 PEPFAR Contribution to MoH FY16 PEPFAR APR to MoH
18% ART Coverage
11 *2017 DKI Jakarta PHO
**Only 14 PEPFAR-supported sites reported on CARE_CURR in 2016 (with changes in MER requirement)
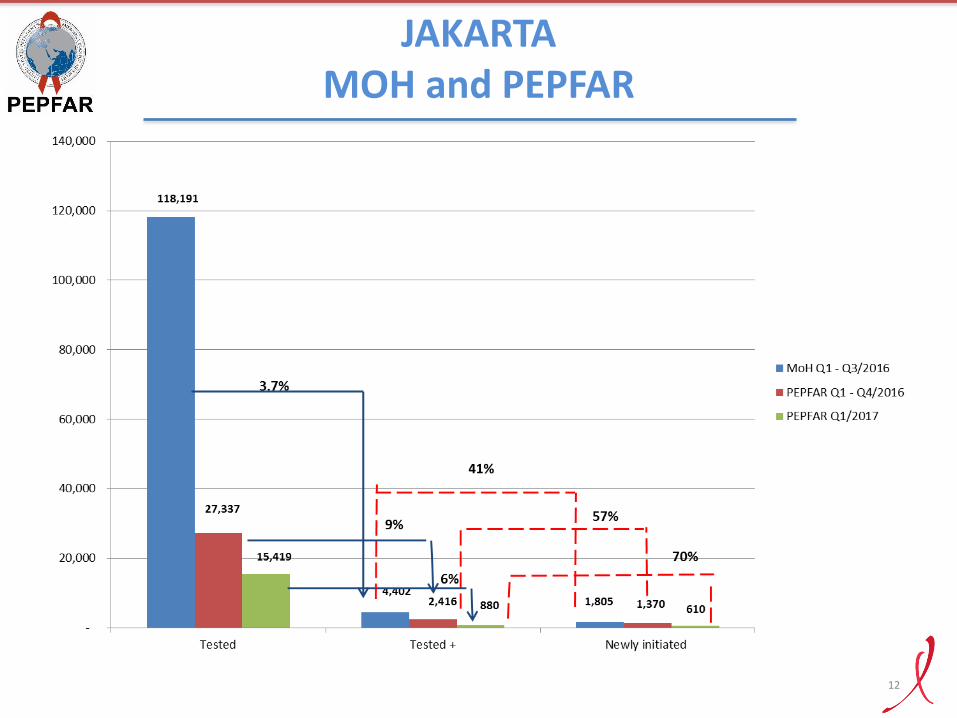
JAKARTA MOH and PEPFAR
41%
12
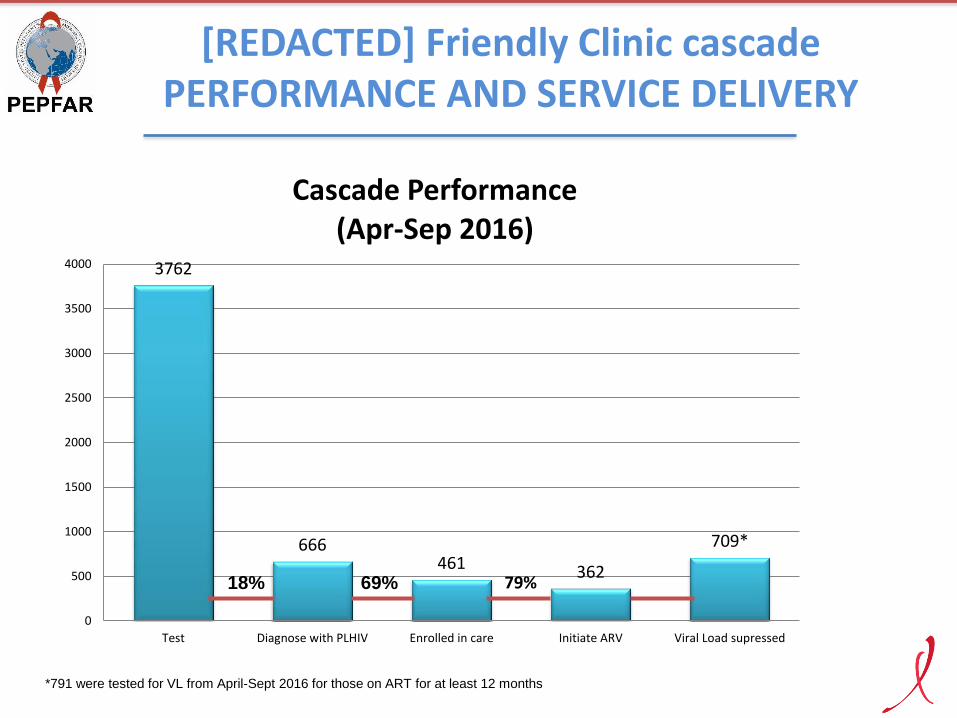
[REDACTED] Friendly Clinic cascade PERFORMANCE AND SERVICE DELIVERY
3762
666 461 362
709*
0
500
1000
1500
2000
2500
3000
3500
4000
Test Diagnose with PLHIV Enrolled in care Initiate ARV Viral Load supressed
Cascade Performance (Apr-Sep 2016)
69% 79% 18%
*791 were tested for VL from April-Sept 2016 for those on ART for at least 12 months
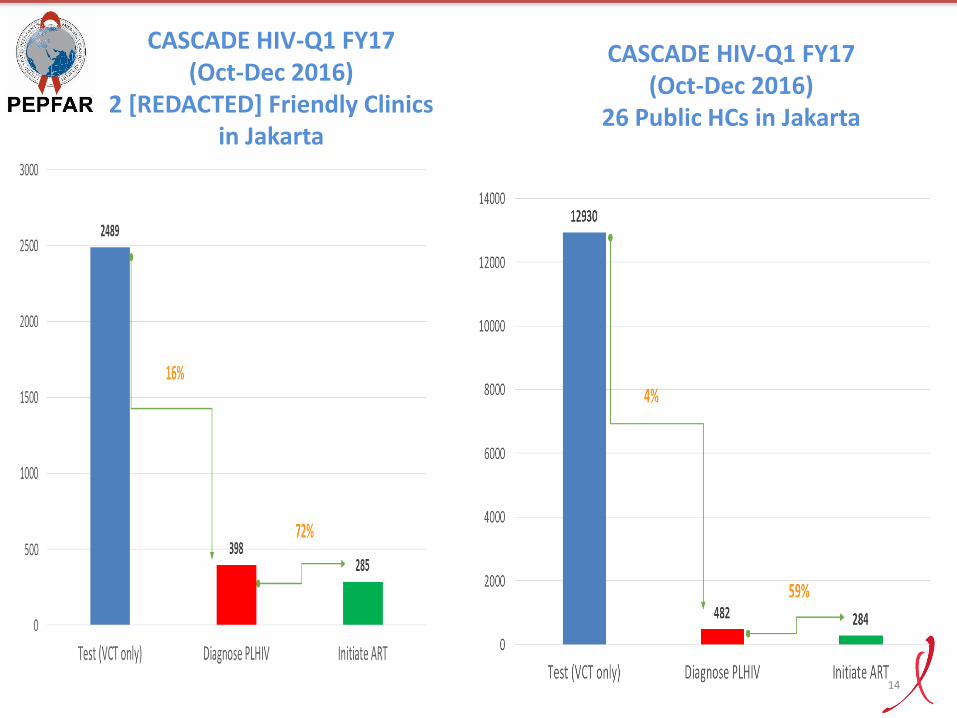
CASCADE HIV-Q1 FY17 (Oct-Dec 2016)
26 Public HCs in Jakarta
CASCADE HIV-Q1 FY17 (Oct-Dec 2016)
2 [REDACTED] Friendly Clinics in Jakarta
14

[REDACTED]
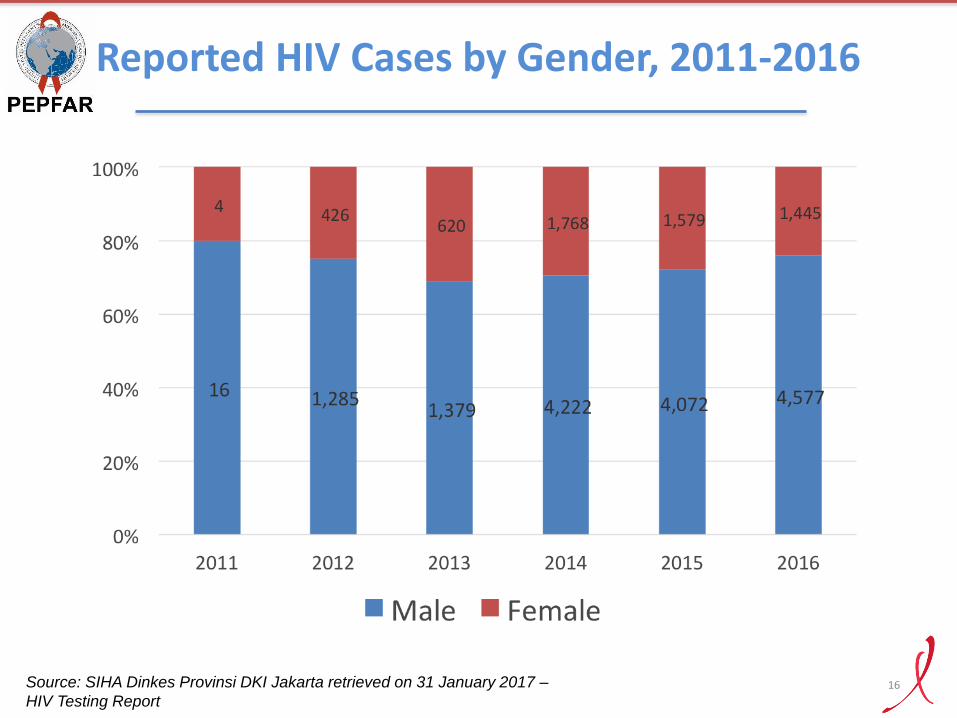
Reported HIV Cases by Gender, 2011-2016
Source: SIHA Dinkes Provinsi DKI Jakarta retrieved on 31 January 2017 –
HIV Testing Report 16
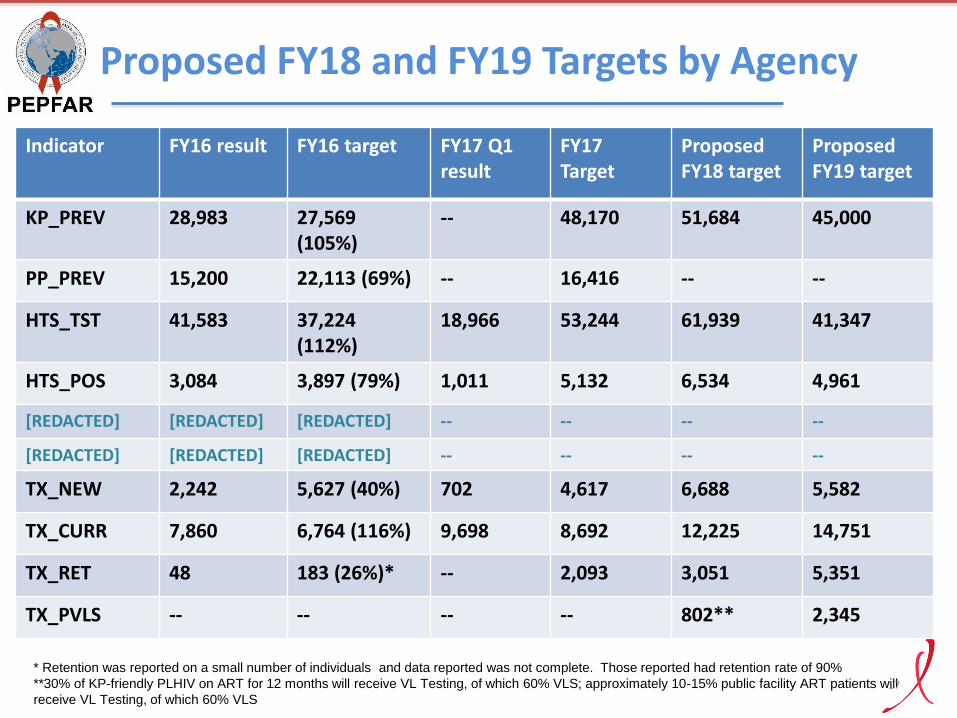
Proposed FY18 and FY19 Targets by Agency
Indicator FY16 result FY16 target FY17 Q1 result
FY17 Target
Proposed FY18 target
Proposed FY19 target
KP_PREV 28,983 27,569 (105%)
-- 48,170 51,684 45,000
PP_PREV 15,200 22,113 (69%) -- 16,416 -- --
HTS_TST 41,583 37,224 (112%)
18,966 53,244 61,939 41,347
HTS_POS 3,084 3,897 (79%) 1,011 5,132 6,534 4,961
[REDACTED] [REDACTED] [REDACTED] -- -- -- --
[REDACTED] [REDACTED] [REDACTED] -- -- -- --
TX_NEW 2,242 5,627 (40%) 702 4,617 6,688 5,582
TX_CURR 7,860 6,764 (116%) 9,698 8,692 12,225 14,751
TX_RET 48 183 (26%)* -- 2,093 3,051 5,351
TX_PVLS -- -- -- -- 802** 2,345
* Retention was reported on a small number of individuals and data reported was not complete. Those reported had retention rate of 90%
**30% of KP-friendly PLHIV on ART for 12 months will receive VL Testing, of which 60% VLS; approximately 10-15% public facility ART patients will
receive VL Testing, of which 60% VLS 17
Partner Performance
• Data Informed Programming
• Performance Dashboard review (clinical cascade review)
• Differentiated service delivery
• Quarterly review
• In-depth performance discussion before and after POART
• Performance Indicators and Performance Monitoring Plan in development for above-site activities
18
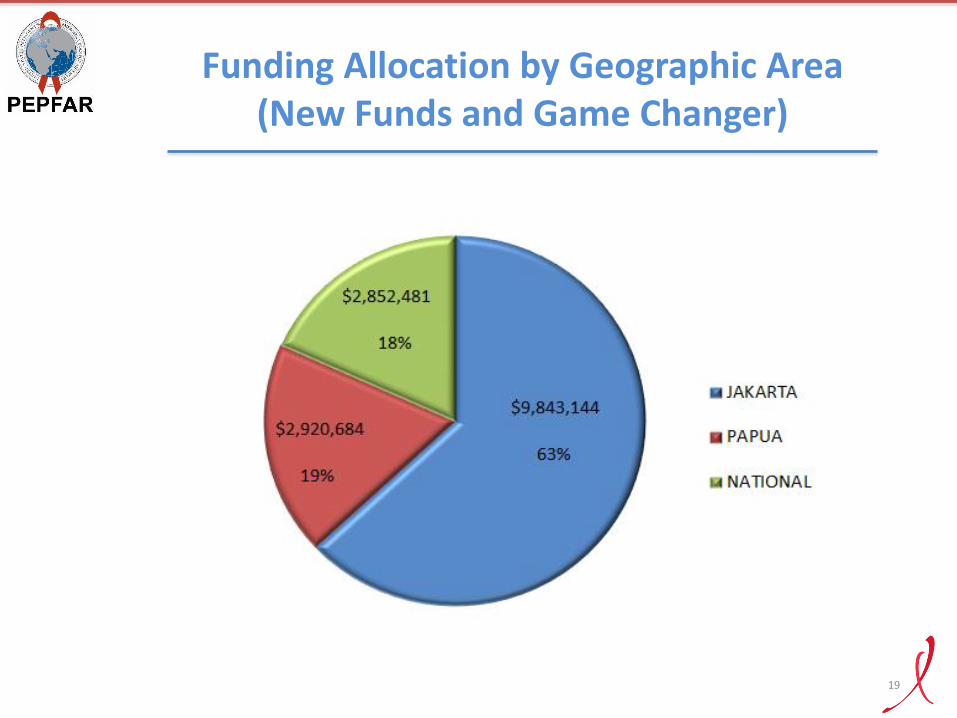
Funding Allocation by Geographic Area (New Funds and Game Changer)
19
20
[REDACTED]
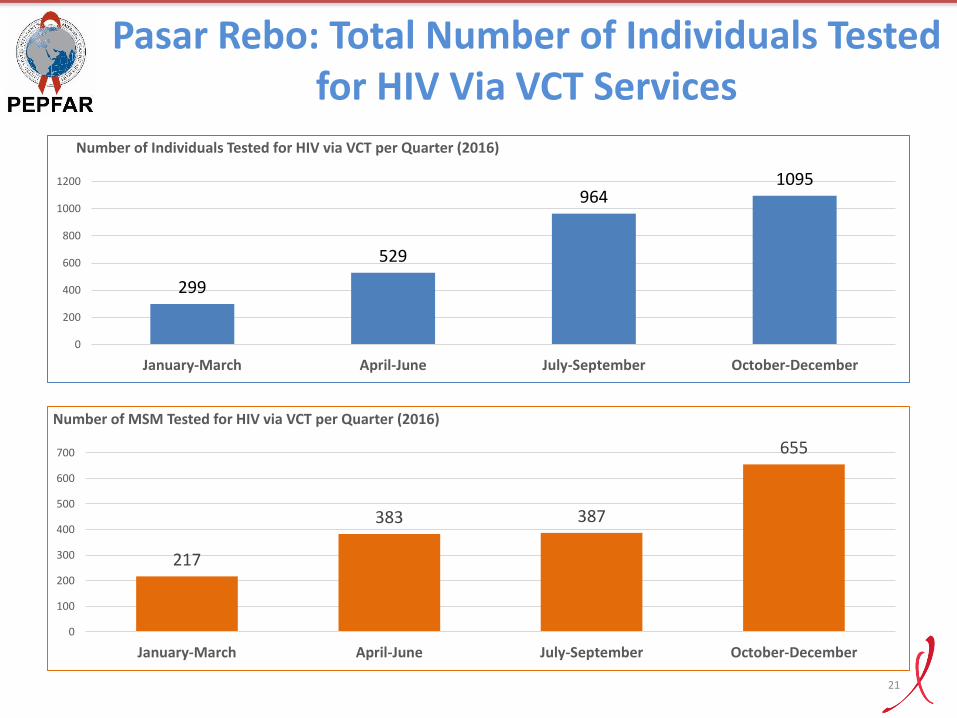
Pasar Rebo: Total Number of Individuals Tested for HIV Via VCT Services
299
529
964 1095
0
200
400
600
800
1000
1200
January-March April-June July-September October-December
Number of Individuals Tested for HIV via VCT per Quarter (2016)
217
383 387
655
0
100
200
300
400
500
600
700
January-March April-June July-September October-December
Number of MSM Tested for HIV via VCT per Quarter (2016)
21
Puskesmas (PHC) Pasar Rebo
• Providing TA and mentoring including:
Improvement Health worker skills; health equipment; information system; viral load testing
• Extended hours
Fix time : Friday (17-21); Saturday (08-16); Sunday (08-16)
Flexible time : for mobile testing
• Around 25 % of total HCT result through extra hours
• Around 50 % increased in Q4 compared to Q3 at 2016
22

Looking ahead
• Broader application to increase access for all key populations
• Expansion of the community friendly services
• Expand social media outreach to KP especially and broader application
• Community based testing
• Viral load
23
Recommended